Article

Accurate Recognition of Building Rooftops and Assessment of Long-Term Carbon Emission Reduction from Rooftop Solar Photovoltaic Systems Fusing GF-2 and Multi-Source Data

1
Faculty of Information Technology, Beijing University of Technology, Chaoyang District, Beijing 100124, China
2
Department of Big Data Analysis, PLA Strategic Force Information Engineering University, Zhengzhou 450001, China
3
Department of Information Engineering and Computer Science, University of Trento, 38123 Trento, Italy
4
Beijing Big Data Centre, Chaoyang District, Beijing 100101, China
5
International Research Center of Big Data for Sustainable Development Goals, Beijing 100094, China
6
Key Laboratory of Digital Earth Science, Aerospace Information Research Institute, Chinese Academy of Sciences, Beijing 100094, China
7
State Key Laboratory of Remote Sensing Science, Aerospace Information Research Institute, Chinese Academy of Sciences, Beijing 100094, China
8
National Railway Track Test Center, China Academy of Railway Sciences Corporation Limited (CARS), Engineer, Jiuxiaoqiao North Road, Chaoyang District, Beijing 100015, China
*
Author to whom correspondence should be addressed.
Remote Sens. 2022, 14(13), 3144; https://0-doi-org.brum.beds.ac.uk/10.3390/rs14133144
Submission received: 24 May 2022 / Revised: 18 June 2022 / Accepted: 27 June 2022 / Published: 30 June 2022
(This article belongs to the Special Issue Remote Sensing Image and Urban Information Visualization)

Abstract

:
Rooftop solar photovoltaic (PV) retrofitting can greatly reduce the emissions of greenhouse gases, thus contributing to carbon neutrality. Effective assessment of carbon emission reduction has become an urgent challenge for the government and for business enterprises. In this study, we propose a method to assess accurately the potential reduction of long-term carbon emission by installing solar PV on rooftops. This is achieved using the joint action of GF-2 satellite images, Point of Interest (POI) data, and meteorological data. Firstly, we introduce a building extraction method that extends the DeepLabv3+ by fusing the contextual information of building rooftops in GF-2 images through multi-sensory fields. Secondly, a ridgeline detection algorithm for rooftop classification is proposed, based on the Hough transform and Canny edge detection. POI semantic information is used to calculate the usable area under different subsidy policies. Finally, a multilayer perceptron (MLP) is constructed for long-term PV electricity generation series with regional meteorological data, and carbon emission reduction is estimated for three scenarios: the best, the general, and the worst. Experiments were conducted with GF-2 satellite images collected in Daxing District, Beijing, China in 2021. Final results showed that: (1) The building rooftop recognition method achieved overall accuracy of 95.56%; (2) The best, the general and the worst amount of annual carbon emission reductions in the study area were 7,705,100 tons, 6,031,400 tons, and 632,300 tons, respectively; (3) Multi-source data, such as POIs and climate factors play an indispensable role for long-term estimation of carbon emission reduction. The method and conclusions provide a feasible approach for quantitative assessment of carbon reduction and policy evaluation.

Graphical Abstract

1. Introduction

At present, the primary energy sources globally are non-renewables including coal, oil, and natural gas. With global economic growth, energy demand continues to increase. Huge energy consumption reduces the availability of non-renewable energy, and the energy crisis has become one of the major problems plaguing the world [1]. In addition, the exploitation of fossil energy is a key factor in global environmental change and pollution, bringing serious ecological and environmental problems such as the greenhouse effect and global warming [1,2]. Among new energy types including wind, solar, tidal, and biomass power, solar can be considered a key solution for relieving environmental climate change [2]. As a representative technology for solar energy conversion, solar photovoltaic systems (photovoltaics, PV) already demonstrate competitive performance in terms of energy payback time (EPBT), greenhouse gas (GHG), and levelized cost of energy (LCOE) compared with conventional energy sources [3].
Retrofitting distributed rooftops with solar PV is an effective means of promoting “carbon peaking” and “carbon neutral” strategies. Rooftop solar PV is geographically unrestricted. The PV cells can be closely integrated into buildings without taking up additional land resources, not only saving land resources but also improving their utilization rate. In addition, the importance of large-scale PV development has been emphasized in the national renewable energy development plan [4]. Therefore, accurate assessment of long-time-series carbon emission reductions due to rooftop solar PV has become an important research topic.
The current estimation methods for long-term carbon emission reduction due to rooftop solar PV are still relatively crude due to the influence of building identification accuracy, building rooftop types (e.g., terrace rooftop, pitched rooftop), local subsidy policies, PV installation processes, and local climate conditions. The challenges can be summarized as follows:
(1)
Recognition of building rooftops in complex scenes. In recent years, high-resolution remote sensing images have provided a large variety surface features and rich spatial information for building rooftop recognition [5,6,7]. However, influenced by small targets, multiple sizes, multiple morphologies, and different types of building rooftops, the accuracy of building rooftop recognition is relatively low, with inferior image segmentation [8,9,10,11]. Multi-scale feature information hidden in high-resolution remote sensing images is not fully explored [12,13,14,15,16,17]. How to better extract and fuse multi-level features has become the focus of current research [18,19,20,21];
(2)
Estimation of the actual usable area of rooftop solar PV systems, which is affected by multiple factors. First, high-resolution remote sensing images (e.g., GF-2, Sentinel 2, etc.) generally discard building elevation information due to economic and data volume considerations [22]; Second, different PV installations and rooftop types make the classification of rooftops and the estimation of actual usable area a real challenge [23]; Finally, different local subsidy policies can lead to various practical implementations of rooftop solar PV systems. Existing research relies only on empirical parameters with low calculation accuracy [24,25,26,27];
(3)
Accurate and long-term assessment of the amount of carbon emission reduction. Single or multiple remote sensing images can only reflect a “snapshot” of PV electricity generation for a short period in a given area. Due to the influence of climate conditions and weather factors, atmospheric condition inversion should be considered in the accurate and long-term assessment of carbon emission reduction due to rooftop solar PV [28,29].
To overcome these challenges, the highlights of this study can be summarized as follows:
(1)
In order to solve the problem of insufficient extraction and fusion of multi-scale features in building rooftop recognition, this study employed ResNet-101 [30] as the backbone network of DeepLabv3+, to merge multi-scale contextual information of GF-2 images during the upsampling process in the decoding layer;
(2)
A ridgeline detection algorithm for rooftop classification is proposed based on Hough transform [31] and Canny edge detection [32]. POI semantic information further serves the calculation of the usable area of rooftop solar PV under different subsidy policies.
(3)
Annual solar radiation for PV electricity generation was modeled via multilayer perceptron (MLP) using regional meteorological data. The long-term carbon emission reduction was then derived under three scenarios: the best, the general, and the worst, considering the transformational relation between the standard coal consumption and CO2 emission factors.
The rest of this study is organized as follows: Section 2 introduces related works; Section 3 presents the methodology; Section 4 describes the experiments; Section 5 discusses the overall process of estimating long-term carbon emission reduction; Section 6 summarizes the conclusions and indicates future work.

2. Related Works

2.1. Building Rooftop Recognition from Remote Sensing Images

Previous works on building rooftop extraction and recognition in high-resolution remote sensing images can be divided into two categories: artificial-feature-based methods and deep-learning-based methods [33]. The former have mainly utilized geometric, spectral, and background information about building rooftops. Lin and Nevatia [34] proposed an edge detection algorithm to extract building rooftops by detecting their walls and shadows. Zhang et al. [35] extracted the appearance of the external morphological boundaries of building rooftops based on the geometric linear relationship features after edge detection to improve the accuracy of recognition. Katartzis et al. [36] combined edge detection with the Markov model and employed aerial images to extract building rooftops. However, the edge detection method is susceptible to the influence of features similar to building morphology, resulting in building rooftop identification errors. Andres et al. [37] developed a threshold determination method based on the K-means algorithm to classify and identify building rooftops in remote sensing images, with a significant reduction in segmentation errors. Liu et al. [38] put forward a novel integrated classification method using a Support Vector Machine (SVM) and Decision Tree (DT), combining spectral transform and geographic location information for building rooftop recognition. Most of the methods mentioned above are based on spectral feature difference analysis, which can easily confuse similar features during recognition [39].
The latter group are deep-learning models that construct feature space automatically from high-resolution remote sensing images. These methods, especially Fully Convolutional Networks (FCNs) [12], introduce Convolutional Neural Network (CNN) structures to the image semantic domain, and have been widely used in recent years [40,41,42]. Liu et al. [43] proposed a new FCN structure consisting of a spatial residual convolution module for extracting building rooftops from remote sensing images, known as spatial residual onset. Shariah et al. [44] rewrote FCN without a pooling layer so that the network could retain as much important and useful information from the original image as possible. Ding et al. [45] proposed an adversarial method to consider the rectangular shape of buildings while performing building extraction. Although FCN-based methods have shown good performance in building rooftop extraction, such methods are not capable of ulteriorly fusing multi-scale feature information, due to the diverse patterns of buildings rooftops [46]. New network structures such as the Global Multiscale Codec Network (GMEDN) [47], U-shaped hollow pyramid pooling (USPP) networks [16], and Atrous Spatial Pyramid Pooling (ASPP) [48] may alleviate this problem in FCNs, but the object boundaries remain blurred and not continuous.
The DeepLabv3+ network [49] adds the encoder-decoder structure based on an ASPP module to make full use of multi-scale feature information, paving a new direction for building rooftop recognition from high-resolution remote sensing images.

2.2. The Actual Usable Area of Rooftop Solar PV Systems

The methods for estimating the actual usable area of rooftop solar PV systems can be broadly classified into three categories: fixed-value methods, manual intervention methods, and GIS-based methods [50].
The advantage of fixed-value methods is that the calculations are fast. For example, Vardimon [24] applied a constant value of 30% to calculate usable rooftop areas in Israel. However, the result was imprecise because the actual factors of influence were not considered. Manual intervention methods make assumptions based on empirical utilization factors [21,51]. Izquierdo et al. [52] estimated the available rooftop solar PV potential in Spain by combining information on population, number of buildings and land use with various coefficients (e.g., shading), although this method lacks generality. GIS-based methods can take more roof details into account, including 3D information from LiDAR, slope, orientation, and building structures [53,54,55]. However, high-resolution remote sensing images (e.g., GF-2, Sentinel 2, etc.) generally discard building elevation information for reasons of economics and data volume [22]. Moreover, different local subsidy policies can lead to various practical implementations of rooftop solar PV systems, an aspect which has been neglected in most existing research [56]. Table 1 summarizes the different PV policies implemented in different regions in China.
Finally, different PV installation features (e.g., the installation inclination, the spacing of the arrays, etc.) directly affect the efficiency of the PV panel system. Two popular PV panel mounting installation methods are shown in Figure 1.

2.3. Rooftop Solar PV Potential Assessment
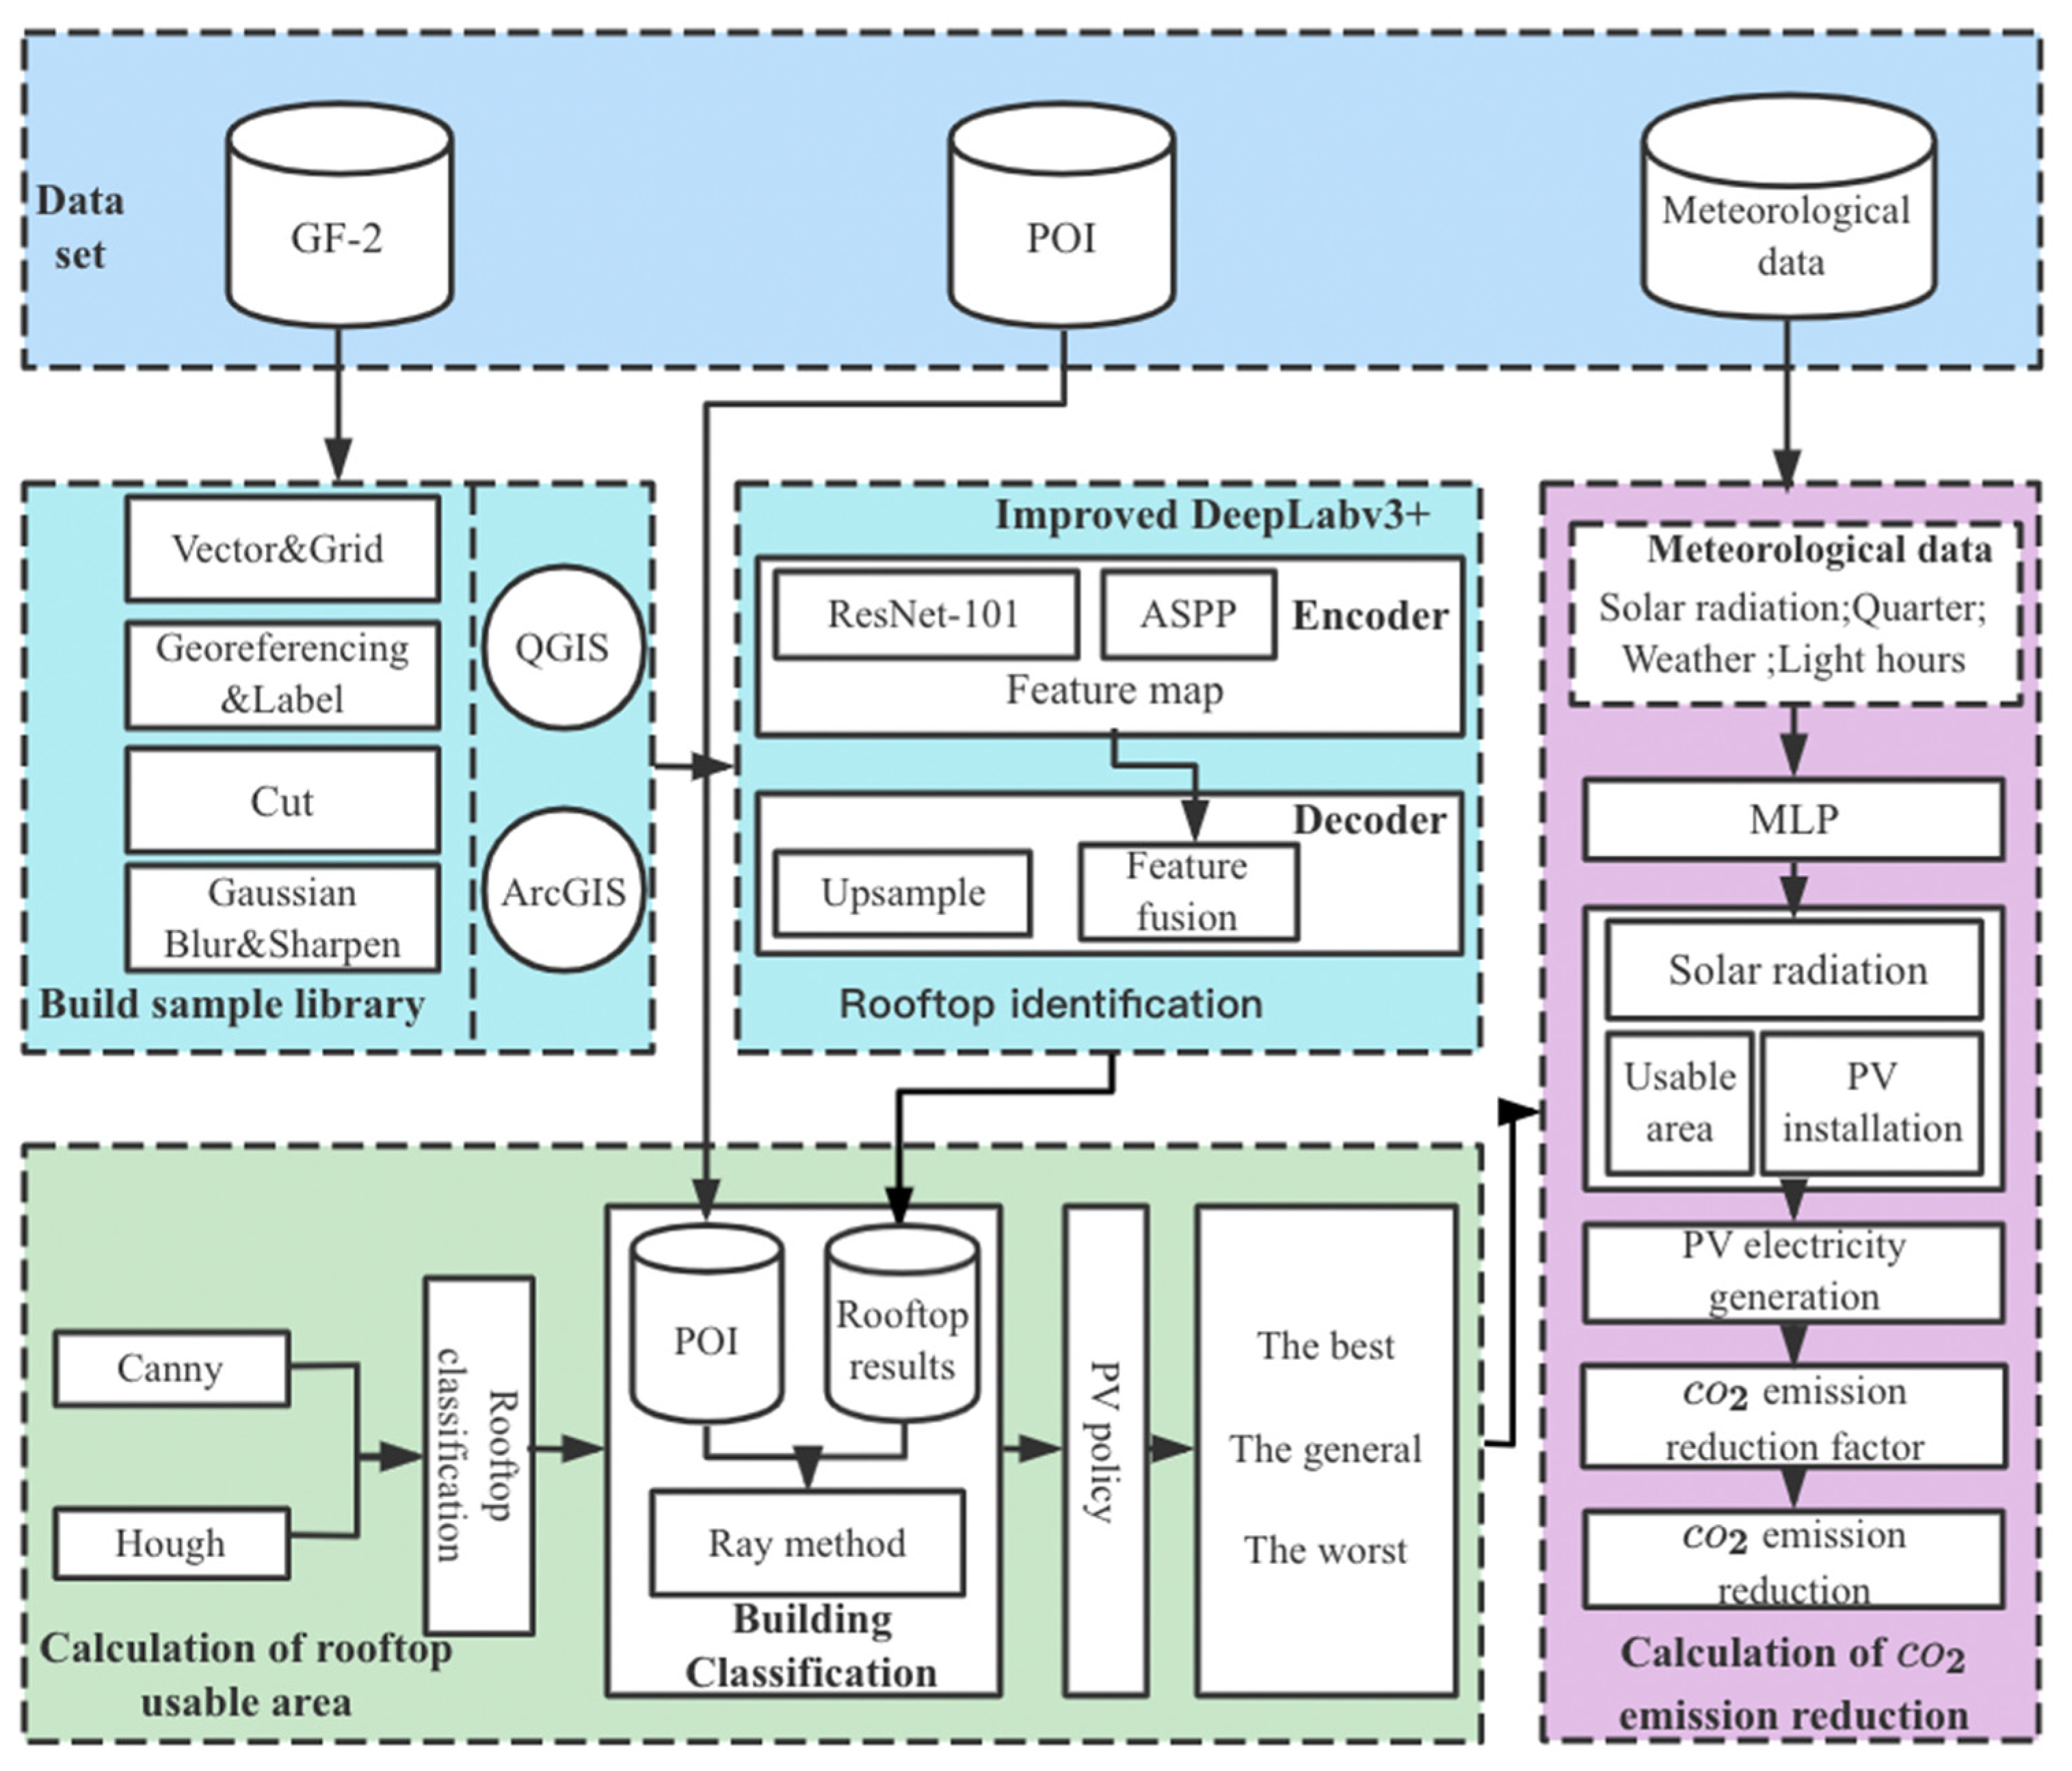
To accurately assess carbon emission reduction due to rooftop solar PVs, a popular large-scale PV electricity generation assessment model, PVWatts, is relatively simple and free to operate [57]. PVWatts uses data from the National Solar Radiation Database and can estimate annual and monthly electricity generation based on location, basic parameters, etc. Sampath [58] et al. applied this model to estimate rooftop solar PV capacity in Bangalore, India based on remote sensing image segmentation, which has the advantages of being fast and low cost, but the estimation process was carried out under standard experimental conditions. Tang et al. [59] employed PVsyst software to simulate the PV electricity generation of different solar cells in Chongqing. Wang et al. [60] considered different PV systems and conversion efficiencies in their assessment of PV electricity generation in China. However, most of these studies ignored the effect of weather conditions on the amount of solar radiation, which in turn affects the volume of rooftop solar PV electricity generation. Kais et al. [61] proposed a climate-based PV electricity generation assessment model using global meteorological data MERRA to assess the PV potential in the Association of Southeast Asian Nations (ASEAN). The results confirm the geographical correlation between climate and PV electricity generation. However, due to the low resolution of MERRA data, a large amount of valid information was lost, ultimately affecting the accuracy of the evaluation results. In addition, some studies that directly considered climate factors used Global Climate Model (GCM) projections, which do not reliably reflect local climate characteristics [62].

3. Methodology

Here we describe a proposed comprehensive approach that utilizes multi-source data to perform large-scale accurate estimation of potential carbon emission reduction. First, we applied an automatic labeling method to establish a building sample library and to improve DeepLabv3+, in order to complete multi-scale extraction and fusion of context information from high-resolution remote sensing images through image feature extraction and semantic segmentation. On this basis, we employed multi-source data including POI semantic information and meteorological data to quantify comprehensively the impact of building rooftop types, building occupancy types, regional PV subsidy policies, and regional climate characteristics on long-term carbon emission reduction. The general architecture is shown in Figure 2.

3.1. Building Rooftop Recognition

Our study area was a demonstration region for PV retrofitting in Beijing, and currently there are only a few PV installations in this area. Here we omitted the existing PV installations and identified all building rooftops from high resolution remote sensing images.
Due to the small size of building targets, an improved DeepLabv3+ network model was designed to improve the accuracy of the semantic segmentation recognition results. As shown in Figure 3, the DeepLabv3+ network contains an encoding–decoding architecture [63].

3.1.1. Encoder

In the encoder–decoder structure, the encoder is applied to extract the multi-scale features from the input image. In our model, we employed ResNet-101 as the backbone network of the encoder, which was operated by convolution and pooling layers to finally obtain a feature map 1/16 of the original image size. With the help of ASPP, multi-scale contextual information was extracted through the atrous convolution layer. ASPP contains 1 × 1 convolution, atrous convolution with atrous rates of 6, 12, 18, and a global average pooling layer, which can extract multi-scale contextual information and help the whole network to obtain more robust results. The obtained feature map was then convolved by 1 × 1 to reduce the number of channels.

3.1.2. Decoder

The decoder is responsible for recovering the spatial resolution and location information of the image. In the decoding stage, the feature map obtained after the encoding stage was first bilinearly upsampled by a factor of four, and connected with the feature map obtained after 1 × 1 convolution of layer1 in the encoder network. Unlike the original DeepLabv3+, our model adds an operation to fuse the underlying features of the backbone network. The obtained feature map was subjected to 3 × 3 convolution, then double upsampled, and connected to the feature maps generated by layer0 of the backbone network after the 1 × 1 convolution. Finally the feature map was subjected to 3 × 3 convolution and then double upsampled, to obtain more refined recognition and segmentation results.

3.2. Method for Estimating Usable Area of Rooftop PV

The study area was located in Daxing District, Beijing, China, which has a neat distribution of buildings with different rooftop types (i.e., terrace rooftops, pitched rooftops) and different occupancy categories (residential buildings, commercial buildings, public buildings, etc.). Figure 4 shows different rooftops in the study area.

3.2.1. Rooftop Type Classification

Because different rooftops are associated with specific PV installation methods, this study distinguished rooftop types by combining the main direction of the house and the ridgeline determined by Hough transform and Canny edge detection. Figure 5 shows the flow chart of rooftop type classification.
As shown in Figure 5, the image color space was transformed from RGB to HSV, and Canny edge detection was performed on the V component of the luminance channel to obtain the edge of the building roof. Then, the Hough transform was applied to identify the ridge line candidates from the edge. Finally, by obtaining the minimum outer rectan gle of the building, the main direction of the building was defined as the angle between the longest side of the minimum outer rectangle and the x-axis, then the direction of the set of straight lines detected by the Hough transform was judged. The ridgeline was judged by the straight line closest to the main direction of the house; the judgment condition was:
L i l e n L e n     0.6
where Lilen is the length of Li in the set of straight lines {Li} detected by the Hough transform, and Len is the length of the longest edge in the smallest outer rectangle.
If the above judging conditions were met, the ridgeline was detected and the rooftop type was categorized.

3.2.2. Building Occupancy Classification with POIs

According to regional policies related to PV installation, buildings are treated differently based on their usage. Public and commercial buildings, such as schools, hospitals, shopping malls, large enterprises, and parks, are required to install PV stations compulsorily. Individual houses can be voluntarily put forward for PV retrofitting depending on different local subsidy policies. POI data provide a feasible means to identify real building occupancies. Three major building occupancy categories, including public, commercial and residential buildings [64], are listed in Table 2.
POI data was crawled from Baidu Map [65] in json format, then parsed to obtain semantic information such as ID, longitude and latitude coordinates, address, name, category, etc. Boundary coordinate information was also derived from POI data.
Building occupancy categories were identified using a simple ray method. The pixel coordinates of the center point of the building were found by the smallest outer rectangle, and the coordinates of the center point were obtained from the resolution and conversion information from the remote sensing images. Based on the obtained coordinates of the center point and the set of coordinates of the POI boundary vertices, a horizontal ray was drawn from the center point to the right (or left), and the number of intersection points between the ray and each side of the polygon was recorded. If the number of intersection points was odd, the point was inside the polygon, and if even, it was outside the polygon. If the center point was within the polygon formed by the coordinates of the vertices with the POI boundary, the real building occupancy type was identified within the category of POI semantic information. Figure 6 shows the flow chart.

3.2.3. Estimation of Usable Area for Rooftop Solar PV

The calculation of the usable area for rooftop solar PV was based on the building recognition results, rooftop classification results, and building occupancy classification results. The rooftop area attributes were calculated taking into account the resolution of the remote sensing images and the number of recognized building pixels.
Whether the structure of the building can support the PV modules is a very important influencing factor. In this study, according to the statistics of the Housing and Construction Commission [66], most of the buildings in northern China are made of brick and stone-based materials, and are strong enough to meet the conditions for PV module installation. We simplified this influencing factor and made an assumption that all buildings in the study area met the requirements.
Based on the classification results, this study simulated the calculation of rooftop solar PV retrofittable areas under three different scenarios: (1) the best case: all buildings can be retrofitted with PV; (2) the general case: all public buildings and commercial buildings such as large shopping malls, companies, parks and 50% of individual buildings can be retrofitted due to subsidy policies; (3) the worst case: only public buildings can be retrofitted.
Finally, this study sets the actual impact factors of the rooftop photovoltaic retrofittable area. The retrofittable area is mainly affected by three aspects: roof occupancy, photovoltaic panel installation, and pitched roof orientation. In reality, there are skylights or chimneys on the rooftops, which directly limit the usable area of the roofs. According to statistics from the Housing and Construction Commission [67], the prevalence of equipment on building rooftops is about 30%, so this study assumed that 70% of the rooftops are suitable for photovoltaic installation, i.e., the correction coefficient of the roof occupancy situation Bc was set as 0.7. Considering the installation of photovoltaic panels, the correction coefficient of photovoltaic equipment B q was set to 0.9. Considering the influence of the direction of the pitched roof, the correction coefficient of the roof direction B t was 0.5.
Therefore, the retrofittable area of terrace and pitched rooftops in the best case can be summarized as:
S b t u = S b t B c B q
S b p u = S b p B c B q B t
where S b t u is the usable area of the best-case terrace rooftop, and S b t is the best-case terrace rooftop area; S b p u is the usable area of the best-case pitched rooftop, and S b p is the best-case pitched rooftop area.
The retrofittable area of terrace and pitched rooftops in the general case can be summarized as:
    S g t u = S g t B c B q
S g p u = S g p B c B q B t
where S g t u is the usable area of the general-case terrace rooftop, and S g t is the general-case terrace rooftop area; S g p u is the usable area of the general-case pitched rooftop, and S g p is the general-case pitched rooftop area.
The retrofittable area of terrace and pitched rooftops in the worst case can be summarized as:
S w t u = S w t B c B q
S w p u = S w p B c B q B t
where S w t u is the usable area of the worst-case terrace rooftop, and S w t is the worst-case terrace rooftop area; S w p u is the usable area of the worst-case pitched rooftop, and S w p is the worst-case pitched rooftop area.

3.3. Long-Term Carbon Reduction Estimation with Meteorological Data

To estimate long-term carbon emission reduction in the study area, the use of GF-2 remote sensing images throughout the year would have caused serious financial and data burdens. A more feasible way was to mine the intrinsic relationship between daily meteorological data parameters (such as weather, season, lighting hours, etc.) and the daily average solar radiation, to obtain a long series (annual level) of the annual average daily solar radiation. This was the starting point for introducing meteorological data into long-term carbon emission reduction calculations.
Based on the calculation of the usable area for rooftop solar PV described in Section 3.2.3, above, the relationships between climate factors such as light hours, weather conditions, seasons, and solar radiation were constructed via a MLP model. Figure 7 shows the whole process of carbon reduction calculation.

3.3.1. PV Installation Capacity Estimation

As shown in Figure 7, this study estimated carbon emission reductions due to PV electricity generation according to three scenarios. To estimate the PV electricity generation ability L of a PV system, this study considers the following influencing factors according to field research:
L = W × H × η ,   H = Q / l 0
where W is the PV installation capacity, H is the peak hours, η is the total efficiency of the PV system, Q is the total annual solar radiation on the inclined surface, l0 is the solar PV electricity generation performance constant. Here l0 was set to 1000 W/m2 according to actual PV installation model [68].
PV installation capacity W is affected by different rooftop types, as shown in (9), where W1 stands for the installation capacity of terrace rooftop, and W2 is the installation capacity of pitched rooftop:
W = W 1 + W 2
The key to calculating PV installation capacity is to determine the number of PV module arrays that can be installed. Considering actual installation types in the study area, the detailed parameters of PV arrays were as follows: the photovoltaic panel size was 1640 mm × 992 mm × 35 mm, the installation array was in 2 × 8 form, and power generation efficiency was 240 W/m2. The installation of PV modules on terrace rooftops requires consideration of mutual shading between PV module arrays, and the spacing between PV module arrays needs to be calculated by combining module parameters, local longitude and latitude, PV installation inclination, solar azimuth, solar altitude angle, etc. Based on previous experience in Chinese provinces and cities [69], the best installation inclination in the study area was set as φ = 35°. The minimum spacing between the arrays was calculated with the parameters for 3:00 pm on the winter solstice, and the details are shown in Figure 8.
The distance between the front and rear arrays can be calculated as follows:
d = L c o s φ + L s i n φ / tan ( α + h )
where α is the solar azimuth angle, h is the solar altitude angle, φ is the optimal installation inclination of the PV, and L is the length of the PV arrays.
So the installation capacity of terrace rooftop in different cases is
{ W 1 = N 1 240 2 8 N 1 = S { b , g , w } t u S 1 S 1 = d b
where N1 is the number of PV module arrays that can be installed,   S { b , g , w } t u is the usable area of the terrace rooftop in different cases, S 1 is the footprint of a PV module array, d is the distance between the front and rear arrays, and b is the PV array width.
Pitched rooftops can be directly fitted with PV module arrays, so the installation capacity of solar PV on pitched rooftops in different cases is
{ W 2 = N 2 240 2 8 N 2 = S { b , g , w } p u S 2 S 2 = l b
where N2 is the number of PV module arrays that can be installed, S { b , g , w } p u is the usable area of the pitched rooftop in different cases, S 2 is the footprint of a PV module array, l is the PV array length, and b is the PV array width.

3.3.2. MLP Modeling for Annual Solar Radiation Inversion

Total solar radiation on the inclined plane (Q) is expressed as:
Q = Q h   /   c o s φ
where Qh is the amount of solar radiation on the horizontal plane and φ is the optimal installation tilt angle of PV.
For the calculation of Qh, as we only had access to weather data from 2019 for the study area, this study employed MLP regression based on day-by-day weather conditions, hours of light and the relationship between quarterly and solar radiation in the study area, to obtain the robust solar radiation estimation for the whole year of 2021. It should be noted that weather conditions in 2019 and 2021 were similar, according to weather bureau statistics [70].
Figure 9 shows the topology of the MLP. The topology of MLP includes an input layer, two hidden layers and an output layer. Input neurons in the input layer contain day-by-day weather conditions, light hours, and quarterly data for the study area in 2019. The first hidden layer utilizes 20 neural units, and the second holds 10 neurons. The output layer is the day-by-day solar radiation. The training set and test set are randomly divided by the ratio of 8:2. K-fold cross-validation is adopted with the average as the final output.
The day-by-day values of horizontal solar radiation in 2021 were subsequently derived from the MLP model, and then added up as Qh for the whole year 2021.

3.3.3. CO2 Emission Reduction Estimation

With the results of W in Section 3.3.1 and Q in Section 3.3.2, the installation capacity L of PV system in Formula (8) was then obtained. Standard coal savings Q t r (in kgce) can then be summarized as follows:
Q t r = g a m a L
where g a m a is the national standard coal consumption for electricity supply according to the National Energy Administration [71]. Here the value of g a m a is 305.5 g/kWh.
Finally, CO2 emission reduction from solar PV systems can be obtained as follows:
Q r CO 2 = Q t r × V CO 2
where V CO 2 is the CO2 emission factor of standard coal with the value of 2.47 kg/kgce according to state regulations [72].

4. Experiments

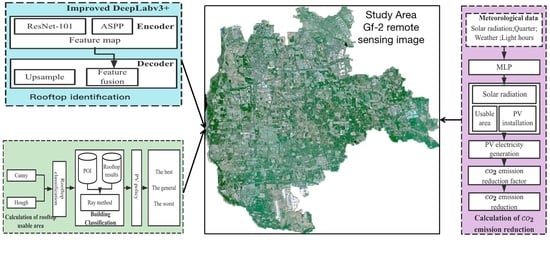
4.1. Study Area and GF-2 Images

The study area was located in Daxing District, Beijing, China, between latitude 39°26′–39°50′N and longitude 116°13′–116°43′E, as shown in Figure 10. The average elevation of the Daxing District is 42 m, and its area is 1036.33 km2. The study area has different rooftop types, including terrace rooftops, pitched rooftops, etc. Different building occupancies, such as residential buildings, industrial buildings, commercial buildings, public buildings, etc., coexist in this study area.
The study area has a warm temperate semi-humid continental monsoon climate with four distinct seasons. The average temperature of the hottest month in summer is 25.9 °C, and the maximum temperature is 40.6 °C; The average temperature of the coldest month in winter is −5 °C, and the minimum temperature is −27.4 °C. The average annual sunshine hours are 2764 h, and the annual sunshine percentage is 63%. According to the distribution of solar energy resources in China [73], the study area belongs to the Class III area, which is a medium-type area in terms of solar energy resources. The total amount of solar radiation received annually per square meter area is 5016~5852 MJ. This amount of solar radiation is sufficient to utilize for rooftop solar photovoltaic retrofits.
The GF-2 satellite, a sun-synchronous orbit satellite launched on 19 August 2014, belongs to the national high-resolution earth observation system. The GF-2 images with a resolution of 1 m were acquired on 1 June 2021. The original data were true-color images, and the original images were first exported to TIF format using ArcGIS [74], which is convenient for pre-processing work.

4.2. Building Dataset Construction

A large building dataset for building roof recognition was constructed as follows. First, the building vector map of the study area was downloaded from QuickOSM in QGIS, and then transformed to a raster map. Then, the spatial coordinates in the raster map were written into GF-2 remote sensing images with ArcGIS to fulfill geographical alignment and semantic annotation. Finally, the aligned GF-2 remote sensing images and building vector map were cropped and manually sifted, and 822 tiles of 500 × 500 pixels were derived without overlap.
To further increase diversity in the training dataset, a dataset of typical urban buildings in China [75] was also added. The final building dataset contained 6807 tiles of 500 × 500 pixels, which was convenient for the subsequent experiments. Figure 11 shows a sample of the building dataset.

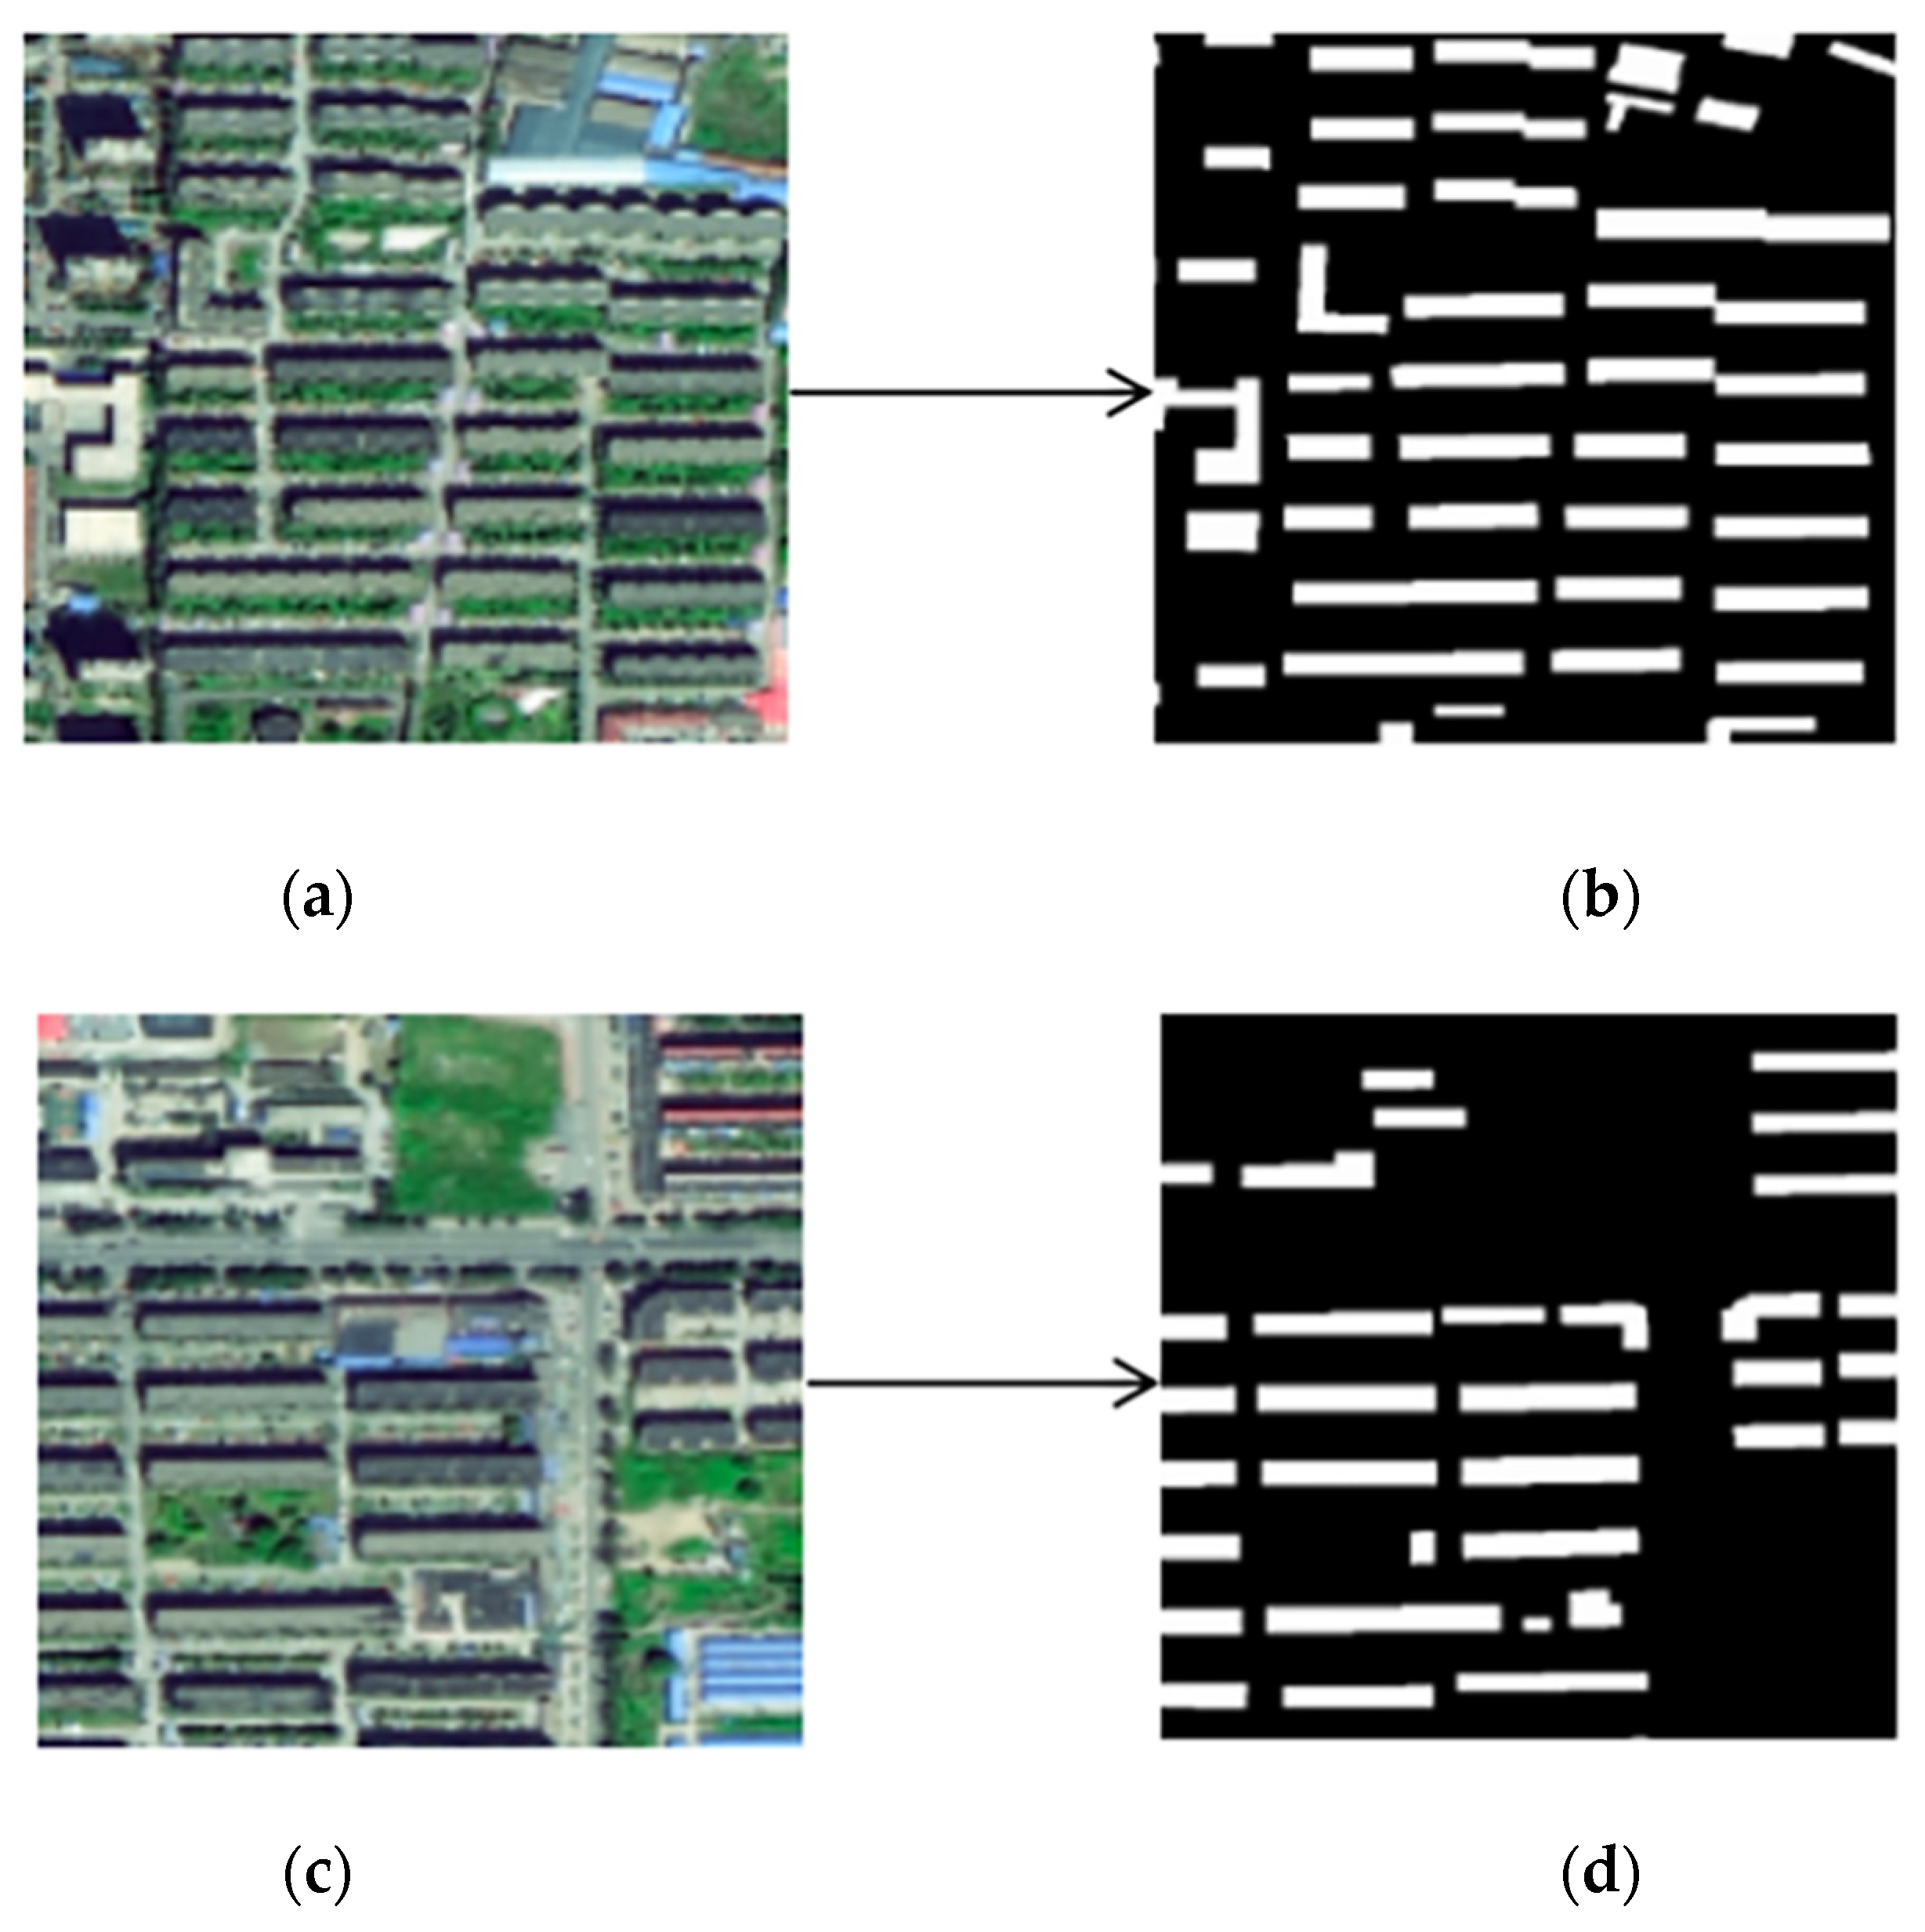
4.3. Building Rooftop Identification with improved DeepLabv3+

Accuracy (Acc) and F1-score were selected for evaluation of building rooftop identification. Building rooftop recognition via improved DeepLabv3+ involved the random division of data in the building dataset into a training set and a test set, with the ratio of 8:2. Table 3 shows the results of the improved DeepLabv3+ and the traditional DeepLabv3+ model.
From Table 3, it can be seen that the accuracy of building rooftop recognition by the improved DeepLabv3+ reached 95.56%, which was 1.05% higher than the traditional DeepLabv3+. The F1-score reached 82.55%, which was 0.94% higher than the traditional DeepLabv3+.
Next, all building rooftops in the study area were identified with the improved DeepLabv3, and the results are shown in Figure 12. In total, we identified 19,749 buildings using improved DeepLabv3+ in the study area.

4.4. Calculation of Usable Area of Rooftop PV

4.4.1. Building Rooftop and Occupancy Classification

Due to the crowding of the buildings in the rooftop recognition images from Section 4.3, above, it was not convenient to directly classify building rooftops and building occupancies. The original image from Section 4.3 was divided into 5000 × 5000 images, and then classified separately with Hough transform and Canny edge detection as described in Section 3.2.1. Finally, building occupancy categories were identified using a simple ray method with the help of POIs. Three major categories including public buildings, commercial buildings, and residential buildings were identified, as shown in Figure 13.
In total, 16,794 terrace rooftops and 2955 pitched rooftops were identified in the study area. In terms of building occupancies, 993 public buildings, 5256 commercial buildings including shopping malls, companies and parks, and 6017 residential buildings were extracted from the GF-2 images.
As shown in Table 4, there were 993 public buildings, including 868 terrace rooftops and 125 pitched rooftops, 5256 commercial buildings such as shopping malls, companies and parks that included 4735 terrace rooftops and 520 pitched rooftops, and 6017 residential buildings including 5288 terrace rooftops and 727 pitched rooftops.

4.4.2. Calculations under Different Scenarios of Usable Area of Rooftop Solar PV

Applying the results of building rooftop and occupancy classification, the usable areas of building rooftops in the study area were calculated under three scenarios, viz., the best, the general and the worst, respectively. (1) the best case: all buildings can be retrofitted with PV; (2) the general case: all public buildings and commercial buildings such as shopping malls, companies and parks, and 50% of individual buildings can be retrofitted; (3) the worst case: only public buildings can be retrofitted.
Table 5 shows different results for the usable areas for rooftop solar PV in the three scenarios. From Table 5 it is clear that apart from rooftop type, the most influential factor for the estimation of usable areas for rooftop solar PV is the subsidy policies that determine the willingness or otherwise of individual building owners to retrofit PV.

4.5. Carbon Reduction of Rooftop Solar PV

4.5.1. Calculation Results of PV Installation Capacity

The PV installation capacity was modeled based on the usable area of rooftop solar PV, PV modules, PV mounting arrays, and the parameters given in Section 3.3.1, above. For a terrace rooftop, the distance d between PV mounting arrays is 3997 mm, and the footprint S1 of one PV module array is 31.72 m2. For a pitched rooftop, the footprint S2 of one PV module array is 26.03 m2. The number of PV module arrays that can be installed in each of the three secnarios, and the capacity for installation of solar PV on terrace rooftops and pitched rooftops, are shown in Table 6.

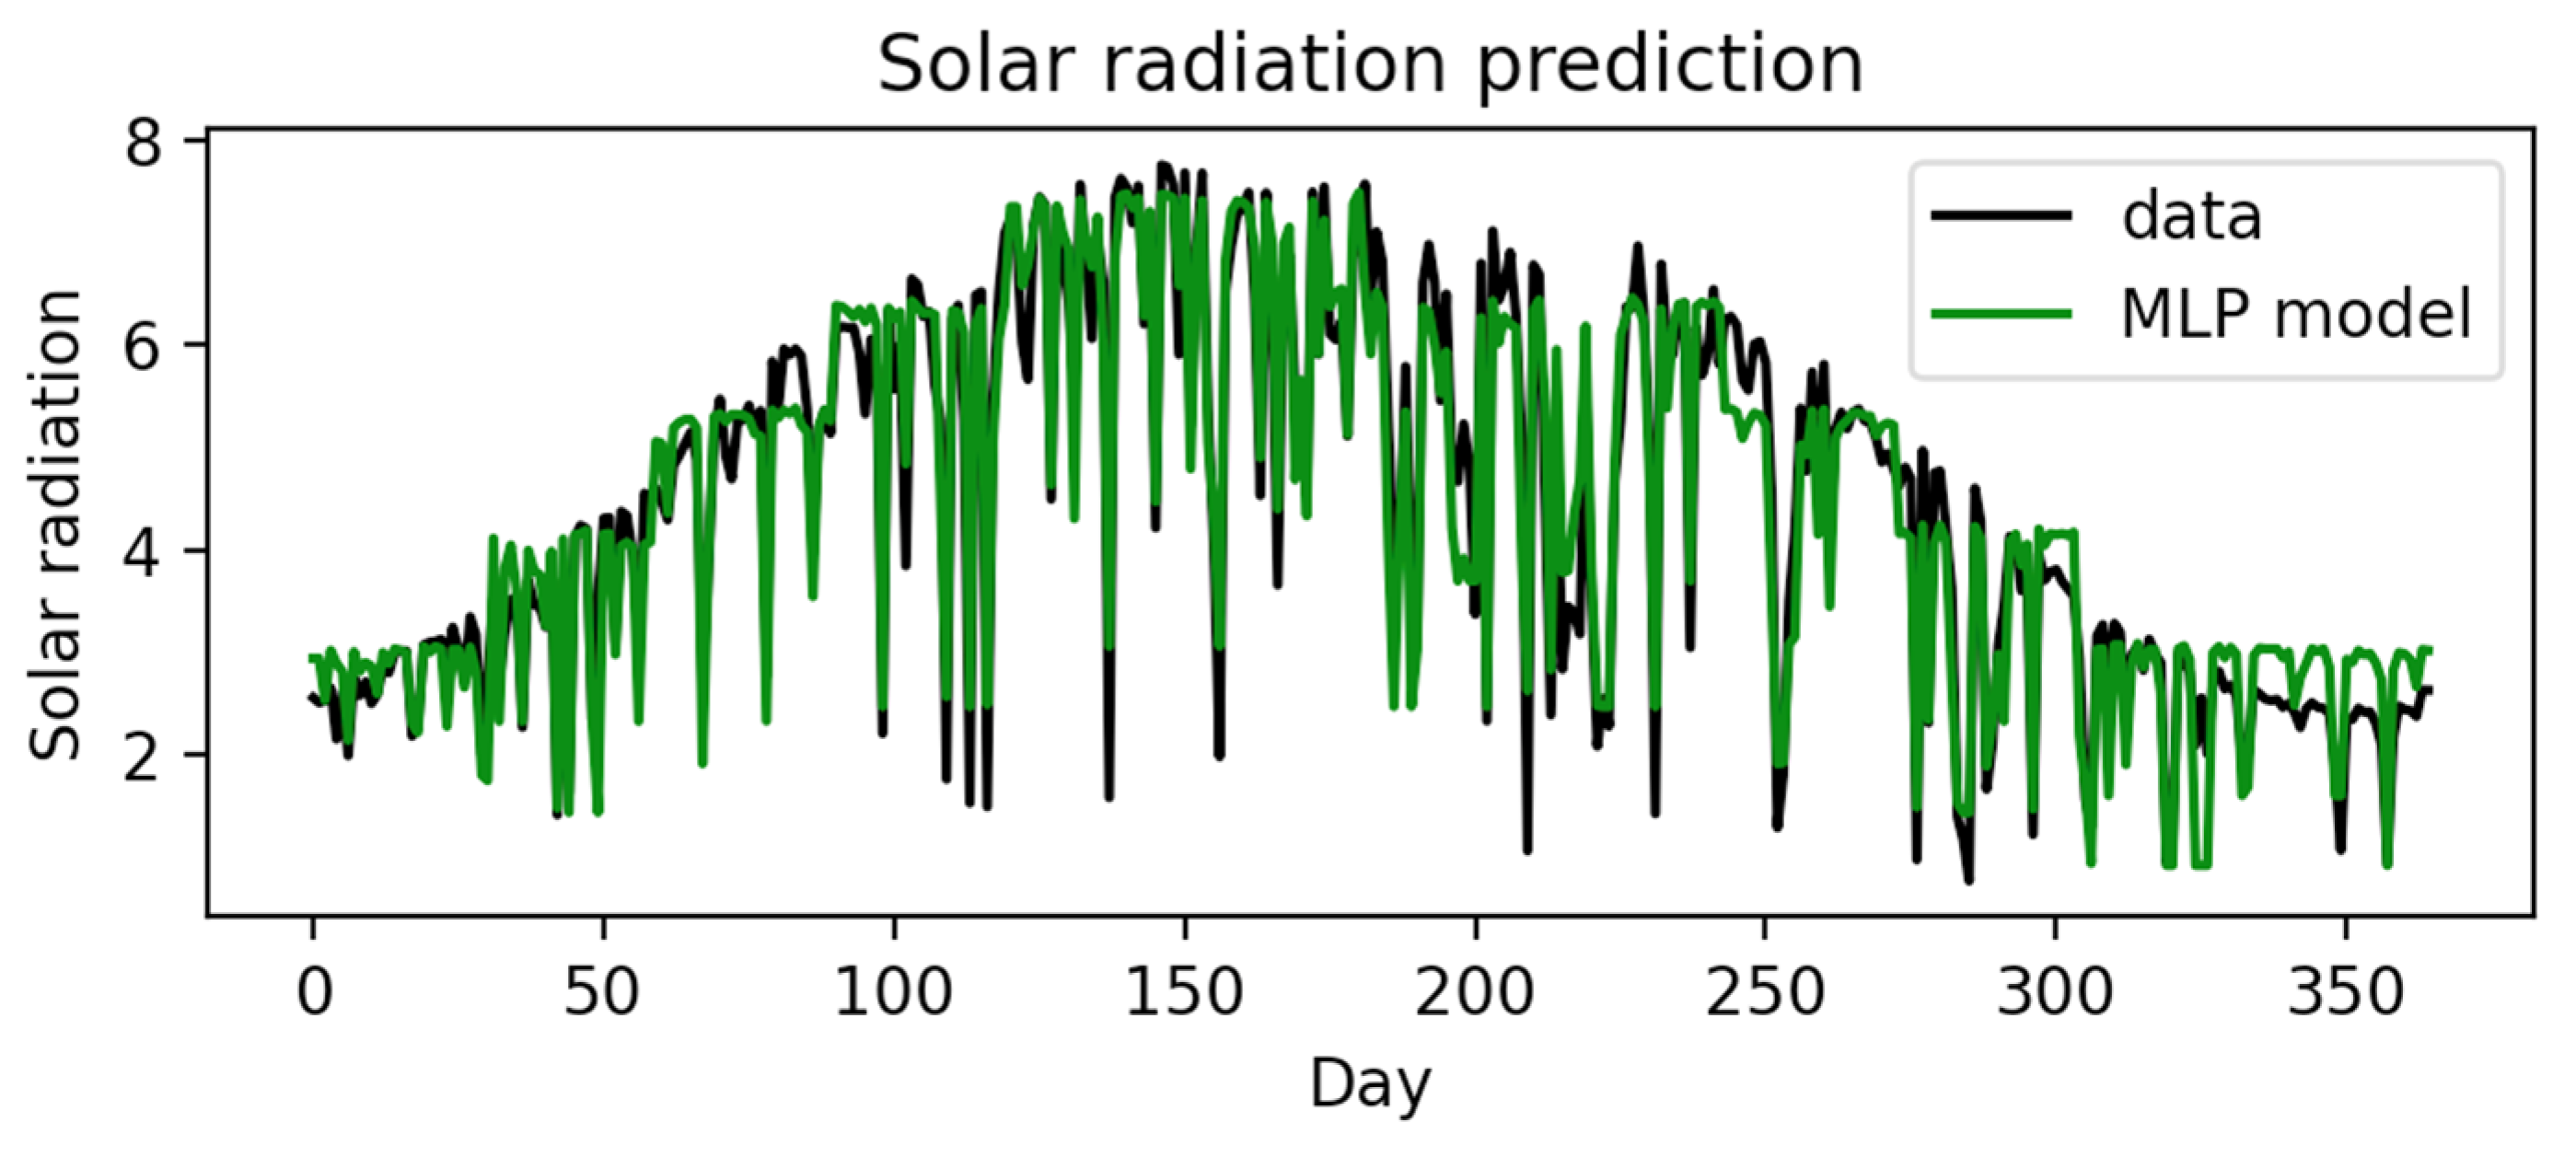
4.5.2. Solar Radiation Estimation in 2021

Solar radiation in 2021 is estimated using the MLP model according to weather conditions, sunshine hours, and seasons of the study area in 2019. All the parameters of MLP after repeated experiments are listed in Table 7.
R2, Root Mean Square Error (RMSE), and Mean Absolute Error (MAE) were selected as the performance metrics for MLP regression. In addition, Support Vector Machine (SVM) [76] and Long Short-Term Memory (LSTM) networks [77] were included for comparison. Table 8 and Table 9 summarize the parameters in these two models.
All the models were executed with 5-fold cross validation separately. The averaged results were taken as the final outputs. Performances are summarized in Table 10.
In Table 10, it can be seen that MLP generally scored higher than the other two models. Figure 14 further illustrates the regression performance of MLP. The black curve indicates the day-by-day solar radiation in 2019, and the green curve indicates the day-by-day solar radiation in 2021 obtained from MLP regression.
The final regression via MLP yielded a total horizontal solar radiation of 1627.93 kWh/m2 in 2021. According to Formula (13), where φ is 35°, the total solar radiation in 2021 is 1985.28 kWh/m2.

4.5.3. Calculation of PV Electricity Generation Capacity and Carbon Emission Reduction

According to Formula (8), where l0 is 1000 W/m2, the results of electricity generation capability of rooftop solar PV are shown in Table 11.
According to Formulas (14) and (15), where g a m a is 305.5 g/kWh, and V CO 2 is 2.47 kg/kgce, the results of the carbon emission reduction are shown in Table 12.

5. Discussion

5.1. The Difference between Existing Works and Our Approach

Literature describing PV potential assessment based on remote sensing images has previously been published. Joshi et al. [78] presented a high-resolution global assessment of rooftop solar photovoltaics potential using big data, machine learning and geospatial analysis; Huang et al. [79] proposed a GIS-based approach for the assessment of large-scale PV potential in China; Hou et al. [80] proposed a deep learning framework named SolarNet, designed to perform semantic segmentation on large-scale satellite imagery data for the development of solar farms; Plakman et al. [81] developed an object-based random forest (RF) classification approach using public satellite images to develop large-scale solar parks. However, all of the above studies were quantitative assessments for low-resolution and large-scale areas, and do not reflect the actual PV carbon reduction potential of a specific region in any detailed manner.
Therefore, in order to achieve accurate assessment of carbon emission reduction after building rooftop PV retrofitting, this study employed high-resolution remote sensing images (GF-2 images) and the improved DeepLabv3+ network to accurately identify building rooftops in the study area. Unlike the studies mentioned above, this study incorporates multiple data sources including POI data and weather conditions. This study conducted experiments for a specific region, taking into account the effects of rooftop types, building occupancy, PV subsidy policies, and weather conditions in the study area. The method solved the problems described above, and the estimation is accurate and reliable.
For the government and for business, improved carbon reduction potential is more attractive and practical, and can be applied directly to guide policy formulation, conduct carbon trading, and assess carbon emissions.

5.2. Building Rooftop Identification

An improved DeepLabv3+ network is proposed to extract building rooftops from GF-2 remote sensing images in the study area, which provides a basis for estimation of carbon reduction due to building rooftop PV. The improved DeepLabv3+ network utilizes multi-scale features and increases feature fusion, to better extract context information from remote sensing images.
The improved DeepLabv3+ network achieved better results in building rooftop identification. The improved DeepLabv3+ network includes a fusion of shallow features and deep abstract features in the encoder, which can make full use of the features generated by ResNet-101 backbone network. We believe that this design can better integrate contextual information contained in shallow and deep feature maps. Therefore, according to the results of building rooftop recognition, the improved DeepLabv3+ with the fusion of different hierarchical scale features improved the Acc value by 1.05% compared with DeepLabv3+. Our experiments show that using multi-scale features can improve the accuracy of building rooftop recognition. The results show consistency with previous studies for multi-scale feature fusion. For example, Fu et al. [82] proposed a feature fusion architecture to generate a multi-scale feature hierarchy for arbitrary direction and multi-scale target detection from remote sensing images, which improved the accuracy of recognition. Deng et al. [83] designed a feature extraction procedure to increase the diversity of perceptual field sizes and improve the accuracy of multi-scale target detection by two detection sub-networks. Overall, multi-scale features from high-resolution images should be paid more attention in order to obtain promising results in building rooftop recognition.
Since there are few PV stations installed in the study area, the areas of installed PV stations were neglected in our experiments. The identification of installed PV stations from high-resolution images is listed as a future task, which should not be ignored in different study areas.

5.3. Building Rooftops PV Carbon Reduction Estimation

We estimated the carbon reduction due to building rooftop PV in the study area, using the method proposed in Section 3.2 and Section 3.3, and obtained results for the best, the general and the worst amounts of annual carbon emission reduction in the study area, which were 7,705,100 tons, 6,031,400 tons, and 632,300 tons, respectively (as described in Section 4.5).
In practice, rooftop PV carbon reduction estimation is influenced by the following three aspects: factors affecting the rooftop area calculation, the retrofit ratio under different subsidy policies, and the constants in solar radiation and carbon reduction.
The influencing factors in the rooftop area calculation, including the accuracy of building rooftop classification, the availability of POI semantics, etc., determine the usable rooftop areas for PV retrofitting. For building rooftop classification, we adopted the method of Hough transformation and edge line segment analysis, combined with the main direction of the building to judge the ridgeline. The reported accuracy was 85.50%, which still needs to be refined in terms of the quality, color, and resolution of high-resolution remote sensing images. POI data was derived from Baidu Map, and POIs from multiple sources may also improve the identification performance.
The renovation ratios in diverse building occupancies serve as an important factor for PV renovation scenarios according to local subsidy policies. In this study area, public buildings, shopping malls, companies, parks and other large commercial buildings are encouraged to adopt PV refitting. PV refitting for individual buildings is influenced by subsidies to a great extent. Here we considered the general case to be that all public buildings, shopping malls, companies, parks and other commercial buildings, and 50% of residential buildings, were suitable for PV retrofitting, according to statistics from National Energy Administration [84]. In addition, our method can serve as an evaluation tool to identify the relationship between different subsidy policies and actual PV refitting.
Finally, the solar radiation and carbon reduction constants used in this study were obtained from National Energy Administration, with no changes made for the local environment. These two constants are the average values across the whole country. Further research is required to obtain a more elaborate depiction of the study area, to further improve the performance of our method.

6. Conclusions

This study proposes a framework to assess accurately the long-term carbon emission reductions from rooftop solar PV, via GF-2 remote sensing images, POI data, and meteorological data. An improved DeepLabv3+ network with multi-scale features was employed to develop rooftop recognition from high-resolution remote sensing images, and the results show that the accuracy of the improved DeepLabv3+ is 1.05% better than the traditional DeepLabv3+ network. A rooftop ridgeline detection algorithm for building rooftop classification is put forward, based on Canny edge detection and Hough transform. The occupancies of terrace rooftops and pitched rooftops were identified with the help of POI semantic information. Different refit scenarios of PV systems were demonstrated according to diverse subsidy policies. In order to evaluate the long-term carbon emission reduction due to rooftop solar photovoltaic systems, annual solar radiation in 2021 was regressed with meteorological data from 2019 via the MLP model, and the solar radiation result was transformed under relevant provisions.
In the best case scenario, PV refitting can generate 10.21 billion kWh per year and reduce carbon by 7,705,100 tons; in general, PV refitting can generate 7.99 billion kWh per year and reduce carbon by 6,031,400 tons; in the worst case, PV refitting can generate 0.84 billion kWh per year and reduce carbon by 632,300 tons. These findings provide important references for government and for PV practitioners.
In the future, we intend to extend our methods for large-scale building rooftop PV carbon reduction assessment with different remote sensing images collected from different regions.

Author Contributions

S.L. supervised the study, designed the topic, and revised the manuscript; C.Z. wrote the manuscript and conducted relevant experiments; L.D. and J.Z. designed the basic algorithm of building rooftops recognition and revised the manuscript; X.L. provided methods, supervised the study and revised the manuscript; G.C. provided GF-2 images; S.W. and J.C. revised the manuscript. All authors have read and agreed to the published version of the manuscript.

Funding

This work is supported by Beijing University of Technology “Urban Carbon Neutral” Science and Technology Innovation Fund (No. YS22-1013392-170).

Conflicts of Interest

The authors declare no conflict of interest.

References

  1. Koo, C.; Hong, T.; Lee, M.; Park, H.S. Development of a new energy efficiency rating system for existing residential buildings. Energy Policy 2014, 68, 218–231. [Google Scholar] [CrossRef] [Green Version]
  2. Lund, H.; Mathiesen, B.V. Energy system analysis of 100% renewable energy systems—The case of Denmark in years 2030 and 2050. Energy 2009, 34, 524–531. [Google Scholar] [CrossRef]
  3. Bocca, A.; Chiavazzo, E.; Macii, A.; Asinari, P. Solar energy potential assessment: An overview and a fast modeling approach with application to Italy. Renew. Sustain. Energy Rev. 2015, 49, 291–296. [Google Scholar] [CrossRef] [Green Version]
  4. Planning for Renewable Energy in 13th Five-Year; National Development and Reform Commission: Beijing, China, 2016.
  5. Zhao, W.; Persello, C.; Stein, A. Building outline delineation: From aerial images to polygons with an improved end-to-end learning framework. ISPRS J. Photogramm. Remote Sens. 2021, 175, 119–131. [Google Scholar] [CrossRef]
  6. Zhu, Q.; Huang, S.; Hu, H.; Li, H.; Chen, M.; Zhong, R. Depth-enhanced feature pyramid network for occlusion-aware verification of buildings from oblique images. ISPRS J. Photogramm. Remote Sens. 2021, 174, 105–116. [Google Scholar] [CrossRef]
  7. Wang, M.; Wang, Y.; Li, B.; Cai, Z.; Kang, M. A Population Spatialization Model at the Building Scale Using Random Forest. Remote Sens. 2022, 14, 1811. [Google Scholar] [CrossRef]
  8. Xu, Y.; Wu, L.; Xie, Z.; Chen, Z. Building extraction in very high resolution remote sensing imagery using deep learning and guided filters. Remote Sens. 2018, 10, 144. [Google Scholar] [CrossRef] [Green Version]
  9. Schiewe, J. Segmentation of high-resolution remotely sensed data-concepts, applications and problems. Int. Arch. Photogramm. Remote Sens. Spat. Inf. Sci. 2002, 34, 380–385. [Google Scholar]
  10. Benediktsson, J.A.; Chanussot, J.; Moon, W.M. Very high-resolution remote sensing: Challenges and opportunities. Proc. IEEE 2012, 100, 1907–1910. [Google Scholar] [CrossRef]
  11. Mahabir, R.; Croitoru, A.; Crooks, A.T.; Agouris, P.; Stefanidis, A. A critical review of high and very high-resolution remote sensing approaches for detecting and mapping slums: Trends, challenges and emerging opportunities. Urban Sci. 2018, 2, 8. [Google Scholar] [CrossRef] [Green Version]
  12. Long, J.; Shelhamer, E.; Darrell, T. Fully convolutional networks for semantic segmentation. In Proceedings of the IEEE conference on Computer Vision and Pattern Recognition, Boston, MA, USA, 7–12 June 2015; pp. 3431–3440. [Google Scholar]
  13. Ronneberger, O.; Fischer, P.; Brox, T. U-net: Convolutional networks for biomedical image segmentation. In Proceedings of the International Conference on Medical Image Computing and Computer-Assisted Intervention, Munich, Germany, 5–9 October 2015; Springer: Cham, Switzerland, 2015; pp. 234–241. [Google Scholar]
  14. Simonyan, K.; Zisserman, A. Very deep convolutional networks for large-scale image recognition. arXiv 2014, arXiv:1409.1556. [Google Scholar]
  15. Badrinarayanan, V.; Kendall, A.; Cipolla, R. Segnet: A deep convolutional encoder-decoder architecture for image segmentation. IEEE Trans. Pattern Anal. Mach. Intell. 2017, 39, 2481–2495. [Google Scholar] [CrossRef]
  16. Liu, Y.; Gross, L.; Li, Z.; Li, X.; Fan, X.; Qi, W. Automatic building extraction on high-resolution remote sensing imagery using deep convolutional encoder-decoder with spatial pyramid pooling. IEEE Access 2019, 7, 128774–128786. [Google Scholar] [CrossRef]
  17. Liu, H.; Luo, J.; Huang, B.; Hu, X.; Sun, Y.; Yang, Y.; Xu, N.; Zhou, N. DE-Net: Deep encoding network for building extraction from high-resolution remote sensing imagery. Remote Sens. 2019, 11, 2380. [Google Scholar] [CrossRef] [Green Version]
  18. Liu, Y.; Liu, J.; Ning, X.; Li, J. MS-CNN: Multiscale recognition of building rooftops from high spatial resolution remote sensing imagery. Int. J. Remote Sens. 2022, 43, 270–298. [Google Scholar] [CrossRef]
  19. Zhao, H.; Shi, J.; Qi, X.; Wang, X.; Jia, J. Pyramid scene parsing network. In Proceedings of the IEEE Conference on Computer Vision and Pattern Recognition, Honolulu, HI, USA, 21–26 July 2017; pp. 2881–2890. [Google Scholar]
  20. Hoffmann, E.J.; Wang, Y.; Werner, M.; Kang, J.; Zhu, X.X. Model fusion for building type classification from aerial and street view images. Remote Sens. 2019, 11, 1259. [Google Scholar] [CrossRef] [Green Version]
  21. Ding, H.; Jiang, X.; Shuai, B.; Liu, A.Q.; Wang, G. Context contrasted feature and gated multi-scale aggregation for scene segmentation. In Proceedings of the IEEE Conference on Computer Vision and Pattern Recognition, Salt Lake City, UT, USA, 18–23 June 2018; pp. 2393–2402. [Google Scholar]
  22. Zhong, T.; Zhang, Z.; Chen, M.; Zhang, K.; Zhou, Z.; Zhu, R.; Wang, Y.; Lü, G.; Yan, J. A city-scale estimation of rooftop solar photovoltaic potential based on deep learning. Appl. Energy 2021, 298, 117132. [Google Scholar] [CrossRef]
  23. Mohajeri, N.; Assouline, D.; Guiboud, B.; Bill, A.; Gudmundsson, A.; Scartezzini, J.L. A city-scale roof shape classification using machine learning for solar energy applications. Renew. Energy 2018, 121, 81–93. [Google Scholar] [CrossRef]
  24. Vardimon, R. Assessment of the potential for distributed photovoltaic electricity production in Israel. Renew. Energy 2011, 36, 591–594. [Google Scholar] [CrossRef]
  25. Strzalka, A.; Alam, N.; Duminil, E.; Coors, V.; Eicker, U. Large scale integration of photovoltaics in cities. Appl. Energy 2012, 93, 413–421. [Google Scholar] [CrossRef]
  26. Nguyen, H.T.; Pearce, J.M.; Harrap, R.; Barber, G. The application of LiDAR to assessment of rooftop solar photovoltaic deployment potential in a municipal district unit. Sensors 2012, 12, 4534–4558. [Google Scholar] [CrossRef] [PubMed]
  27. Kassner, R.; Koppe, W.; Schüttenberg, T.; Bareth, G. Analysis of the solar potential of roofs by using official lidar data. In Proceedings of the International Society for Photogrammetry, Remote Sensing and Spatial Information Sciences, (ISPRS Congress), Beijing, China, 3–11 July 2008; pp. 399–404. [Google Scholar]
  28. Ren, J.; Yang, J.; Zhang, Y.; Xiao, X.; Xia, J.C.; Li, X.; Wang, S. Exploring thermal comfort of urban buildings based on local climate zones. J. Clean. Prod. 2022, 340, 130744. [Google Scholar] [CrossRef]
  29. Zhou, L.; Hu, F.; Wang, B.; Wei, C.; Sun, D.; Wang, S. Relationship between urban landscape structure and land surface temperature: Spatial hierarchy and interaction effects. Sustain. Cities Soc. 2022, 80, 103795. [Google Scholar] [CrossRef]
  30. He, K.; Zhang, X.; Ren, S.; Sun, J. Deep residual learning for image recognition. In Proceedings of the IEEE Conference on Computer Vision and Pattern Recognition, Las Vegas, NV, USA, 27–30 June 2016; pp. 770–778. [Google Scholar]
  31. Ballard, D.H. Generalizing the Hough transform to detect arbitrary shapes. Pattern Recognit. 1981, 13, 111–122. [Google Scholar] [CrossRef] [Green Version]
  32. Canny, J. A computational approach to edge detection. IEEE Trans. Pattern Anal. Mach. Intell. 1986, 6, 679–698. [Google Scholar] [CrossRef]
  33. Wang, L.; Yan, J.; Mu, L.; Huang, L. Knowledge discovery from remote sensing images: A review. Wiley Interdiscip. Rev. Data Min. Knowl. Discov. 2020, 10, e1371. [Google Scholar] [CrossRef]
  34. Lin, C.; Nevatia, R. Building detection and description from a single intensity image. Comput. Vis. Image Underst. 1998, 72, 101–121. [Google Scholar] [CrossRef]
  35. Zhang, J.; Xiao, W.; Zhang, S.; Huang, S. Device-free localization via an extreme learning machine with parameterized geometrical feature extraction. Sensors 2017, 17, 879. [Google Scholar] [CrossRef] [Green Version]
  36. Katartzis, A.; Sahli, H.; Nyssen, E.; Cornelis, J. Detection of buildings from a single airborne image using a Markov random field model. IGARSS 2001. Scanning the Present and Resolving the Future. In Proceedings of the IEEE 2001 International Geoscience and Remote Sensing Symposium, Sydney, NSW, Australia, 9–13 July 2001; IEEE: New York, NY, USA, 2001; Volume 6, pp. 2832–2834. [Google Scholar]
  37. Troya-Galvis, A.; Gançarski, P.; Berti-Équille, L. Remote sensing image analysis by aggregation of segmentation-classification collaborative agents. Pattern Recognit. 2018, 73, 259–274. [Google Scholar] [CrossRef]
  38. Liu, C.; Guo, Z.; Fu, N. Applying a new integrated classification method to monitor shifting mangrove wetlands. In Proceedings of the 2010 International Conference on Multimedia Technology, Ningbo, China, 29–31 October 2010; pp. 1–4. [Google Scholar]
  39. Blaschke, T.; Hay, G.J.; Kelly, M.; Lang, S.; Hofmann, P.; Addink, E.; Feitosa, R.Q.; Van der Meer, F.; Van der Werff, H.; Van Coillie, F.; et al. Geographic object-based image analysis–towards a new paradigm. ISPRS J. Photogramm. Remote Sens. 2014, 87, 180–191. [Google Scholar] [CrossRef] [Green Version]
  40. Rawat, W.; Wang, Z. Deep convolutional neural networks for image classification: A comprehensive review. Neural Comput. 2017, 29, 2352–2449. [Google Scholar] [CrossRef] [PubMed]
  41. Zeiler, M.D.; Fergus, R. Visualizing and understanding convolutional networks. In Proceedings of the European Conference on Computer Vision, Zurich, Switzerland, 6–12 September 2014; Springer: Cham, Switzerland, 2014; pp. 818–833. [Google Scholar]
  42. Chen, L.C.; Papandreou, G.; Kokkinos, I.; Murphy, K.; Yuille, A.L. Semantic image segmentation with deep convolutional nets and fully connected crfs. arXiv 2014, arXiv:1412.7062. [Google Scholar]
  43. Liu, P.; Liu, X.; Liu, M.; Shi, Q.; Yang, J.; Xu, X.; Zhang, Y. Building footprint extraction from high-resolution images via spatial residual inception convolutional neural network. Remote Sens. 2019, 11, 830. [Google Scholar] [CrossRef] [Green Version]
  44. Sherrah, J. Fully convolutional networks for dense semantic labelling of high-resolution aerial imagery. arXiv 2016, arXiv:1606.02585. [Google Scholar]
  45. Ding, L.; Tang, H.; Liu, Y.; Shi, Y.; Zhu, X.X.; Bruzzone, L. Adversarial shape learning for building extraction in VHR remote sensing images. IEEE Trans. Image Process. 2021, 31, 678–690. [Google Scholar] [CrossRef]
  46. Shao, Z.; Tang, P.; Wang, Z.; Saleem, N.; Yam, S.; Sommai, C. BRRNet: A fully convolutional neural network for automatic building extraction from high-resolution remote sensing images. Remote Sens. 2020, 12, 1050. [Google Scholar] [CrossRef] [Green Version]
  47. Ma, J.; Wu, L.; Tang, X.; Liu, F.; Zhang, X.; Jiao, L. Building extraction of aerial images by a global and multi-scale encoder-decoder network. Remote Sens. 2020, 12, 2350. [Google Scholar] [CrossRef]
  48. Chen, L.C.; Papandreou, G.; Kokkinos, I.; Murphy, K.; Yuille, A.L. Deeplab: Semantic image segmentation with deep convolutional nets, atrous convolution, and fully connected crfs. IEEE Trans. Pattern Anal. Mach. Intell. 2017, 40, 834–848. [Google Scholar] [CrossRef] [Green Version]
  49. Chen, L.C.; Zhu, Y.; Papandreou, G.; Schroff, F.; Adam, H. Encoder-decoder with atrous separable convolution for semantic image segmentation. In Proceedings of the European Conference on Computer Vision (ECCV), Munich, Germany, 8–14 September 2018; pp. 801–818. [Google Scholar]
  50. Melius, J.; Margolis, R.; Ong, S. Estimating Rooftop Suitability for PV: A Review of Methods, Patents, and Validation Techniques; NREL: Golden, CO, USA, 2013. [Google Scholar]
  51. Sun, Y.; Wang, S.; Zhang, X.; Chan, T.O.; Wu, W. Estimating local-scale domestic electricity energy consumption using demographic, nighttime light imagery and Twitter data. Energy 2021, 226, 120351. [Google Scholar] [CrossRef]
  52. Izquierdo, S.; Rodrigues, M.; Fueyo, N. A method for estimating the geographical distribution of the available roof surface area for large-scale photovoltaic energy-potential evaluations. Sol. Energy 2008, 82, 929–939. [Google Scholar] [CrossRef]
  53. Szabó, S.; Enyedi, P.; Horváth, M.; Kovács, Z.; Burai, P.; Csoknyai, T.; Szabó, G. Automated registration of potential locations for solar energy production with Light Detection And Ranging (LiDAR) and small format photogrammetry. J. Clean. Prod. 2016, 112, 3820–3829. [Google Scholar] [CrossRef]
  54. Song, X.; Huang, Y.; Zhao, C.; Liu, Y.; Lu, Y.; Chang, Y.; Yang, J. An approach for estimating solar photovoltaic potential based on rooftop retrieval from remote sensing images. Energies 2018, 11, 3172. [Google Scholar] [CrossRef] [Green Version]
  55. Li, Z.; Zhang, Z.; Davey, K. Estimating geographical pv potential using lidar data for buildings in downtown san francisco. Trans. GIS 2015, 19, 930–963. [Google Scholar] [CrossRef]
  56. Snape, J.R. Spatial and temporal characteristics of PV adoption in the UK and their implications for the smart grid. Energies 2016, 9, 210. [Google Scholar] [CrossRef] [Green Version]
  57. Psomopoulos, C.S.; Ioannidis, G.C.; Kaminaris, S.D.; Mardikis, K.D.; Katsikas, N.G. A comparative evaluation of photovoltaic electricity production assessment software (PVGIS, PVWatts and RETScreen). Environ. Processes 2015, 2, 175–189. [Google Scholar] [CrossRef]
  58. Sampath, A.; Bijapur, P.; Karanam, A.; Umadevi, V.; Parathodiyil, M. Estimation of rooftop solar energy generation using Satellite Image Segmentation. In Proceedings of the 2019 IEEE 9th International Conference on Advanced Computing (IACC), Tiruchirappalli, India, 13–14 December 2019; pp. 38–44. [Google Scholar]
  59. Tang, S.; Ding, Y. Dong Mengneng, ye Qiang Potential Analysis of Solar Photovoltaic Power Generation in Chongqing. Chongqing Archit. 2014, 13, 8–11. [Google Scholar]
  60. Wang, L.Z.; Tan, H.W.; Ji, L.; Wang, D. A method for evaluating photovoltaic potential in China based on GIS platform. IOP Conf. Ser. Earth Environ. Sci. 2017, 93, 012056. [Google Scholar] [CrossRef]
  61. Siala, K.; Stich, J. Estimation of the PV potential in ASEAN with a high spatial and temporal resolution. Renew. Energy 2016, 88, 445–456. [Google Scholar] [CrossRef]
  62. Zhao, X.; Huang, G.; Lu, C.; Zhou, X.; Li, Y. Impacts of climate change on photovoltaic energy potential: A case study of China. Appl. Energy 2020, 280, 115888. [Google Scholar] [CrossRef]
  63. Chen, L.C.; Papandreou, G.; Schroff, F.; Adam, H. Rethinking atrous convolution for semantic image segmentation. arXiv 2017, arXiv:1706.05587. [Google Scholar]
  64. GB/T 21010-2017; Current Land Use Classification. Standards Press of China: Beijing, China, 2017.
  65. Baidu Map Open Platform. Available online: https://lbsyun.baidu.com (accessed on 25 March 2022).
  66. Ministry of Housing and Urban-Rural Development of the People’s Republic of China. Available online: https://www.mohurd.gov.cn/gongkai/fdzdgknr/tzgg/201903/20190315_239764.html (accessed on 17 June 2022).
  67. Housing and Construction Commission. Available online: https://www.mohurd.gov.cn/ (accessed on 17 June 2022).
  68. How to Calculate the Power Generation of Photovoltaic Projects. Available online: http://www.pvmen.com/article/4834.html (accessed on 17 June 2022).
  69. Quick Table of the Best Installation Inclination and Electricity Generation of PV Power Plants in China by Province and City. Available online: https://wenku.baidu.com/view/0916593313a6f524ccbff121dd36a32d7275c776.html (accessed on 25 April 2022).
  70. China Meterological Administration. Available online: http://www.cma.gov.cn/ (accessed on 17 June 2022).
  71. China Energy Big Data Report (2021)—Electricity. Available online: https://baijiahao.baidu.com/s?id=1702787204882618585&wfr=spider&for=pc (accessed on 26 April 2022).
  72. Wang, Z.; Zhu, X. Application of Solar Photovoltaic Power generation technology in green buildings and its energy saving research. Constr. Technol. 2020, 106, 98–102. [Google Scholar] [CrossRef]
  73. National Meteorological Science Data Center. Available online: http://data.cma.cn/site/article/id/41255.html (accessed on 26 April 2022).
  74. ArcGIS. Available online: https://www.esri.com/en-us/arcgis/products/arcgis-enterprise/overview (accessed on 26 April 2022).
  75. Fang, F.; Wu, K.; Zheng, D. Data Set of Typical Urban Building Examples in China; Science Data Bank: Beijing, China, 2021. [Google Scholar] [CrossRef]
  76. Platt, J. Sequential Minimal Optimization: A Fast Algorithm for Training Support Vector Machines; Microsoft: Washington, DC, USA, 1998. [Google Scholar]
  77. Hochreiter, S.; Schmidhuber, J. Long short-term memory. Neural Comput. 1997, 9, 1735–1780. [Google Scholar] [CrossRef] [PubMed]
  78. Joshi, S.; Mittal, S.; Holloway, P.; Shukla, P.R.; Gallachóir, B.Ó.; Glynn, J. High resolution global spatiotemporal assessment of rooftop solar photovoltaics potential for renewable electricity generation. Nat. Commun. 2021, 12, 1–15. [Google Scholar] [CrossRef] [PubMed]
  79. Huang, T.; Wang, S.; Yang, Q.; Li, J. A GIS-based assessment of large-scale PV potential in China. Energy Procedia 2018, 152, 1079–1084. [Google Scholar] [CrossRef]
  80. Hou, X.; Wang, B.; Hu, W.; Yin, L.; Wu, H. SolarNet: A deep learning framework to map solar power plants in China from satellite imagery. arXiv 2019, arXiv:1912.03685. [Google Scholar]
  81. Plakman, V.; Rosier, J.; van Vliet, J. Solar park detection from publicly available satellite imagery. GIScience Remote Sens. 2022, 59, 461–480. [Google Scholar] [CrossRef]
  82. Fu, K.; Chang, Z.; Zhang, Y.; Xu, G.; Zhang, K.; Sun, X. Rotation-aware and multi-scale convolutional neural network for object detection in remote sensing images. ISPRS J. Photogramm. Remote Sens. 2020, 161, 294–308. [Google Scholar] [CrossRef]
  83. Deng, Z.; Sun, H.; Zhou, S.; Zhao, J.; Lei, L.; Zou, H. Multi-scale object detection in remote sensing imagery with convolutional neural networks. ISPRS J. Photogramm. Remote Sens. 2018, 145, 3–22. [Google Scholar] [CrossRef]
  84. National Energy Administration. Available online: http://www.nea.gov.cn/ (accessed on 17 June 2022).
Figure 1. Different PV installation methods: (a) PV installation on terrace rooftops. It is necessary to consider the installation inclination and the mutual shading between the PV panels. (b) the PV installation on pitched rooftops. The PV panels are installed directly onto the pitched rooftops. Most of the buildings in northern China have terrace rooftops, and most use a combination of arrays to choose the best installation inclination according to the angle of solar radiation.
Remotesensing 14 03144 g001
Figure 2. Overall framework. The datasets contained GF-2 remote sensing images, POI data, and meteorological data for the study area. Based on these datasets, we carried out experiments on building roof identification, roof PV usable area estimation, and estimation of carbon emission reduction.
Remotesensing 14 03144 g002
Figure 3. The architecture of DeepLabv3+ network with ASPP module. In the encoder phrase, ResNet-101 serves as the backbone network and connects with the ASPP module; in the decoder phrase, upsampling and feature fusion are performed by two concatenate operations.
Remotesensing 14 03144 g003
Figure 4. Different rooftops in the study area: (a) the location of the study area in Beijing (marked with yellow lines); the red-marked pentagram is a typical village in our field research, located in Weishanzhuang Town, Daxing District in a surburb of Beijing. (b) an example of a terrace rooftop. (c) an example of pitched rooftops in the study area.
Remotesensing 14 03144 g004
Figure 5. Flow chart of rooftop type classification. We employed Canny edge detection to detect the edges of the building roofs, and then applied Hough transform with the main direction of the house to determine the ridgeline, and finally we classified different rooftop types.
Remotesensing 14 03144 g005
Figure 6. Building occupancy category identification via POI semantic information. We obtained the boundary polygon of the building by crawling POI semantic information, and employed the ray method to determine the building’s occupancy category by judging the number of intersection points.
Remotesensing 14 03144 g006
Figure 7. PV electricity generation and carbon reduction calculation. We employed MLP to study the relationship between regional weather, seasons, hours of light and solar radiation, and combined the PV installation method, building rooftop category, and usable rooftop area to estimate PV electricity generation and carbon reduction in three scenarios.
Remotesensing 14 03144 g007
Figure 8. PV array distance calculation. The distance between the front and rear arrays ( d ), the optimal installation inclination of the PV ( φ ), the solar azimuth angle ( α ), the solar altitude angle ( h ), and the length of the PV arrays ( L ) are demonstrated.
Remotesensing 14 03144 g008
Figure 9. The topological structure of MLP. The input layer and output layer of MLP both hold 292 neural units, the first hidden layer of MLP has 20 neural units, and the second possesses 10 neural units.
Remotesensing 14 03144 g009
Figure 10. Overview of the study area: (a) GF-2 remote sensing image of the study area, (b) zoomed GF-2 remote sensing image map of the selected region in (a) (marked with the red dot), (c) the location of the study area in Beijing city (marked with yellow lines).
Remotesensing 14 03144 g010
Figure 11. Example of the building dataset: (a,c) are GF-2 remote sensing images of the study area; (b,d) are the corresponding annotation images; the white parts are the corresponding building areas, and the black parts are the background.
Remotesensing 14 03144 g011
Figure 12. Results of building rooftop recognition: (a) the original GF-2 remote sensing image of the study area, (b) the distribution of identified building rooftops, where the white parts are the recognized building rooftops and the black part is the background.
Remotesensing 14 03144 g012
Figure 13. Examples of classification of building rooftops and building occupancies in the study area: (a) the original GF-2 remote sensing image of the study area, (b) the distribution of the classification results of building rooftops and occupancies. The blue borders represent pitched roofs, and the red borders represent terrace rooftops. COML refers to commercial buildings, INDL refers to individual buildings, and PUBC indicates public buildings. (c,d) partial enlargements of the building rooftop classification results, (e,f) corresponding building occupancy classification results.
Remotesensing 14 03144 g013
Figure 14. Regressed solar radiations versus true values: the black curve represents the real daily solar radiations in 2019, and the green represents the daily solar radiations regressed via MLP.
Remotesensing 14 03144 g014
Table 1. PV subsidy policies in different regions of China.
RegionSubsidy ObjectSubsidy
BeijingResident-owned industries0.30 RMB/kWh
Parks and commercial facilities0.30 RMB/kWh
Universities, primary schools and hospitals0.40 RMB/kWh
ShanghaiIndustries and commerce0.25 RMB/kWh
Schools0.55 RMB/kWh
Individuals and nursing homes0.40 RMB/kWh
Yiwu, ZhejiangResidents0.20 RMB/kWh
Companies providing space0.30 RMB/kWh
Investment companies0.10 RMB/kWh
Suzhou, JiangsuParks0.10 RMB/kWh
Table 2. POI categories of building occupancies.
Building categoriesPublic buildingsEducation and TrainingHigher education institutions, secondary schools, elementary schools, kindergartens, adult education, parent–child education, special education schools, study abroad agencies, research institutions, training institutions, libraries, science and technology centers
MedicalGeneral hospitals, specialist hospitals, clinics, pharmacies, medical centers, sanatoriums, emergency centers, and disease control centers
Transportation FacilitiesAirports, train stations, subway stations, coach stations, bus stations
Government AgenciesCentral agencies, governments at all levels, administrative units, public prosecution and law enforcement agencies, foreign-related agencies, party groups, welfare agencies, political education agencies
Sports and FitnessStadiums, extreme sports venues, fitness centers
Tourist AttractionsParks, zoos, botanical gardens, amusement parks, museums, aquariums, seaside baths, heritage sites, churches, scenic spots
Commercial buildingsFoodChinese restaurants, foreign restaurants, snack and fast-food restaurants, cake and dessert stores, cafes, cafeterias, bars
HotelsStar hotels, fast hotels, apartment hotels
ShoppingShopping centers, department stores, supermarkets, convenience stores, home building materials, home appliances and digital, stores, bazaars
Company EnterpriseCompanies, campuses
BeautyBeauty, hairdressing, nail care, body care
Residential buildingsReal EstateOffice buildings, residential areas, dormitories, neighborhoods, villages
Table 3. Comparison of building rooftop recognition.
Acc (%)F1-Score (%)
improved DeepLabv3+95.5682.55
traditional DeepLabv3+94.5181.61
Table 4. Numbers of terrace and pitched rooftops with different building occupancies.
Rooftop NumbersPublic Commercial Residential
Number of terrace rooftops 86847355288
Number of pitched rooftops 125520727
Total99352566017
Table 5. The usable areas of rooftop solar PV (in km2).
Usable Area of RooftopThe BestThe GeneralThe Worst
Usable area of terrace rooftop 48.6738.194.02
Usable area of pitched rooftop 3.642.780.28
Total52.3140.974.30
Table 6. PV installation capacity (in 104 kW).
CapacityThe BestThe GeneralThe Worst
Terrace rooftops 589.20462.3348.67
Pitched rooftops53.7941.014.13
Total642.99503.3452.80
Table 7. MLP parameter setting.
ParameterHidden_Layer_SizesActivationSolverAlpha
Setting(20, 10)relulbfgs0.0001
Table 8. SVM parameter setting.
KernelCGama
rbf1.00.5
Table 9. LSTM parameter setting.
Hidden_SizeActivationInput_Shape
50.0relu(2, 1)
Table 10. Performance evaluation of different models.
ModelsR2RMSEMAE
MLP0.940.080.06
SVM0.910.130.10
LSTM0.621.130.89
Table 11. Electricity generation of rooftop solar PV (in 108 kWh).
Electricity GenerationThe BestThe GeneralThe Worst
Terrace rooftops93.5773.427.72
Pitched rooftops8.546.510.66
Total102.1179.938.38
Table 12. Rooftop Solar PV Carbon Reduction (in 104 t).
Carbon ReductionThe BestThe GeneralThe Worst
PV Carbon Reduction770.51603.1463.23
Publisher’s Note: MDPI stays neutral with regard to jurisdictional claims in published maps and institutional affiliations.

