Article

Recent Changes in Drought Events over South Asia and Their Possible Linkages with Climatic and Dynamic Factors

1
College of Hydrology and Water Resources, Hohai University, Nanjing 210098, China
2
CMA-HHU Joint Laboratory for Hydrometeorological Studies, Hohai University, Nanjing 210098, China
3
Key Laboratory of Hydrometeorological Disaster Mechanism and Warning of Ministry of Water Resources, Nanjing University of Information Science and Technology, Nanjing 210044, China
4
School of Hydrology and Water Resources, Nanjing University of Information Science and Technology, Nanjing 210044, China
5
Department of Atmospheric Science, School of Environmental Research, China University of Geosciences, Wuhan 340074, China
6
Rwanda Meteorology Agency, Kigali P.O. Box 898, Rwanda
7
Institute of Peace and Conflicts Studies, University of Peshawar, Peshawar 25000, Pakistan
8
Department of Biological and Agricultural Engineering, Texas A&M University, College Station, TX 77843-2117, USA
9
Zachry Department of Civil Engineering, Texas A&M University, College Station, TX 77843-2117, USA
*
Author to whom correspondence should be addressed.
Remote Sens. 2022, 14(13), 3219; https://0-doi-org.brum.beds.ac.uk/10.3390/rs14133219
Submission received: 30 May 2022 / Revised: 25 June 2022 / Accepted: 2 July 2022 / Published: 4 July 2022
(This article belongs to the Special Issue Impacts of Climate Change on Agriculture)

Abstract

:
South Asia is home to one of the fastest-growing populations in Asia, and human activities are leaving indelible marks on the land surface. Yet the likelihood of successive observed droughts in South Asia (SA) and its four subregions (R-1: semi-arid, R-2: arid, R-3: subtropical wet, and R-4: tropical wet and dry) remains poorly understood. Using the state-of-the-art self-calibrated Palmer Drought Severity Index (scPDSI), we examined the impact of different natural ocean variability modes on the evolution, severity, and magnitude of observed droughts across the four subregions that have distinct precipitation seasonality and cover key breadbaskets and highly vulnerable populations. The study revealed that dryness had significantly increased in R-1, R-2, and R-4 during 1981–2020. Temporal analysis revealed an increase in drought intensity for R-1 and R-4 since the 2000s, while a mixed behavior was observed in R-2 and R-3. Moreover, most of the sub-regions witnessed a substantial upsurge in annual precipitation, but a significant decrease in vapor pressure deficit (VPD) during 1981–2020. The increase in precipitation and the decline in VPD partially contributed to a significant rise in Normalized Difference Vegetation Index (NDVI) and a decrease in dryness. In contrast, a strong positive correlation was found between drought index and precipitation, and NDVI across R-1, R-2, and R-4, whereas temperature and VPD exhibited a negative correlation over these regions. No obvious link was detected with El-Niño Southern Oscillation (ENSO) events, or Indian Ocean Dipole (IOD) and drought evolution, as explored for certain regions of SA. The findings showed the possibility that the precipitation changes over these regions had an insignificant relationship with ENSO, IOD, and drought onset. Thus, the study results highlight the need for considering interactions within the longer climate system in describing observed drought risks rather than aiming at drivers from an individual perspective.

1. Introduction

Over recent decades, hydro-meteorological droughts have become more persistent, frequent, and severe in many parts of the globe [1,2], particularly in South Asia hotspot regions [3]. These droughts have dramatic impacts on health, transport, agriculture, energy, and ecosystem vitality [4]. South Asia (SA) is home to one of the fastest-growing populations in Asia, and human-associated land-use changes and policies are leaving indelible marks on the land surface [5,6]. In the recent past, SA has faced severe droughts due to changing climate, that have affected water resources, energy generation, and agricultural production, and have disturbed the lives of more than 1.6 billion people [7,8]. In the region, water resources, energy, and food security are closely tied to sustainable water management and are highly susceptible to the effects of changing climate [9]. Moreover, the agricultural sector plays a significant role in the region’s economy, representing more than a quarter of the total Gross Domestic Product [10]. To date, few studies have explicitly considered unidirectional hazards or quantitatively detected the long-term change in meteorological drought in the sub-continental region. Future projections indicate that SA will become both warmer and drier over the middle of the 21st century, accompanied by a further rise in the severity and magnitude of drought events [9]. However, historical variations in meteorological drought and their influencing factors are still not well understood in SA, despite their importance to socio-economic development. To deal with the anticipated threats posed by water scarcity and climate change, it is necessary to better understand how natural variability has reshaped the climate and environment of SA, including its vulnerability to drought and other hydro-climatic extremes, along with how and where human ingenuity may help build a more resilient management system and mitigate future risk.
Generally, the SA meteorological droughts are largely determined by the failure of the South Asian Summer Monsoon (SASM; June to September), given that it provides 78% of the total annual rainfall, which is a lifeline for the billions of people across this region [3]. The interannual to decadal variabilities of the SASM precipitation is linked with the large-scale oceanic and atmospheric circulations in the region, particularly the multivariate El-Niño Southern Oscillation (ENSO), Pacific Decadal Oscillation (PDO), and the Indian Ocean Dipole (IOD) [11,12]. The weakening of the SASM can cause precipitation to decrease, leading to a meteorological drought condition, which, if prolonged, results in agricultural and hydrological droughts [3]. Drought risk in SA has been shifting under recent observed and projected climate [13]. However, little is known about their features and drivers in the recent past and a future warming climate. Thus, understanding the physical mechanisms causing meteorological drought events in SA has significant implications for predicting their occurrence and characterizing their effects on interrelated societal systems.
The warming climate in SA is expected to increase potential evapotranspiration (PET), causing a decrease in agricultural production [14,15]. Due to variations in precipitation and temperature, SA’s hydro-meteorology has already been affected [16]. According to the Intergovernmental Panel on Climate Change (IPCC) 6th Assessment Report, SA is recognized as a hotspot to hazards-prone region, where the warming climate has induced the risk of climatic extremes [17].
Numerous studies have reported the influence of climate change in SA, given a detailed understanding of the potential drought risk [18,19]. Moreover, the amplified temperature during the post-monsoon season poses an even greater challenge due to the reduction in precipitation therein. Mishra et al. (2020) [20] showed that increased surface air temperature during the post-monsoon season enhanced soil moisture and precipitation deficits across India, leading to the post-monsoon season being drier from 1951 to 2019. Human-induced alterations to the land surface also influence the hydrological cycle, affecting the timing and evolution of drought events [21]. Human influences on water storage and land surface properties alter local soil moisture, surface runoff, land–atmosphere interactions, and surface and subsurface water resources, affecting vulnerability to drought at multiple scales (i.e., environmental and water resources) [20]. Anthropogenic warming has significant influence on drought and soil moisture deficit [22,23]. The contributions of human activities to drought occurrence and severity in a changing climate must, therefore, be recognized, both to prepare for their impacts and to guide a more sustainable management of water resources.
Here, we examined the long-term variations in the trend of drought events and their possible linkages with vegetation and dynamic drivers across SA and its subregions. The present study also investigated the influence of PET, vapor pressure deficit (VPD), and vegetation estimation approaches, on the changing features of droughts, particularly the effects of extreme droughts (dryness/wetness) due to the diverse climate of SA. The remainder of this manuscript is structured as follows: Section 2 highlights the study domain and datasets, whereas Section 3 provides the analytical methodology. Section 4 discusses the feasibility and implications of our results. Finally, the conclusions and limitations are presented in Section 5.

2. Materials and Methods

2.1. Study Domain

The study domain comprises eight countries: India, Pakistan, Afghanistan, Bangladesh, Nepal, Bhutan, Maldives, and Sri Lanka. SA is situated in the southern part of the Asian continent with geographical coordinates of 5.5°–39.5°N latitudes and 60.5°–99.5°E longitudes. It has a multifaceted topography covering an area of 5,135,752 km2 (see Figure 1a). The region spans a diversity of climatic and geographical types, i.e., arid, drylands and deserts, tropical and subtropical, humid, alpine, and mountain climates and regions (Figure 1b).
Climatologically, arid to semi-humid climate types characterize the region. Precipitation in SA is mostly dependent on monsoon during the summer season, where more than 75% of the annual precipitation is received [3]. Temperatures vary from around 5 °C in higher altitude regions during the cold season to around 50 °C on the lowland plain during the warm season [7]. SA and its subregions were declared as a hotspot for climate change, and play a vital role in neighboring countries’ socioeconomic development. The climate of SA is heavily affected by both the SASM and the southern branch of the mid-latitude westerlies that bifurcate around the western edge of the Tibetan Plateau [24]. This multifaceted climate background sets the stage for complex compound interactions among temperature, precipitation, runoff, evapotranspiration, and glacial melt, all of which contribute to water resource availability and its variability in the region [25]. Extreme rainfall during the monsoon season can trigger floods and landslides, while declines in winter precipitation are likely enhance water scarcity and drought risk within the region [26,27].

2.2. Data Sets

The present study used a 30 m high-resolution digital elevation model (DEM) from the Shuttle Radar Topography Mission (SRTM) of the US National Aeronautics and Space Administration (NASA), to show the topography of the target region (Figure 1a). The land use/cover change (LULC) map for 2018 at a 20 m high resolution was obtained from the European Space Agency Climate Change Initiative (ESACCI) [28], see Figure 1b. For climate variables, the high resolution ( 0.25 ° ) daily precipitation was acquired from the Climate Hazards Group Infrared Precipitation with Stations (CHIRPS) version 2 product, from 1981 to the present [29]. The daily CHIRPS precipitation dataset has been used widely for different meteorological applications, for instance, the assessment of precipitation extremes and their features in many parts of the globe [30]. CHIRPS merges the satellite-based precipitation estimates with ground observations and models of terrain-based precipitation alteration to provide high resolution, spatially complete, and long-term continuous data (1981 to present). The dataset benefits from rain observation-based datasets characterized by sparser station density and remotely sensed rainfall products with limited temporal coverage. The observed minimum and maximum temperature products were collected from the Climate Prediction Center (CPC) at a spatial resolution of 0.5 ° [31]. This study employed CHIRPS and CPC datasets to illustrate the observed climatology of the region; however, both datasets strictly follow the World Meteorological Organization (WMO) Standard [32]. In developing the latest CHIRPS and CPC database, different quality-control techniques, such as removing outliers, omitting short records, and exceeding the anomalies values, have been applied [10]. For better validation and accuracy in the new version of the CHIRPS and CPC database, the angular distance weighting (ADW) technique has been employed after extensive testing of alternative techniques [30]. In addition, the Global Land Evaporation and Amsterdam Model (GLEAM) covers all compositions of evapotranspiration, i.e., PET, evaporative stress factor, actual evaporation (AET), root-zone soil moisture, and many more. The GLEAM is a combination of multi-algorithms that individually assess the diverse components of evapotranspiration together with multi-satellite observations [33]. The GLEAM PET product was obtained from the Priestley–Taylor algorithm based on surface air temperature and surface radiation from multi-reanalysis products. Thus, the current study uses the latest version of PET from GLEAM at 0.25 ° resolution from 1980 to date.
To explore the spatiotemporal distributions of vegetation and their responses to dryness/wetness conditions, we used the U.S. NOAA Advanced Very High-Resolution Radiometer (AVHRR) Normalized Difference Vegetation Index (NDVI) daily product at 0.083 ° spatial resolution [34]. The NDVI data employed in this study have a temporal coverage from 1981 to the present. This study used monthly precipitation, air temperature (maximum and minimum), relative humidity, wind components, latent and sensible heat fluxes, and surface air pressure from ERA5 to estimate the drought index from 1979 to 2020. The recently developed European Centre for Medium-Range Weather Forecasts (ECMWF) a global reanalysis product (ERA-5) was used in the current study [35]. Available water content (AWC) of soil was collected from the Harmonized World Soil Database (HWSD) [36]. To study the influences of dynamic drivers on vegetation, VPD, and drought evolution, the Indian Ocean Dipole (IOD) and the Nino-3.4 sea surface temperature (SST) indices were collected from https://psl.noaa.gov/data/climateindices/list/, accessed on 10 January 2022. El Niño–Southern Oscillation (ENSO) was calculated by employing the area-weighted average SST anomalies over the (5°N–5°S, 120–170°W) Niño 3.4 region.

3. Methods

3.1. Self-Calibrated Palmer Drought Severity Index (scPDSI)

We used the scPDSI as a state-of-the-art drought index to compute the intensity and frequency of extreme drought events over SA and its subregions. The scPDSI was developed using a simple two-layer water balance model [37], considering water supply (precipitation) and atmospheric water demand (PET). The precipitation, PET, and AWC of soil employed in scPDSI calculation need to be assessed under climatically suitable conditions [20]. The present study used the Penman–Monteith method for estimating the PET [19]. Long-term scPDSI series for the period 1981–2020 were considered using the tool provided by the PDSI [38], for which readers are referred to Jacobi et al. (2013) [38] and van der Schrier et al. (2013) [39]. According to the scPDSI dryness/wetness classification (scPDSI values range from –10 (dryness) to +10 (wetness)), values below –3 indicate severe to extreme droughts. However, in our analysis, minimum and maximum scPDSI values are limited to ±5 characterizing dryness and wetness conditions, respectively. A brief description of drought classification is presented in Table 1.

3.2. k-Means Algorithm

The present study employed a k-means algorithm for scPDSI data to better understand the drought evolution and frequency in the distinct subregions of SA. The k-means algorithm has various capabilities to minimize variability with the number of k clusters and maximize the variability of each centroid among all the data series [40,41]. The k-means algorithm provides a better partition result when many grids, for instance, more than 5600 points, are considered. Various studies prefer to use the k-means algorithm while dividing the diverse climate into subregions [41]. Therefore, for a detailed assessment of droughts, we selected four distinct subregions, namely, semi-arid (R-1), arid (R-2), subtropical wet (R-3), and tropical wet and dry (R-4) subregions across SA.

3.3. Trends Analysis

To estimate trends, this study used the nonparametric Mann–Kendall (MK) trend test, which is widely used to identify trends/changes in auto-correlated SPEI data for a hydro-meteorological time-series [42,43]. The MK test does not require normal distribution and is effective against outliers in the time-series. The presence of auto-correlation in the dataset could probably affect the trend detection. Thus, a secular trend estimator was utilized to deduct from the original time-series while estimating auto-correlation [44]. The nonparametric modified-MK test was then employed in the scPDSI time series and the trend estimate, with p-values < 0.05 were considered statistically significant. The current study used the nonparametric Theil Sen′s Slope (TS) test to assess the trend magnitude [45], while the Pettit test was also adopted to check the abrupt change points [46]. The TS estimator is a non-parametric statistical method for estimating the slope of a time series. Compared with other methods, the TS method shows strong robustness to the outliers over time series. Drought is a multifaceted natural hazard that changes with space and time. Thus, an inclusive understanding of drought requires studying its spatial variability. This study assessed the variation in magnitude for scPDSI data using the TS estimator for all the scPDSI grid points over SA. The black color dots were used to show the impact of the trend at a 0.05% significance level assessed using the MK test at each grid point in Figure 5.
To explore the interannual variability, this study also assessed precipitation, temperature, VPD, and NDVI anomalies, considering the spatially averaged annual values at each grid point. In our analysis, the negative values refer to dryness and vegetation stress, while positive values correspond to wetness and/or green vegetation. To enhance the robustness of our findings, we used a spatial correlation of various climate factors and drought index, i.e., precipitation, temperature, VPD, and NDVI, with associated dynamic drivers, i.e., ENSO and IOD, of the wetness and dryness coupling for the period of 1981–2020.

3.4. Vapor Pressure Deficit

In addition to precipitation, the other significant influencing factor of the scPDSI is the surface VPD, which was estimated based on the saturated vapor pressure (SVP) and the actual vapor pressure (AVP). Previous studies have highlighted that both drivers of surface VPD and soil moisture should be accounted for to explain and simulate recent observed changes in hydro–meteorological disasters (i.e., droughts) [47]. The VPD was calculated as the difference between SVP and AVP which were estimated based on the method given by Allen et al. (1994) [48]. The relative humidity used for the AVP calculation was acquired by employing Tetens’s formula [49] with the factors constructed on saturation conditions over water [50].

4. Results and Discussion

4.1. Observed Annual and Seasonal Trends of Precipitation and Temperature

Figure 1c–f show the spatiotemporal characteristics of long-term precipitation and temperature (i.e., annual and seasonal) changes over the four distinct subregions of SA from 1981 to 2020. The precipitation anomaly exhibited great variability from region to region due to the diverse climate of SA (Figure 1c). The annual precipitation anomaly was obvious in R-1 with an amount of −350 mm, while relatively more precipitation was seen in R-3, followed by R-2 and R-4. In the case of seasonal variations, precipitation in the Spring season, Summer season, and Winter season exhibited decreasing trends, which were −0.2 mm/year, −0.5 mm/year, and −0.3 mm/year, respectively, whereas Autumn showed an increasing trend with the amount of 0.2 mm/year. The annual trend of precipitation in SA was −0.9 mm/year (Figure 1e). These trends in seasonal precipitation show that the summer and winter seasons largely contributed to the change in annual precipitation. On the other hand, not all the trends in precipitation were statistically significant, except for that of the winter season.
In terms of climatological mean, R-4 had a relatively higher spatial temperature anomaly of 9.0 °C, followed by R-2 (6.0 °C), and R-3 (8.0 °C), while less temperature anomaly was observed in R-1 and the foothills of Himalayans, at a rate of 3.0 °C (Figure 1d). The annual and seasonal mean temperatures showed strong and significant warming in the recent past across SA and its subregions (Figure 1d,f). Seasonal mean temperature exhibited the largest increasing trend during the spring season at a rate of 0.03 °C/year, and summer saw the smallest warming trend. Furthermore, all the upward trends were statistically significant at the 99% level (Figure 1f). Interestingly, the present study also witnessed increasing trends of warm temperature events in the southwestern and northeastern parts of the regions, which agreed with the findings of previous studies in the same regions [51,52]. The upsurge of frequency, intensity, and extent of daily warm extreme temperature and decline of extreme cold temperature may occur in parts of the world, resulting in the escalation of length and intensity of warm period or a heatwave in most land areas [3,5,53,54].

4.2. Anomalous Changes in Different scPDSI Drivers

Figure 2 presents the spatial patterns of drought and its main influencing factors that include scPDSI (2a), PET (2b), VPD (2c), and NDVI (2d) across SA for the period 1981–2020, while regional percentage changes are shown in Figure 2e, respectively. For scPDSI (Figure 2a), the drying tendency was pronounced, with maximum intensity over R-2, R-3, and R-4, where a noticeable rise in mean temperature and decline in precipitation was observed in those regions (Figure 1c,d). Interestingly, scPDSI indicated a significant drying trend over large areas of all subregions, especially in southern Pakistan, eastern Afghanistan, northern and inner parts of India, as well as the eastern part of Bangladesh. The study region is vulnerable to climate change, and a sharp temperature rise will further accelerate the melting of glaciers in the region [52]. Recent studies have suggested that if global warming was measured below 1.5 °C, the temperature upsurge in the foothills of Himalayan and Thar deserts regions could be at least 0.8 °C higher than the global average [55,56]. For PET, an obvious increasing pattern was observed over R-3 and R-4, followed by R-1 and R-2, suggesting more drying trends in these regions. On the other hand, the dry spatial anomalies for PET (10 to 15 mm/month) were obvious in most SA subregions except R-1. The results showed that the sub-tropical westerly jets frequently appeared during dry anomalies, which are expected to bring dry and cold air into the northern parts of SA, resulting in lower precipitation and higher evaporation. Therefore, the regions observed a decline in precipitation and a rise in PET in the recent past, implying a strong effect of regional oceanic and atmospheric circulation patterns, i.e., monsoon onset and easterly/westerly systems [11,57].
To document the reason beyond the scPDSI drying pattern, we further assessed the spatial distribution of VPD as a potential indicator for the period 1981 to 2020 (Figure 2c). We found that VPD had increased across most SA subregions, particularly in R-3 and R-4, due to a significant increase in temperature. The spatially anomalously high VPD contents were obvious over southern SA, including India, Sri Lanka, and Bangladesh, with enhanced VPD due to higher air temperature. In the case of NDVI anomalies (Figure 2d), the positive NDVI values were obvious over the arid, semi-arid, and subtropical regions in most drought-prone regions. This finding is consistent with spatially drying conditions observed in previous studies [3,58], which described that water scarcity was one of the main influencing factors of spatial variations in vegetation greenness over these regions.
Regional percentage changes in influencing factors across different subregions of SA were presented using boxplots from 1981 to 2020 (Figure 2e). PET exhibited the highest upsurge, followed by NDVI and VPD with a relatively slight change. The regional temporal changes further justified the spatial results for influencing factors to drought conditions in these regions. However, PET and NDVI observed the highest percentage changes, while slight variations were observed in VPD, suggesting having fewer effects than the rest of the variables. Conversely, the relative percentage changes in influencing factors demonstrated that the observed drought conditions were subjected to an upsurge by 45%, 65%, and 85% for PET and NDVI with extreme severe drought events in recent decades, respectively. Overall, it can be concluded from the results that the influencing factors (e.g., temperature, VPD, and NDVI) rapidly increased over major parts of SA, which could be more vulnerable to extreme droughts and temperature extreme events in the near future, due to rapid urbanization, population growth, and human-induced activities.

4.3. Observed Spatiotemporal Changes in Drought Events

The spatial distributions of moderate and extreme drought intensity and frequency over SA and its subregions are presented in Figure 3. Here, we considered the drought intensity and frequency over the total number of months, indicating the scPDSI values smaller than −2 (moderate) and/or greater than −4 (extreme). Thus, we only considered the months of scPDSI with the threshold <–2 and >–4 as moderate drought, and that of scPDSI with the threshold <–4 as extreme drought. In Figure 3a,b, R-2, R-3, and R-4 observed moderate drought intensity (−4.5), while reciprocal results over these subregions experienced extreme drought intensity with amounts of −6.0 to −4.5.
In terms of drought frequency, moderate drought frequency was observed about five to seven times per year in R-2 and R-3, followed by R-1 and R-4 with relatively less drought frequency. A similar pattern was seen for those subregions, but extreme drought frequency was observed with the amount of 14 to 20, respectively (see Figure 3c,d). The dominant pattern of extreme drought revealed a significant frequency in R-2, R-3, and R-4, which is in line with previous studies [25,59]. In addition, SA experienced a high frequency of severe droughts in R-2 and R-3. It is worth mentioning that extreme drought intensity and frequency in R-2 and R-3 were relatively sharper than in other subregions. Remarkably, the peak of drought frequency was observed in R-2, which is vulnerable to climate change, and a sharp temperature rise would further accelerate the extreme drought events in the region [60].
To assess the temporal and spatial pattern of drought intensity (moderate and extreme) trends at each grid point, we investigated the regional trend in drought intensity for the four subregions of SA over the study period (see Figure 4). In R-1 (Figure 4a), extreme drought intensity detected a significant drying trend for both moderate and extreme drought intensity, suggesting that drought intensity had significantly increased over the recent past. However, the extreme drought intensity appeared to have largely increased since 2018. Similar patterns were seen in R-2 (Figure 4b), indicating an overall drying trend in moderate and extreme drought intensity during the study period, implying more intensified drought severity in a changing climate. The current study results align with the previous literature that detected allied patterns in these regions [57,61]. During R-3 (Figure 4c), drying trends were observed for both the moderate and extreme drought intensity values during the first two decades (from 1981 to 2000). R-4 (Figure 4d) depicted the sharpest drying trend for moderate values, while the highest drying trends appeared for extreme drought since the 2000s. Recently, numerous researchers found pronounced decreasing trends in annual precipitation over the mountainous regions (i.e., Hindu Kush and foothills of the Himalayans) [62,63].

4.4. Observed Drought Trends over Space and Time

To understand how drought events represent the spatial patterns of trends across SA and its subregions, we estimated pixel-wise spatial distributions of scPDSI trends using MK and TS estimators over the period 1981–2020 (Figure 5). A pronounced drying trend was obvious in R-1, R-3, and R-4 at the rate of −4.5, −4.0, and −3.5/year (Figure 5a), while a relatively less wetting trend was observed in R-2 at the rate of 1.5/year. Interestingly, a sharp drying trend appeared with increasing drought intensity over the Hindu Kush and foothills of the Himalayans at a rate of −3.5/year. The results of the MK trends consistently matched the findings of the TS estimator (Figure 5b), indicating almost similar patterns over these regions. In SA and its subregions, therefore, the drying trends were obvious and significant for most areas, which could be due to increased temperature in recent decades over the region.
The regional average drought time-series in the four subregions of SA further reaffirm the spatial patterns of trends shown above (Figure 6). The time series revealed abrupt drying patterns with intensified droughts from 2000 to 2020 in R-1 and R-2, whereas R-3 observed a relatively less drying trend, and R-4 even showed a wetting trend over the 40-year period. Similar findings were reported in previous studies over the regions [3,5]. The previous works attributed the regional drying to the warming climate and/or fewer changes in precipitation. Other studies by Ehsan et al. (2020) [16] and Mishra et al. (2020) [20] suggested that R-2 (i.e., Pakistan, Afghanistan, and southwestern India), and R-4 (i.e., southern India) could face severe extreme temperatures by the mid-21st century. It is worth mentioning that R-1, R-2, and R-4 observed an abrupt increasing drying trend during the 2000s–2020s, which may have been caused by natural variability of the regional climate, and a rapid drought intensity/frequency shift in climate regime may occur in the future.

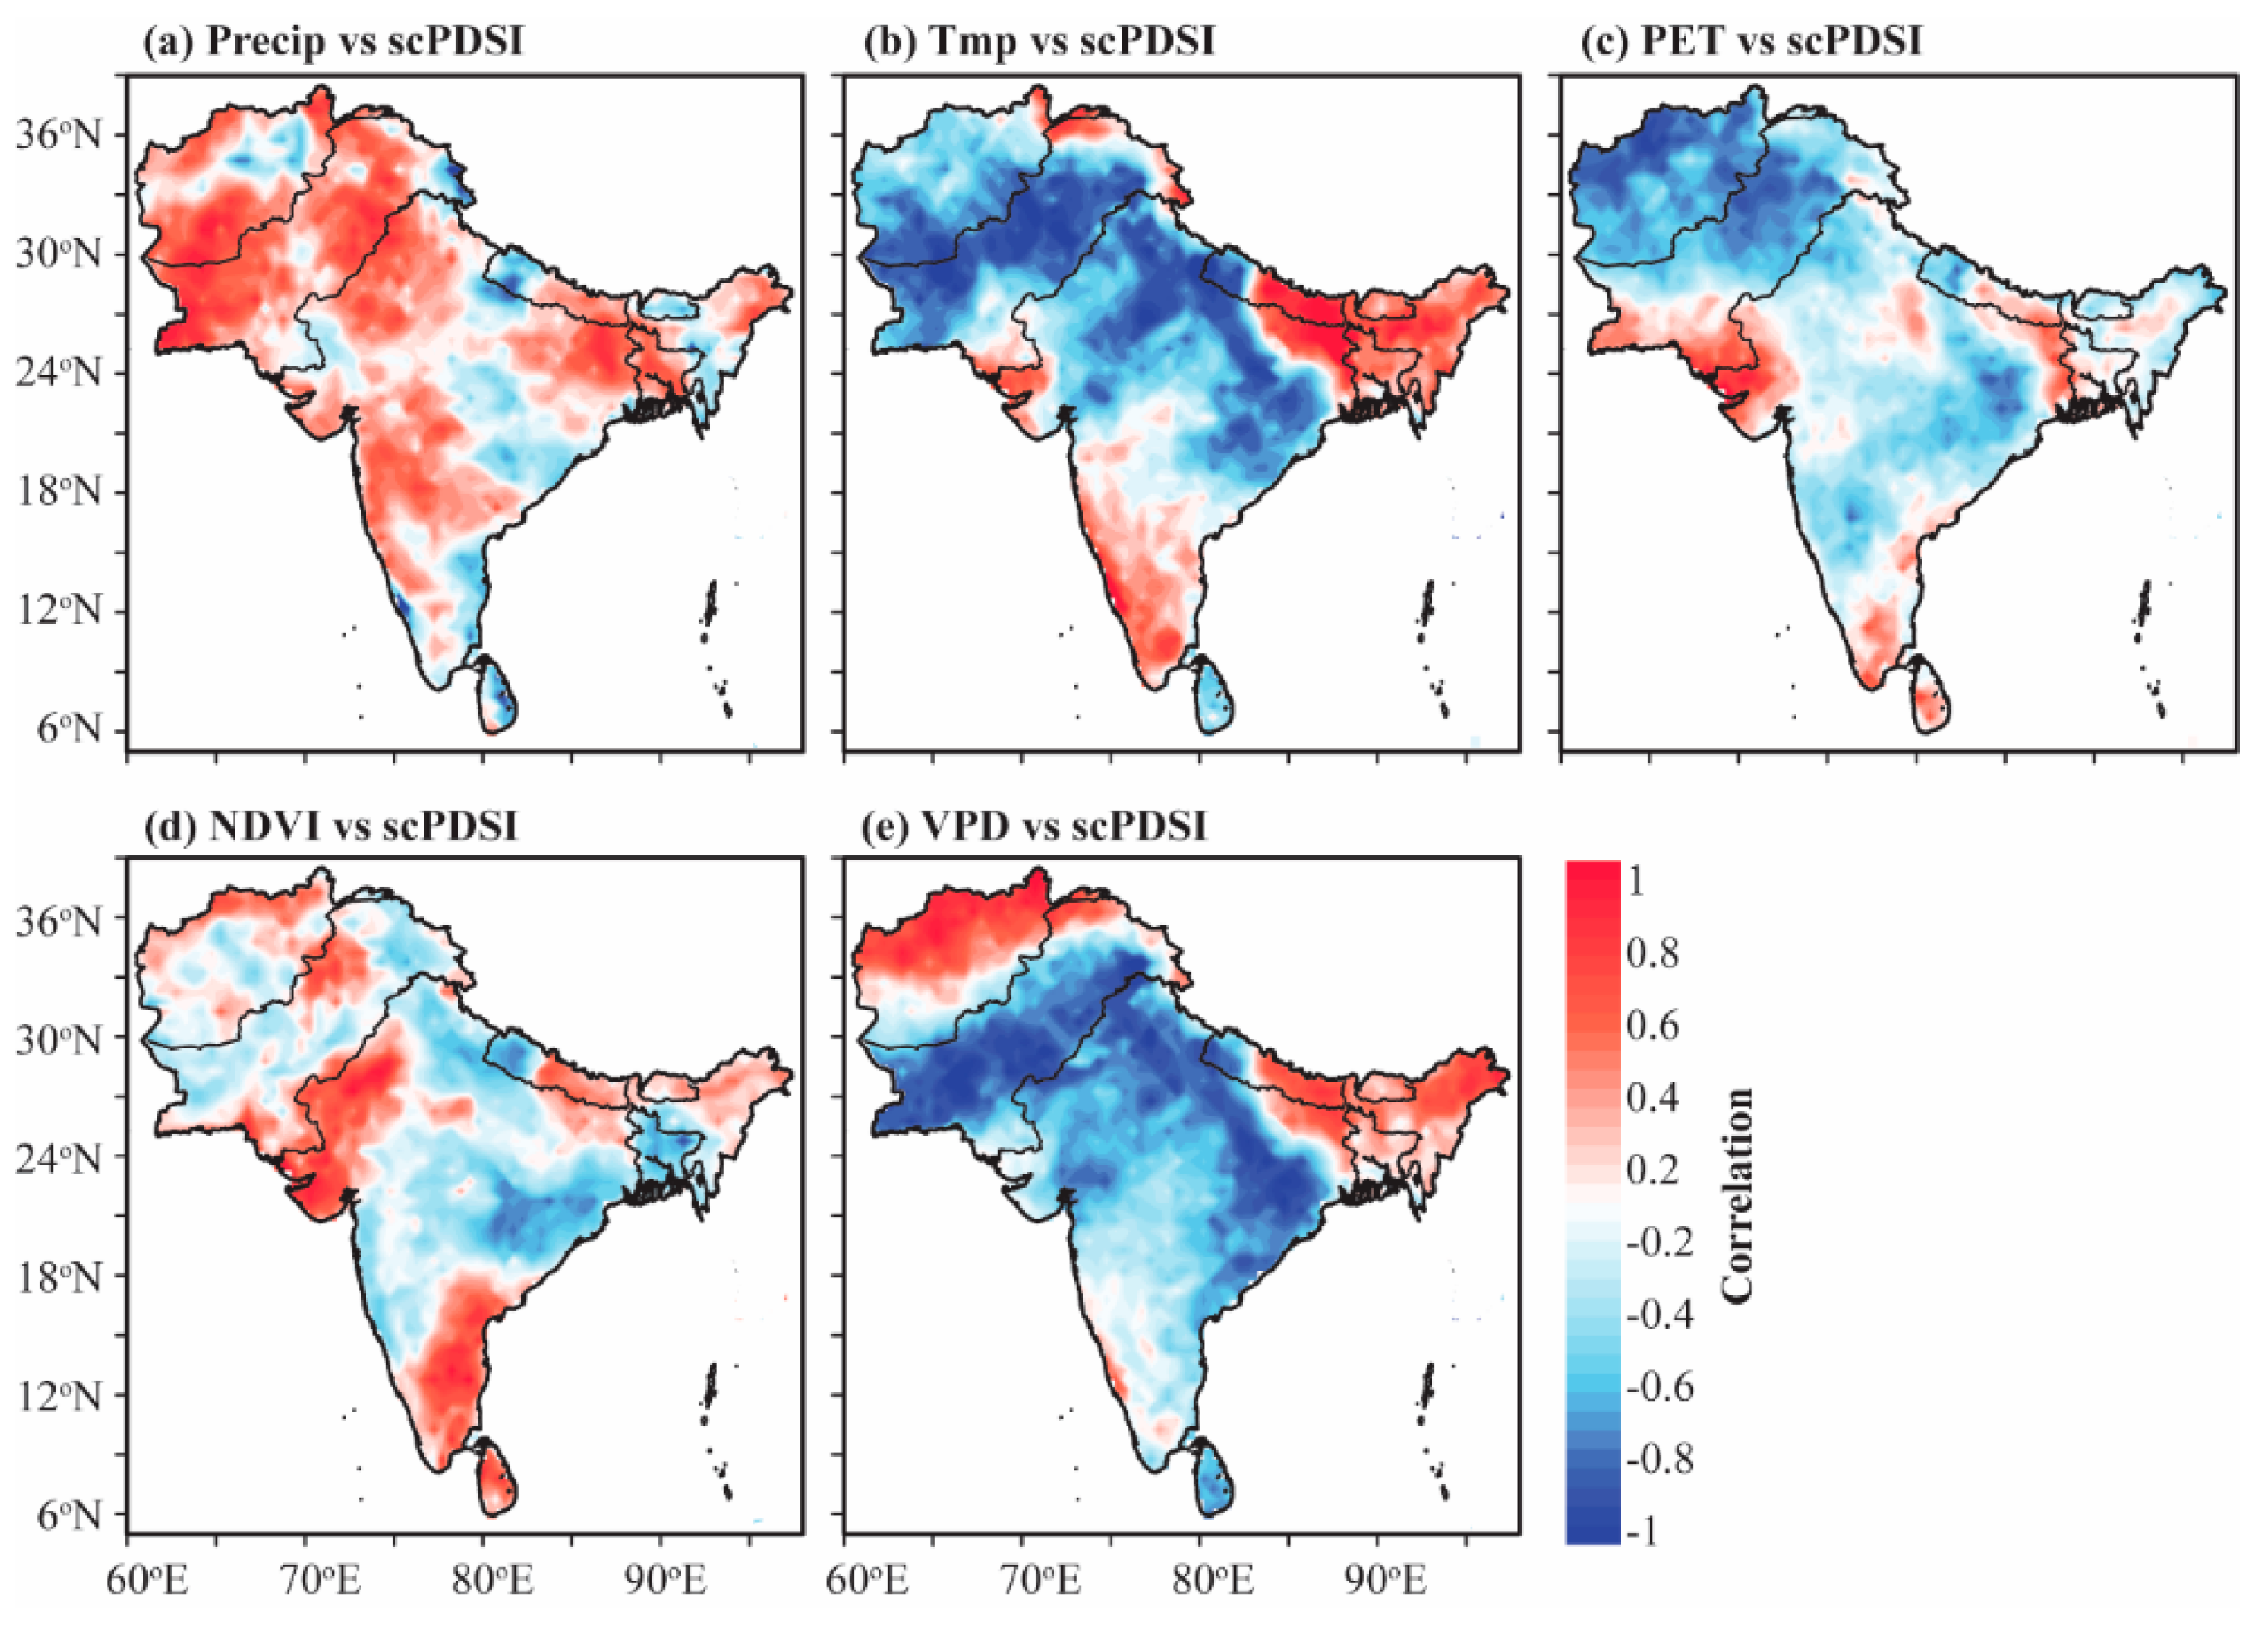
4.5. scPDSI Possible Linkages with Different Climate Factors and Dynamic Drivers

To understand more deeply, we further assessed the temporal variability of VPD, NDVI, PET, precipitation, and temperature as dominant climatic factors influencing drought events over the diverse subregions of SA (see Figure 7). Figure 7 depicts the interannual variation in VPD, NDVI, PET, precipitation, and temperature anomalies in four subregions of SA from 1981 to 2020, based on the regional averages at each grid. During VPD (Figure 7a–d), the interannual changes in VPD were more distinct over R-1 and R-2, followed by R-3 and R-4, respectively. For instance, the interannual VPD trend had declined over R-3 and R-4 in the initial epoch (i.e., during 1990–2000). The considerable decline in interannual VPD over these regions could be partly attributed to higher surface temperature and/or lesser changes in precipitation. However, highly fluctuating temporal variability was seen from region to region. It is worth stating that the interannual VPD pattern was leading to vapor pressure variability due to the regional precipitation dependency on soil moisture for precipitation. Moreover, we also found that the frequency of extreme surface VPD had decreased substantially during earlier epochs in R-4, whereas an increased frequency was seen during later epochs. Overall, the NDVI exhibited a declining trend in all of the climatic regions, especially in earlier decades. However, an extreme declining trend appeared in recent decades, suggesting that vegetation stress continued even after drought ended (Figure 7e–h). This finding is consistent with drying conditions observed in previous studies [64,65]; they found that in drought conditions in R-1, R-3, and R-4, water scarcity was one of the main drivers of variations in vegetation stress. It should be noted that these regions had witnessed frequent and intense climate extremes in the recent past, which can directly be accredited to the increasing trend of aridity and temperature [3,25].
In addition, PET, temperature, and precipitation are the major climatic factors of dryness/droughts that regulate the climate system from regional to global [25,64]. In Figure 7i–l, the regional precipitation pattern had exhibited vigorous changes with a consistent declining trend in the early period (1981–2000), while an inclining trend was observed in the latter period (2001–2020) of the study period. A similar pattern appeared for surface air temperature (Figure 7m–p), depicting sharp and accelerated regional temperature during the 1990s and onwards, suggesting the aggression of climate change in SA and its sub-climatic regions. Interestingly, in the latter decades (2001–2020), a significant increasing trend of surface temperature was revealed in R-1, R-3, and R-4 at the rate of 0.6 °C, 0.8 °C, and 0.9 °C/year, respectively. Results of this study further support the findings of previous studies [52,66,67,68], which described a significant decline in precipitation (10 to 15 mm/year), while the incline in air temperature (0.6 to 0.9 °C) detected drought/dry conditions in utmost parts of the study region. The temporal trend of PET observed an increasing pattern over many regions of SA except R-1, with higher intensity during 1981–2000 and severe extreme intensity during the period 2000–2020 (Figure 7q–t). However, the linear trend revealed that SA regional precipitation (PET) had enhanced at the rate of 5 (0.5) mm/year (R-1), 6 (0.4) mm/year (R-2), 8 (0.7) mm/year (R-3), and 10 (0.8) mm/year (R-4), respectively. It is worth mentioning that the simultaneous rise in surface air temperature and PET emphasized that surface air temperature had played a more escalating role than precipitation in the development of PET in the recent past. Though decadal change varied from region to region, the SA precipitation abruptly declined, which could possibly have an important role in intensifying the development of PET. To summarize, it can be concluded that both precipitation and temperature had largely influenced PET in diverse regions of the target region, which could have ultimately affected the inclination of SA droughts in the study regions.
We further explored the linkages between droughts (scPDSI) and hydroclimatic and vegetation variables; we examined the spatial variations in climate forcing and determined its relationship with regional droughts. We assessed the nexus between drought and temperature, precipitation, PET, VPD, and NDVI for the period 1981–2020 (Figure 8) to better understand their controlling roles. The results of the study indicated that the scPDSI spatial correlation with precipitation was expected, as precipitation participated in scPDSI computation, and the contribution of precipitation is accounted for in the model (Figure 8a). Nevertheless, using different aspects of precipitation to explore drought’s relationships serves as a further verification step for the drought. With this aim, we computed the sensitivity of drought to precipitation changes for each grid point. However, an inverse correlation pattern appeared for temperature, and PET exhibited a negative correlation (−0.6 to −0.8) over those regions, where a positive correlation (0.6) appeared in R-4 for both temperature and PET (Figure 8b,c). The regions that revealed a strong negative association between drought and temperature and PET, indicated that the extent of correlation fluctuated from region to region due to a significant increase in temperature, particularly over SA. Interestingly, many regions of SA had revealed a strong positive correlation (0.6 to 1) between precipitation and drought index, including R-1, R-2, and R-3 (Figure 8a). Similarly, in NDVI (Figure 8d), correlation patterns changed as expected with the same significance and order of magnitude as in precipitation and PET. Our results support the findings of Hussain et al. (2017) [69], who reported that precipitation favored vegetation growth, and drought events may disturb vegetation growth over the target regions. For VPD (Figure 8e), the study also found a decline in VPD over R-2, R-3, and R-4 during the same period; however, a substantial positive association between scPDSI and VPD was observed in R-1 at the rate of 0.8, respectively.
The results showed that the depletion in precipitation and soil moisture led to an escalation in VPD, decreasing vegetation growth. Moreover, decoupling of precipitation and surface VPD could separately intensify the energy [65,70]. Atmospheric VPD and surface air temperature were negatively associated in the majority of subregions of SA, mostly determined by land–atmospheric trajectories [70]. Thus, in regions where surface VPD and air temperature were negatively associated (e.g., R-2, R-3, and R-4), the land–atmospheric trajectories influenced dry and hot extremes [71,72]. For example, low precipitation and high temperature led to concurrent extreme events [20].
Next, we studied changes in the effect of ENSO and IOD on the scPDSI variability in the study regions (see Figure 9a–c). The extent and spatial distribution of relationships between the multi-variate ENSO index and the NDVI were largely similar in R-2, R-3, and R-4, with a few exceptions. Regions with a substantial correlation between ENSO and NDVI showed considerable decrease for R-2, R-3, and R-4 (from −0.6 to −1) and increase for R-1 (from 0.6 to 0.8), respectively. The ENSO spatial correlations showed stronger dry conditions over R-2, R-3, and R-4 during NDVI and scPDSI. However, wet conditions also exhibited strengthening over R-1 during ENSO (Figure 9a–c). In contrast, the VPD revealed a relatively higher spatial correlation with the ENSO index in most of the target regions (Figure 9c). Results indicated that ENSO patterns affected a similar area within most regions with enhanced magnitudes in all climate indicators, which inferred that the variability of ENSO interconnection remained largely static with warming [62,73]. Given the dominant role of multivariate ENSO events in determining drought events in a warmer climate, these findings emphasized the significance of the current ENSO–drought association and the related mechanisms [69,74,75]. For instance, the dynamic variabilities in SASM precipitation usually resulted in extreme wet and dry episodes, leading to flooding and drought events, respectively, with devastating socio-economic impacts [10]. The magnitude and onset timing of monsoon precipitation are uncertain, which often results in extreme events such as droughts and floods in SA regions [69,74].
During IOD (Figure 9d–f), our results revealed an extensive and consistent negative correlation of the IOD anomalies (e.g., R-2, R-3, and R-4) and a positive correlation of the IOD anomalies (e.g., R-1) with NDVI, scPDSI, and VPD, respectively, implying that IOD patterns were contributing to droughts in these regions. On the contrary, we also found that the IOD and drought index had a diverse impact across these regions. For example, the IOD positively correlated with the drought index in R-1, but a negative correlation was observed in R-2, R-3, and R-4. This indicated that the positive phase of IOD conditions promoted droughts over R-1. For example, El Niño conditions may co-occur with the positive phase of IOD as they tend to determine warmer SSTs over the southeastern Indian Ocean and cooler SSTs over the southern Indian ocean through the atmospheric bridge and oceanic Indonesia through-flow [75,76,77,78,79,80,81]. The study did not negate the potential impact of large-scale oceanic indices but rather postulated the hypothesis that these controls need to be reviewed with clear links toward drought variability over SA and its subregions. Another possible reason could be the quality of gridded datasets, since it is recorded for synoptic-scale use, and climatological processes usually occur on longer-time scales, thus it may lack such large-scale signals. The present study has attempted only long-term statistical composites and is subjected to limitations. Hence, a comprehensive numerical experimental validation is required to further investigate the multifaceted connection of these parameters at play. Furthermore, though the oceanic variability may have little influence, the effect of Tibetan Plateau thermodynamics and Himalayan thermal controls can be deeply examined. Thus, a detailed investigation is required to understand how the positive phase of IOD and oceanic modes interrelate with El Niño to affect drought features over diverse regions such as SA and, as a result of compound heatwaves and droughts.

5. Conclusions

Droughts are linked mainly to ecological, environmental, and social factors. Given the cumulative regional and global interconnections of socioeconomic systems, understanding the recent observed features of droughts and their potential dynamic drivers in a warmer climate is key for a wide range of interrelated climate sensitive factors. The present study examined the spatiotemporal variability of long-term droughts and their characteristics over SA and its diverse climatic regions during 1981–2020. To explore different climate influencing factors and vegetation changes, we assessed the drought variability in response to temperature, precipitation, PET, NDVI, and VPD, at each grid point over the same period. To better understand the effect of teleconnections on drought evolution, this study used ENSO and IOD as potential dynamic drivers during 1981–2020.
Results indicated that drought severity and frequency fluctuated from region to region. However, significant severe droughts were observed in R-4, followed by R-2 and R-3, with more frequent droughts during 1981–2020. In terms of temporal trend, we also found significant prolonged drying trends in R-2, R-3, and R-4, which further clarified the spatial drying patterns over those regions; however, a relatively wetting trend was observed in R-1, for both, over space and time. Generally, our results showed a significant effect of surface air temperature, PET, NDVI, and VPD on drought events in several regions of SA. Precipitation had substantially declined, while NDVI and PET had increased extensively over R-2, R-3, and R-4, from 1981 to 2020. Additionally, VPD had increased in many subregions of SA due to a substantial upsurge in surface air temperature, particularly in R-2 and R-4. In addition, the correlations between drought index and climate influencing factors were relatively stronger than 0.8 for nearly 80% of the grid points, which included most of the regions where the variations in the means of monthly accumulated PET and VPD values depicted large changes. Generally, a strong positive correlation was found between drought index, precipitation, and NDVI across R-1, R-2, and R-4, whereas temperature, PET, and VPD exhibited a negative correlation over these regions except R-4, respectively. However, no obvious connection was detected with ENSO events, or IOD and drought onset timing, as explored for certain regions of SA, especially R-3 and R-4. The findings deduced the probability that the precipitation variability over these regions had an insignificant relationship with ENSO, IOD, and drought evolution. The trend in temperature and precipitation could be due to extreme climatic events being the driver, namely, their particular magnitude, frequency, and intensity during each month. Thus, future work can consider prospective lead–lag interactions between multivariate ENSO and precipitation in space and time compound drought and heatwave analyses.

Author Contributions

Conceptualization, I.U. and X.M.; methodology, I.U.; software, I.U.; validation, I.U., X.M. and G.R.; formal analysis, I.U.; investigation, X.M.; resources, X.M.; data curation, K.L.; writing—original draft preparation, I.U.; writing—review and editing, G.R., Y.X., V.I., S.S. and V.P.S.; visualization, X.M.; supervision, X.M. and J.Y.; project administration, X.M.; funding acquisition, X.M. All authors have read and agreed to the published version of the manuscript.

Funding

The National Natural Science Foundation of China (grant/award number: 41877158) supported the present study.

Data Availability Statement

Not applicable.

Acknowledgments

All co-authors are extremely obliged to all remote sensing and reanalysis products suppliers and their staff for developing and upholding the websites used in the existing study. We would like to thank two anonymous reviewers for their valuable time and courtesy.

Conflicts of Interest

All authors declare no conflict of interest.

References

  1. Milly, P.C.D.; Dunne, K.A. Potential evapotranspiration and continental drying. Nat. Clim. Chang. 2016, 6, 946–949. [Google Scholar] [CrossRef]
  2. Van Der Schrier, G.; Jones, P.D.; Briffa, K.R. The sensitivity of the PDSI to the Thornthwaite and Penman-Monteith parameterizations for potential evapotranspiration. J. Geophys. Res. Atmos. 2011, 116, 1–16. [Google Scholar] [CrossRef]
  3. Aadhar, S.; Mishra, V. A substantial rise in the area and population affected by dryness in South Asia under 1.5 °C, 2.0 °C and 2.5 °C warmer worlds. Environ. Res. Lett. 2019, 14, 114021. [Google Scholar] [CrossRef]
  4. Miyan, M. Droughts in Asian Least Developed Countries: Vulnerability and sustainability. Weather Clim. Extrem. 2015, 7, 8–23. [Google Scholar] [CrossRef] [Green Version]
  5. Ullah, I.; Saleem, F.; Iyakaremye, V.; Yin, J.; Ma, X.; Syed, S.; Hina, S.; Asfaw, T.G.; Omer, A. Projected Changes in Socioeconomic Exposure to Heatwaves in South Asia Under Changing Climate. Earth’s Future 2022, 10, 1–19. [Google Scholar] [CrossRef]
  6. Iyakaremye, V.; Zeng, G.; Yang, X.; Zhang, G.; Ullah, I.; Gahigi, A.; Vuguziga, F.; Asfaw, T.; Ayugi, B. Increased high-temperature extremes and associated population exposure in Africa by the mid-21st century. Sci. Total Environ. 2021, 790, 148162. [Google Scholar] [CrossRef]
  7. Shahzaman, M.; Zhu, W.; Bilal, M.; Habtemicheal, B.; Mustafa, F.; Arshad, M.; Ullah, I.; Ishfaq, S.; Iqbal, R. Remote Sensing Indices for Spatial Monitoring of Agricultural Drought in South Asian Countries. Remote Sens. 2021, 13, 2059. [Google Scholar] [CrossRef]
  8. Masson-Delmotte, V.; Zhai, P.; Pirani, A.; Connors, S.L.; Péan, C.; Berger, S.; Caud, N.; Chen, Y.; Goldfarb, L.; Gomis, M.I.; et al. Climate Change 2021: The Physical Science Basis. Contribution of Working Group I to the Sixth Assessment Report of the Intergovernmental Panel on Climate Change; IPCC: Geneva, Switzerland, 2021.
  9. Aadhar, S.; Mishra, V. On the Projected Decline in Droughts Over South Asia in CMIP6 Multimodel Ensemble. J. Geophys. Res. Atmos. 2020, 125, 1–18. [Google Scholar] [CrossRef]
  10. Shahzaman, M.; Zhu, W.; Ullah, I.; Mustafa, F.; Bilal, M.; Ishfaq, S.; Nisar, S.; Arshad, M.; Iqbal, R.; Aslam, R.W. Comparison of Multi-Year Reanalysis, Models, and Satellite Remote Sensing Products for Agricultural Drought Monitoring over South Asian Countries. Remote Sens. 2021, 13, 3294. [Google Scholar] [CrossRef]
  11. Ullah, I.; Ma, X.; Yin, J.; Saleem, F.; Syed, S.; Omer, A.; Habtemicheal, B.A.; Liu, M.; Arshad, M. Observed changes in seasonal drought characteristics and their possible potential drivers over Pakistan. Int. J. Climatol. 2022, 42, 1576–1596. [Google Scholar] [CrossRef]
  12. Hina, S.; Saleem, F.; Arshad, A.; Hina, A.; Ullah, I. Droughts over Pakistan: Possible cycles, precursors and associated mechanisms. Geomat. Nat. Hazards Risk 2021, 12, 1638–1668. [Google Scholar] [CrossRef]
  13. Aadhar, S.; Mishra, V. Increased drought risk in South Asia under warming climate: Implications of uncertainty in potential evapotranspiration estimates. J. Hydrometeorol. 2020, 21, 2979–2996. [Google Scholar] [CrossRef] [Green Version]
  14. Iyakaremye, V.; Zeng, G.; Ullah, I.; Gahigi, A.; Mumo, R.; Ayugi, B. Recent Observed Changes in Extreme High-Temperature Events and Associated Meteorological Conditions over Africa. Int. J. Climatol. 2022, 1–16. [Google Scholar] [CrossRef]
  15. Liu, M.; Ma, X.; Yin, Y.; Zhang, Z.; Yin, J.; Ullah, I.; Arshad, M. Non-stationary frequency analysis of extreme streamflow disturbance in a typical ecological function reserve of China under a changing climate. Ecohydrology 2021, 23, 1–20. [Google Scholar] [CrossRef]
  16. Ehsan, M.; Nicolì, D.; Kucharski, F.; Almazroui, M.; Tippett, M.; Bellucci, A.; Ruggieri, P.; Kang, I. Atlantic Ocean influence on Middle East summer surface air temperature. NPJ Clim. Atmos. Sci. 2020, 3, 5. [Google Scholar] [CrossRef] [Green Version]
  17. IPCC. Climate Change 2021: The Physical Science Basis; IPCC: Tokyo, Japan, 2021.
  18. Sein, Z.M.M.; Ullah, I.; Iyakaremye, V.; Azam, K.; Ma, X.; Syed, S.; Zhi, X. Observed spatiotemporal changes in air temperature, dew point temperature and relative humidity over Myanmar during 2001–2019. Meteorol. Atmos. Phys. 2022, 134, 7. [Google Scholar] [CrossRef]
  19. Dai, A. Hydroclimatic trends during 1950–2018 over global land. Clim. Dyn. 2021, 56, 4027–4049. [Google Scholar] [CrossRef]
  20. Mishra, V.; Thirumalai, K.; Singh, D.; Aadhar, S. Future exacerbation of hot and dry summer monsoon extremes in India. Npj Clim. Atmos. Sci. 2020, 3, 10. [Google Scholar] [CrossRef]
  21. Sun, Y.; Hu, T.; Zhang, X.; Li, C.; Lu, C.; Ren, G.; Jiang, Z. Contribution of Global warming and Urbanization to Changes in Temperature Extremes in Eastern China. Geophys. Res. Lett. 2019, 46, 11426–11434. [Google Scholar] [CrossRef] [Green Version]
  22. Piao, J.; Chen, W.; Wei, K.; Liu, Y.; Graf, H.F.; Ahn, J.B.; Pogoreltsev, A. An abrupt rainfall decrease over the Asian inland plateau region around 1999 and the possible underlying mechanism. Adv. Atmos. Sci. 2017, 34, 456–468. [Google Scholar] [CrossRef]
  23. Khan, R.; Gilani, H.; Iqbal, N.; Shahid, I. Satellite-based (2000–2015) drought hazard assessment with indices, mapping, and monitoring of Potohar plateau, Punjab, Pakistan. Environ. Earth Sci. 2020, 79, 1–19. [Google Scholar] [CrossRef]
  24. Arshad, M.; Ma, X.; Yin, J.; Ullah, W.; Liu, M.; Ullah, I. Performance evaluation of ERA-5, JRA-55, MERRA-2, and CFS-2 reanalysis datasets, over diverse climate regions of Pakistan. Weather Clim. Extrem. 2021, 33, 100373. [Google Scholar] [CrossRef]
  25. Zhou, J.; Jiang, T.; Wang, Y.; Su, B.; Tao, H.; Qin, J.; Zhai, J. Spatiotemporal variations of aridity index over the Belt and Road region under the 1.5 °C and 2.0 °C warming scenarios. J. Geogr. Sci. 2020, 30, 37–52. [Google Scholar] [CrossRef] [Green Version]
  26. Sein, Z.M.M.; Zhi, X.; Ullah, I.; Azam, K.; Ngoma, H.; Saleem, F.; Xing, Y.; Iyakaremye, V.; Syed, S.; Hina, S.; et al. Recent variability of sub-seasonal monsoon precipitation and its potential drivers in Myanmar using in-situ observation during 1981–2020. Int. J. Climatol. 2022, 42, 3341–3359. [Google Scholar] [CrossRef]
  27. Xing, Y.; Shao, D.; Liang, Q.; Chen, H.; Ma, X.; Ullah, I. Investigation of the drainage loss effects with a street view based drainage calculation method in hydrodynamic modelling of pluvial floods in urbanized area. J. Hydrol. 2022, 605, 127365. [Google Scholar] [CrossRef]
  28. Nicolai-Shaw, N.; Zscheischler, J.; Hirschi, M.; Gudmundsson, L.; Seneviratne, S.I. A drought event composite analysis using satellite remote-sensing based soil moisture. Remote Sens. Environ. 2017, 203, 216–225. [Google Scholar] [CrossRef]
  29. Zhong, R.; Chen, X.; Lai, C.; Wang, Z.; Lian, Y.; Yu, H.; Wu, X. Drought monitoring utility of satellite-based precipitation products across mainland China. J. Hydrol. 2019, 568, 343–359. [Google Scholar] [CrossRef]
  30. Funk, C.; Peterson, P.; Landsfeld, M.; Pedreros, D.; Verdin, J.; Shukla, S.; Husak, G.; Rowland, J.; Harrison, L.; Hoell, A.; et al. The climate hazards infrared precipitation with stations—a new environmental record for monitoring extremes. Sci. Data 2015, 2, 150066. [Google Scholar] [CrossRef] [Green Version]
  31. Guo, H.; Bao, A.; Liu, T.; Ndayisaba, F.; Jiang, L.; Zheng, G.; Chen, T.; De Maeyer, P. Determining variable weights for an Optimal Scaled Drought Condition Index (OSDCI): Evaluation in Central Asia. Remote Sens. Environ. 2019, 231, 111220. [Google Scholar] [CrossRef]
  32. Golian, S.; Javadian, M.; Behrangi, A. On the use of satellite, gauge, and reanalysis precipitation products for drought studies. Environ. Res. Lett. 2019, 14, 75005. [Google Scholar] [CrossRef]
  33. Miralles, D.G.; Holmes, T.R.H.; De Jeu, R.A.M.; Gash, J.H.; Meesters, A.G.C.A.; Dolman, A.J. Global land-surface evaporation estimated from satellite-based observations. Hydrol. Earth Syst. Sci. 2011, 15, 453–469. [Google Scholar] [CrossRef] [Green Version]
  34. Kalnay, E.; Kanamitsu, M.; Kistler, R.; Collins, W.; Deaven, D.; Gandin, L.; Iredell, M.; Saha, S.; White, G.; Woollen, J.; et al. The NCEP/NCAR 40-year reanalysis project. Bull. Am. Meteorol. Soc. 1996, 77, 437–472. [Google Scholar] [CrossRef] [Green Version]
  35. Hersbach, H.; Bell, B.; Berrisford, P.; Horányi, A.; Sabater, J.; Nicolas, J.; Radu, R.; Schepers, D.; Simmons, A.; Soci, C.; et al. Global reanalysis: Goodbye ERA-Interim, hello ERA5. ECMWF Newsl. 2019, 159, 17–24. [Google Scholar]
  36. Gidden, M.J.; Riahi, K.; Smith, S.J.; Fujimori, S.; Luderer, G.; Kriegler, E.; van Vuuren, D.P.; van den Berg, M.; Feng, L.; Klein, D.; et al. Global emissions pathways under different socioeconomic scenarios for use in CMIP6: A dataset of harmonized emissions trajectories through the end of the century. Geosci. Model Dev. 2019, 12, 1443–1475. [Google Scholar] [CrossRef] [Green Version]
  37. Palmer, W.C. Meteorological Drought; Research Paper No. 45; U.S. Weather Bureau: Washington, DC, USA, 1965; 58p.
  38. Jacobi, J.; Perrone, D.; Duncan, L.L.; Hornberger, G. A tool for calculating the Palmer drought indices. Water Resour. Res. 2013, 49, 6086–6089. [Google Scholar] [CrossRef]
  39. van der Schrier, G.; Barichivich, J.; Briffa, K.R.; Jones, P.D. A scPDSI-based global data set of dry and wet spells for 1901–2009. J. Geophys. Res. Atmos. 2013, 118, 4025–4048. [Google Scholar] [CrossRef]
  40. Gupta, V.; Jain, M. Investigation of multi-model spatiotemporal mesoscale drought projections over India under climate change scenario. J. Hydrol. 2018, 567, 489–509. [Google Scholar] [CrossRef]
  41. Yang, Y.; Gan, T.; Tan, X. Spatiotemporal changes of drought characteristics and their dynamic drivers in Canada. Atmos. Res. 2020, 232, 104695. [Google Scholar] [CrossRef]
  42. Bevan, J.; Kendall, M. Rank Correlation Methods. Statistics 1971, 20, 74. [Google Scholar] [CrossRef]
  43. Mann, H.B. Nonparametric Tests Against Trend. Econometrica 1945, 13, 245–259. [Google Scholar] [CrossRef]
  44. Hamed, K.; Rao, A. A modified Mann-Kendall trend test for autocorrelated data. J. Hydrol. 1998, 204, 182–196. [Google Scholar] [CrossRef]
  45. Sen, P. Estimates of the Regression Coefficient Based on Kendall’s Tau. J. Am. Stat. Assoc. 1968, 63, 1379–1389. [Google Scholar] [CrossRef]
  46. Pettitt, A.N. A Non-Parametric Approach to the Change-Point Problem. Appl. Stat. 1979, 28, 126–135. [Google Scholar] [CrossRef]
  47. Stocker, B.D.; Zscheischler, J.; Keenan, T.F.; Prentice, I.C.; Seneviratne, S.I.; Peñuelas, J. Drought impacts on terrestrial primary production underestimated by satellite monitoring. Nat. Geosci. 2019, 12, 264–270. [Google Scholar] [CrossRef]
  48. Allen, R.; Smith, M.; Pereira, L.; Perrier, A. An Update for the Calculation of Reference Evapotranspiration. ICID Bull. 1994, 43, 35. [Google Scholar]
  49. Tetens, O. Uber einige meteorologische. Geophys 1930, 6, 297–309. [Google Scholar]
  50. Buck, A.L. New Equations for Computing Vapor Pressure and Enhancement Factor. J. Appl. Meteorol. 1981, 20, 1527–1532. [Google Scholar] [CrossRef] [Green Version]
  51. Preethi, B.; Ramya, R.; Patwardhan, S.; Mujumdar, M.; Kripalani, R. Variability of Indian summer monsoon droughts in CMIP5 climate models. Clim. Dyn. 2019, 53, 1937–1962. [Google Scholar] [CrossRef]
  52. Ma, F.; Yuan, X. Impact of climate and population changes on the increasing exposure to summertime compound hot extremes. Sci. Total Environ. 2021, 772, 145004. [Google Scholar] [CrossRef]
  53. Mie Sein, Z.M.; Ullah, I.; Saleem, F.; Zhi, X.; Syed, S.; Azam, K. Interdecadal Variability in Myanmar Rainfall in the Monsoon Season (May–October) Using Eigen Methods. Water 2021, 13, 729. [Google Scholar] [CrossRef]
  54. Lu, K.; Arshad, M.; Ma, X.; Ullah, I.; Wang, J.; Shao, W. Evaluating observed and future spatiotemporal changes in precipitation and temperature across China based on CMIP6-GCMs. Int. J. Climatol. 2022, 1–27. [Google Scholar] [CrossRef]
  55. Sheikh, M.; Manzoor, N.; Ashraf, J.; Adnan, M.; Collins, D.; Hameed, S.; Manton, M.; Ahmed, A.; Baidya, S.; Borgaonkar, H.; et al. Trends in extreme daily rainfall and temperature indices over South Asia. Int. J. Climatol. 2015, 35, 1625–1637. [Google Scholar] [CrossRef]
  56. Khatiwada, K.; Pandey, V. Characterization of hydro-meteorological drought in Nepal Himalaya: A case of Karnali River Basin. Weather Clim. Extrem. 2019, 26, 100239. [Google Scholar] [CrossRef]
  57. Mie Sein, Z.; Ullah, I.; Syed, S.; Zhi, X.; Azam, K.; Rasool, G. Interannual Variability of Air Temperature over Myanmar: The Influence of ENSO and IOD. Climate 2021, 9, 35. [Google Scholar] [CrossRef]
  58. Ullah, I.; Ma, X.; Yin, J.; Asfaw, T.; Azam, K.; Syed, S.; Liu, M.; Arshad, M.; Shahzaman, M. Evaluating the meteorological drought characteristics over Pakistan using in situ observations and reanalysis products. Int. J. Climatol. 2021, 41, 4437–4459. [Google Scholar] [CrossRef]
  59. Dixit, S.; Yadaw, R.; Mishra, K.; Kumar, A. Marker-assisted breeding to develop the drought-tolerant version of Sabitri, a popular variety from Nepal. Euphytica 2017, 213, 184. [Google Scholar] [CrossRef]
  60. Aadhar, S.; Mishra, V. On the occurrence of the worst drought in South Asia in the observed and future climate. Environ. Res. Lett. 2021, 16, 024050. [Google Scholar] [CrossRef]
  61. Ali, S.; Henchiri, M.; Yao, F.; Zhang, J. Analysis of vegetation dynamics, drought in relation with climate over South Asia from 1990 to 2011. Environ. Sci. Pollut. Res. 2019, 26, 11470–11481. [Google Scholar] [CrossRef]
  62. You, Q.L.; Ren, G.Y.; Zhang, Y.Q.; Ren, Y.Y.; Sun, X.B.; Zhan, Y.J.; Shrestha, A.B.; Krishnan, R. An overview of studies of observed climate change in the Hindu Kush Himalayan (HKH) region. Adv. Clim. Chang. Res. 2017, 8, 141–147. [Google Scholar] [CrossRef]
  63. Ahmad, Z.; Hafeez, M.; Ahmad, I. Hydrology of mountainous areas in the upper Indus Basin, Northern Pakistan with the perspective of climate change. Environ. Monit. Assess. 2012, 184, 5255–5274. [Google Scholar] [CrossRef]
  64. Ali, S.; Tong, D.; Xu, Z.; Henchiri, M.; Wilson, K.; Siqi, S.; Zhang, J. Characterization of drought monitoring events through MODIS- and TRMM-based DSI and TVDI over South Asia during 2001–2017. Environ. Sci. Pollut. Res. 2019, 26, 33568–33581. [Google Scholar] [CrossRef] [PubMed]
  65. Wang, X.; Qiu, B.; Li, W.; Zhang, Q. Impacts of drought and heatwave on the terrestrial ecosystem in China as revealed by satellite solar-induced chlorophyll fluorescence. Sci. Total Environ. 2019, 693, 133627. [Google Scholar] [CrossRef] [PubMed]
  66. Mishra, V.; Bhatia, U.; Tiwari, A. Bias-corrected climate projections for South Asia from Coupled Model Intercomparison Project-6. Sci. Data 2020, 7, 1–14. [Google Scholar] [CrossRef] [PubMed]
  67. Zhang, W.; Zhou, T. The Effect of Modeling Strategies on Assessments of Differential Warming Impacts of 0.5 °C. Earth’s Futur. 2021, 9, e2020EF001640. [Google Scholar] [CrossRef]
  68. Suman, M.; Maity, R. Southward shift of precipitation extremes over south Asia: Evidences from CORDEX data. Sci. Rep. 2020, 10, 6452. [Google Scholar] [CrossRef] [Green Version]
  69. Hussain, M.; Kim, S.; Lee, S. On the relationship between Indian Ocean Dipole events and the precipitation of Pakistan. Theor. Appl. Climatol. 2017, 130, 673–685. [Google Scholar] [CrossRef]
  70. Liu, L.; Gudmundsson, L.; Hauser, M.; Qin, D.; Li, S.; Seneviratne, S. Soil moisture dominates dryness stress on ecosystem production globally. Nat. Commun. 2020, 11, 4892. [Google Scholar] [CrossRef]
  71. Mukherjee, S.; Ashfaq, M.; Mishra, A.K. Compound Drought and Heatwaves at a Global Scale: The Role of Natural Climate Variability-Associated Synoptic Patterns and Land-Surface Energy Budget Anomalies. J. Geophys. Res. Atmos. 2020, 125, 1–19. [Google Scholar] [CrossRef]
  72. Arias, P.A.; Martínez, J.A.; Mejía, J.D.; Pazos, M.J.; Espinoza, J.C.; Wongchuig-Correa, S. Changes in Normalized Difference Vegetation Index in the Orinoco and Amazon River Basins: Links to Tropical Atlantic Surface Temperatures. J. Clim. 2020, 33, 8537–8559. [Google Scholar] [CrossRef]
  73. Ren, Y.; Ren, G.; Sun, X.; Shrestha, A.; You, Q.; Zhan, Y.; Rajbhandari, R.; Zhang, P.; Wen, K. Observed changes in surface air temperature and precipitation in the Hindu Kush Himalayan region over the last 100-plus years. Adv. Clim. Chang. Res. 2017, 8, 148–156. [Google Scholar] [CrossRef]
  74. Singh, J.; Ashfaq, M.; Skinner, C.B.; Anderson, W.B.; Mishra, V.; Singh, D. Enhanced risk of concurrent regional droughts with increased ENSO variability and warming. Nat. Clim. Chang. 2022, 12, 163–170. [Google Scholar] [CrossRef]
  75. Ummenhofer, C.; D’Arrigo, R.; Anchukaitis, K.; Buckley, B.; Cook, E. Links between Indo-Pacific climate variability and drought in the Monsoon Asia Drought Atlas. Clim. Dyn. 2013, 40, 1319–1334. [Google Scholar] [CrossRef] [Green Version]
  76. Singh, J.; Ashfaq, M.; Skinner, C.B.; Anderson, W.B.; Singh, D. Amplified risk of spatially compounding droughts during co-occurrences of modes of natural ocean variability. NPJ Clim. Atmos. Sci. 2021, 4, 7. [Google Scholar] [CrossRef]
  77. Liu, B.; Wu, G.; Ren, R. Influences of ENSO on the vertical coupling of atmospheric circulation during the onset of South Asian summer monsoon. Clim. Dyn. 2015, 45, 1859–1875. [Google Scholar] [CrossRef]
  78. Saji, N.; Yamagata, T. Possible impacts of Indian Ocean Dipole mode events on global climate. Clim. Res. 2003, 25, 151–169. [Google Scholar] [CrossRef]
  79. Ren, G.-Y.; Shrestha, A.B. Climate change in the Hindu Kush Himalaya. Adv. Clim. Chang. Res. 2017, 8, 137–140. [Google Scholar] [CrossRef]
  80. Sanjay, J.; Krishnan, R.; Shrestha, A.B.; Rajbhandari, R.; Ren, G.-Y. Downscaled climate change projections for the Hindu Kush Himalayan region using CORDEX South Asia regional climate models. Adv. Clim. Chang. Res. 2017, 8, 185–198. [Google Scholar] [CrossRef]
  81. Zhan, Y.-J.; Ren, G.-Y.; Shrestha, A.B.; Rajbhandari, R.; Ren, Y.-Y.; Sanjay, J.; Xu, Y.; Sun, X.-B.; You, Q.-L.; Wang, S. Changes in extreme precipitation events over the Hindu Kush Himalayan region during 1961–2012. Adv. Clim. Chang. Res. 2017, 8, 166–175. [Google Scholar] [CrossRef]
Figure 1. Spatial patterns of topography and elevation (a), and land use land cover (LULC) (b), across South Asia (SA) and its four subregions; (c,d) represent the annual precipitation and mean temperature distributions of spatial anomalies during 1980–2020; (e,f) demonstrate the annual and seasonal trends of precipitation (mm/year) and temperature (°C/year), and the regional averaged annual precipitation and mean temperature time series over SA. The blue and red solid lines in (e,f) characterize the precipitation and temperature changes over SA. The horizontal lines (black) indicate the average annual precipitation and mean temperature, while the dotted lines (blue and red) are the linear trends of annual precipitation and mean temperature, respectively. The asterisk *, **, *** represent trends passing the 95%, 99%, 99.9% significance levels, respectively.
Remotesensing 14 03219 g001
Figure 2. Annual climatological anomalies variations of (a) scPDSI, (b) PET (mm), (c) VPD (hPa), and (d) Normalized Difference Vegetation Index (NDVI), across SA four climatic regions during 1981–2020, respectively. Panel (e) indicates the regional changes in all those variables over SA and its subregions. It should be noted that we estimate the regional changes as a proportion of the areas with (significant) reduction (increase) of the indices over the period.
Remotesensing 14 03219 g002
Figure 3. Spatial patterns of drought intensity and drought frequency during 1980–2020 across SA’s different subregions. (a,c) show drought intensity and frequency when scPDSI < –2, while (b,d) indicate drought intensity and frequency when scPDSI < –4, respectively.
Remotesensing 14 03219 g003
Figure 4. Variation of regional drought intensity across four different subregions of SA, using scPDSI < –2 and scPDSI < –4 as thresholds, during 1980–2020.
Remotesensing 14 03219 g004
Figure 5. Pixel-wise Mann–Kendall (MK) trends (a), and Theil–Sen slopes (b), over the period 1980 to 2020. The black dots in (a) show a significance level of 0.5%. The positive values of the MK test statistics show a wetting trend, and the negative values indicate a drying trend, over SA.
Remotesensing 14 03219 g005
Figure 6. Regional drought time series across four different subregions (ad) of SA from 1981 to 2020. The shaded belt indicates the 95% confidence band of the linear relationship.
Remotesensing 14 03219 g006
Figure 7. Regional interannual variation of linear trend of VPD (ad), NDVI (eh), PET (il), precipitation (mp), and temperature (qt), over four climatic regions of SA during 1980–2020, respectively.
Remotesensing 14 03219 g007
Figure 8. Pixel-wise spatial correlation coefficients between annual mean scPDSI and annual mean (a) precipitation, (b) temperature, (c) PET, (d) NDVI, and (e) VPD anomalies, in SA for the period of 1980–2020.
Remotesensing 14 03219 g008
Figure 9. Spatial distributions of correlation coefficients between average scPDSI, NDVI, and VPD with ENSO and IOD events across SA during 1980–2020. The top first panels indicate the ENSO pattern, while the bottom panel shows the IOD distributions for all indices.
Remotesensing 14 03219 g009
Table 1. Characterization of the land dryness and wetness conditions defined by Palmer (1965).
CategoriesscPDSI
Extremely Wet≥4.0
Severely Wet3 to 4
Moderately Wet2 to 3
Near Normal−0.5 to 0.5
Moderately Dry−2 to −3
Severely Dry−3 to −4
Extremely Dry≤−4.0
Publisher’s Note: MDPI stays neutral with regard to jurisdictional claims in published maps and institutional affiliations.

