Article

A Lightweight Model for Wheat Ear Fusarium Head Blight Detection Based on RGB Images

1
Jiangsu Key Laboratory of Crop Genetics and Physiology, Jiangsu Co-Innovation Center for Modern Production Technology of Grain Crops, Joint International Research Laboratory of Agriculture and Agri-Product Safety of the Ministry of Education of China, Jiangsu Province Engineering Research Center of Knowledge Management and Intelligent Service, College of Information Engineer, Yangzhou University, Yangzhou 225009, China
2
Station of Land Protection of Yangzhou City, Yangzhou 225009, China
*
Author to whom correspondence should be addressed.
Remote Sens. 2022, 14(14), 3481; https://0-doi-org.brum.beds.ac.uk/10.3390/rs14143481
Submission received: 12 June 2022 / Revised: 17 July 2022 / Accepted: 18 July 2022 / Published: 20 July 2022
(This article belongs to the Section Remote Sensing in Agriculture and Vegetation)

Abstract

:
Detection of the Fusarium head blight (FHB) is crucial for wheat yield protection, with precise and rapid FHB detection increasing wheat yield and protecting the agricultural ecological environment. FHB detection tasks in agricultural production are currently handled by cloud servers and utilize unmanned aerial vehicles (UAVs). Hence, this paper proposed a lightweight model for wheat ear FHB detection based on UAV-enabled edge computing, aiming to achieve the purpose of intelligent prevention and control of agricultural disease. Our model utilized the You Only Look Once version 4 (YOLOv4) and MobileNet deep learning architectures and was applicable in edge devices, balancing accuracy, and FHB detection in real-time. Specifically, the backbone network Cross Stage Partial Darknet53 (CSPDarknet53) of YOLOv4 was replaced by a lightweight network, significantly decreasing the network parameters and the computing complexity. Additionally, we employed the Complete Intersection over Union (CIoU) and Non-Maximum Suppression (NMS) to regress the loss function to guarantee the detection accuracy of FHB. Furthermore, the loss function incorporated the focal loss to reduce the error caused by the unbalanced positive and negative sample distribution. Finally, mixed-up and transfer learning schemes enhanced the model’s generalization ability. The experimental results demonstrated that the proposed model performed admirably well in detecting FHB of the wheat ear, with an accuracy of 93.69%, and it was somewhat better than the MobileNetv2-YOLOv4 model (F1 by 4%, AP by 3.5%, Recall by 4.1%, and Precision by 1.6%). Meanwhile, the suggested model was scaled down to a fifth of the size of the state-of-the-art object detection models. Overall, the proposed model could be deployed on UAVs so that wheat ear FHB detection results could be sent back to the end-users to intelligently decide in time, promoting the intelligent control of agricultural disease.

Graphical Abstract

1. Introduction

Wheat is one of the world’s most important staple foods, providing both calories and nutrients, and wheat-based foods are essential for food security of global population. Wheat proteins contain sufficient essential amino acids to meet daily requirements [1], while wheat grains provide a variety of vitamins, minerals, and other phytochemicals, significantly impacting human health [2]. In many parts of the world, Fusarium head blight (FHB), often known as head scab, is one of the most severe and widespread wheat diseases caused by Fusarium graminearum and Fusarium asiaticum [3]. FHB mainly occurs in warm and humid environments. Under normal circumstances, there is little or no FHB infection below 15 °C, and the possibility of wheat infected with FHB increases as the temperature rises from 20 °C to 30 °C [4]. Diseased spikes reveal premature bleaching and generate shriveled kernels when FHB infects wheat kernels. Meanwhile, several Fusarium alenol toxins are secreted. Processed products made from wheat kernels carrying these toxins likely lead to food poisoning and gradual decline of immunity and physical health [5]. FHB is also one of the most devastating cereal diseases causing significant yield and quality reduction [6].
Scientific research suggests a substantial risk of wheat disease under future climatic conditions. Climate change can greatly influence temperature and moisture by causing excessive rainfall or drought, which are the most important environmental factors influencing the development of FHB [7]. Consequently, an accurate and rapid approach to detecting FHB is particularly critical for disease control and screening the FHB disease-resistant cultivars.
Visual inspection, chromatography, and enzyme-linked immunoassay (ELISA) are the conventional methods for detecting FHB [8]. Visual inspection is convenient, but highly subjective, requiring various human, material, and financial resources based on morphological characteristics and experience. Chromatography and ELISA are highly accurate, sensitive, and dependable, but they typically require multiple processing steps, expensive equipment, and a long turnaround time. Furthermore, the conventional approaches are ineffective in detecting large-scale disease. Many studies have also been conducted to find a quick and accurate way for FHB detection. For instance, many researchers have gained considerable attention for the safety and convenience of UAV-based wheat disease detections [9]. Liu et al. [10] proposed a method combining unmanned aerial vehicle (UAV) technology and multispectral technology to detect the severity of wheat FHB with 98% accuracy. When employing UAVs, the wheat images are captured using an onboard camera. The primary applications of UAV in agriculture include mapping, spraying, pest detection, and other tasks. Rapid and accurate disease type and disease area localization are crucial for disease prevention and control, achieving a high accuracy in the assessment of the severity of disease and the purpose of intelligent prevention.
The development of deep learning has already been extended to FHB detection. Deep learning-based detection approaches have demonstrated distinct improvements in detection efficiency, accuracy, and application scenarios [11,12]. The classical object detection algorithm was based on hand-engineered features and suitable classifiers for object classification [13]. Research on vision-based currently centers on general object detection algorithms. Gu et al. [14] proposed an FHB severity evaluation method based on the Relief-F algorithm, and the accuracy for the severity of single wheat ear was 94%. Su et al. [15] also proposed an FHB severity evaluation method based on Mask-RCNN network, and the evaluation accuracy of wheat ears was 77%. Although deep convolutional neural networks have richer network structures and offer superior feature learning advantages, the problem with deeper networks is that incorporating many parameters slows the network’s computation, as edge devices have a low computational capability [16]. Therefore, for effective wheat ear FHB detection, reducing the parameters of deep learning algorithms deployed in edge devices is critical.
To address the abovementioned issues, this paper proposed a lightweight wheat ear FHB detection model relying on YOLOv4 and MobileNet. The research items for this study were wheat images captured from the field setting. The feature extraction network CSPDarknet53 in YOLOv4 was replaced with the lightweight network MobileNet, which had significantly fewer parameters. Furthermore, the error caused by the positive and negative imbalanced sample distribution was solved by improving the loss function of YOLOv4 and introducing the focal loss in the loss function.

2. Related Work

2.1. Crop Detection Based on Deep Learning

In recent decades, crop disease identification primarily relied on classification techniques such as the K-Nearest Neighbor (KNN) [17], Support Vector Machine (SVM) [18], Fisher linear discriminant (FLD) [19], and Random Forest (RF) [20]. Nevertheless, the characteristics of lesion segmentation and the manual design of various algorithms significantly impact disease detection in conventional techniques. Specifically, handcrafted features require a significant effort and expert knowledge, both of which are subjective. Deep learning technology has recently been popular for crop pests and disease detection [21]. For instance, Picon et al. [22] presented a challenging dataset with seventeen diseases and five crops (wheat, barley, corn, rice, and rapeseed). They utilized three alternative CNN architectures that integrated contextual meta-data into image-based convolutional neural networks to ease disease classification. The results demonstrated that for each crop, a single model incorporating large numbers of crops and diseases performed better than an isolated classification model. Espejo-Garcia et al. [23] developed a new crop/weed identification system that combined fine-tuned pre-trained neural networks involving classic machine learning classifiers to prevent overfitting and achieve robust performance. Chen et al. [24] employed transfer learning on deep convolutional neural networks to quickly identify and diagnose disease and merged VGGNet with an Inception module. This architecture attained more than 91.83% accuracy on a public dataset.
Spectroscopy and imaging techniques, such as hyperspectral imaging (HSI), have been increasingly popular in disease detection and monitoring [25] and have already been integrated with deep learning schemes to enhance automatic disease detection. For instance, Li et al. [26] designed a hyperspectral imaging reconstruction model based on DCNN to improve spatial features and found that a DCNN-based framework could produce acceptable results. For the early diagnosis of FHB, Jin et al. [27] applied a deep neural network to categorize healthy and diseased wheat heads from the pixels of hyperspectral images.

2.2. Lightweight Model

Due to its ability to extract features, deep learning technology and particularly the Convolutional Neural Network, is the favored strategy for detecting crop disease. Although deep learning achieves a good detection performance, it involves many parameters and a slow reasoning speed. Nevertheless, farmlands are typically located in regions with limited resources, and deploying these models in rural districts is limited by network bandwidth and delay. Furthermore, deep convolutional neural networks could not be effectively employed in edge devices. As a consequence, compressing neural networks effectively is crucial, with current strategies including pruning [28], knowledge distillation [29], quantization [30], and developing lightweight models [31,32].
Employing modified deep learning architectures to detect crop disease has become mainstream. Ale et al. [33] proposed a lightweight model and used transfer learning to strengthen the model’s generalization performance on a plant disease dataset, achieving an accuracy of 89.70%. In order to improve the model’s performance under limited hardware conditions, Wang [34] altered the residual connection mode and the convolution method, considerably decreasing the model’s parameters and memory space. Toda and Okura [35] designed a CNN based on the Inceptionv3 architecture. By visualizing the output of the intermediate layer, they reduced the network parameters by 75%. Wang et al. [16] introduced a DNN-based compression strategy to reduce the computational burden, compressing the model to 0.04 MB.
Although decreasing the network parameters has already been achieved, the corresponding accuracy was relatively low. Thus, some researchers suggested adding an attention mechanism to improve accuracy, with Tang et al. [36] improving the real-time identification performance of the lightweight neural network models ShuffleNet-V1 and ShuffleNet-V2 by including such an attention mechanism. Zhao et al. [37] developed SE-ResNet50 by integrating the squeeze-and-excitation network (SENet), one of the attention mechanisms, into each stage of the ResNet50 architecture. Then the performance of SE-ResNet50 was evaluated on tomato and grape disease classification, outperforming several baseline models that did not use the SENet module. Chen [38] has also introduced the Location-wise Soft Attention mechanism to the pre-trained lightweight neural network MobileNetv2 to boost the learning ability of minor lesion features, achieving an average accuracy of 99.71% for crop disease detection. According to the current literature, adding an attention mechanism to deep networks improves the detection performance of plant and crop diseases. However, this strategy increases the model’s parameters prohibiting it from deployment on edge devices.

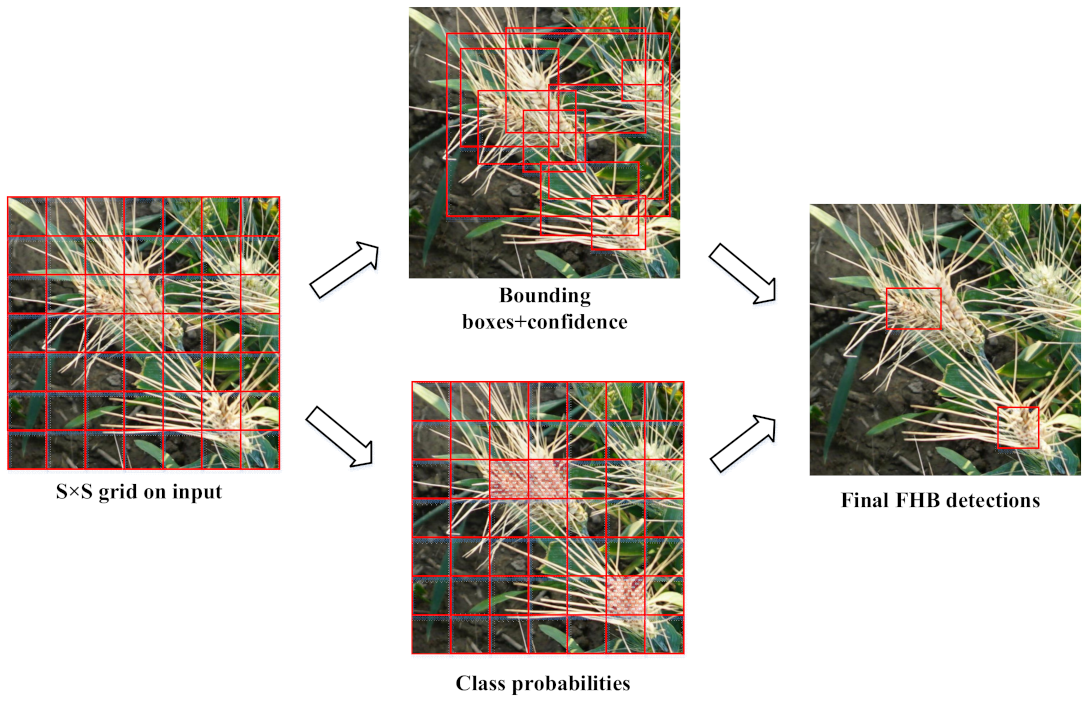
2.3. The YOLO Algorithm

In recent years, the YOLO models have been widely utilized for object detection due to their fast detection speed and high accuracy. In 2015, Redmon et al. [39] proposed the YOLO algorithm, where the object detection task was transformed into a regression problem. Extensions of the YOLOv1 model were the YOLOv2 [40] and YOLOv3 [41], with YOLOv2 being substantially more accurate than the original model. YOLOv3 improved the shortcomings of YOLOv2 in small object detection by employing the residual neural network concept [42]. Bochkovskiy [43] proposed the YOLOv4, which optimized YOLOv3 using data augmentation, a backbone feature extraction network, loss function, and activation function. YOLOv4 realized the best tradeoff between detection accuracy and speed, with Figure 1 illustrating a performance comparison of YOLOv4 against other state-of-the-art object detectors. Under the MS COCO dataset, the Average Precision (AP) and detection speed of YOLOv4 were improved by 10% and 12% over YOLOv3, respectively.
The superiority of the YOLO algorithm has extended its applicability in crop detection, making it an effective tool in precision agriculture. In orchards with fluctuating illumination, complicated backgrounds, overlapping apples, and branches and leaves, Tian et al. [44] proposed an improved YOLOv3 model for detecting apples during different growth stages. In this modified YOLOv3 network, the DenseNet method processed the low-resolution feature layers, with the results revealing that the proposed model effectively performed apple detection under overlapping apples and occlusion circumstances. Arunabha et al. [45] suggested Dense-YOLOv4, a real-time object detection framework, which has been applied to detect distinct stages of mango growth. This model’s mean average precision (mAP) and F1-score reached 96.20% and 93.61%, respectively, at a detection rate of 44.2FPS. Guo et al. [46] applied YOLOv3 and YOLOv4 for flower and bud detection. The results showed that the YOLOv4 model achieved the highest AP of 98.6% on bud detection (4.6% higher than the YOLOv3 model) and an mAP of 97.6% on the kiwifruit flower, while the bud detection required 38.6ms per image.
Based on previous research findings and the advantages of the YOLOv4 algorithm, this paper employed the YOLOv4 algorithm for wheat ear FHB detection. Additionally, we replaced in YOLOv4 the standard convolution with point convolution and depth-wise separable convolution to construct a lightweight model, while preserving accuracy.

3. Materials and Methods

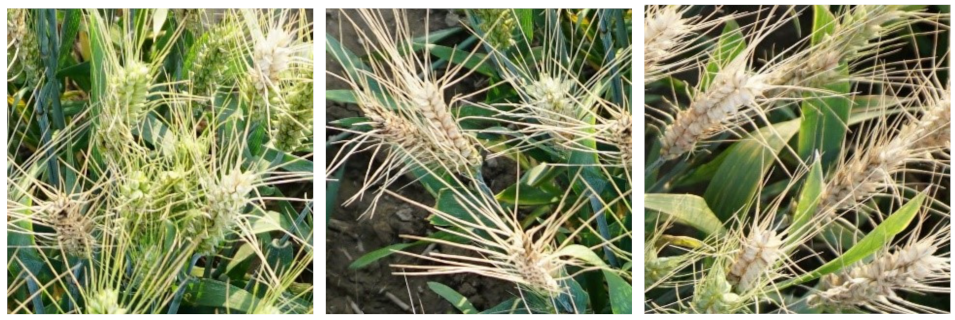
3.1. Data Collection and Preprocessing

The wheat images used in this paper were captured in the field environment of the Yangzhou experimental base (32°42′N, 119°53′E) of the Institute of Agricultural Sciences in Lixiahe District, Jiangsu Province, China, which is primarily responsible for scientific research on crops such as wheat and rice. We employed a SONY@6300 digital camera with 24.2 million effective pixels, a 3-inch 920,000-pixel LCD screen, a 4 K high-definition camera, and a memory card SD/SDHC/SDXCmicroSD/microSDHC/microSDXC with strong endurance. All wheat images were captured during the grain filling stage in natural daylights.
We took 866 wheat images stored in the Joint Photographic Experts Group (JPEG) format. Since some images contained uneven illumination and complex backgrounds, 604 images were selected for experiments. We employed data enhancement to expand the number of images to 1616. An example of the captured FHB images was illustrated in Figure 2.
The LabelImg tool was used to annotate the captured images by manually sorting the categories and drawing the bounding boxes. Figure 3 depicted the annotation results on a diseased wheat ear, with Figure 3b presenting the converted gray image in PNG format. We deduce from the annotation that the diseased spikes have early bleaching and generate shriveled grains. A Pink Mucor layer would emerge at the base of diseased spikelets, and coal dust-like black particles would appear afterward. After annotation, the final images were transformed into the PASCAL VOC format. After data enhancement, the dataset was then randomly partitioned into training, validation, and test datasets at the ratio of 8:1:1 to ensure uniform distribution.

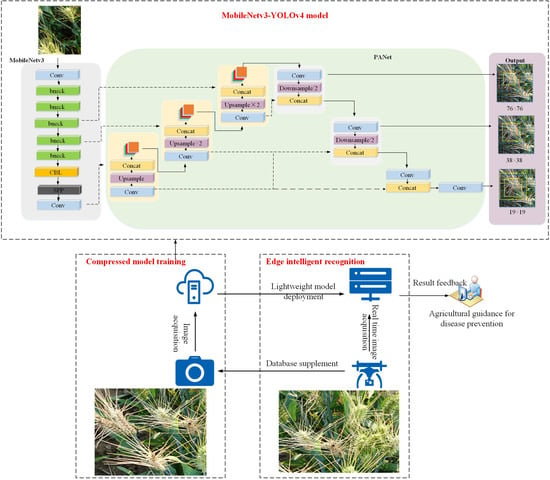
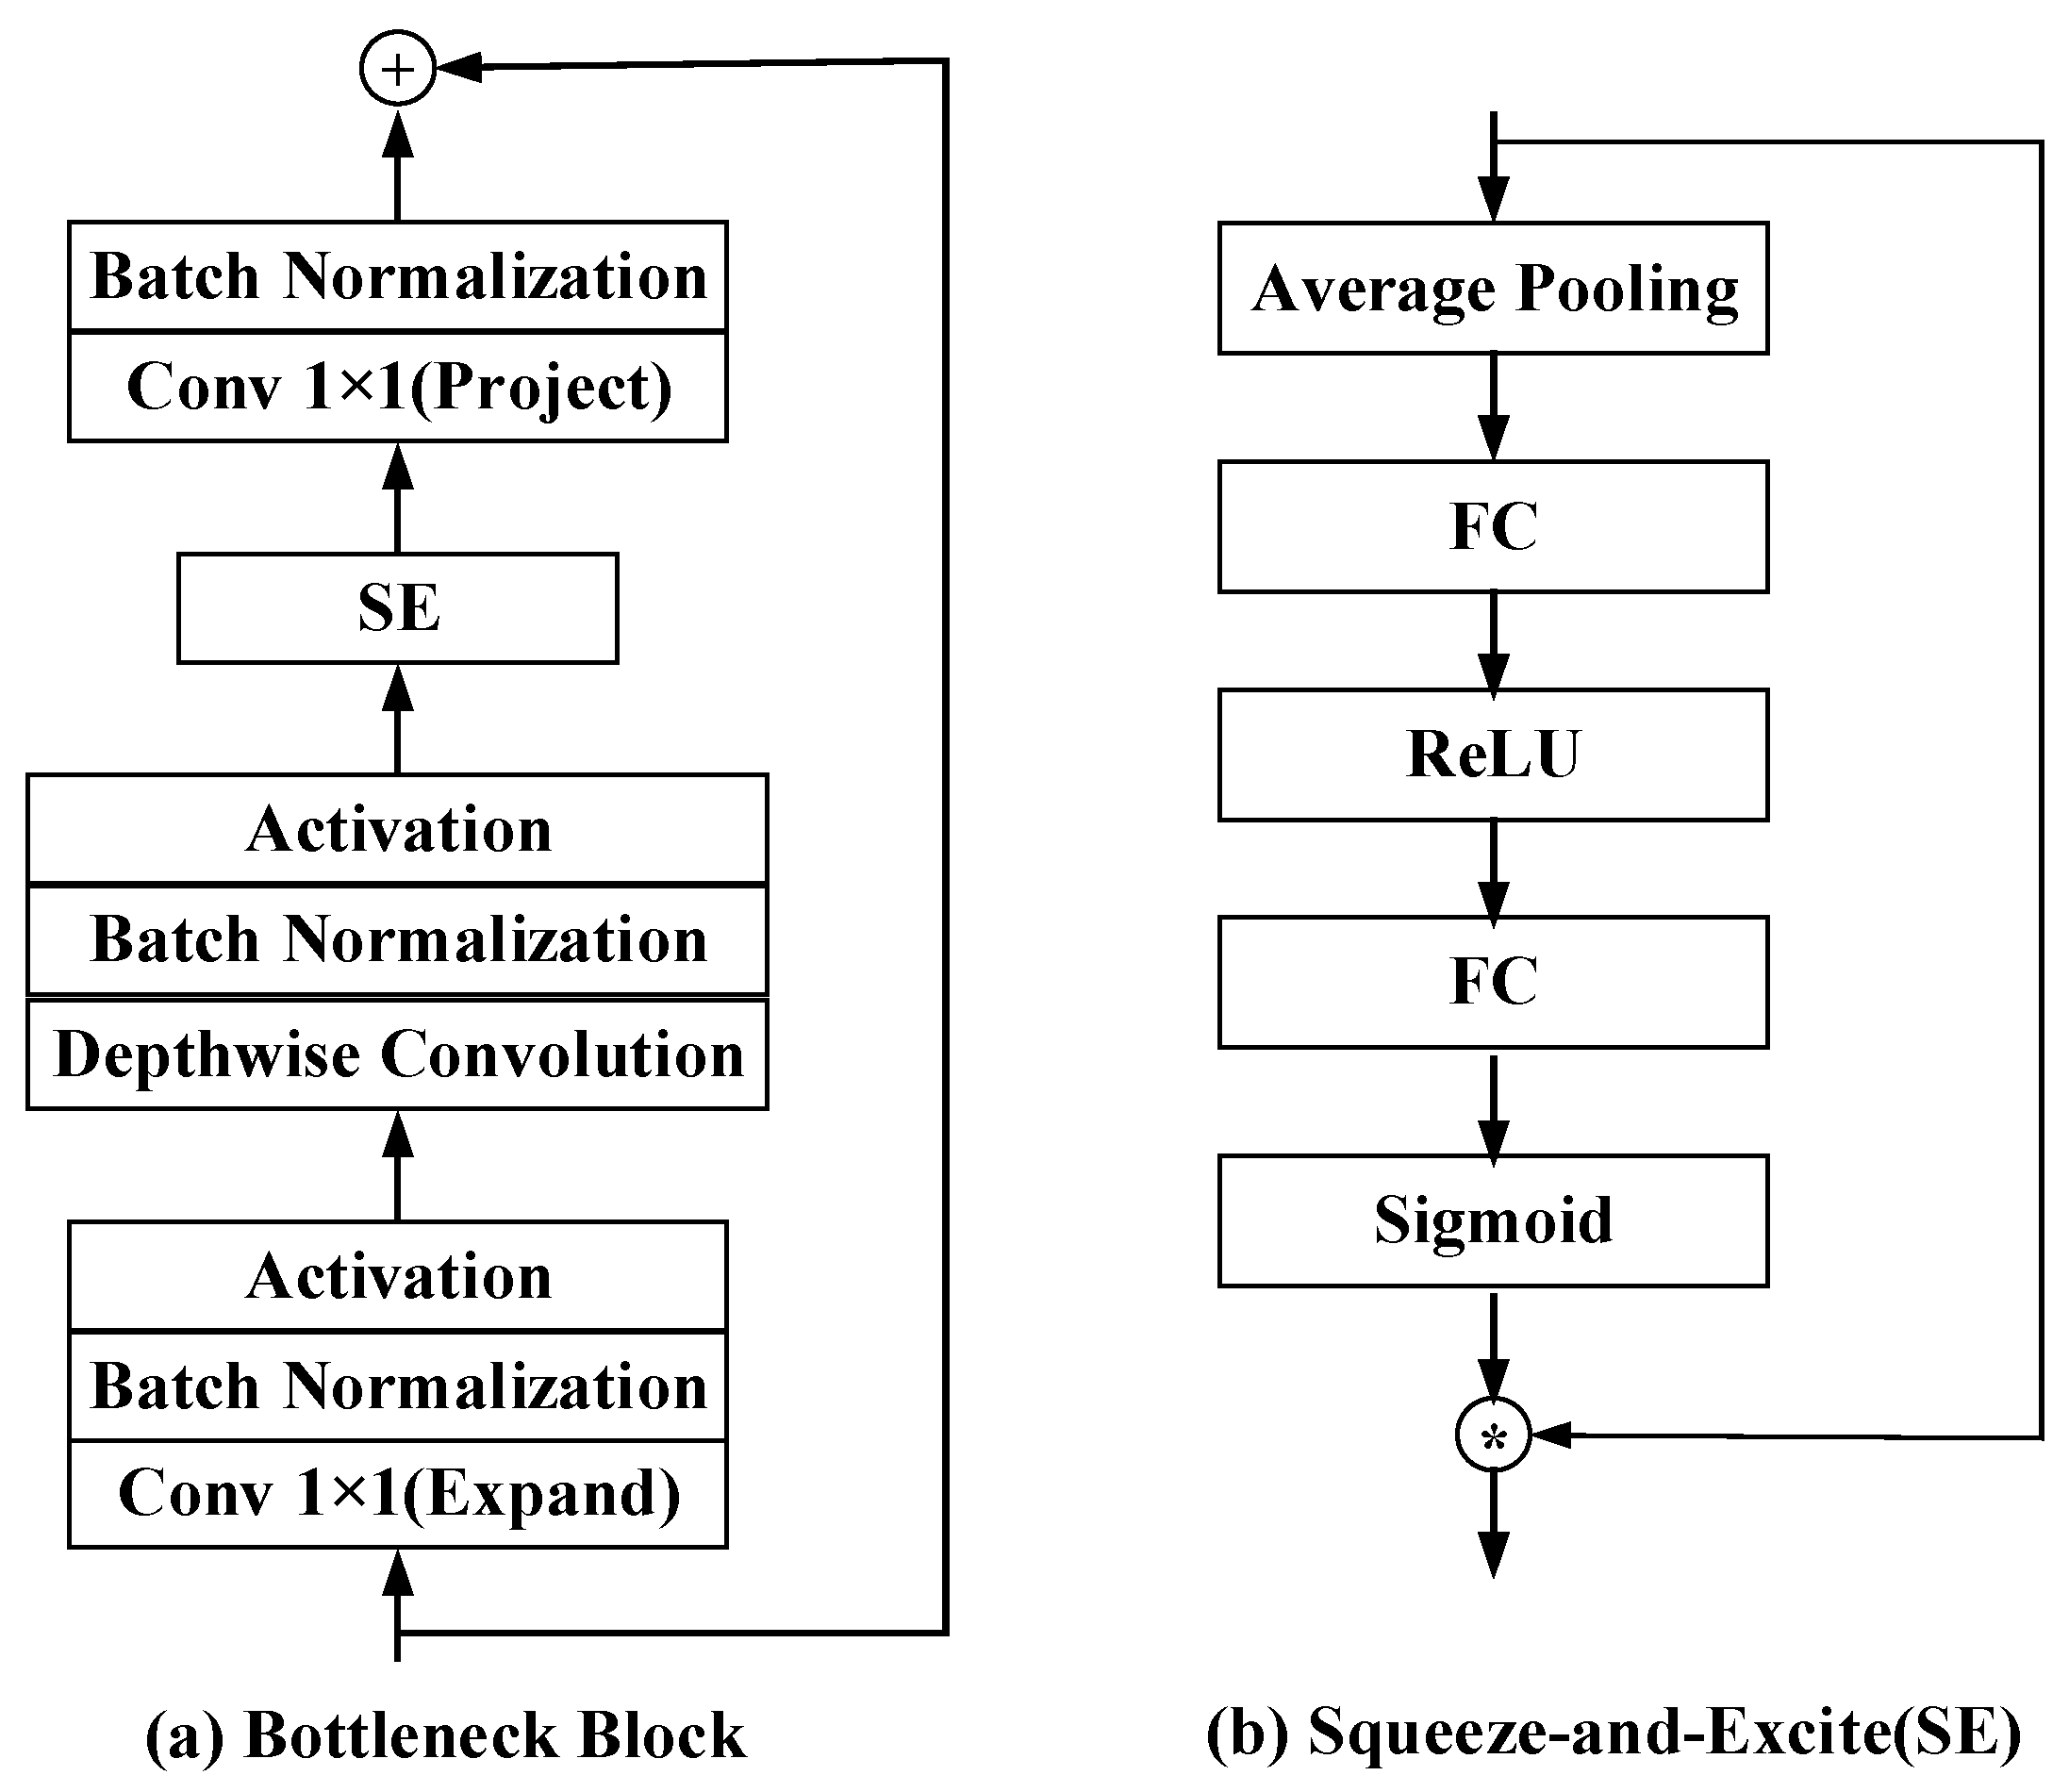
3.2. Lightweight YOLOv4-Based Network Design

3.2.1. YOLOv4 Algorithm
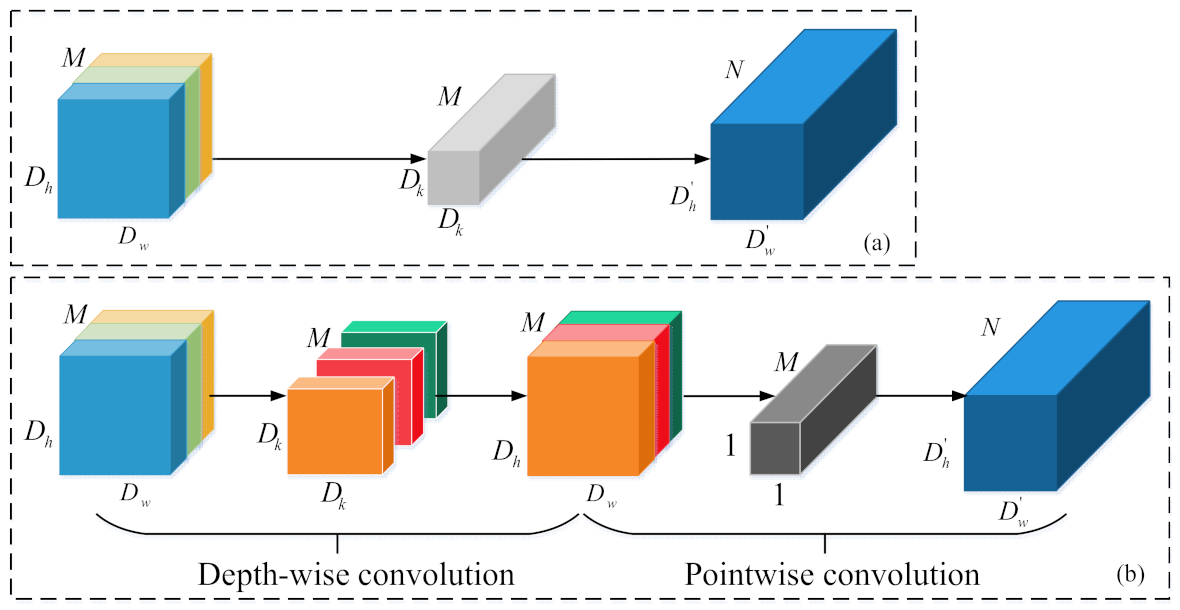
The YOLO algorithm [39], proposed by Redmon et al., was a one-stage network that separates an image into S × S grids. Each grid was in-charge of detecting objects whose center point fell within its grid. Each grid would predict B bounding boxes, their confidence scores, and the conditional class probabilities. The detection pipeline of YOLO is illustrated in Figure 4. The YOLOv4 algorithm, as an updated version of YOLOv3, was proposed by Bochkovskiy [43] and comprised the Cross Stage Partial Darknet-53 (CSPDarknet-53) [43], Spatial Pyramid Pooling (SPP) block [47], and Path Aggregation Network (PANet) [48]. The YOLOv4 algorithm optimized the feature extraction backbone network, the neck network for feature fusion, and the prediction head for classification and regression. Based on the original Darknet53 of YOLOv3, the YOLOv4 algorithm utilized a cross-stage partial network (CSP) [49] and built the CSPDarknet53 feature extraction network. The YOLOv4 algorithm incorporated the SSP block to expand the receptive field. Moreover, instead of using FPN for future fusion, PANet improved the amount of image feature extraction. The YOLOv4 algorithm employed Mosaic data augmentation, CIoU, learning rate cosine annealing decay, and label smoothing to prevent overfitting.

3.2.2. MobileNet

Although the YOLOv4 object detection algorithm had improved accuracy and speed, the CSPDarknet53 network was still a deep network involving many parameters, which, therefore, made it unsuitable for deployment on edge devices with low processing capacity. As a result, studying the lightweight model for its application and development in agriculture is critical. Hence, this study introduced the lightweight neural network (MobileNet) [31] into the YOLOv4 algorithm.
MobileNet was a lightweight network proposed by Google in 2017 for mobile terminals and edge devices. In MobileNet, the standard convolution was replaced with point and depth-wise separable convolutions, dramatically decreasing the model calculation complexity. Moreover, MobileNet replaced the activation function with ReLU6 (Equation (1)), allowing the model to learn sparse features sooner.
Y = min ( max ( f e a t u r e , 0 ) , 6 )
where Y is the output of ReLU6, and feature is the input feature.
Standard convolution (Figure 5a) involved adding the input feature diagrams of each channel to the convolution kernel of the response and then outputting the features. The typical standard convolution operation has a computational cost of:
n 1 = D k D k M N D w D h
The depth-wise separable convolution (Figure 5b) split the standard convolution’s one-step operation into two steps: one depth-wise convolution and one point-by-point convolution. The following is the size of the convolution operation:
n 2 = D k D k M D w D h + M N D w D h
After applying the depth-wise separable convolution, the calculation complexity and the required parameters are reduced to about 1/4 of the original, resulting in a significantly smaller model and a faster detection speed.

3.2.3. The Proposed Lightweight Model

The backbone structure of the YOLOv4 model was CSPDarknet53. Although the CSPDarknet53 network had an appealing detection accuracy and a low computing cost, it still had many parameters, making it unsuitable to be embedded in edge devices. In order to reduce the parameters of the YOLOv4 model and facilitate the embedding of edge equipment, this paper proposed a lightweight neural network model called MobileNetv3-YOLOv4 network, based on the traditional YOLOv4 model. It could be seen from Figure 6 that the structure replaced the YOLOv4 backbone network with MobileNetv3.
The SPP module converted feature maps of arbitrary size into fixed-size feature vectors. Figure 7 illustrates the bottleneck (bneck) module network with MobileNetv3, and the PANet structure is shown in Figure 8 in detail. YOLOv4 aggregated parameters using PANet instead of Feature Pyramid Network (FPN) for object detection at different levels. Our first enhancement was improving the utilization and increasing the low-level information’s transmission efficiency. Therefore, we proposed the bottom-up path augmentation. The second innovation was that when the FPN selected anchors in multiple layers, it allocated them to the corresponding layer based on the anchor size for hierarchical selection. Although this was incredibly efficient, it cannot utilize all available information simultaneously. Thus, PANet afforded adaptive feature pooling to alleviate this problem. The third proposed improvement involved fully connected fusion, which combined convolution-up-sampling and fully connected layers to optimize the mask generation quality.
MobileNetv3 combined the depth-wise separable convolution of MobileNetv1 with the inverted residual linear bottleneck and the lightweight attention model (Squeeze-and-Excitation, SE-Net) of MobileNetv2, and utilized the Network Architecture Search (NAS) to search the network’s configuration and parameters. The 3 × 3 and 1 × 1 convolution layers were discarded to reduce the calculation burden further. Finally, the Hard-swish and ReLU6 activation functions of MobileNetv3 significantly improved network accuracy.
Although the proposed lightweight model replaced the ordinary convolution in the backbone feature extraction network with the depth-wise separable convolution, the neck network and the prediction head still adopted the SPP + PAN + YOLO Head structure. Furthermore, the standard convolution in the enhanced feature extraction network (PANet) was replaced with the depth-wise separable convolution, considerably reducing the model’s parameter cardinality. The specific structural parameters are listed in Table 1, with columns 1–3 representing the MobileNetv3 change per feature layer, each feature layer’s operation, and the number of channels, respectively. Moreover, in the same table, columns 4–7 represented whether the attention module should be used at this layer, whether or not to adopt the H-swish function, the step size used for each block structure, and the output of each feature layer, respectively. After the preliminary feature extraction by CSPDarknet-53, three preliminary adequate feature layers were obtained in the YOLOv4 network structure. When the input image was 416 × 416 × 3, the three preliminary effective feature layers were 52 × 52 × 256, 26 ×26 × 512, and 13 × 13 × 1024, respectively. If the backbone feature extraction network was directly replaced with MobileNetv3, the size of the output preliminary effective feature layers were 52 ×52 ×40, 26 × 26 × 112, and 13 × 13 × 160, respectively. Directly training the network suffered from the channel mismatch error. Thus, before training, the number of input channels of the convolution operation must be adjusted.

3.3. Network Training and Evaluation

Deep learning models require a large number of datasets for training. Hence, we expanded the wheat images through data augmentation involving image cropping, affine transformation, horizontal flipping, adding noise and blur, and altering the contrast and brightness. Figure 9 illustrates an example of wheat disease samples after image augmentation.
The experiment selected 1616 wheat disease images, randomly divided into training, validation, and test datasets at a ratio of 8:1:1. We adopted transfer learning during the deep learning model training, with the pre-training model able to perform freezing and unfreezing training operations. The learning rate is a hyperparameter that significantly impacts the model’s performance. In our trials, the initial learning rate was 0.0001, and its momentum was 0.9, the same for both the proposed and the competitor detection algorithms. This study adopted the adaptive motion estimation (Adam) to optimize the learning rate automatically. To ensure a minimum validation loss, we saved the trained model in every epoch. When the models completed training, they were validated on the same testing datasets employing the Precision, Recall and F1 score performance metrics (Equations (4)–(6)) to reveal their FHB detection accuracy. Additionally, we evaluated the model’s performance on detection speed by averaging the time required to detect 100 test images.
P r e c i s i o n = T P T P + F P
R e c a l l = T P T P + F N
F 1 = 2 P r e c i s i o n R e c a l l P r e c i s i o n + R e c a l l
where TP represents the number of correctly predicted positive samples, FP is the number of positive examples with the wrong prediction, and FN is the number of negative examples with a wrong prediction.
All experiments were implemented on a i7-11700K CPU, ROG-STRIX-RTX3070-O8G-GAMING, 8 Gb memory, employing Pytorch with torch 1.7.0, CUDA Toolkit 11.0, cuDNN v8.0 and Python3.6.

3.4. Loss Function

The loss function indicates the disparity between the prediction and the actual data, revealing the model’s prediction quality. The YOLOv4 algorithm utilized the CIoU loss and DIoU loss, comprising the bounding box regression, confidence, and classification losses.
The bounding box regression loss utilized the CIoU loss. Based on IoU, the CIoU considered three geometric factors: the overlapping area, center distance, and aspect ratio. IoU represents the difference between the intersection and union ratio between prediction frame A and real frame B, reflecting the detection performance of the prediction detection frame. IoU is defined as:
I o U = A B A B
The CIoU loss function added the detection frame’s length and width loss, affording a prediction frame consistent with the real frame. CIoU is defined as:
C I o U = I o U ρ 2 ( b , b g t ) c 2 + α υ
υ = 4 π 2 ( arctan ω g t h g t arctan ω h ) 2
α = υ ( 1 I o U ) + υ
where ω g t and h g t represent the width and height of the real frame, respectively, and ω and h are the width and height of the prediction frame.
The confidence loss and category loss in YOLOv4 employed a binary cross-entropy loss function, which imbalanced the positive and negative sample proportion, resulting in many negative samples. In order to better focus on the difficult-to-classify samples during training and reduce the false detection rate of comparable objects, the focal loss function replaced the binary cross-entropy loss function.
The focal loss was modified based on the cross-entropy loss function, with its expression being:
L f 1 = ( 1 p t ) γ log ( p t )
where p t denotes the classification difficulty. The larger the p t , the higher the classification confidence, and the easier it is to divide the representative sample. Accordingly, the smaller p t , the lower the classification confidence, and the more difficult it is to distinguish the representative samples. γ > 0 is an adjustable factor.

4. Results

The performance of the proposed lightweight model was verified on specific detection images. To prove the superiority of the developed MobileNetv3-YOLOv4 model, we challenged it against current state-of-the-art detection models. All models were trained under the same settings and datasets.

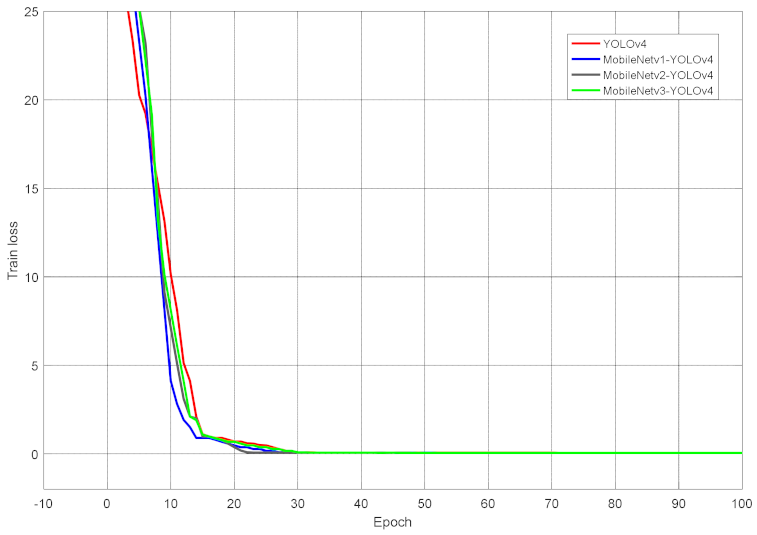
4.1. Loss Function of the Model

It could be seen from Figure 10 that the training loss curves of all object detection models converge, indicating that all models were successfully trained. As the number of training epochs increased, the loss values of YOLOv4 and the improved models initially declined quickly and then slowly. Figure 11 showed the detailed loss value between epoch 10 and 40. From Figure 11, we could find that the loss curve of YOLOv4 progressively converged near 0.07 after roughly 34 epochs, while the loss curves of MobileNetv1-YOLOv4, MobileNetv2-YOLOv4, MobileNetv3-YOLOv4 converged near 0.07, 0.07, and 0.06 after approximately 34, 30, and 38 epochs, respectively. All loss curves converged, indicating that the trained models acquired the FHB features to complete the detection tasks.

4.2. Network Parameters and PR Curve Analysis

In the enhanced feature extraction network of YOLOv4, we replaced the backbone feature extraction network and the ordinary convolution with the depth-wise separable convolutions. Table 2 revealed that the parameters of the improved model decreased dramatically, with MobileNetv2-YOLOv4 having the least parameters and the proposed model slightly more. This was because MobileNetv3 incorporated an Attention mechanism based on MobileNetv2. The algorithms’ performance was evaluated based on the accuracy and recall metrics, while the precision-recall (PR) curves of several models were illustrated in Figure 12. The PR curves considered the detection accuracy as the ordinate and the recall rate as the abscissa. The area between the curve and the coordinate axis was the AP. The higher the AP value, the better the model’s detection performance. Figure 12 revealed that the PR curve area under the MobileNetv3-YOLOv4 model was slightly less than the YOLOv4 model, probably because some features learned during training were not sufficiently generalized.

4.3. Comparison of Different Detection Methods
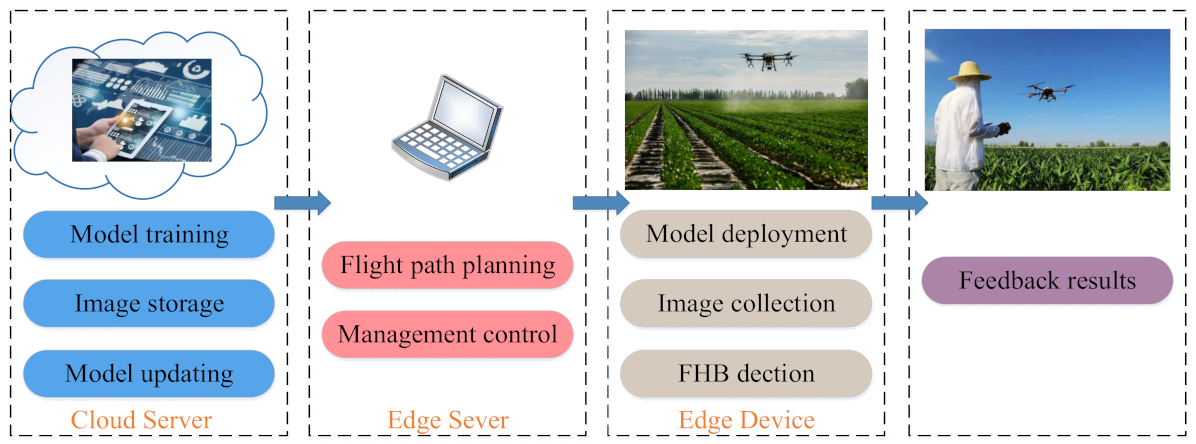
To verify the superiority of the proposed model, we compared YOLOv3, YOLOv4, YOLOv4-tiny, YOLOv4 with ResNet50, and YOLOv4 with VGG, which are currently the state-of-the-art detection models. Table 3 reported the models’ AP, F1, Recall, Precision, average detection time, and model size, highlighting that YOLOv4 had a better Recall (68.43%) than the other methods, but the average detection time was the largest. The YOLOv3 and YOLOv4 models afforded appealing detection results, but YOLOv4 outperformed YOLOv3 in F1, AP, Recall, and Precision (by 20%, 4.8%, 27%, and 4.7%, respectively). The reason was that CSPDarknet-53 utilized as the backbone in YOLOv4 may enhance its detection capability, while SPP and PANet of YOLOv4 afforded feature aggregation at multiple levels to preserve adequate spatial information for small object detection. In terms of detection performance, the proposed MobileNetv3-YOLOv4 model was more appealing than MobileNetv2-YOLOv4, attaining higher performance metrics (F1 by 4%, AP by 3.5%, Recall by 4.1%, and Precision by 1.6%). Consequently, despite the smaller model size of MobileNetv2-YOLOv4, we favor MobileNetv3-YOLOv4. Our model’s AP and F1 score were 1.1% and 2% lower than YOLOv4, but the error was between 4–5%, which was within the acceptable range. Furthermore, the proposed model outperformed the YOLOv4 model in terms of weight indicators affording a reduced average detection time by 0.0141 s and model size by 200 MB. Although the proposed model sacrificed a certain detection accuracy, the error was within a controllable range, and the model size was significantly decreased.

4.4. FHB Detection

We randomly chose an image from the FHB validation set for manual marking, and compared the marking result with the detection result based on the proposed model. As shown in Figure 13, the model detection performance was consistent with the manual marking results, presenting a high detection accuracy. Although the model still had certain deficiencies (Figure 13b, where the blue circle represents missed detection), the ear that was initially infected was detected as normal, but the missed detection rate was low.
Eight models were used to evaluate the testing datasets, with the results demonstrating that under low density, the detection results of YOLOv3 presented marginally less accurate results in some detection frames compared with our algorithm. YOLOv4 missed some detections and presented some false detections. We challenged the proposed model against popular models, with the corresponding results indicating that our model was comparatively lightweight due to fewer network parameters, and its detection performance was comparable to current models. Figure 14 depicted the detection results of randomly selected wheat ears.

5. Discussion

This research proposed a lightweight model for FHB wheat ear detection based on RGB images. The developed model was based on YOLOv4, but had three significant enhancements. First, YOLOv4’s backbone network, CSPDarknet53, was replaced with the lightweight MobileNet. Second, we guaranteed the FHB detection accuracy by employing the CIoU and NMS to regress the loss function and introducing the focal loss into the loss function to reduce the error caused by the unbalanced distribution of positive and negative samples. Finally, we adopted the mix-up training and transfer learning methods to enhance the model’s generalization ability. The proposed model’s performance was challenged against manual annotation, revealing that it outperformed current popular models in wheat ear FHB detection.
The developed lightweight model required only 56 MB, a fifth of the memory required by YOLOv4, achieving an accuracy of 93.69% compared to the competitor models presented in Table 4. Although the size of the proposed model was not the smallest, the precision was relatively high on the basis of ensuring that the proposed model was small enough for my task. Taking these two factors into consideration, we selected MobileNetv3-YOLOv4 as our proposed model. In a recent study, Hayit et al. [50] proposed a deep CNN-based model, named Yellow-Rust-Xception, to classify wheat leaf rust severity with a 91% accuracy. In order to quickly and accurately detect the severity of FHB, a method of detecting the disease utilizing continuous wavelet and particle swarm optimization support vector machines was proposed [51]. This detection model produced the best overall accuracy (93.5%). Jiang et al. [52] enhanced the Visual Geometry Group Network-16 (VGG16) model through multi-task learning to simultaneously detect rice and wheat leaf diseases. For rice leaf diseases, the accuracy was 97.22%, and for wheat leaf diseases, 98.75%. Unlike the methods mentioned above, the proposed wheat ear FHB detection method focused on the lightweight design. The proposed model successfully decreased the network parameters and simplified computing complexity. To ensure a certain accuracy, the model size was also compressed to 1/5 of the state-of-the-art model. Therefore, the proposed model is suitable for deployment on edge devices, technologically supporting a UAV-enabled edge computing system for wheat disease diagnosis. The entire architecture is illustrated in Figure 15. The edge server manages the edge devices, sets the UAV’s flight path, and performs management control. The edge device employs the model trained in the cloud server to detect diseases based on the captured images and uploads them to the cloud server for processing, storage, and updating the model. The detection results are provided to the end-users to intelligently decide in time, promoting the intelligent control of agricultural disease.

6. Conclusions

This paper proposes a lightweight model for wheat ear Fusarium head blight detection. Aiming at the problem that the existing deep neural networks are sizeable to be embedded on edge devices, this paper replaces the backbone network CSPDarknet53 of the YOLOv4 model with the lightweight MobileNetv3. Introducing a lightweight module effectively decreases the parameter cardinality and the computational complexity while preserving the model’s detection performance. The depth-wise separable convolution of lightweight modules reconstructs the object detection model, reducing the convolution operation. Moreover, based on the CIoU loss function in the YOLOv4 model, we introduce the focal loss into the loss function to reduce the error caused by the imbalanced distribution of positive and negative samples. Additionally, Adam automatically optimizes the learning rate. The proposed model parameter cardinality is reduced by 50% compared to the original YOLOv4 model, and the average detection time is reduced by 0.014 s. The experimental results demonstrate that the proposed model has appealing advantages in wheat disease detection, with the detection accuracy on FHB of wheat ear reaching 93.69%, 2.9% higher than the YOLOv4 model. Compared with the YOLOv4 model, on the premise that the precision loss error of AP value is less than 5%, the network model is compressed from 256 MB to 56 MB, improving the detection speed and effectively overcoming the problem of difficult deployment and application. In conclusion, the proposed model could reliably and quickly detect FHB and could be deployed on edge devices. This is important, because reacting in the early stages based on the disease conditions could reduce yield losses and guarantee food security.
The results indicate that the proposed model has great potential for detecting wheat ear FHB in real-time. However, this study was a starting work, with several issues worth considering in subsequent studies.
(1)
This study focused solely on wheat ear FHB detection, ignoring wheat leaf FHB detection. Wheat is also susceptible to a variety of other diseases. As a result, further research of the disease types on this premise should be conducted to realize the detection of wheat leaf and other diseases;
(2)
Although the proposed model successfully detected FHB, incorrect detections of small objects were inevitable. In addition, from Figure 14, due to the background noise, the detection performance of the second image was not as accurate as other models. Future research should enhance the model’s detection performance for extremely small items in complex background;
(3)
This research focused merely on lowering the number of parameters and overlooked the differences between different edge platforms. Future studies should consider designing platform-dependent models to investigate the extended model’s generalization ability further.

Author Contributions

Conceptualization, Q.H. and L.J.; methodology, L.J. and Q.H.; software, L.J. and Z.Z.; validation, L.J. and Q.H.; formal analysis, L.J., Q.H. and T.L.; investigation, L.J., Q.H., Z.Z. and B.L.; data curation, L.J. and C.T.; writing—original draft preparation, L.J.; writing—review and editing, Q.H. and L.J.; visualization, L.J. and Q.H.; supervision, C.T., S.J., C.G., W.M., W.L. and T.L. All authors have read and agreed to the published version of the manuscript.

Funding

This research was funded by the National Natural Science Foundation of China (32071902), the Key Research Program of Jiangsu Province, China (BE2020319), the Yangzhou University Interdisciplinary Research Foundation for Crop Science Discipline of Targeted Support (yzuxk202008) and the Priority Academic Program Development of Jiangsu Higher Education Institutions (PAPD).

Data Availability Statement

Not report any data.

Conflicts of Interest

The authors declare no conflict of interest.

References

  1. Chen, P.F. Estimation of Winter Wheat Grain Protein Content Based on Multisource Data Assimilation. Remote Sens. 2020, 12, 20. [Google Scholar] [CrossRef]
  2. Zhang, L.; Zhang, W.S.; Cui, Z.L.; Schmidhalter, U.; Chen, X.P. Environmental, human health, and ecosystem economic performance of long-term optimizing nitrogen management for wheat production. J. Clean Prod. 2021, 311, 11. [Google Scholar] [CrossRef]
  3. Brandfass, C.; Karlovsky, P. Upscaled CTAB-Based DNA Extraction and Real-Time PCR Assays for Fusarium culmorum and F. graminearum DNA in Plant Material with Reduced Sampling Error. Int. J. Mol. Sci. 2008, 9, 2306–2321. [Google Scholar] [CrossRef] [Green Version]
  4. Anderson, J.A. Marker-assisted selection for Fusarium head blight resistance in wheat. Int. J. Food Micro-Biol. 2007, 119, 51–53. [Google Scholar] [CrossRef] [PubMed]
  5. Xu, S.J.; Wang, Y.X.; Hu, J.Q.; Chen, X.R.; Qiu, Y.F.; Shi, J.R.; Wang, G.; Xu, J.H. Isolation and characterization of Bacillus amyloliquefaciens MQ01, a bifunctional biocontrol bacterium with antagonistic activity against Fusarium graminearum and biodegradation capacity of zearalenone. Food Control. 2021, 130, 10. [Google Scholar] [CrossRef]
  6. Ma, H.Q.; Huang, W.J.; Dong, Y.Y.; Liu, L.Y.; Guo, A.T. Using UAV-Based Hyperspectral Imagery to Detect Winter Wheat Fusarium Head Blight. Remote Sens. 2021, 13, 16. [Google Scholar] [CrossRef]
  7. Wegulo, S.N. Factors Influencing Deoxynivalenol Accumulation in Small Grain Cereals. Toxins 2012, 4, 1157–1180. [Google Scholar] [CrossRef]
  8. Barbedo, J.G.A.; Tibola, C.S.; Lima, M.I.P. Deoxynivalenol screening in wheat kernels using hyperspectral imaging. Biosyst. Eng. 2017, 155, 24–32. [Google Scholar] [CrossRef]
  9. Su, J.Y.; Liu, C.J.; Hu, X.P.; Xu, X.M.; Guo, L.; Chen, W.H. Spatio-temporal monitoring of wheat yellow rust using UAV multispectral imagery. Comput. Electron. Agric. 2019, 167, 10. [Google Scholar] [CrossRef]
  10. Liu, L.Y.; Dong, Y.Y.; Huang, W.J.; Du, X.P.; Ma, H.Q. Monitoring Wheat Fusarium Head Blight Using Unmanned Aerial Vehicle Hyperspectral Imagery. Remote Sens. 2020, 12, 19. [Google Scholar] [CrossRef]
  11. Reder, S.; Mund, J.P.; Albert, N.; Wassermann, L.; Miranda, L. Detection of Windthrown Tree Stems on UAV-Orthomosaics Using U-Net Convolutional Networks. Remote Sens. 2022, 14, 25. [Google Scholar] [CrossRef]
  12. Cui, Z.Y.; Li, Q.; Cao, Z.J.; Liu, N.Y. Dense Attention Pyramid Networks for Multi-Scale Ship Detection in SAR Images. IEEE Trans. Geosci. Remote Sens. 2019, 57, 8983–8997. [Google Scholar] [CrossRef]
  13. Wu, F.Y.; Duan, J.L.; Ai, P.Y.; Chen, Z.Y.; Yang, Z.; Zou, X.J. Rachis detection and three-dimensional localization of cut off point for vision-based banana robot. Comput. Electron. Agric. 2022, 198, 12. [Google Scholar] [CrossRef]
  14. Gu, C.Y.; Wang, D.Y.; Zhang, H.H.; Zhang, J.; Zhang, D.Y.; Liang, D. Fusion of Deep Convolution and Shallow Features to Recognize the Severity of Wheat Fusarium Head Blight. Front. Plant Sci. 2021, 11, 14. [Google Scholar] [CrossRef] [PubMed]
  15. Su, W.H.; Zhang, J.J.; Yang, C.; Page, R.; Szinyei, T.; Hirsch, C.D.; Steffenson, B.J. Automatic Evaluation of Wheat Resistance to Fusarium Head Blight Using Dual Mask-RCNN Deep Learning Frameworks in Computer Vision. Remote Sens. 2021, 13, 20. [Google Scholar] [CrossRef]
  16. Yu, D.B.; Xiao, J.; Wang, Y. Efficient Lightweight Surface Reconstruction Method from Rock-Mass Point Clouds. Remote Sens. 2022, 14, 22. [Google Scholar] [CrossRef]
  17. Bian, Z.; Vong, C.M.; Wong, P.K.; Wang, S. Fuzzy KNN Method With Adaptive Nearest Neighbors. IEEE Transact. Cybernet. 2020, 52, 5380–5393. [Google Scholar] [CrossRef] [PubMed]
  18. Cao, L.J.; Keerthi, S.S.; Ong, C.J.; Uvaraj, P.; Fu, X.J.; Lee, H.P. Developing parallel sequential minimal optimization for fast training support vector machine. Neurocomputing 2006, 70, 93–104. [Google Scholar] [CrossRef]
  19. Zou, B.; Li, L.Q.; Xu, Z.B.; Luo, T.; Tang, Y.Y. Generalization Performance of Fisher Linear Discriminant Based on Markov Sampling. IEEE Trans. Neural Netw. Learn. Syst. 2013, 24, 288–300. [Google Scholar]
  20. Luo, C.W.; Wang, Z.F.; Wang, S.B.; Zhang, J.Y.; Yu, J. Locating Facial Landmarks Using Probabilistic Random Forest. IEEE Signal Process. Lett. 2015, 22, 2324–2328. [Google Scholar] [CrossRef]
  21. Hernandez, S.; Lopez, J.L. Uncertainty quantification for plant disease detection using Bayesian deep learning. Appl. Soft. Comput. 2020, 96, 9. [Google Scholar] [CrossRef]
  22. Picon, A.; Seitz, M.; Alvarez-Gila, A.; Mohnke, P.; Ortiz-Barredo, A.; Echazarra, J. Crop conditional Convolutional Neural Networks for massive multi-crop plant disease classification over cell phone acquired images taken on real field conditions. Comput. Electron. Agric. 2019, 167, 10. [Google Scholar] [CrossRef]
  23. Espejo-Garcia, B.; Mylonas, N.; Athanasakos, L.; Fountas, S.; Vasilakoglou, I. Towards weeds identification assistance through transfer learning. Comput. Electron. Agric. 2020, 171, 10. [Google Scholar] [CrossRef]
  24. Chen, J.D.; Chen, J.X.; Zhang, D.F.; Sun, Y.D.; Nanehkaran, Y.A. Using deep transfer learning for image-based plant disease identification. Comput. Electron. Agric. 2020, 173, 11. [Google Scholar] [CrossRef]
  25. Xiao, Y.X.; Dong, Y.Y.; Huang, W.J.; Liu, L.Y.; Ma, H.Q. Wheat Fusarium Head Blight Detection Using UAV-Based Spectral and Texture Features in Optimal Window Size. Remote Sens. 2021, 13, 19. [Google Scholar] [CrossRef]
  26. Li, Y.S.; Xie, W.Y.; Li, H.Q. Hyperspectral image reconstruction by deep convolutional neural network for classification. Pattern Recognit. 2017, 63, 371–383. [Google Scholar] [CrossRef]
  27. Jin, X.; Jie, L.; Wang, S.; Qi, H.J.; Li, S.W. Classifying Wheat Hyperspectral Pixels of Healthy Heads and Fusarium Head Blight Disease Using a Deep Neural Network in the Wild Field. Remote Sens. 2018, 10, 20. [Google Scholar] [CrossRef] [Green Version]
  28. Singh, P.; Verma, V.K.; Rai, P.; Namboodiri, V.P. Acceleration of Deep Convolutional Neural Networks Using Adaptive Filter Pruning. IEEE J. Sel. Top. Signal Process. 2020, 14, 838–847. [Google Scholar] [CrossRef]
  29. Wu, J.F.; Hua, Y.Z.; Yang, S.Y.; Qin, H.S.; Qin, H.B. Speech Enhancement Using Generative Adversarial Network by Dis-tilling Knowledge from Statistical Method. Appl. Sci. 2019, 9, 8. [Google Scholar]
  30. Peng, P.; You, M.Y.; Xu, W.S.; Li, J.X. Fully integer-based quantization for mobile convolutional neural network inference. Neurocomputing 2021, 432, 194–205. [Google Scholar] [CrossRef]
  31. Howard, A.G.; Zhu, M.; Chen, B.; Kalenichenko, D.; Wang, W.; Weyand, T.; Andreetto, M.; Adam, H. Mobilenets: Efficient convolutional neural networks for mobile vision applications. arXiv 2017, arXiv:1704.04861. [Google Scholar]
  32. Zhang, X.; Zhou, X.Y.; Lin, M.X.; Sun, R.; IEEE. ShuffleNet: An Extremely Efficient Convolutional Neural Network for Mobile Devices. In Proceedings of the 31st IEEE/CVF Conference on Computer Vision and Pattern Recognition (CVPR), Salt Lake City, UT, USA, 18–23 June 2018; pp. 6848–6856.
  33. Ale, L.; Sheta, A.; Li, L.Z.; Wang, Y.; Zhang, N.; IEEE. Deep Learning based Plant Disease Detection for Smart Agriculture. In Proceedings of the IEEE Global Communications Conference (IEEE GLOBECOM), Waikoloa, HI, USA, 9–13 December 2019.
  34. Wang, C.; Zhou, J.; Wu, H.; Teng, G.; Zhao, C.; Li, J. Identification of vegetable leaf diseases based on improved multi-scale ResNet. Trans. Chin. Soc. Agricult. Eng. 2020, 36, 209–217. [Google Scholar]
  35. Toda, Y.; Okura, F. How Convolutional Neural Networks Diagnose Plant Disease. Plant Phenomics 2019, 2019, 14. [Google Scholar] [CrossRef] [PubMed]
  36. Tang, Z.; Yang, J.; Li, Z.; Qi, F. Grape disease image classification based on lightweight convolution neural networks and channelwise attention. Comput. Electron. Agric. 2020, 178, 105735. [Google Scholar] [CrossRef]
  37. Zhao, S.Y.; Peng, Y.; Liu, J.Z.; Wu, S. Tomato Leaf Disease Diagnosis Based on Improved Convolution Neural Network by Attention Module. Agriculture-Basel. 2021, 11, 15. [Google Scholar] [CrossRef]
  38. Chen, J.D.; Zhang, D.F.; Suzauddola, M.; Zeb, A. Identifying crop diseases using attention embedded MobileNet-V2 model. Appl. Soft. Comput. 2021, 113, 12. [Google Scholar] [CrossRef]
  39. Redmon, J.; Divvala, S.; Girshick, R.; Farhadi, A.; IEEE. You Only Look Once: Unified, Real-Time Object Detection. In Proceedings of the 2016 IEEE Conference on Computer Vision and Pattern Recognition (CVPR), Seattle, WA, USA, 27–30 June 2016; pp. 779–788.
  40. Redmon, J.; Farhadi, A.; IEEE. YOLO9000: Better, Faster, Stronger. In Proceedings of the 30th IEEE/CVF Conference on Computer Vision and Pattern Recognition (CVPR), Honolulu, HI, USA, 21–26 July 2017; pp. 6517–6525. [Google Scholar]
  41. Redmon, J.; Farhadi, A. Yolov3: An incremental improvement. arXiv 2018, arXiv:1804.02767. [Google Scholar]
  42. Zhu, L.Z.; Zhang, S.N.; Chen, K.Y.; Chen, S.; Wang, X.; Wei, D.X.; Zhao, H.C. Low-SNR Recognition of UAV-to-Ground Targets Based on Micro-Doppler Signatures Using Deep Convolutional Denoising Encoders and Deep Residual Learning. IEEE Trans. Geosci. Remote Sens. 2022, 60, 13. [Google Scholar] [CrossRef]
  43. Bochkovskiy, A.; Wang, C.-Y.; Liao, H.-Y.M. Yolov4: Optimal speed and accuracy of object detection. arXiv 2020, arXiv:2004.10934. [Google Scholar]
  44. Tian, Y.N.; Yang, G.D.; Wang, Z.; Wang, H.; Li, E.; Liang, Z.Z. Apple detection during different growth stages in orchards using the improved YOLO-V3 model. Comput. Electron. Agric. 2019, 157, 417–426. [Google Scholar] [CrossRef]
  45. Roy, A.M.; Bhaduri, J. Real-time growth stage detection model for high degree of occultation using DenseNet-fused YOLOv. Comput. Electron. Agric. 2022, 193, 14. [Google Scholar]
  46. Li, G.; Suo, R.; Zhao, G.A.; Gao, C.Q.; Fu, L.S.; Shi, F.X.; Dhupia, J.; Li, R.; Cui, Y.J. Real-time detection of kiwifruit flower and bud simultaneously in orchard using YOLOv4 for robotic pollination. Comput. Electron. Agric. 2022, 193, 8. [Google Scholar] [CrossRef]
  47. He, K.M.; Zhang, X.Y.; Ren, S.Q.; Sun, J. Spatial Pyramid Pooling in Deep Convolutional Networks for Visual Recognition. In Proceedings of the 13th European Conference on Computer Vision (ECCV), Zurich, Switzerland, 6–12 September 2014; pp. 346–361. [Google Scholar]
  48. Liu, S.; Qi, L.; Qin, H.F.; Shi, J.P.; Jia, J.Y.; IEEE. Path Aggregation Network for Instance Segmentation. In Proceedings of the 31st IEEE/CVF Conference on Computer Vision and Pattern Recognition (CVPR), Salt Lake City, UT, USA, 18–23 June 2018; pp. 8759–8768.
  49. Wang, C.Y.; Liao, H.Y.M.; Wu, Y.H.; Chen, P.Y.; Hsieh, J.W.; Yeh, I.H. CSPNet: A New Backbone that can Enhance Learning Capability of CNN. In Proceedings of the IEEE/CVF Conference on Computer Vision and Pattern Recognition (CVPR), Electr Network, virtual, 14–19 June 2020; pp. 1571–1580. [Google Scholar]
  50. Hayit, T.; Erbay, H.; Varcin, F.; Hayit, F.; Akci, N. Determination of the severity level of yellow rust disease in wheat by using convolutional neural networks. J. Plant Pathol. 2021, 103, 923–934. [Google Scholar] [CrossRef]
  51. Huang, L.S.; Wu, K.; Huang, W.J.; Dong, Y.Y.; Ma, H.Q.; Liu, Y.; Liu, L.Y. Detection of Fusarium Head Blight in Wheat Ears Using Continuous Wavelet Analysis and PSO-SVM. Agriculture 2021, 11, 13. [Google Scholar] [CrossRef]
  52. Jiang, Z.C.; Dong, Z.X.; Jiang, W.P.; Yang, Y.Z. Recognition of rice leaf diseases and wheat leaf diseases based on multi-task deep transfer learning. Comput. Electron. Agric. 2021, 186, 9. [Google Scholar] [CrossRef]
  53. Ramcharan, A.; McCloskey, P.; Baranowski, K.; Mbilinyi, N.; Mrisho, L.; Ndalahwa, M.; Legg, J.; Hughes, D.P. A Mobile-Based Deep Learning Model for Cassava Disease Diagnosis. Front. Plant Sci. 2019, 10, 8. [Google Scholar] [CrossRef] [Green Version]
  54. Gonzalez-Huitron, V.; Leon-Borges, J.A.; Rodriguez-Mata, A.E.; Amabilis-Sosa, L.E.; Ramirez-Pereda, B.; Rodriguez, H. Disease detection in tomato leaves via CNN with lightweight architectures implemented in Raspberry Pi. Comput. Electron. Agric. 2021, 181, 9. [Google Scholar]
  55. Liu, J.; Wang, X.W. Tomato Diseases and Pests Detection Based on Improved Yolo V3 Convolutional Neural Network. Front. Plant Sci. 2020, 11, 12. [Google Scholar] [CrossRef]
Figure 1. Comparison between YOLOv4 and other state-of-the-art object detectors. (* AP refers to average accuracy. FPS refers to the number of frames processed per second. YOLOv4 is more faster than EfficientDet with the same AP value and improves YOLOv3’s AP and FPS by 10% and 12%, respectively.)
Remotesensing 14 03481 g001
Figure 2. Wheat images infected with FHB.
Remotesensing 14 03481 g002
Figure 3. The annotation results of diseased wheat ear image. (a) The original image. (b) PNG gray image.
Remotesensing 14 03481 g003
Figure 4. YOLO detection (YOLO algorithm models detection as a regression problem. It divides the image into an S × S grid and for each grid cell predicts bounding boxes, confidence for those boxes and class probabilities).
Remotesensing 14 03481 g004
Figure 5. (a) Standard convolution process and (b) Depth-wise separable convolution process.
Remotesensing 14 03481 g005
Figure 6. The proposed lightweight network structure based on the YOLOv4.
Remotesensing 14 03481 g006
Figure 7. The structure of bneck.
Remotesensing 14 03481 g007
Figure 8. The structure of PANet. (a) FPN backbone, (b) Bottom-up path augmentation, (c) Adaptive feature pooling, (d) Box branch, and (e) Fully-connected fusion.
Remotesensing 14 03481 g008
Figure 9. Examples of wheat disease images after image enhancement. (a) Original image, (b) horizontal flipping and cropping, (c) cropping and minor Gaussian blurring, and (d) cropping and contrast and brightness change.
Remotesensing 14 03481 g009
Figure 10. The loss values of YOLOv4 and the improved models.
Remotesensing 14 03481 g010
Figure 11. Detailed loss value between epoch 10 and 40.
Remotesensing 14 03481 g011
Figure 12. PR curves of YOLOv4 and improved models.
Remotesensing 14 03481 g012
Figure 13. Comparison between manual annotation and the proposed model. (a) Manual annotation and (b) detection results of the proposed model.
Remotesensing 14 03481 g013
Figure 14. Comparisons of FHB detection with different algorithms. (a) The original images. (b) YOLOv3. (c) YOLOv4. (d) YOLOv4-tiny. (e) YOLOv4 with ResNet50. (f) YOLOv4 with VGG. (g) Ours.
Remotesensing 14 03481 g014aRemotesensing 14 03481 g014b
Figure 15. System architecture.
Remotesensing 14 03481 g015
Table 1. MobileNetv3 network structure.
InputOperationNumber of ChannelsSEHSStrideOutput
416 × 416 × 3Conv, 1 × 116--2208 × 208 × 16
208 × 208 × 16Bneck, 3 × 316--1208 × 208 × 16
208 × 208 × 16Bneck, 3 × 324--2104 × 104 × 24
104 × 104 × 24Bneck, 3 × 324--1104 × 104 × 24
104 × 104 × 24Bneck, 5 × 540-252 × 52 × 40
52 × 52 × 40Bneck, 5 × 540-152 × 52 × 40
52 × 52 × 40Bneck, 3 × 380-226 × 26 × 80
26 × 26 × 80Bneck, 3 × 380-126 × 26 × 80
26 × 26 × 80Bneck, 3 × 3112126 × 26 × 112
26 × 26 × 112Bneck, 3 × 3112126 × 26 × 112
26 × 26 × 80Bneck, 5 × 5160213 × 13 × 160
13 × 13 × 160Bneck, 5 × 5160113 × 13 × 160
Table 2. Parameter statistics of four network models.
Network ModelParameter/Ten Thousand
YOLOv45000–6000
MobileNetv1-YOLOv41269.20
MobileNetv2-YOLOv41080.12
MobileNetv3-YOLOv41172.91
Table 3. Performance comparison between different models.
ModelAPF1 ScoreRecallPrecisionTime/sSize/MB
YOLOv376.44%58%41.81%86.08%0.1140247
YOLOv481.28%78%68.43%90.72%0.1249256
YOLOv4-tiny79.99%73%61.09%91.33%0.100424
YOLOv4 with ResNet5080.81%76%65.36%92.07%0.1123134
YOLOv4 with VGG80.41%75%62.63%92.68%0.117494
MobileNetv1-YOLOv479.50%74%61.43%92.31%0.107154
MobileNetv2-YOLOv476.64%72%59.22%92.04%0.108449
Ours80.17%76%63.31%93.69%0.110856
Table 4. Performance comparison of the proposed model with previous studies.
ReferencePlantModelPrecision
Ramcharan et al. [53]CassavaMobileNet84.7%
Gonzalez-Huitron et al. [54]Tomato leavesNASNetMobile84%
Hayit et al. [50]WheatXception91%
Liu et al. [55]TomatoImproved YOLOv392.39%
Huang et al. [51]Wheat earContinuous wavelet analysis and PSO-SVM93.5%
Jiang et al. [52]Wheat leafMulti-task deep learning transfer98.75%
Proposed methodWheat earMobileNetv3-YOLOv493.69%
Publisher’s Note: MDPI stays neutral with regard to jurisdictional claims in published maps and institutional affiliations.

