
Quantifying Vegetation Vulnerability to Climate Variability in China


1
School of Geography and Tourism, Chongqing Normal University, Chongqing 401331, China
2
Chongqing Key Laboratory of GIS Application, Chongqing 401331, China
3
College of Chemistry, Chongqing Normal University, Chongqing 401331, China
4
State Key Laboratory of Desert and Oasis Ecology, Xinjiang Institute of Ecology and Geography, Chinese Academy of Sciences, Urumqi 830011, China
5
Department of Geography, Ghent University, 9000 Ghent, Belgium
*
Author to whom correspondence should be addressed.
Remote Sens. 2022, 14(14), 3491; https://0-doi-org.brum.beds.ac.uk/10.3390/rs14143491
Submission received: 26 May 2022
/
Revised: 2 July 2022
/
Accepted: 18 July 2022
/
Published: 21 July 2022
(This article belongs to the Special Issue Remote Sensing for Land Degradation and Drought Monitoring)
Abstract
:Climate variability has profound effects on vegetation. Spatial distributions of vegetation vulnerability that comprehensively consider vegetation sensitivity and resilience are not well understood in China. Furthermore, the combination of cumulative climate effects and a one-month-lagged autoregressive model represents an advance in the technical approach for calculating vegetation sensitivity. In this study, the spatiotemporal characteristics of vegetation sensitivity to climate variability and vegetation resilience were investigated at seasonal scales. Further analysis explored the spatial distributions of vegetation vulnerability for different regions. The results showed that the spatial distribution pattern of vegetation vulnerability exhibited spatial heterogeneity in China. In spring, vegetation vulnerability values of approximately 0.9 were mainly distributed in northern Xinjiang and northern Inner Mongolia, while low values were scattered in Yunnan Province and the central region of East China. The highest proportion of severe vegetation vulnerability to climate variability was observed in the subhumid zone (28.94%), followed by the arid zone (26.27%). In summer and autumn, the proportions of severe vegetation vulnerability in the arid and humid zones were higher than those in the other climate zones. Regarding different vegetation types, the highest proportions of severe vegetation vulnerability were found in sparse vegetation in different seasons, while the highest proportions of slight vegetation vulnerability were found in croplands in different seasons. In addition, vegetation with high vulnerability is prone to change in Northeast and Southwest China. Although ecological restoration projects have been implemented to increase vegetation cover in northern China, low vegetation resilience and high vulnerability were observed in this region. Most grasslands, which were mainly concentrated on the Qinghai–Tibet Plateau, had high vulnerability. Vegetation areas with low resilience were likely to be degraded in this region. The areas with highly vulnerable vegetation on the Qinghai–Tibet Plateau could function as warning signals of vegetation degradation. Knowledge of spatial patterns of vegetation resilience and vegetation vulnerability will help provide scientific guidance for regional environmental protection.
1. Introduction
Global warming leads to an increase in extreme events, which cause spatially heterogeneous vegetation responses and impact the structure and function of ecosystems [1,2,3]. Furthermore, extreme weather events will become more frequent, and seasonal climate changes will be more significant in the future [4,5]. Subsequently, the relationship between vegetation and climate will become more complicated [6,7,8]. Therefore, exploring the responses of vegetation to climate fluctuations is necessary to develop adaptation strategies.
Vegetation vulnerability to climate variability is emerging as a hot research topic. A special report from the Intergovernmental Panel on Climate Change (IPCC) highlighted the importance of studying vegetation responses to climate change from a vulnerability perspective [9]. The concept of vegetation vulnerability combines the roles of climate variability and vegetation dynamics [10,11]. More deeply investigating the process of vegetation change in response to climate variation could improve the effectiveness of adaptation strategies to control vegetation degradation [9]. Vegetation can self-regulate under external disturbances. When the external disturbance exceeds the self-regulation ability, the vegetation will develop towards another stable state (vegetation improvement or vegetation degradation) [12,13]. Vegetation is sensitive to climate fluctuations, particularly in subhumid and semiarid zones. Vegetation resilience is the key process of recovery that cannot be ignored in vegetation variation research [14]. China has complex and diverse climate types, including hyperarid zones and humid zones. The ecological environment is fragile with obvious spatial differences [15,16]. Thus, quantifying vegetation vulnerability to climate variability by comprehensively considering vegetation sensitivity (i.e., the degree of vegetation change in response to climate variability) and engineering resilience (i.e., the process of vegetation recovery following disturbance) is critical for protecting the ecological environment in this region.
So far, the responses of vegetation to climatic variability have been investigated on a regional and global scale in previous studies, which has enhanced our knowledge of the impact of climate change on vegetation growth [17,18,19]. When considering only short-term changes in vegetation or states of vegetation at a certain time, the response of vegetation to climate change cannot be accurately reflected. Vegetation can self-regulate under external environmental interference. Thus, vegetation resilience should be monitored over a certain period of time [20]. Currently, the concept of resilience can generally be defined as ecological resilience and engineering resilience [20,21]. Engineering resilience can be quantified by the autocorrelation model, which has become a popular method and has been widely applied to measure engineering resilience in previous studies [20,22,23,24]. In addition, the surface soil has a long “moisture memory” for previous precipitation, with an average memory time of approximately 5.6 months [25]. Vegetation growth could be affected by previous climatic variability [26,27,28]. Previous climatic conditions at a point in time (the time-lag effect) and from a point time to the current time (cumulative effects) should be considered to further understand the vegetation–climate interaction. However, few studies have considered the cumulative and lagging impacts of climate on vegetation when monitoring vegetation sensitivity. Furthermore, deriving an understanding of vegetation vulnerability by considering only resilience or sensitivity may be limited [10]. Due to variations in resilience and sensitivity, the responses of vegetation to the same climate disturbance can differ. Thus, there is a strong need to assess vegetation vulnerability by comprehensively considering vegetation sensitivity and resilience [29]. Vegetation dynamics have been explored on a regional scale in previous studies [30,31,32]. Previous studies reported that vegetation variation was related to vegetation vulnerability [1,24]. Few vegetation vulnerability studies considered changes in vegetation and many were limited to understanding the impacts of vegetation vulnerability in space. Discussing vegetation change and vegetation vulnerability is critical to deeply understanding vegetation dynamics. At the time scale, most previous studies quantified vegetation vulnerability based only on annual analyses and ignored seasonal climate change. The main climatic driver of vegetation change varies over time, and vegetation vulnerability to climate variability depends not only on the magnitude but also on the time of occurrence [33]. From a spatial perspective, different vegetation types and different climate zones were affected differently by climatic fluctuations. Vegetation vulnerability has been shown to be related to vegetation coverage and wet conditions [1,34]. Therefore, considering the cumulative and lagging impacts of climate, knowledge of vegetation vulnerability to climate variability in relation to vegetation variation is needed to provide decision-making references for ecological environment protection, especially in environmentally fragile areas.
Large drylands occur in China and have a fragile ecological environment. In recent decades, vegetation greening has been reported in previous studies [35,36]. Part of the reason is that ecological restoration projects were implemented by the Chinese government [37]. Vegetation vulnerability at the seasonal scale in China is ambiguous. Knowledge of the spatial patterns of vegetation vulnerability will help provide scientific guidance for regional environmental protection. Hence, vegetation vulnerability was investigated based on the combination of vegetation resilience and sensitivity from 1982 to 2015 at a seasonal scale in China. The distribution and degree of vegetation vulnerability were compared for different regions in this study. The objectives of the study were to (1) quantify vegetation sensitivity to climate variability by considering the cumulative and lagging effects; (2) calculate vegetation resilience; and (3) explore spatial distributions of vegetation vulnerability at the seasonal scale.
2. Materials and Methods
2.1. Study Area
China has a complex topography and is in the eastern part of Asia. The land area of China covers 9.6 million km2 and its terrain gradually increases from east to west [38]. The mountain ranges are mostly in the east–west and northeast directions, and mainly include Altai, Tianshan, Kunlun, the Himalayas and other mountains (Figure 1a).
The climates in China are complex and diverse and they differ from region to region [39]. In the southeast region, the climate includes substantial rainfall and a semitropical summer. The northern and central regions are characterized by temperate summers and cool winters, with continual rainfall. Hot and dry summers and cold harsh winters are found in the northeast areas. Furthermore, monsoons cause large rain showers in the summer from the eastern sea areas, while dry and cold winds in the winter come from the high-latitude regions [40]. China has five climate zones: humid, subhumid, semiarid, arid and hyperarid. The humid and subhumid zones are gathered in southern China, accounting for 38.79% and 14.57%, respectively, while most northern regions are semiarid (34.95%) and arid (10.27%) zones (Figure S1, Supplementary Material).
The ecological environment in China is fragile and has spatial heterogeneity [16,41]. Croplands and forest account for 22.40% and 18.14%, respectively, and are mainly distributed in the eastern region. Most western regions are dominated by grasslands and no vegetation areas, which account for 31% and 18.56%, respectively. Sparse vegetation (2.53%) is scattered throughout China. Moreover, 5.76% of the area being studied underwent land-use changes during the study period (Figure 1b). Due to the intensification of climate dynamics, monitoring vegetation vulnerability to climate variability through the combination of vegetation resilience and sensitivity is emerging as a research hotspot.
2.2. Data Sources
Normalized difference vegetation index (NDVI) data, climate data, land-use data and an aridity index (AI) dataset were used in the research. The detailed information of the dataset is given in Table S1.
The NDVI can be used as a monitoring indicator of vegetation conditions [30]. The NDVI dataset was provided by the global inventory modelling and mapping studies (GIMMS) project and was originated from NOAA’s advanced very high-resolution radiometer (AVHRR) data. The datasets cover from 1982 to 2015 and its spatial resolution and temporal resolution are 8 km and 15 days, respectively. The maximum value composite method was applied to acquire the monthly NDVI dataset.
The gridded monthly precipitation, temperature and surface solar radiation downwards data were obtained at a spatial resolution of 10 km from ERA5, which is a new climate dataset produced by the European Centre for Medium-Range Weather Forecasts (ECMWF). ERA5 provides monthly atmospheric, oceanic climate and land variables from 1982 to the present. Based on the data assimilation systems and advanced modelling, many historical meteorological station observations were used to produce global gridded climate data in ERA5. The original climatic variables were resampled to 8 km to match the resolution of the NDVI dataset for further analysis by using bilinear interpolation.
The AI dataset was produced by Antonio Trabucco and Robert Zomer at a spatial resolution of 1 km and was produced from the Worldclim dataset [42] (https://figshare.com/ndownloader/files/14118800 accessed on 5 April 2022). The Worldclim dataset originated from vast amounts of climate station observations. The AI dataset could quantify the difference between potential evapotranspiration and precipitation availability. It was used to divide climate zones in the study. The climate zone was categorized into the following classes: humid (AI > 0.65), subhumid (0.5 < AI ≤ 0.65), semiarid (0.2 < AI ≤ 0.5), arid (0.03 < AI ≤ 0.2) and hyperarid (AI < 0.03) [39].
Land-use data from 1992 to 2015 were provided by the European Space Agency (ESA) and originated from AVHRR, SPOT and MERIS data (https://maps.elie.ucl.ac.be/CCI/viewer/ accessed on 20 April 2022). They were highly precise because they utilized a good quality control [43]. Constant vegetation types were identified to ensure statistical comparability in the study. For further analysis, these two datasets were resampled to 8 km to be consistent with the resolution of the NDVI dataset.
2.3. Methods
2.3.1. Vegetation Sensitivity Index
The vegetation sensitivity index (VSI) proposed by Seddon in 2016 is useful to quantitatively assess the sensitivity of vegetation to short-term climate variability [44]. The growth of vegetation can be influenced by climate chronologically and accumulatively over a period of time, forming cumulative climate effects [45,46,47]. By considering the cumulative and lagging effects, a more robust understanding of the relationship between climate change and vegetation dynamics can be achieved [48,49]. Thus, cumulative climate effects were included when estimating the VSI.
To determine the cumulative effects of climatic factors (precipitation, temperature and solar radiation) on vegetation growth, a linear regression was used between NDVI and each climatic factor as follows:
where and are the coefficients; refers to the interval month relative to the current month; represents the variable at month ; and is the cumulative duration. is the NDVI values at month . PRE, TEM, and SR refer to precipitation, temperature and solar radiation, respectively. is random error.
The lagged time of vegetation response to climate at a monthly scale is generally less than a quarter [50,51,52], while the influence of the time lag on the cumulative effect is greater [48], thus, the maximum of the cumulative duration was determined to be 3, that is, ranges between 0 and 3 in this study. The cumulative duration () that has the highest determination coefficient (R2) is regarded as the optimal cumulative length () for vegetation responses to a climatic factor. Based on the optimal cumulative length (), the cumulative climate can be obtained as follows:
where , , and are the cumulative precipitation, temperature and solar radiation, respectively. The analysis of the cumulative climate effect is based on the vegetation growing season. According to previous studies, the vegetation growing season is from April to October in China. The growing season can be divided into three seasons: spring (April and May), summer (June to August), and autumn (September and October) for the purposes of studying vegetation in China [53,54].
The VSI can be calculated as [55]:
where , and are the metrics of vegetation sensitivity to temperature, precipitation, and solar radiation, respectively, and , and represent the weighted coefficients for each sensitivity to the climatic factors.
Considering memory effects, the weighted coefficients were extracted based on a one-month-lagged autoregressive model, which combined climate change and one-month-lagged vegetation anomalies to monitor areas with strong vegetation coupling to climate anomalies. Hypothesized ecological tolerance limits were used to determine the relative importance of different climatic drivers for vegetation change, which represents a major advancement from previous studies. Furthermore, we introduced the cumulative climate effects in this study:
where and are the NDVI values at month and , respectively; , , , and are the regression coefficients; and is the residual error. To eliminate the impact of colinearity, a principal components regression was utilized to quantify the relative importance (, and ) of the three climatic factors.
The sensitivity metrics were estimated from the variances in the , , and time series. For each variable, a quadratic model was first applied to fit the mean–variance relationship, and the residual of the fit model was then standardized to between 0 and 100 to determine variability. The log10-transformed ratios between the NDVI variability and the variability of the climate variables (PRE, TEM, and SR) were regarded as the sensitivity metrics (, , and ). The detailed flow can be described by Seddon et al. [55].
2.3.2. Resilience Index
Several studies have suggested that the autocorrelation model can be used as measures of vegetation resilience [20,22,24,56]. Smith et al. [56] demonstrated that the vegetation recovery rates from disturbances can be closely approximated from the vegetation change features in terms of the autocorrelation model. Thus, the resilience index (RI) was estimated using the temporal autocorrelation (TAC) of the NDVI time series. The seasonal RI was estimated using TAC of the seasonal NDVI time series, which were composed of months for each season in all years. In order to obtain an accurate estimation of TAC, the seasonal NDVI time series were first decomposed with seasonal-trend decomposition using Loess [57] to remove the long-term trends and periodic patterns. The following formula can be used to estimate the TAC [58]:
where stands for the remainder of the NDVI time series after removing the long-term trends and periodic patterns; and is the value of TAC. Highly autocorrelated events (high TAC) represent a slow recovery rate (low resilience); thus, the metric of resilience can be expressed as follows [29]:
where RI is the resilience index.
2.3.3. Vegetation Vulnerability Index
The vegetation vulnerability index (VI) was incorporated in this study by comprehensively considering vegetation sensitivity and resilience. VI was determined by the following equation:
where VI refers to the vegetation vulnerability index, and VSI and RI are the vegetation sensitivity index and vegetation resilience index, respectively.
2.3.4. Sen’s Slope
The change trends in seasonal climatic factors were calculated by Theil–Sen’s estimator in the study. The time series is defined as . The slope coefficient of each pixel was estimated by the following equation (Gocic and Trajkovic, 2013):
where β is the slope coefficient of the time series change. i and j represent the estimate of the trend magnitude. If β < 0, a decreasing trend was observed in the time series. If β > 0, an increasing trend was identified in the time series.
The Mann–Kendall test was applied to test the significant change trends in seasonal NDVI and climatic factors. xi (i =1,2, … n) refers to the yearly value. The Mann–Kendall test statistic S is defined by the following formula [59,60]:
The variable statistics were computed as follows:
where ti represents the ties’ number of extent i, and n and m are the number of years and tied groups, respectively. The standard normal test statistic ZS is calculated as follows:
In this study, significance levels α = 0.05 were selected to judge the significance of the change trend. If |ZS| ≥ 1.96, the significance of the change trend was judged at a 5% significance level.
3. Results
3.1. Quantifying Vegetation Sensitivity to Climate Variability
The spatial distributions of vegetation sensitivity were calculated at the seasonal scale, as shown in Figure 2. In spring, high VSI values were distributed in Northeast China, while low values were concentrated in the central region of East China. In summer, most regions showed low VSI values, while higher values were scattered in the humid zone in Southeast China. The distribution patterns of vegetation sensitivity in autumn were remarkably similar to those in summer. Notably, relatively high values were mostly concentrated in the humid zone of Southwest China. When the whole growing season was considered, high VSI values were observed in the humid and subhumid zones of the southwestern and northeastern regions, while low values were distributed in the semiarid area in the north.
3.2. Quantifying Vegetation Resilience to Climate Variability
The spatial distributions of vegetation resilience for different seasons are shown in Figure 3. In spring, the vegetation had high resilience in South China and low resilience in the semiarid area in the north. RI values of approximately 0 were mainly distributed in the arid zone of northeastern China. The distribution patterns of vegetation resilience in summer were remarkably similar to those in spring. Notably, we found that relatively low values were mostly concentrated in the central region of the northern and oasis regions of Xinjiang Province. The vegetation in the north had higher resilience in autumn than in summer. When the whole growing season was considered, low values of RI were distributed in the hyperarid areas and semiarid areas in the north, while high values were observed in the southern region. Overall, the spatial distribution pattern of vegetation resilience presented obvious spatial variation in China.
Frequency distributions of VSI and RI for different regions are shown in Figure 4. As climate zones become more humid, vegetation resilience increases in different seasons. The magnitude of the vegetation resilience in the humid zone was approximately 0.75. However, the vegetation resilience in the hyperarid zone was higher than that in the arid zone. In contrast, there was little difference in the vegetation sensitivity in different climate zones. The vegetation in the humid zone in summer and autumn was most sensitive to climate change and had higher VSI values, while the semiarid and hyperarid zones had lower values, particular in autumn.
Regarding different vegetation types, as the vegetation coverage increased, vegetation resilience increased in different seasons. The highest values (approximately 0.75) of RI were observed for forests, while sparse vegetation had lower values (approximately 0.4), particularly in spring and summer. For vegetation sensitivity, the overall impacts of climate change on vegetation varied little among vegetation types. Notably, we found relatively high VSI values for forests in most seasons, while lower values were detected for croplands in different seasons. In general, vegetation sensitivity was less spatially heterogeneous than vegetation resilience. Higher vegetation sensitivity was observed in the humid zone, especially for forests. Vegetation resilience exhibited obvious associations with dry conditions and vegetation coverage. With the increase in vegetation coverage and the decrease in dry degree, the amplitude of vegetation resilience gradually increased.
3.3. Spatial Distributions of Vegetation Vulnerability at the Seasonal Scale
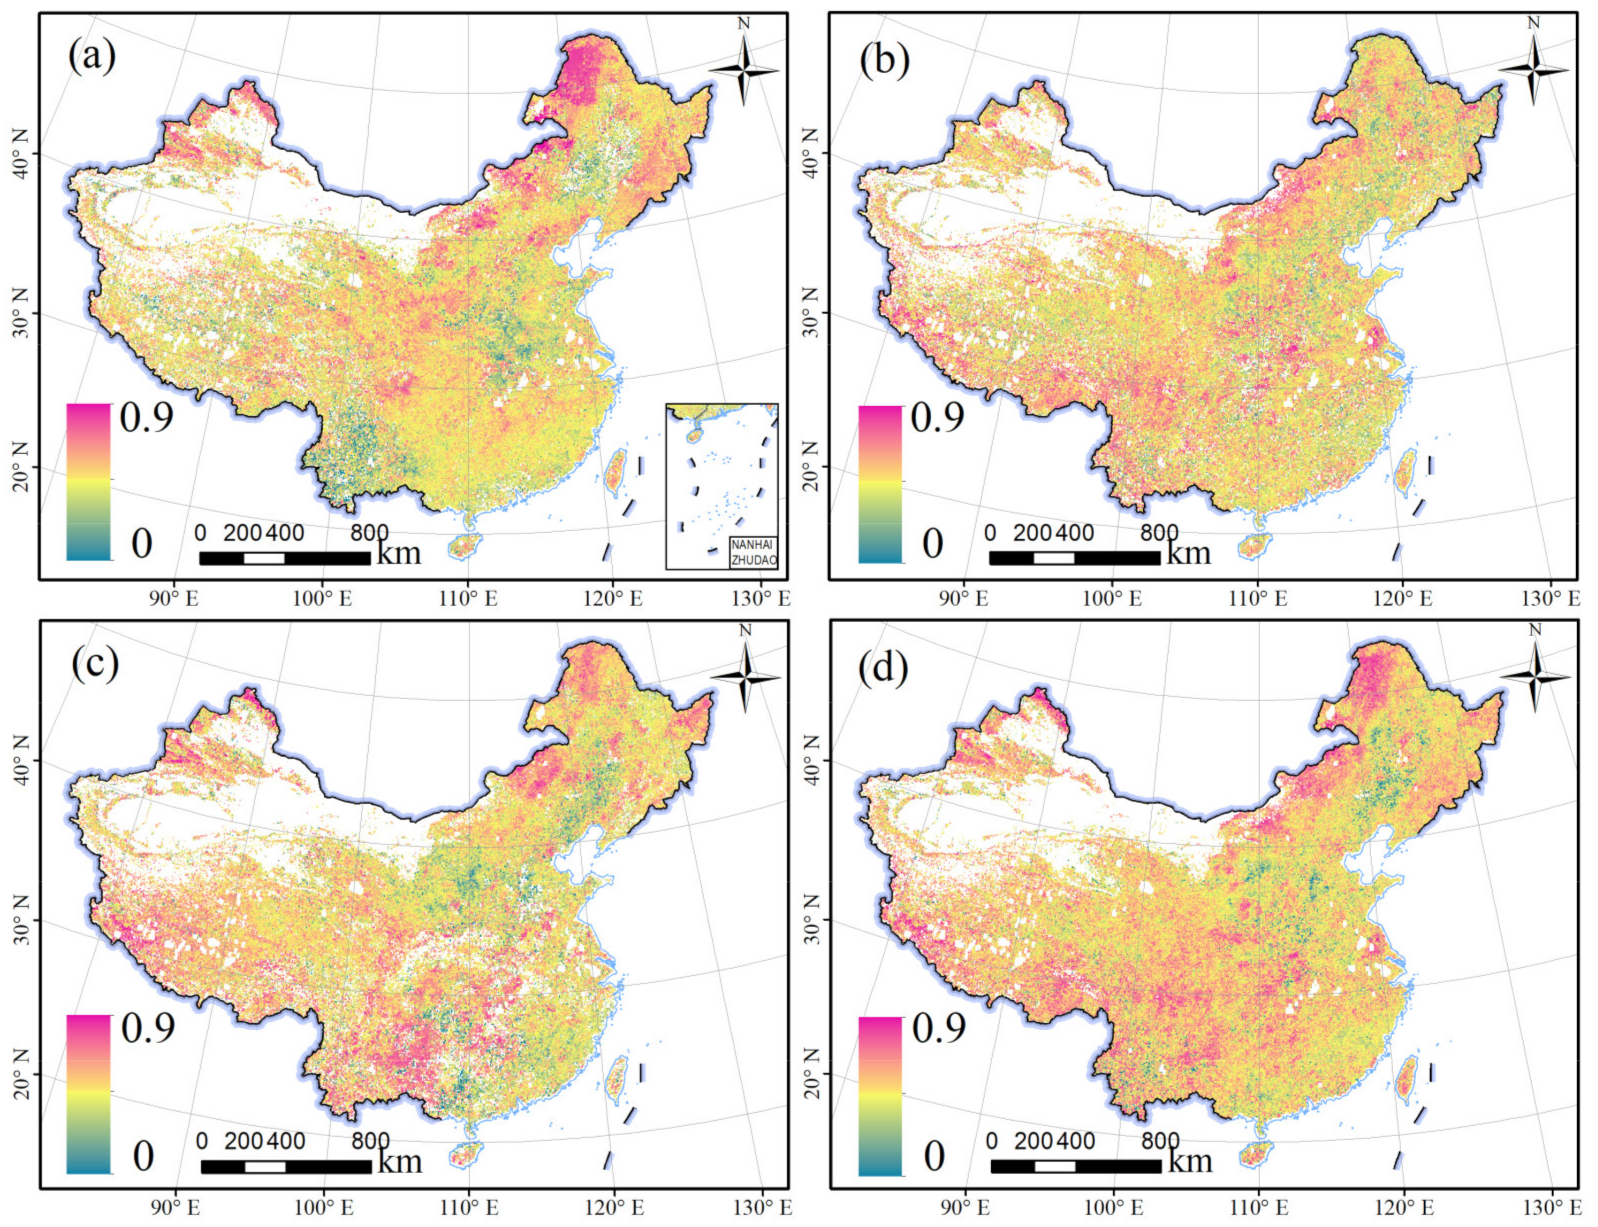
The spatial distributions of vegetation vulnerability in different seasons are shown in Figure 5. In spring, high values of the VI were found in North China. VI values of approximately 0.9 were mainly distributed in northern Xinjiang and northern Inner Mongolia, while low values were scattered in Yunnan province and the central region of East China. In summer, vegetation vulnerability in the arid region of northern China was alleviated; however, the area of higher vegetation vulnerability increased in Southwest China compared with spring. In autumn, the distribution patterns of vegetation vulnerability in North China were remarkably similar to those in spring. However, the vegetation in Southwest China had a higher vulnerability in autumn than in spring. When the whole growing season was considered, high VI values were observed in the northern and southwestern regions, while low VI values were distributed in the central region of East China. Overall, the distribution pattern of vegetation vulnerability exhibited spatial heterogeneity in China.
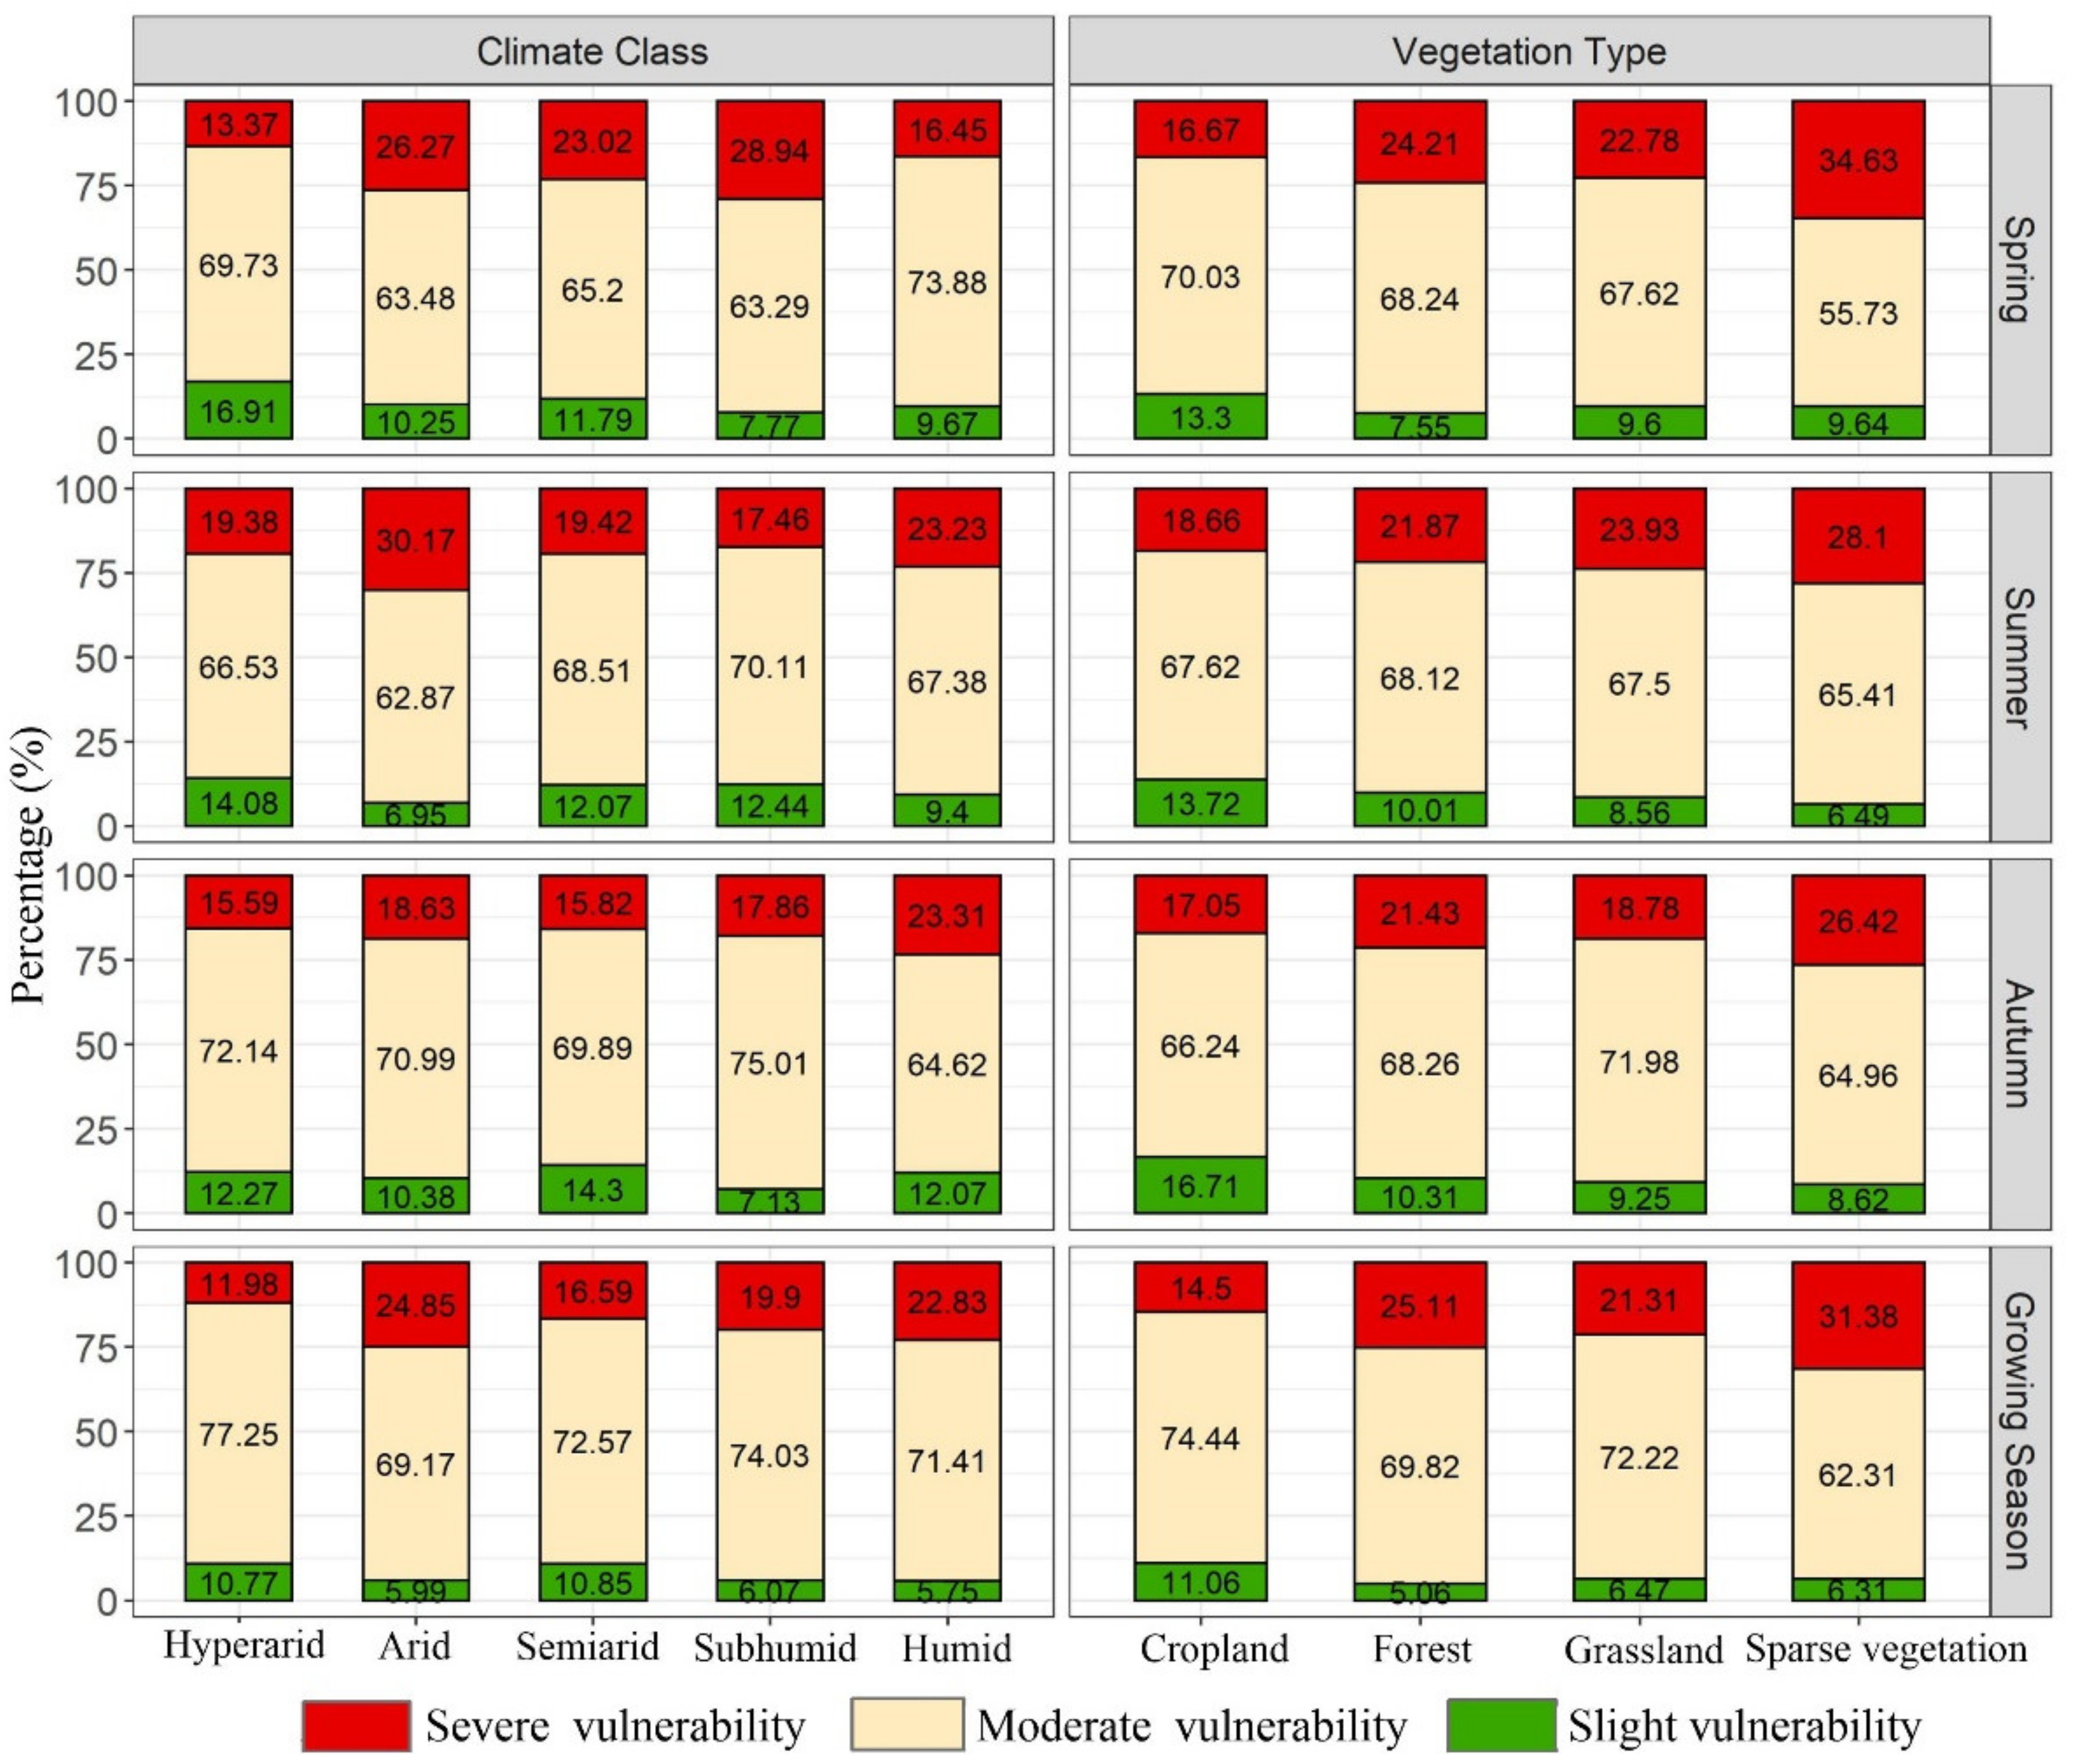
Vegetation vulnerability can be categorized as slight vegetation vulnerability (0 ≤ VI < 0.3), moderate vegetation vulnerability (0.3 ≤ VI < 0.6) and severe vegetation vulnerability (0.6 ≤ VI < 0.9). A comparison of the percentages of vegetation vulnerability classes in different regions is shown in Figure 6. The percentages of moderate vegetation vulnerability were higher than those of the other vegetation vulnerability classes in all the vegetation types and climate zones. Comparing the different climate zones in spring, the proportion of moderate vegetation vulnerability was highest in the humid zone (73.83%), followed by the hyperarid zone (69.73%), whereas the highest proportion of severe vegetation vulnerability was observed in the subhumid zone (28.94%), followed by the arid zone (26.27%). The hyperarid zone had the highest proportion of slight vegetation vulnerability at 16.91%. In summer, the proportions of severe vegetation vulnerability in the arid (30.17%) and humid zones (23.23%) were higher than those in the other climate zones, while the opposite pattern was observed for moderate vegetation vulnerability. In autumn, large proportions of severe vegetation vulnerability were observed in the humid and arid zones at 23.31% and 18.63%, respectively, and the hyperarid zone had the highest proportion of slight vegetation vulnerability at 12.27%. Throughout the growing season, severe vegetation vulnerability in the humid and arid zones accounted for 22.83% and 24.85% of the vulnerability categories, respectively. In contrast, the semiarid zone exhibited more areas with slight vegetation vulnerability (10.85%). Furthermore, we found that the hyperarid zone had a higher percentage of moderate vegetation vulnerability (77.25%) than the other zones.
Regarding the different vegetation types, the highest proportions of severe vegetation vulnerability were found in sparse vegetation in different seasons, while the highest proportions of slight vegetation vulnerability were found in croplands in different seasons. In spring, the highest proportion of severe vegetation vulnerability was identified in sparse vegetation, at 34.63%, followed by forests (24.21%). In contrast, croplands exhibited more areas with slight vegetation vulnerability (13.30%). In summer, sparse vegetation and grasslands had high proportions of severe vegetation vulnerability at 28.10% and 23.93%, respectively. Croplands had the highest proportion of slight vegetation vulnerability at 13.72%. The percentages of the vegetation vulnerability classes in autumn were remarkably similar to those in summer. For the whole growing season, the proportion of severe vegetation vulnerability in sparse vegetation (31.38%) was higher than that in the other vegetation types. The proportion of slight vegetation vulnerability in croplands was 11.06%, which was higher than that in the other vegetation types. Overall, the proportions of severe vegetation vulnerability decreased in the following order: sparse vegetation, forests, grasslands and croplands. The differences in vegetation changes in different regions are obvious.
4. Discussion
4.1. Vegetation Sensitivity to Different Climatic Factors
Vegetation growth is typically triggered by the comprehensive influences of different climatic factors [29]. The combination of cumulative climate effects and a one-month-lagged autoregressive model represents an advance in the approach applied in this study to identify the relative importance of different climatic factors for driving vegetation change. Vegetation sensitivity to different climatic factors was identified for different seasons in this study (Figure S2, Supplementary Material). Vegetation sensitivity to different climatic factors differed temporally and spatially. A seasonal shift in climate influence on vegetation was detected in China. In spring, temperature was the dominant climate factor that affected vegetation dynamics in most regions, which is consistent with previous studies [33,61]. Spring warming could extend the growing season to stimulate vegetation growth [62]. Then, the influence of temperature on vegetation gradually weakened during the subsequent seasons (Figure S2, Supplementary Material). Moreover, vegetation sensitivity to precipitation and solar radiation increased in summer and autumn. Previous studies also reported similar shifts in the importance of climatic factors to vegetation [33,63]. The strengthened influence of precipitation in summer was triggered by increased vegetation evapotranspiration [30]. The increased impact of solar radiation in autumn was attributed to delayed autumn phenology. Insolation could delay leaf fall in the autumn and extend the growing season [64].
As the climate zones became drier, the vegetation became more sensitive to precipitation throughout the growing season, especially in spring and summer (Figure S3, Supplementary Material). The arid zone was characterized by a low soil moisture content and a high surface evapotranspiration. Vegetation growth in these regions was controlled by water availability. Precipitation was a main driver affecting vegetation changes under dry conditions, especially for sparse vegetation, which was mainly distributed in arid regions [65]. Furthermore, the early growth stage of vegetation has a low tolerance for dry spells [66]. The higher weights of precipitation in spring and summer were distributed in the dry zone and found in sparse vegetation (Figure S3, Supplementary Material). In contrast, abundant precipitation was observed in humid areas, and the water storage capacity of soil in humid areas was higher than that in arid areas [67,68]. Thus, vegetation in humid areas was less sensitive to precipitation than vegetation in other areas (Figure S3, Supplementary Material). In addition, as the climate zone became more humid, the influence of solar radiation on vegetation became stronger. Solar radiation is the main source of energy for vegetation growth on Earth. Solar radiation could affect all aspects of vegetation growth and development with light sum, heat and morphological effects [69]. Compared with the dry areas of Northwest China, the humid regions had lower solar radiation, and vegetation growth in these regions was more affected by solar radiation than by precipitation and temperature (Figure S3, Supplementary Material), which is consistent with the findings of previous studies [48,70]. Subsequently, most forests are concentrated in humid regions, and higher percentages of dominant effects by solar radiation were observed in the growing season (Figure S3, Supplementary Material). However, although a warming climate in dry regions is beneficial to vegetation growth, elevated temperatures can greatly increase vegetation evapotranspiration and respiration, which leads to water stress and limits vegetation growth [70]. Thus, high weights of precipitation and temperature were observed in dry regions (Figure S3, Supplementary Material).
4.2. The Driver of Vegetation Resilience
Vegetation has the ability to self-regulate and return to its original state after external disturbances [12,13]. Vegetation resilience is a key process that cannot be ignored in vegetation dynamics monitoring. Our study revealed that vegetation resilience varied across space for different seasons (Figure 3). Vegetation resilience gradually increased with the increase in the humidity of the climate zone (Figure 4), which was consistent with previous findings [34,71]. In humid regions, high vegetation coverage and species richness could enhance vegetation resilience. Vegetation showed high resistance to climate fluctuations [1]. Furthermore, high precipitation resulted in high water availability for vegetation growth in these regions, and vegetation could quickly recover from external disturbance. Previous studies also observed that vegetation resilience was related to regional precipitation. The surface soil has a long “moisture memory” for previous precipitation, which is conducive to the improvement in vegetation resilience [17,25]. Thus, high vegetation resilience was found in the southeast humid region (Figure 3).
In contrast, most dry regions underwent droughts, and vegetation growth was limited by water resources, especially in summer [72,73]. Thus, as the climatic zone became drier, lower vegetation resilience was observed in China (Figure 4). In addition, vegetation became more resilient in all seasons as vegetation coverage increased. Sparse vegetation is mainly distributed in drylands and is less resistant to drought, resulting in an increase in desertification risk [74,75]. Forests were more resilient than sparse vegetation. These results support the idea that high vegetation coverage can provide strong protection against external interference, leading to high resilience [29,76].
4.3. Response of Vegetation Changes to Vegetation Vulnerability
Vegetation could adapt to the influence of climate change with certain limits. If the influence exceeds these certain limits, vegetation can shift to another stable state [12,21]. We found that 7.29% of the total land area was categorized as experiencing vegetation decrease, with these areas scattered in Northeast and Southwest China throughout the growing season (Figure S4, Supplementary Material). Moreover, high vegetation vulnerability values were observed in the northeastern and southwestern regions. In other words, vegetation with high vulnerability is prone to change in these regions [34]. The spatial distribution of the change trend in precipitation is displayed in Figure S5. A significant decrease in precipitation is detected in Northeast China in the subhumid zone (Figure S5, Supplementary Material) and a significant decrease in vegetation was observed in these regions (Figure S4, Supplementary Material), particularly in the regions with low vulnerability. In contrast, a significant vegetation increase was detected in the central region of the north and oasis areas of Xinjiang Province (Figure S4, Supplementary Material). As presented in Figures S6 and S7, significant increasing trends in temperature and solar radiation were observed in these regions. Increased temperature and solar radiation were beneficial for vegetation growth in the subhumid and semiarid zones [69]. In addition, ecological restoration projects have been implemented by the Chinese government to reduce soil erosion and increase vegetation cover in northern China [37]. However, the resilience and vulnerability of artificially managed vegetation are lower than those of natural vegetation [77]. Therefore, vegetation had low resilience and vulnerability and was improved in northern China (Figure 3, Figure 5 and Figure S4, Supplementary Material).
Regarding the different vegetation types, croplands were mainly distributed in Southeast China (Figure 1b). Temperature and solar radiation were the dominant climatic factors affecting vegetation dynamics in this region [78,79]. Simultaneously, temperature and solar radiation presented significant upward trends in summer (Figures S6 and S7, Supplementary Material). Thus, vegetation areas with low resilience and high vulnerability were likely to improve. Moreover, croplands were susceptible to human activities. Artificially managed croplands had low vulnerability and vegetation greenness increased significantly. Thus, the highest proportions of slight vegetation vulnerability were observed for croplands in different seasons (Figure 6). Most of the grasslands, which were mainly concentrated on the Qinghai–Tibet Plateau, underwent a significant vegetation decrease. Vegetation areas with a low vulnerability were likely to be degraded in this region (Figure S4, Supplementary Material). The vegetation areas with a low resilience in this region could function as warning signals of vegetation degradation.
5. Conclusions
In summary, the spatiotemporal characteristics of vegetation sensitivity and vegetation resilience were investigated at seasonal scales. Afterwards, vegetation vulnerability was studied through a combination of vegetation resilience and sensitivity. The main results are summarized as follows:
- (1)
- The spatial distribution of vegetation sensitivity and resilience had obvious differences in China. In spring, high sensitivity and low resilience to climate variability were observed in Northeast China. In summer, most regions had low VSI values, while relatively low values of RI were mostly concentrated in the central area of the northern and oasis regions of Xinjiang Province. In autumn, high RI values of approximately 0.75 were mostly concentrated in the humid zone of Southwest China. Regarding the different vegetation types, sparse vegetation had lower values of RI (approximately 0.4) and the highest values (approximately 0.75) of RI were observed for forests, particularly in spring and summer.
- (2)
- The distribution pattern of vegetation vulnerability exhibited spatial heterogeneity in China. In spring, VI values of approximately 0.9 were mainly distributed in Northern Xinjiang and Northern Inner Mongolia, while low values were scattered in Yunnan province and the central region of East China. In summer, the area of higher vegetation vulnerability increased in Southwest China compared with that in spring. The distribution patterns of vegetation vulnerability in North China were remarkably similar to those in spring.
- (3)
- The percentages of vegetation vulnerability classes were compared for different areas. In spring, the highest proportion of severe vegetation vulnerability was observed in the subhumid zone (28.94%), followed by the arid zone (26.27%). In summer and autumn, the proportions of severe vegetation vulnerability in the arid and humid zones were higher than those in the other climate zones. Among the different vegetation types, the highest proportions of severe vegetation vulnerability were found in sparse vegetation in different seasons, while the highest proportions of slight vegetation vulnerability were found in croplands in different seasons.
- (4)
- Vegetation with high vulnerability is prone to change in Northeast and Southwest China. Although ecological restoration projects have been implemented to increase vegetation cover in northern China, low vegetation resilience and high vulnerability were identified in this region. Vegetation areas with high vulnerability on the Qinghai–Tibet Plateau could function as warning signals of vegetation degradation. Most grasslands, which were mainly concentrated on the Qinghai–Tibet Plateau, had high vulnerability. Vegetation areas with high vulnerability were likely to be degraded in this region.
Supplementary Materials
The following are available online at https://0-www-mdpi-com.brum.beds.ac.uk/article/10.3390/rs14143491/s1, Figure S1: Distribution map of climate zones in China. Figure S2: RGB composite of the climate weights for different seasons (red: temperature; green: solar radiation; blue: precipitation). (a) Spring. (b) Summer. (c) Autumn. (d) Growing season. Tem: temperature; Pre: precipitation; Solar: solar radiation. The climate weights were calculated based on an autoregressive model, which was introduced in Section 2.3.1. Figure S3: The percentages of dominant climatic factors affecting vegetation growth in different regions. The dominant climatic factors were extracted based on the weighted coefficients, which was introduced in Section 2.3.1. The relative importance of the three climatic factors was quantified by a principal components regression. The highest weighted coefficient for climatic factor in Equation 8 was considered as the dominant climatic factor. Figure S4: Spatial distribution of the change trend in NDVI and change classification in vegetation for different seasons. The change trend in NDVI can be reclassified into three classes (vegetation degradation, vegetation improvement and stable area) according to the Mann-Kendall test. Significant changes (|ZS| ≥ 1.96) were categorized as vegetation degradation or vegetation improvement, while insignificant changes (|ZS| ˂ 1.96) were reclassified as stable areas. VD: significant vegetation decrease; VI: significant vegetation increase; SA: stable area. Figure S5: Spatial distribution of the change trend in precipitation for different seasons. The black spots represent significant changes in precipitation. Figure S6: Spatial distribution of the change trend in temperature for different seasons. The black spots represent significant changes in temperature. Figure S7: Spatial distribution of the change trend in solar radiation for different seasons. The black spots represent significant changes in solar radiation. Table S1: Detailed information about datasets.
Author Contributions
Conceptualization, L.J. and Y.Y.; methodology, Y.Y.; validation, B.L.; investigation, L.J., Y.Y. and B.L.; resources, L.J. and Y.Y.; writing—original draft preparation, L.J. and Y.Y.; writing—review and editing, B.L.; funding acquisition, L.J. and B.L. All authors have read and agreed to the published version of the manuscript.
Funding
This research was funded by the General Projects of Chongqing Natural Science Foundation [Grant No. cstc2021jcyj-msxmX0523], the Science and Technology Research Program of Chongqing Municipal Education Commission [Grant No. KJQN202100504], the Talents Fund Project of Chongqing Normal University [Grant No. 20XLB019] and the Doctoral Startup Fund of Chongqing Normal University [Grant No. 20XLB024].
Conflicts of Interest
The authors declare no conflict of interest.
References
- Schwalm, C.R.; Anderegg, W.R.L.; Michalak, A.M.; Fisher, J.B.; Biondi, F.; Koch, G.; Litvak, M.; Ogle, K.; Shaw, J.D.; Wolf, A.; et al. Global patterns of drought recovery. Nature 2017, 548, 202–205. [Google Scholar] [PubMed]
- Trenberth, K.E.; Dai, A.; Van Der Schrier, G.; Jones, P.D.; Barichivich, J.; Briffa, K.R.; Sheffield, J. Global warming and changes in drought. Nat. Clim. Chang. 2014, 4, 17–22. [Google Scholar]
- Piao, S.; Tan, J.; Chen, A.; Fu, Y.H.; Ciais, P.; Liu, Q.; Janssens, I.A.; Vicca, S.; Zeng, Z.; Jeong, S.J. Leaf onset in the northern hemisphere triggered by daytime temperature. Nat. Commun. 2015, 6, 6911. [Google Scholar]
- Masson, V.; Zhai, P.; Pirani, A.; Connors, S.L.; Péan, C.; Berger, S.; Caud, N.; Chen, Y.; Goldfarb, L.; Gomis, M.I. Climate Change 2021: The Physical Science Basis. Contribution of Working Group I to the Sixth Assessment Report of the Intergovernmental Panel on Climate Change; IPCC: Berlin, Germany, 2021. [Google Scholar]
- Seneviratne, S.I.; Zhang, X.; Adnan, M.; Badi, W.; Dereczynski, C.; Luca, A.D.; Ghosh, S.; Iskandar, I.; Kossin, J.; Lewis, S. Weather and Climate Extreme Events in a Changing Climate; IPCC: Berlin, Germany, 2021. [Google Scholar]
- Xu, C.; McDowell, N.G.; Fisher, R.A.; Wei, L.; Sevanto, S.; Christoffersen, B.O.; Weng, E.; Middleton, R.S. Increasing impacts of extreme droughts on vegetation productivity under climate change. Nat. Clim. Chang. 2019, 9, 948–953. [Google Scholar]
- Dai, A. Increasing drought under global warming in observations and models. Nat. Clim. Chang. 2013, 3, 52–58. [Google Scholar]
- Guo, H.; Bao, A.; Chen, T.; Zheng, G.; Wang, Y.; Jiang, L.; De Maeyer, P. Assessment of CMIP6 in simulating precipitation over arid Central Asia. Atmos. Res. 2021, 252, 105451. [Google Scholar]
- Shukla, P.; Skeg, J.; Buendia, E.C.; Masson-Delmotte, V.; Pörtner, H.-O.; Roberts, D.; Zhai, P.; Slade, R.; Connors, S.; van Diemen, S. Climate Change and Land: An IPCC Special Report on Climate Change, Desertification, Land Degradation, Sustainable Land Management, Food Security, and Greenhouse Gas Fluxes in Terrestrial Ecosystems; IPCC: Berlin, Germany, 2019. [Google Scholar]
- Yuan, Y.; Bao, A.; Liu, T.; Zheng, G.; Jiang, L.; Guo, H.; Jiang, P.; Yu, T.; De Maeyer, P. Assessing vegetation stability to climate variability in Central Asia. J. Environ. Manag. 2021, 298, 113330. [Google Scholar]
- Deng, Y.; Wang, X.; Wang, K.; Ciais, P.; Tang, S.; Jin, L.; Li, L.; Piao, S. Responses of vegetation greenness and carbon cycle to extreme droughts in China. Agric. For. Meteorol. 2021, 298, 108307. [Google Scholar]
- Fang, O.; Zhang, Q. Tree resilience to drought increases in the Tibetan Plateau. Glob. Change Biol. 2019, 25, 245–253. [Google Scholar]
- Li, X.; Piao, S.; Wang, K.; Wang, X.; Wang, T.; Ciais, P.; Chen, A.; Lian, X.; Peng, S.; Penuelas, J. Temporal trade-off between gymnosperm resistance and resilience increases forest sensitivity to extreme drought. Nat. Ecol. Evol. 2020, 4, 1075–1083. [Google Scholar]
- von Keyserlingk, J.; de Hoop, M.; Mayor, A.; Dekker, S.; Rietkerk, M.; Förster, S. Resilience of vegetation to drought: Studying the effect of grazing in a Mediterranean rangeland using satellite time series. Remote Sens. Environ. 2021, 255, 112270. [Google Scholar]
- Jiang, L.; Liu, Y.; Wu, S.; Yang, C. Analyzing ecological environment change and associated driving factors in China based on NDVI time series data. Ecol. Indic. 2021, 129, 107933. [Google Scholar]
- Chen, Q.; Lu, S.; Xiong, K.; Zhao, R. Coupling analysis on ecological environment fragility and poverty in South China Karst. Environ. Res. 2021, 201, 111650. [Google Scholar] [PubMed]
- Papagiannopoulou, C.; Miralles, D.; Dorigo, W.A.; Verhoest, N.; Depoorter, M.; Waegeman, W. Vegetation anomalies caused by antecedent precipitation in most of the world. Environ. Res. Lett. 2017, 12, 074016. [Google Scholar]
- Xu, H.; Wang, X.; Zhang, X. Decreased vegetation growth in response to summer drought in Central Asia from 2000 to 2012. Int. J. Appl. Earth Obs. Geoinf. 2016, 52, 390–402. [Google Scholar]
- Ding, Y.; Li, Z.; Peng, S. Global analysis of time-lag and-accumulation effects of climate on vegetation growth. Int. J. Appl. Earth Obs. Geoinf. 2020, 92, 102179. [Google Scholar]
- De Keersmaecker, W.; Lhermitte, S.; Tits, L.; Honnay, O.; Somers, B.; Coppin, P. A model quantifying global vegetation resistance and resilience to short-term climate anomalies and their relationship with vegetation cover. Glob. Ecol. Biogeogr. 2015, 24, 539–548. [Google Scholar]
- Hodgson, D.; McDonald, J.L.; Hosken, D.J. What do you mean, ’resilient’? Trends Ecol. Evol. 2015, 30, 503–506. [Google Scholar]
- Buxton, J.E.; Abrams, J.F.; Boulton, C.A.; Barlow, N.; Rangel Smith, C.; Van Stroud, S.; Lees, K.J.; Lenton, T.M. Quantitatively monitoring the resilience of patterned vegetation in the Sahel. Glob. Change Biol. 2022, 28, 571–587. [Google Scholar]
- Kusch, E.; Davy, R.; Seddon, A.W. Vegetation-memory effects and their association with vegetation resilience in global drylands. J. Ecol. 2022, 110, 1561–1574. [Google Scholar]
- Verbesselt, J.; Umlauf, N.; Hirota, M.; Holmgren, M.; Van Nes, E.H.; Herold, M.; Zeileis, A.; Scheffer, M. Remotely sensed resilience of tropical forests. Nat. Clim. Chang. 2016, 6, 1028–1031. [Google Scholar]
- Liu, L.; Zhang, Y.; Wu, S.; Li, S.; Qin, D. Water memory effects and their impacts on global vegetation productivity and resilience. Sci. Rep. 2018, 8, 1–9. [Google Scholar]
- Guo, H.; Bao, A.; Liu, T.; Ndayisaba, F.; Jiang, L.; Zheng, G.; Chen, T.; De Maeyer, P. Determining variable weights for an Optimal Scaled Drought Condition Index (OSDCI): Evaluation in Central Asia. Remote Sens. Environ. 2019, 231, 111220. [Google Scholar]
- Mulder, C.P.; Iles, D.T.; Rockwell, R.F. Increased variance in temperature and lag effects alter phenological responses to rapid warming in a subarctic plant community. Glob. Change Biol. 2017, 23, 801–814. [Google Scholar]
- Wen, Y.; Liu, X.; Yang, J.; Lin, K.; Du, G. NDVI indicated inter-seasonal non-uniform time-lag responses of terrestrial vegetation growth to daily maximum and minimum temperature. Glob. Planet. Change 2019, 177, 27–38. [Google Scholar]
- Li, D.; Wu, S.; Liu, L.; Zhang, Y.; Li, S. Vulnerability of the global terrestrial ecosystems to climate change. Glob. Change Biol. 2018, 24, 4095–4106. [Google Scholar]
- Jiang, L.; Jiapaer, G.; Bao, A.; Guo, H.; Ndayisaba, F. Vegetation dynamics and responses to climate change and human activities in Central Asia. Sci. Total Environ. 2017, 599–600, 967–980. [Google Scholar]
- Chen, T.; Tang, G.; Yuan, Y.; Guo, H.; Xu, Z.; Jiang, G.; Chen, X. Unraveling the relative impacts of climate change and human activities on grassland productivity in Central Asia over last three decades. Sci. Total Environ. 2020, 743, 140649. [Google Scholar]
- Zhang, Y.; Gao, J.; Liu, L.; Wang, Z.; Ding, M.; Yang, X. NDVI-based vegetation changes and their responses to climate change from 1982 to 2011: A case study in the Koshi River Basin in the middle Himalayas. Glob. Planet. Change 2013, 108, 139–148. [Google Scholar]
- Chen, C.; He, B.; Guo, L.; Zhang, Y.; Xie, X.; Chen, Z. Identifying critical climate periods for vegetation growth in the Northern Hemisphere. J. Geophys. Res. Biogeosciences 2018, 123, 2541–2552. [Google Scholar]
- Yao, Y.; Liu, Y.; Wang, Y.; Fu, B. Greater increases in China’s dryland ecosystem vulnerability in drier conditions than in wetter conditions. J. Environ. Manag. 2021, 291, 112689. [Google Scholar] [CrossRef] [PubMed]
- Chen, C.; Park, T.; Wang, X.; Piao, S.; Xu, B.; Chaturvedi, R.K.; Fuchs, R.; Brovkin, V.; Ciais, P.; Fensholt, R. China and India lead in greening of the world through land-use management. Nat. Sustain. 2019, 2, 122–129. [Google Scholar] [CrossRef] [PubMed]
- Feng, X.; Fu, B.; Piao, S.; Wang, S.; Ciais, P.; Zeng, Z.; Lü, Y.; Zeng, Y.; Li, Y.; Jiang, X. Revegetation in China’s Loess Plateau is approaching sustainable water resource limits. Nat. Clim. Chang. 2016, 6, 1019–1022. [Google Scholar] [CrossRef]
- Liu, D.; Chen, J.; Ouyang, Z. Responses of landscape structure to the ecological restoration programs in the farming-pastoral ecotone of Northern China. Sci. Total Environ. 2020, 710, 136311. [Google Scholar] [CrossRef]
- Liu, H.; Jia, Y.; Niu, C.; Su, H.; Wang, J.; Du, J.; Khaki, M.; Hu, P.; Liu, J. Development and validation of a physically-based, national-scale hydrological model in China. J. Hydrol. 2020, 590, 125431. [Google Scholar] [CrossRef]
- Cherlet, M.; Hutchinson, C.; Reynolds, J.; Hill, J.; Sommer, S.; von Maltitz, G. World Atlas of Desertification; Publication Office of the European Union: Luxembourg, 2018. [Google Scholar]
- Ge, Q.; Wang, H.; Rutishauser, T.; Dai, J. Phenological response to climate change in China: A meta-analysis. Glob. Change Biol. 2015, 21, 265–274. [Google Scholar] [CrossRef]
- Wang, X.; Li, Y.; Gong, X.; Niu, Y.; Chen, Y.; Shi, X.; Li, W. Storage, pattern and driving factors of soil organic carbon in an ecologically fragile zone of northern China. Geoderma 2019, 343, 155–165. [Google Scholar] [CrossRef]
- Trabucco, A.; Zomer, R.J. Global aridity index and potential evapotranspiration (ET0) climate database v2. CGIAR Consort. Spat. Inf. 2018, 10, m9. [Google Scholar]
- Arino, O.; Ramoino, F. Land Cover CCI, Product User Guide Version 2.0; Climate Change Initiative Belgium: Louvain, Belgium, 2017. [Google Scholar]
- Huete, A. Vegetation’s responses to climate variability. Nature 2016, 531, 181–182. [Google Scholar] [CrossRef]
- Xu, L.; Myneni, R.; Chapin Iii, F.; Callaghan, T.V.; Pinzon, J.; Tucker, C.J.; Zhu, Z.; Bi, J.; Ciais, P.; Tømmervik, H. Temperature and vegetation seasonality diminishment over northern lands. Nat. Clim. Chang. 2013, 3, 581–586. [Google Scholar] [CrossRef] [Green Version]
- Zeng, F.-W.; Collatz, G.J.; Pinzon, J.E.; Ivanoff, A. Evaluating and quantifying the climate-driven interannual variability in Global Inventory Modeling and Mapping Studies (GIMMS) Normalized Difference Vegetation Index (NDVI3g) at global scales. Remote Sens. 2013, 5, 3918–3950. [Google Scholar] [CrossRef] [Green Version]
- Peñuelas, J.; Filella, I. Responses to a warming world. Science 2001, 294, 793–795. [Google Scholar] [CrossRef] [PubMed]
- Wen, Y.; Liu, X.; Xin, Q.; Wu, J.; Xu, X.; Pei, F.; Li, X.; Du, G.; Cai, Y.; Lin, K. Cumulative effects of climatic factors on terrestrial vegetation growth. J. Geophys. Res. Biogeosci. 2019, 124, 789–806. [Google Scholar] [CrossRef]
- Wu, D.; Zhao, X.; Liang, S.; Zhou, T.; Huang, K.; Tang, B.; Zhao, W. Time-lag effects of global vegetation responses to climate change. Glob. Change Biol. 2015, 21, 3520–3531. [Google Scholar] [CrossRef] [PubMed]
- Anderson, L.O.; Malhi, Y.; Aragão, L.E.; Ladle, R.; Arai, E.; Barbier, N.; Phillips, O. Remote sensing detection of droughts in Amazonian forest canopies. New Phytol. 2010, 187, 733–750. [Google Scholar] [CrossRef] [PubMed]
- Chen, T.; De Jeu, R.; Liu, Y.; Van der Werf, G.; Dolman, A. Using satellite based soil moisture to quantify the water driven variability in NDVI: A case study over mainland Australia. Remote Sens. Environ. 2014, 140, 330–338. [Google Scholar] [CrossRef]
- Ivits, E.; Horion, S.; Erhard, M.; Fensholt, R. Assessing European ecosystem stability to drought in the vegetation growing season. Glob. Ecol. Biogeogr. 2016, 25, 1131–1143. [Google Scholar] [CrossRef]
- Piao, S.; Wang, X.; Ciais, P.; Zhu, B.; Wang, T.; Liu, J. Changes in satellite-derived vegetation growth trend in temperate and boreal Eurasia from 1982 to 2006. Glob. Change Biol. 2011, 17, 3228–3239. [Google Scholar] [CrossRef]
- Peng, S.; Chen, A.; Xu, L.; Cao, C.; Fang, J.; Myneni, R.B.; Pinzon, J.E.; Tucker, C.J.; Piao, S. Recent change of vegetation growth trend in China. Environ. Res. Lett. 2011, 6, 044027. [Google Scholar] [CrossRef]
- Seddon, A.W.R.; Macias-Fauria, M.; Long, P.R.; Benz, D.; Willis, K.J. Sensitivity of global terrestrial ecosystems to climate variability. Nature 2016, 531, 229–232. [Google Scholar] [CrossRef] [Green Version]
- Smith, T.; Traxl, D.; Boers, N. Empirical evidence for recent global shifts in vegetation resilience. Nat. Clim. Chang. 2022, 12, 477–484. [Google Scholar] [CrossRef]
- Ben Abbes, A.; Bounouh, O.; Farah, I.R.; de Jong, R.; Martínez, B. Comparative study of three satellite image time-series decomposition methods for vegetation change detection. Eur. J. Remote Sens. 2018, 51, 607–615. [Google Scholar] [CrossRef] [Green Version]
- Dakos, V.; Carpenter, S.R.; Brock, W.A.; Ellison, A.M.; Guttal, V.; Ives, A.R.; Kefi, S.; Livina, V.; Seekell, D.A.; van Nes, E.H. Methods for detecting early warnings of critical transitions in time series illustrated using simulated ecological data. PLoS ONE 2012, 7, e41010. [Google Scholar]
- Gocic, M.; Trajkovic, S. Analysis of changes in meteorological variables using Mann-Kendall and Sen’s slope estimator statistical tests in Serbia. Global and Pl Glob. Planet. Change 2013, 100, 172–182. [Google Scholar] [CrossRef]
- Mann, H.B. Nonparametric Tests Against Trend. Econometrica 1945, 13, 245–259. [Google Scholar] [CrossRef]
- Piao, S.; Cui, M.; Chen, A.; Wang, X.; Ciais, P.; Liu, J.; Tang, Y. Altitude and temperature dependence of change in the spring vegetation green-up date from 1982 to 2006 in the Qinghai-Xizang Plateau. Agric. For. Meteorol. 2011, 151, 1599–1608. [Google Scholar] [CrossRef]
- Mao, J.; Shi, X.; Thornton, P.E.; Piao, S.; Wang, X. Causes of spring vegetation growth trends in the northern mid–high latitudes from 1982 to 2004. Environ. Res. Lett. 2012, 7, 014010. [Google Scholar] [CrossRef] [Green Version]
- Mohammat, A.; Wang, X.; Xu, X.; Peng, L.; Yang, Y.; Zhang, X.; Myneni, R.B.; Piao, S. Drought and spring cooling induced recent decrease in vegetation growth in Inner Asia. Agric. For. Meteorol. 2013, 178, 21–30. [Google Scholar] [CrossRef]
- Bohovic, R. The Spatial and Temporal Dynamics of Remotely-sensed Vegetation Phenology in Central Asia in the 1982–2011 Period. Eur. J. Remote Sens. 2016, 49, 279–299. [Google Scholar] [CrossRef] [Green Version]
- D’Odorico, P.; Bhattachan, A.; Davis, K.F.; Ravi, S.; Runyan, C.W. Global desertification: Drivers and feedbacks. Adv. Water Resour. 2013, 51, 326–344. [Google Scholar] [CrossRef]
- Zhang, J.; Zhang, Y.; Qin, S.; Wu, B.; Wu, X.; Zhu, Y.; Shao, Y.; Gao, Y.; Jin, Q.; Lai, Z. Effects of seasonal variability of climatic factors on vegetation coverage across drylands in northern China. Land Degrad. Dev. 2018, 29, 1782–1791. [Google Scholar] [CrossRef]
- Zhang, W.; Zhou, T. Increasing impacts from extreme precipitation on population over China with global warming. Sci. Bull. 2020, 65, 243–252. [Google Scholar] [CrossRef] [Green Version]
- Zhu, G.; Yong, L.; Xi, Z.; Liu, Y.; Zhang, Z.; Xu, Y.; Sun, Z.; Sang, L.; Wang, L. Evaporation, infiltration and storage of soil water in different vegetation zones in Qilian mountains: From an perspective of stable isotopes. Hydrol. Earth Syst. Sci. Discuss. 2021, 26, 3771–3784. [Google Scholar] [CrossRef]
- Chen, S.; Zhang, Y.; Wu, Q.; Liu, S.; Song, C.; Xiao, J.; Band, L.E.; Vose, J.M. Vegetation structural change and CO2 fertilization more than offset gross primary production decline caused by reduced solar radiation in China. Agric. For. Meteorol. 2021, 296, 108207. [Google Scholar] [CrossRef]
- Kong, D.; Zhang, Q.; Singh, V.P.; Shi, P. Seasonal vegetation response to climate change in the Northern Hemisphere (1982–2013). Glob. Planet. Change 2017, 148, 1–8. [Google Scholar] [CrossRef] [Green Version]
- Bai, J.; Shi, H.; Yu, Q.; Xie, Z.; Li, L.; Luo, G.; Jin, N.; Li, J. Satellite-observed vegetation stability in response to changes in climate and total water storage in Central Asia. Sci. Total Environ. 2019, 659, 862–871. [Google Scholar] [CrossRef]
- Guo, H.; Bao, A.; Liu, T.; Ndayisaba, F.; Jiang, L.; Kurban, A.; De Maeyer, P. Spatial and temporal characteristics of droughts in Central Asia during 1966–2015. Sci. Total Environ. 2018, 624, 1523–1538. [Google Scholar]
- Guo, H.; Bao, A.; Ndayisaba, F.; Liu, T.; Jiapaer, G.; El-Tantawi, A.M.; De Maeyer, P. Space-time characterization of drought events and their impacts on vegetation in Central Asia. J. Hydrol. 2018, 564, 1165–1178. [Google Scholar] [CrossRef]
- Jiang, L.; Bao, A.; Jiapaer, G.; Guo, H.; Zheng, G.; Gafforov, K.; Kurban, A.; De Maeyer, P. Monitoring land sensitivity to desertification in Central Asia: Convergence or divergence? Sci. Total Environ. 2019, 658, 669–683. [Google Scholar] [CrossRef]
- Xu, H.; Wang, X.; Zhao, C.; Yang, X. Diverse responses of vegetation growth to meteorological drought across climate zones and land biomes in northern China from 1981 to 2014. Agric. For. Meteorol. 2018, 262, 1–13. [Google Scholar]
- Martin, T.G.; Watson, J.E. Intact ecosystems provide best defence against climate change. Nat. Clim. Chang. 2016, 6, 122–124. [Google Scholar]
- Ingrisch, J.; Karlowsky, S.; Anadon-Rosell, A.; Hasibeder, R.; Koenig, A.; Augusti, A.; Gleixner, G.; Bahn, M. Land Use Alters the Drought Responses of Productivity and CO2 Fluxes in Mountain Grassland. Ecosystems 2018, 21, 689–703. [Google Scholar] [PubMed]
- Ge, W.; Deng, L.; Wang, F.; Han, J. Quantifying the contributions of human activities and climate change to vegetation net primary productivity dynamics in China from 2001 to 2016. Sci. Total Environ. 2021, 773, 145648. [Google Scholar]
- Qu, S.; Wang, L.; Lin, A.; Yu, D.; Yuan, M. Distinguishing the impacts of climate change and anthropogenic factors on vegetation dynamics in the Yangtze River Basin, China. Ecol. Indic. 2020, 108, 105724. [Google Scholar]
Figure 1.
Topographic map with elevation (a) and distribution map of land cover types (b) in the study area.
Figure 1.
Topographic map with elevation (a) and distribution map of land cover types (b) in the study area.

Figure 2.
Spatial distributions of vegetation sensitivity in different seasons. (a) Spring. (b) Summer. (c) Autumn. (d) Growing season.
Figure 2.
Spatial distributions of vegetation sensitivity in different seasons. (a) Spring. (b) Summer. (c) Autumn. (d) Growing season.

Figure 3.
Spatial distributions of vegetation resilience for different seasons. (a) Spring. (b) Summer. (c) Autumn. (d) Growing season.
Figure 3.
Spatial distributions of vegetation resilience for different seasons. (a) Spring. (b) Summer. (c) Autumn. (d) Growing season.

Figure 4.
Box plot of vegetation sensitivity and resilience to climate variability for different regions.
Figure 4.
Box plot of vegetation sensitivity and resilience to climate variability for different regions.

Figure 5.
Spatial distributions of vegetation vulnerability in different seasons. (a) Spring. (b) Summer. (c) Autumn. (d) Growing season.
Figure 5.
Spatial distributions of vegetation vulnerability in different seasons. (a) Spring. (b) Summer. (c) Autumn. (d) Growing season.

Figure 6.
The percentages of vegetation vulnerability classes in different regions.

Publisher’s Note: MDPI stays neutral with regard to jurisdictional claims in published maps and institutional affiliations. |
© 2022 by the authors. Licensee MDPI, Basel, Switzerland. This article is an open access article distributed under the terms and conditions of the Creative Commons Attribution (CC BY) license (https://creativecommons.org/licenses/by/4.0/).
Share and Cite
MDPI and ACS Style
Jiang, L.; Liu, B.; Yuan, Y. Quantifying Vegetation Vulnerability to Climate Variability in China. Remote Sens. 2022, 14, 3491. https://0-doi-org.brum.beds.ac.uk/10.3390/rs14143491
AMA Style
Jiang L, Liu B, Yuan Y. Quantifying Vegetation Vulnerability to Climate Variability in China. Remote Sensing. 2022; 14(14):3491. https://0-doi-org.brum.beds.ac.uk/10.3390/rs14143491
Chicago/Turabian StyleJiang, Liangliang, Bing Liu, and Ye Yuan. 2022. "Quantifying Vegetation Vulnerability to Climate Variability in China" Remote Sensing 14, no. 14: 3491. https://0-doi-org.brum.beds.ac.uk/10.3390/rs14143491
Note that from the first issue of 2016, this journal uses article numbers instead of page numbers. See further details here.