Article

A Joint LINET and ISS-LIS View of Lightning Distribution over the Mt. Cimone Area within the GAMMA-FLASH Program

1
Institute of Atmospheric Science and Climate (ISAC)-National Research Council (CNR), Institute of Atmospheric Science and Climate, I-00133 Rome, Italy
2
Institute for Space Astrophysics and Planetology (IAPS)-National Institute for Astrophysics (INAF), National Institute for Astrophysics, I-00133 Rome, Italy
3
Astrophysics and Space Science Observatory (OAS)-National Institute for Astrophysics (INAF), National Institute for Astrophysics, I-4012 Bologna, Italy
4
Physics Department and NAST Centre, University of Rome “Tor Vergata”, I-00133 Roma, Italy
5
Dipartimento di Fisica, Università di roma “Tor Vergata”, I-00133 Rome, Italy
*
Author to whom correspondence should be addressed.
Remote Sens. 2022, 14(14), 3501; https://0-doi-org.brum.beds.ac.uk/10.3390/rs14143501
Submission received: 23 June 2022 / Revised: 12 July 2022 / Accepted: 18 July 2022 / Published: 21 July 2022

Abstract

:
Typical features of lightning distribution in the mountain area of Mt. Cimone (2165 m a.s.l., Northern-Central Italy) have been studied through detections provided by the ground-based LIghtning NETwork data (LINET) and the Lightning Imaging Sensor (LIS) onboard the International Space Station (ISS-LIS). This study was performed within the context of the Gamma-Flash program, which includes the in situ observation of high-energy radiation (e.g., Terrestrial Gamma-ray Flashes (TGFs), gamma-ray glows) and neutron emissions from thunderstorms at the mountain-top “O. Vittori” climate observatory. LINET VLF/LF radio measurements allowed the characterization of both cloud-to-ground (CG) and intra-cloud (IC) strokes’ geographical distribution and an altitude of occurrence from 2012 through 2020. The lightning distribution showed a remarkable clustering of CGs at the mountain top in contrast to a homogeneous distribution of ICs, highlighting the likely impact of orography. IC strokes peaked around 4 to 6 km altitude, in agreement with the observed typical cloud range. The joint exploitation of ISS-LIS optical observations of LINET detections extended the study to further features of flashes not seen in radio wavelengths and stands as the cross-validation of the two detection methods over such a complex orography. These results gave the quantitative indication of the expected occurrence of lightning and ionizing radiation emissions in the Mt. Cimone area and an example of mountain-driven changes in lightning occurrence.

1. Introduction

The detection and study of lightning has attracted a widening interest because of its implications as a natural hazard, its role in a changing climate (e.g., as an essential climate variable), and the discovery of emissions ranging up to tens of MeV energy. As a result, several space and ground-based operational and research detection systems are becoming available, as they never have been before [1], including those dedicated to lightning and more exotic emissions [2]. Of particular interest is mountain regions, because of their orographic impact, which determines most lightning hotspots around the globe [3], and elevation, which greatly reduces the atmospheric extinction of radiation coming from cloud heights.
The correlation between lightning and high-energy radiation and particles was demonstrated by observations from satellites [2,4,5,6,7], aircrafts in areas adjacent to thunderstorms [8,9], and, in recent years, ground-based experiments [10,11,12,13,14]. In this context, the Gamma-Flash (GF) project was conceived as a natural offshoot of the observations carried out by the AGILE Team [7,15,16,17] with the objective of on-ground and inflight observations of particles and radiation from lightning. The project foresees the realization and deployment of two innovative gamma-ray and neutron detection systems that are to be placed on ground and on aircraft, were designed to detect both short-duration transients, such as terrestrial gamma-ray flashes (TGFs), as well as extended gamma-ray emissions, such as gamma-ray glows, and are associated with high-energy particle emissions (neutrons) in conjuction with lightning detection facilities. As a first phase of the project, detectors are being allocated at the Italian Climate Observatory “O. Vittori” on the top of Mt. Cimone (44, 17N, 10, 68E, 2165 m a.s.l.), the highest peak of the northern Italian Apennines (see Figure 1). This infrastructure is the reference high-mountain station for atmospheric research in the region. Due to its completely free horizon, high altitude, and great distance from major pollution sources, it represents a strategic platform for the continuous monitoring of the atmospheric scenario associated with any lightning-related detection, including the chemical and physical atmospheric characteristics of the surrounding boundary layer.
In this perspective, typical features of the lightning distribution in the mountain site have been studied through detections provided by the joint ground and space-based observations, which complement each other and allow for the characterization of both intra-cloud (IC) and cloud-to-ground (CG) lightning. Climatologically, the global lightning flash rate is on average 45 flashes/s, with IC flashes occurring 3–10 times more frequently than CGs and leading to a 3:1 global IC/CG ration [18]. Ground-based systems, due to their instrument sensitivity, have generally higher detection efficiencies for CG strokes and relatively lower detection efficiencies for IC flashes (further details in Section 2).On the other hand, optical space-based systems observe optical pulses produced by both CGs and ICs, but with no distiction of the flash type. Since any system reports only a fraction of the total lightning activity producted during any thunderstorm event, the complementary combination of satellite and ground-based technologies can help to maximize the amount of lightning detected and the associated physical information [19,20,21].
In this paper, we compared lightning detections from the ground-based VLF LIghtning NETwork data (LINET) system to the space-based optical Lightning Imaging Sensor (LIS) onboard the International Space Station (ISS). In the first part of the third section, lightning statistics over the Mt. Cimone region are considered. In addition, a comparison of the two lightning detection systems is described using a specific matching algorithm. The results allow for a complementary analysis of GF numerical simulations on the propagation of radiation and particles in the atmosphere [22]; their combination can give a quantitative indication of the expected occurrence of lightning and ionizing radiation emissions in the region of interest.

2. Instrumentations and Methodology

2.1. LINET

The LIghtning detection NETwork (LINET) is a ground-based lightning detection system managed by nowcast GmbH [23], consisting in radio stations sensitive in the VLF/LF (3–300 kHz) band, dislocated all over Europe. All stations are made up of four modules: an antenna aimed at measuring the magnetic field flux emitted during a flash, a GPS clock to time-tag each event with an accuracy of better than 100 ns, and two modules for signal amplification, filtering, AD conversion, and data processing. As a rule, lightning detection networks recognize CG discharges from IC discharges by means of specific features in the associated waveforms (e.g., pulse rise time, zero peak time, bipolarity, or multi-peak structure). However, based on these criteria, a significant number of impulses remain to be identified correctly. Refs. [24,25] suggested that all positive flashes with peak currents below 10 kA can be considered IC events. Nevertheless, very large peak currents often pose problems, as well. Ref. [26] identified a class of high-intensity IC discharges as CG shots. LINET analyzes each signal independently of its waveform; this means that discrimination between CG and IC signals is performed not by means of differences in their pulse shapes, but by adopting a specific pseudo-3D algorithm capable of providing not only information on the horizontal (latitude-longitude) position of the event but also on its vertical displacement. In particular, the algorithm is based on three main steps. At first, the 2D stroke location is obtained by a time of arrival (TOA) method. In the second step, the delay between the source of the signal and the nearest station is considered (the bigger the delay, the more probable that the flash is an IC). Then, the time delay is related to the travel path to estimate the height of the flash [27]. CG strokes emit VLF/LF radiation at low heights (near the ground), whereas IC discharges emit at a certain altitude inside the clouds, analyzing the differences in the time travel from the center may help in discriminating the flash type (see Figure 2).
To give an example of the effect size, reference [27] calculated that emissions from a source height of ~10 km, recorded at a sensor distance of 50 km (100 km), produced a TOA delay of 3.3 µs (1.7 µs) compared to ground level propagation, and they are therefore identified as IC discharges.
In addition, it is important to underline that several parameters could affect the uncertainty in the evaluation of the TOA time delay. Electromagnetic fields generated by lightning change their characteristics as they propagate over ground surface, and the estimated location accuracy of the ToA technique used in lightning location systems results in a combination of the effect of the terrain profile and of the ground conductivity [28,29].

2.2. Lightning Imaging Sensor (LIS)

The Lightning Imaging Sensor (LIS) [30] on the International Space Station (ISS) was designed to operate as an imager observing from space the total lightning occurring on the Earth’s surface. Two LIS instruments were originally built: the first one was installed on the Tropical Rainfall Measuring Mission (TRMM) satellite, operational from 1999 to 2015, whereas the second one (a spare LIS) was installed on the ISS in February 2017, and it is currently operational. The ISS orbital inclination of 51.6° makes the ISS-LIS an ideal detector to investigate the region of interest where the GF experiment is installed. The imager is optimized to locate lightning with a scale resolution of 4 km at the nadir, increasing to 8 km at the limb, with a swath width of 580 km at the cloud top using a 128 × 128 pixel charge coupled device (CCD) array [31]. It observes each point on the Earth with a nearly uniform 90% flash detection efficiency within the Field-of-View (FoV) for about 90 s, recording location, time of occurrence (with 2 ms resolution), and radiant energy of each lightning event (i.e., IC and CG discharges during both day and night conditions, although with different efficiency) [31]. In this work, we made use of the quality-controlled ISS-LIS dataset (Version 1, processing level 2) made available by the NASA Global Hydrology Resource Center DAAC [31].

2.3. Match Criteria

In this study, the comparison of LINET ground data and LIS data was based on the group category identified by the LIS algorithm [21], considering an area of a 100-km radius around the Mt. Cimone station. The choice to consider this product level arose from the consideration that, physically, a LINET pulse (CG or IC) essentially corresponds to the same process that the ISS-LIS algorithm clusters into a group [32].
The individual LINET discharges were correlated with a LIS group both in time and space, considering matching criteria used in [33]. Following this line, a LINET discharge and an LIS group were considered matched if the two locations were within 20 km and within 10 ms. In particular, for each LIS group, a time window from ±10 ms before and after the occurrence was adopted, and it was determined if there was an LINET discharge during this time interval. If any, the discharge was used to examine if its spatial location was related to the LIS group centroid location. If the two locations were within a 20 km radius, the observations were considered matched.

2.4. Bayesian Approach

Previous work has compared ground-based systems to space-based optical systems (e.g., [18,19]). In general, these works assume that the dataset of one of the lightning location system (LLS) is the truth, i.e., considering an absolute detection efficiency for one of the two systems. However, when comparing the performance of two systems, neither should be treated as the truth since neither can detect the true total lightning distribution but only a fraction of it. In this perspective, the problem of estimating the relative stroke detection efficiencies (RDE) using two LLSs can be treated in a Bayesian manner based on conditional probabilities [34,35,36]. The basic approach is described below. Let L be the set of all the lightning discharges in the considered area, let S be the set of discharges detected from space by the LIS, and let G be the set of discharges detected on the ground by LINET. L is unknown by definition, since no system can capture all the lightning discharges. As a consequence, neither the union of S nor G would result in the total L set. In addition, both systems may contain false alarm signals, therefore falling outside of L (the false event rate requirement for the LIS is set to be less than 5%; less than 1% of the total number of discharges for LINET). Let nS and nG be the number of lightning discharges of the two sets considered, with the conditional probabilities given by:
P ( S | G ) = n ( S G ) n G  
and
P ( G | S ) = n ( S G ) n S
representing the RDE of system S with respect to G and vice versa.

3. Results and Discussion

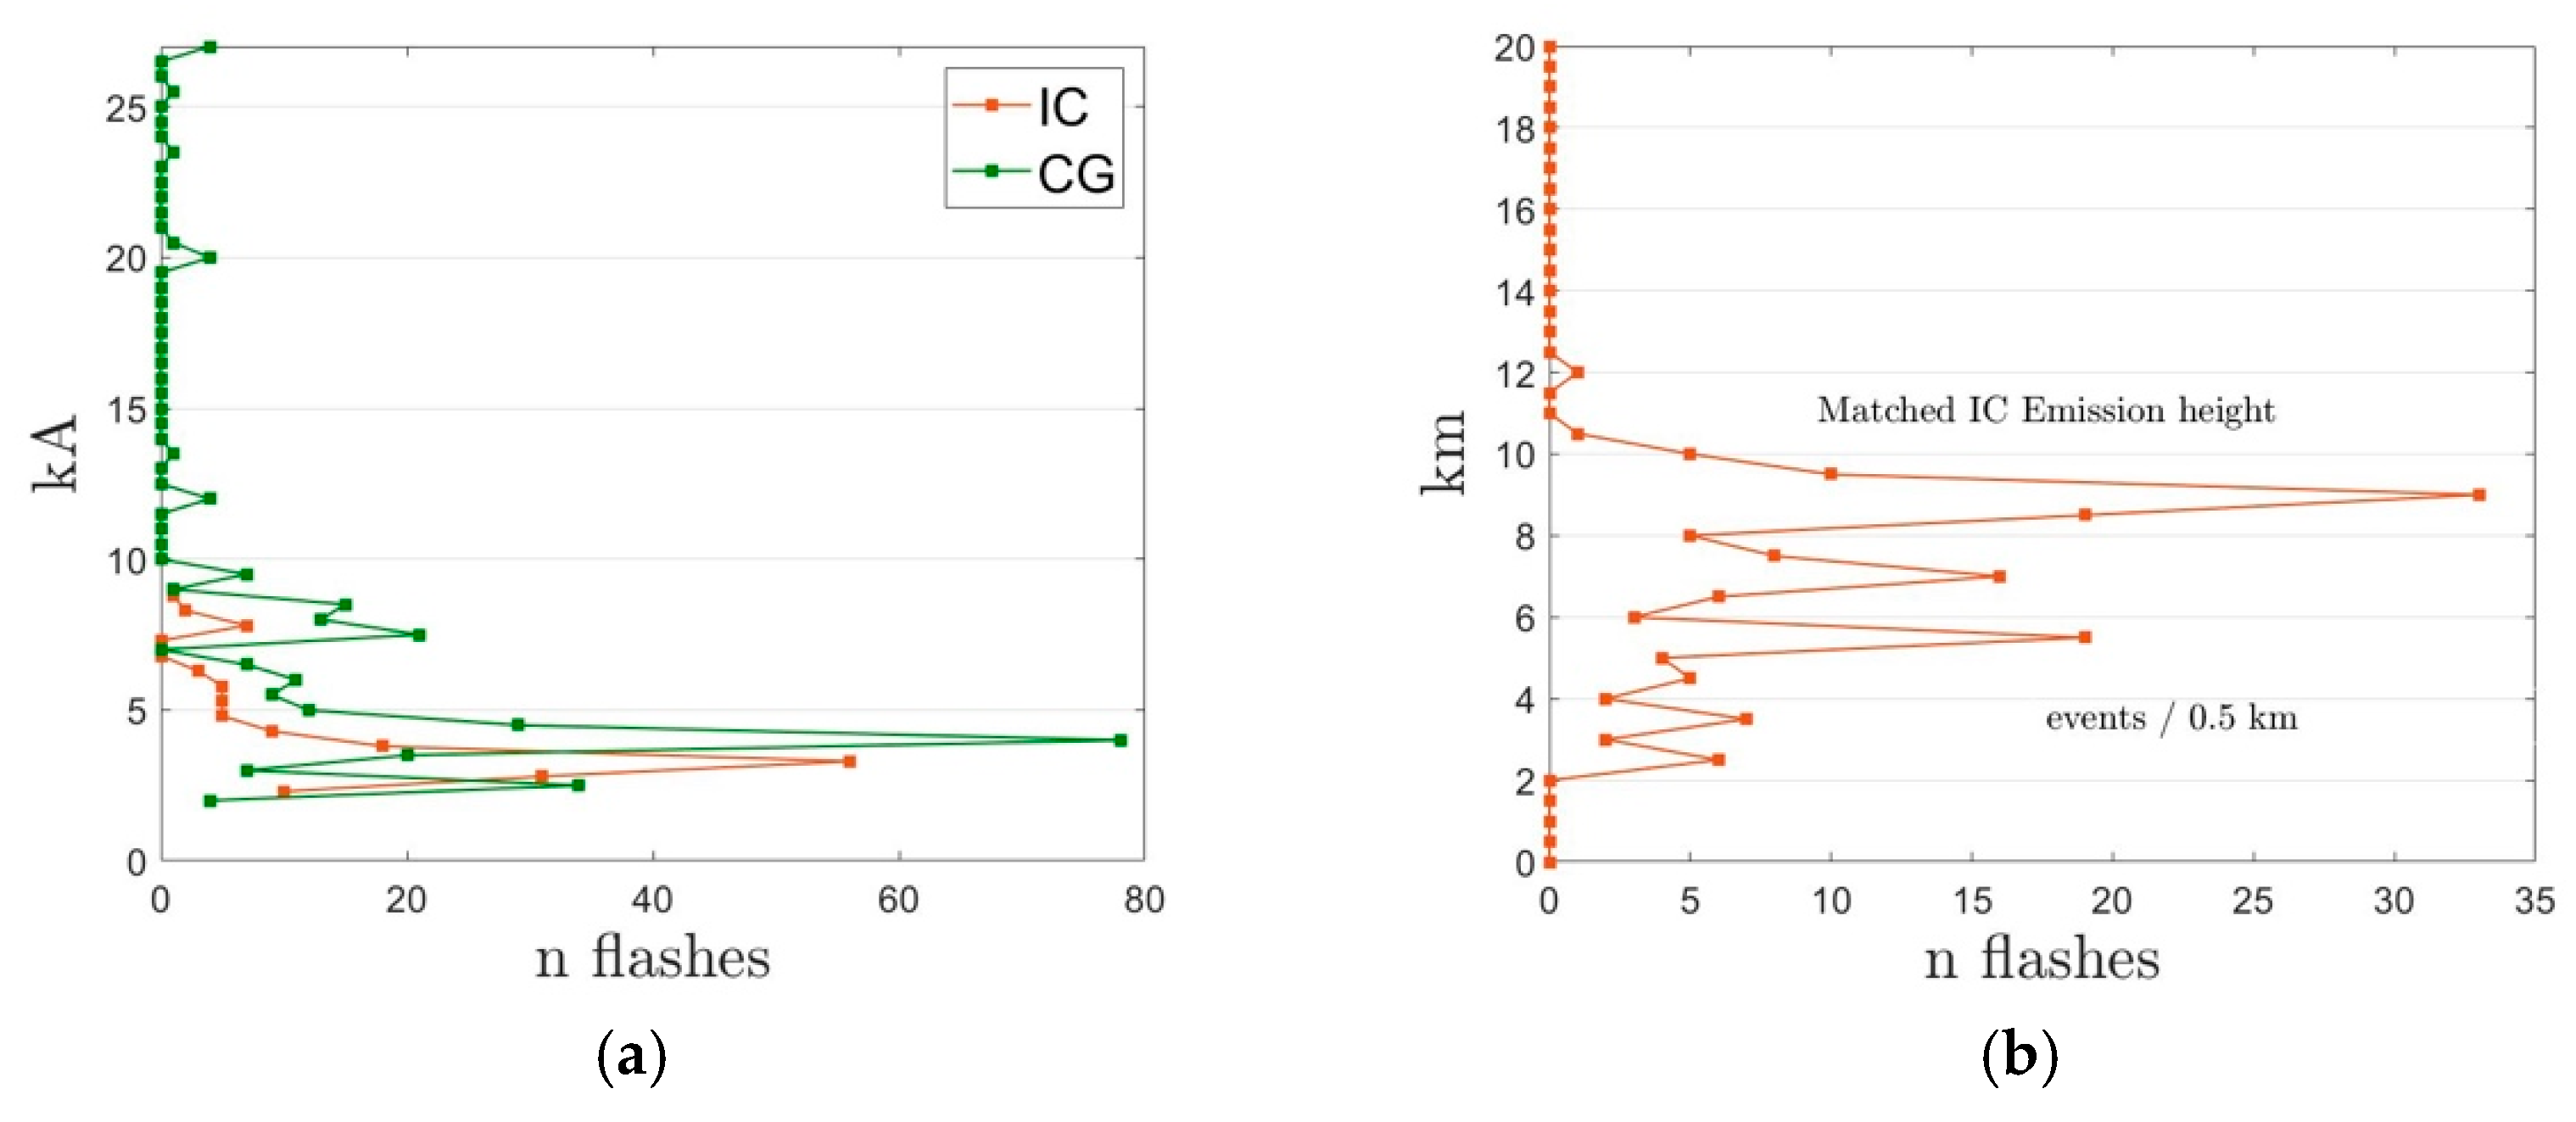
3.1. LINET Lightning Occurrence over Mt. Cimone

The “O. Vittori” observatory is a research infrastructure managed by the Institute of Atmospheric Sciences and Climate (ISAC) of the National Research Council (CNR). It is the only high mountain station for atmospheric research both South of the Alps and the Po basin, and it represents a strategic platform to study the chemical–physical characteristics and climatology of the South Europe and North Mediterranean basin [37].
In order to quantitatively assess the expected lightning occurrence, the typical features of their distribution over the site were studied through the detections provided by LINET data. In particular, a statistical analysis was carried out exploring the data from 2012 to 2020 in a 5 km radius area around the site. Information on space distribution can be visualized from plots in Figure 3a–d of LINET strokes along the orography.
Figure 3a,b was generated by operating two cuts, respectively, in longitude and latitude centered on the area of the GF site. Clearly, the trend of total lightning activity (IC + CG) followed the altimetry of the surface, highlighting a minor clustering observed along the longitude that could be related to variability in the atmosphere over this specific region [37,38]. As reported by previous investigations, the atmospheric observations carried out over the Mt. Cimone area during the warm season showed how the vertical transport of air masses from the regional planetary boundary layer is due to the activation of thermal wind circulation along the mountain slopes and the valleys [39].
Figure 3c,d shows the location map of the two different flash categories (CG and IC). The tendency of CGs to cluster in the immediate vicinity of the summit emerges, while that of ICs is more uniform. Specifically, the centroid of the CG cluster is 250 m away from the site. On the contrary, the ICs, developing within the clouds, are mainly influenced by the cloud top level that, in the surrounding area, seems not to show a dependence on the orography of the surrounding territory.
Figure 4 shows the lightning amplitude as a function of lightning occurrence for an area of 300 m around the site (corresponding to the cluster observed in Figure 3c) compared with a larger area of 10 km, comprising the flatter areas around the mountain. It is interesting to note that the same discharge intensity is maintained in the upper area (the top of the mountain), indicative of the fact that the orographic effect not only tends to increase the flash rate but also tends to capture a larger portion of the cloud charge. Annual and daily lightning distributions are shown in Figure 5.
Cumulative distributions (CG and IC) showed that the greatest number of lightning discharges occurred in the early afternoon, and a seasonal variation with rising (decaying) activity in May (September) and a maximum development during July can be noted. In general, this is a typical feature for mid-latitude continental areas due to the synoptic scale variability characterized by a change of stable/unstable air masses that cause the development of cumulonimbus clouds during the summertime and typically in the hottest hours, when the atmosphere is warmer and clouds might grow thicker. Despite the relative closeness to the sea, this behaviour highlights the consistency of lightning at Mt. Cimone with the continental seasonal cycle and low influence of the autumn/winter main lightning season over the sea [40]. In addition, at a local level, this behaviour is influenced by the presence of the Alpine Mountain range, which develops in latitude (from west to east) just above the Cimone area, preventing the direct exchange of subtropical and polar air masses in Europe.
As mentioned above, the LINET discrimination method used to identify IC discharges relies on delayed arrival times and works well as long as at least one sensor is within ~100 km from the lightning. Since this condition is fulfilled for the network area considered, Figure 6 shows the distribution of event amplitudes (both for CG and IC strokes) and the IC emission height. Figure 6a reveals that the majority of lightning strokes exhibit currents below ~10 kA and that, in this range, the CG fraction exceeds that of the ICs by 50%.
As expected, due to ground based lightning system sensitivity, the IC fraction increases towards small amplitudes. In fact, LINET sensors imply a minimum detectable signal in the range of 1–2 kA (threshold values shown in the plot). This means that most CG flashes are detected, while some IC flashes may also have lower amplitudes and therefore will not be recorded. However, it is interesting to note that the maximum current value recorded for the ICs exceeds 90 kA (see Figure 7), demonstrating that there are storm cells that produce IC flashes with even greater amplitudes. Figure 6b shows the identified ICs with respect to their emission height. The dominant heights are at a 5–6 km altitude (a.s.l.) (3–4 km above the observatory 2165 m a.s.l.), compatible with the typical cloud extensions in the area. The distribution of the current amplitude as a function of the IC height values is shown in Figure 7.
In general, the current trend confirms the typical tendency of ground-based sensors to detect ICs as low intensity events.

3.2. ISS-LIS

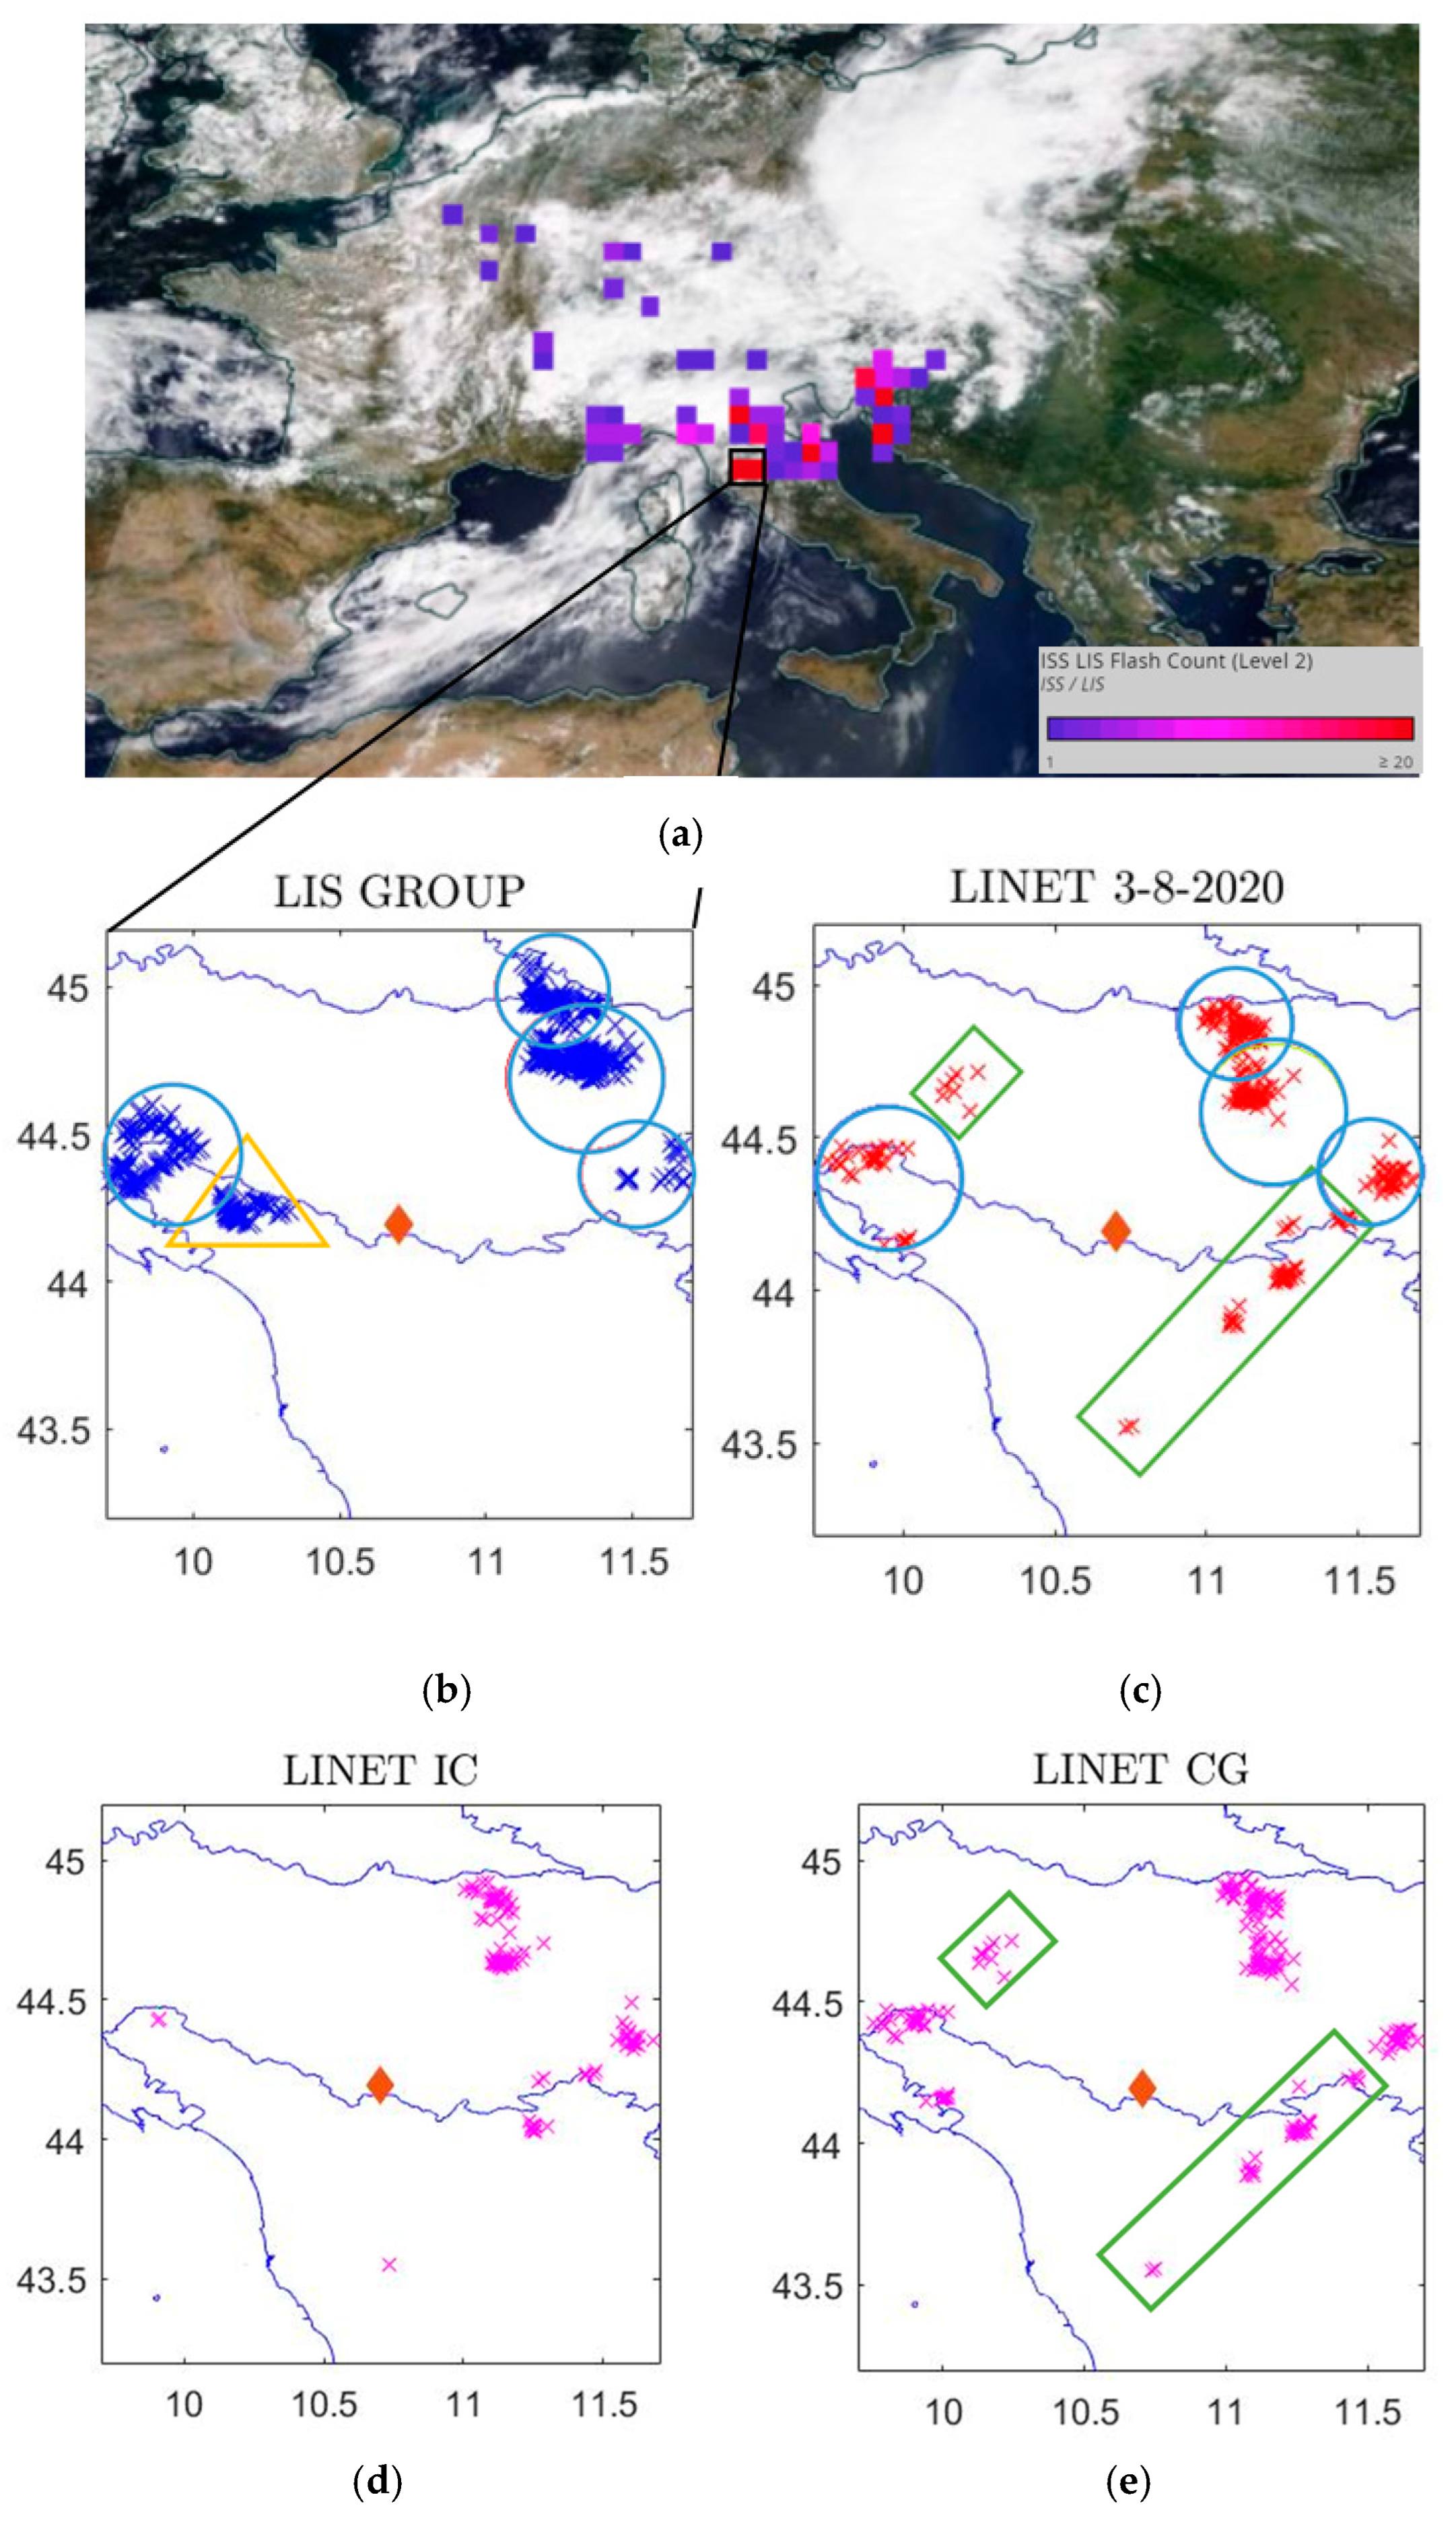
3.2.1. LINET Stroke and ISS-LIS Group Level: A Case Study

In this section, the two sets of data are compared using data from 1 January 2020 until 31 December 2020, in a 100-km area around Mt. Cimone. As a specific example of combined observations that are ground and space based, an overpass of ISS-LIS on 3 August 2020, which yielded marked activity in the area of interest, is presented in Figure 7. The image obtained from the Moderate Resolution Imaging Spectroradiometer (MODIS) sensor aboard the Terra satellite clearly shows the presence of an Atlantic cyclonic flow in the heart of the European continent, affecting north of the Italian peninsula. The instability caused severe thunderstorms with intense lightning activity, reported in the picture by the corresponding detections by the ISS-LIS and shown in more detail in the two frames for both the detection systems considered. Optical signals are grouped in Figure 8b. Corresponding VLF/LF observations (Figure 8c) revealed that LINET and LIS- groups are mostly cross-correlated (blue circles). However, in both maps, different clusters emerged (yellow triangle for the LIS and green rectangles for the LINET). LINET data allowed the possibility to partially explore these differences. The IC and CG maps presented in Figure 8d,e revealed that flashes not observed by the LIS are mainly CG pulses. A possible explanation for this difference may be, on one hand, the detection efficiency capabilities for ground networks, capable of detecting a significant number of discharges without a counterpart in ISS-LIS detections. On the other hand, MODIS parameter retrievals for the area of Figure 8a (Pc < 300 hPa, Tc < 200 K, τ = 50) indicate higher and colder clouds with a strong convective activity and a thickness that could attenuate the CG light passing through the atmosphere [41]. However, LINET IC pulses shown in Figure 8d are mostly included inside LIS clusters, highlighting how much ground systems underestimate the detection of this type of lightning.

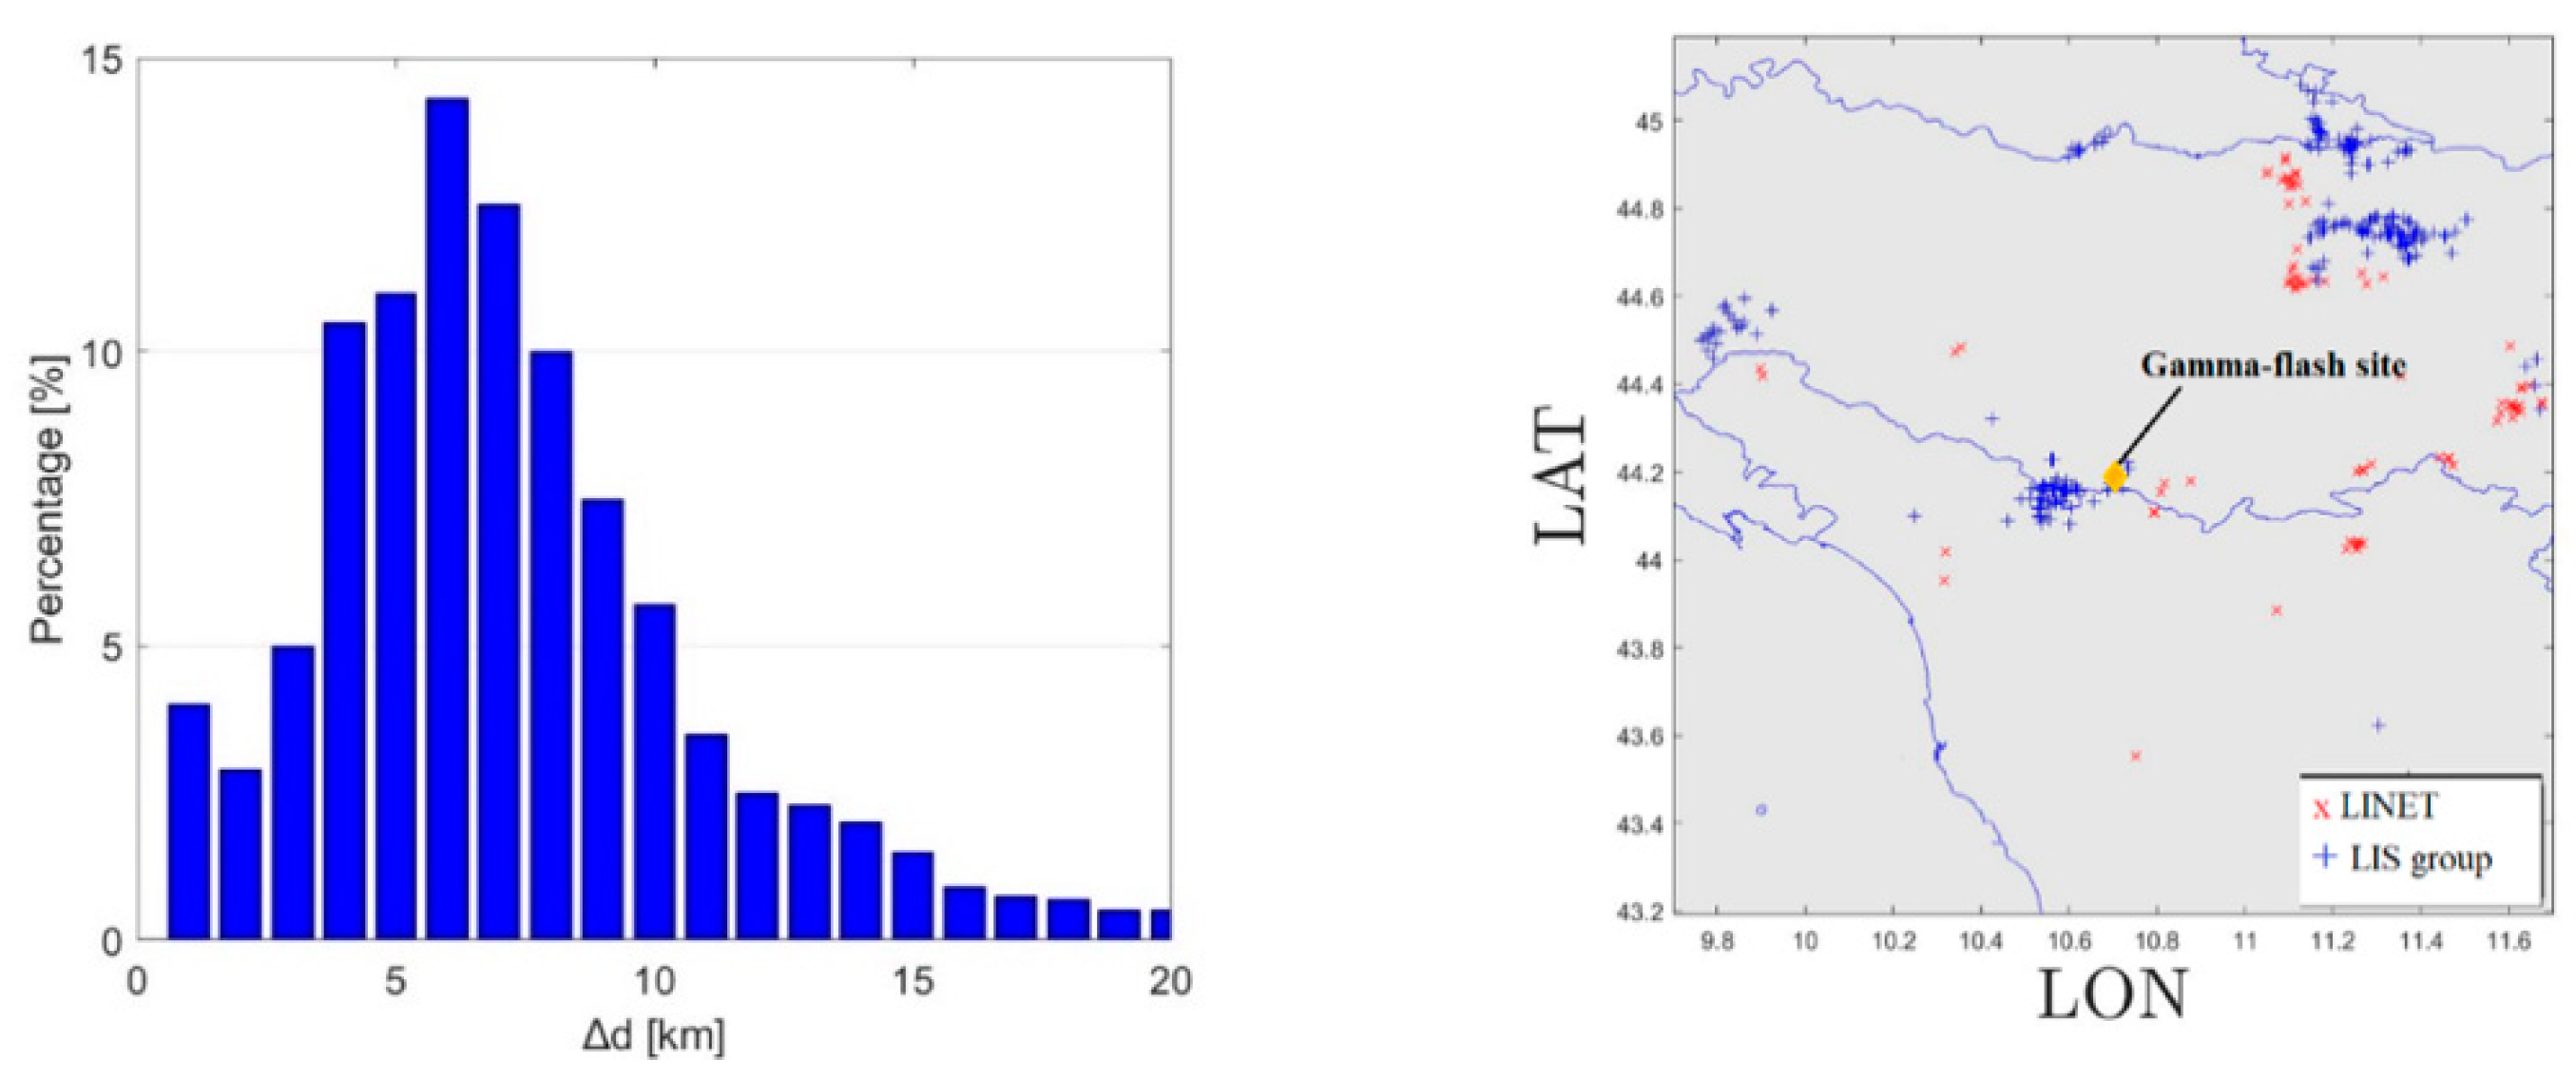
3.2.2. Time Coincident Events

Twelve months’ worth of data were compared for a 100-km region around Mt. Cimone, from January 2020 to December 2020. RDE can be calculated using the formulas described in Section 2. Calculating the DE of one system compared to another means obtaining an estimate of the probability that the second system is able to detect the same flash. The results are shown in Table 1, with respect to similar comparisons from the literature. The ISS-LIS group RDE obtained P(ISS-LIS|LINET), which is 30.5%, while it is 12.4% in the case of P(LINET|ISS-LIS). Those values are comparable with the RDE values presented in [20]. Comparing lightning observations from the ground-based EUCLID network and the optical signals detected by the ISS-LIS, they found an ISS-LIS group relative DE of 36.5%, while it was 14.7% in the case of P(EUCLID|ISS-LIS). Otherwise, reference [36], using NLDN detections with TRMM-LIS observations, in 2013 found much higher RDE values up to 52.9%. In comparing these results, one should take into consideration the improvement in the ground-based detection system over the past decade, which makes it possible to observe a certain number of unobservable lightning strokes from space. Using the matching criteria defined before, individual LINET discharges were also correlated in space and time with LIS data at the group level in order to determine the number of combined observations. Specifically, only individual LINET discharges that occurred within the LIS FoV and in each specific range of the LIS view time were selected and correlated with LIS groups. A full summary of the LINET and ISS-LIS group, for CG and IC flashes, can be found in Table 2.
The total amount of matched flashes saw a prevalence in the ratio of about 2:1 between CGs and ICs, confirming the reduced sensitivity of ground systems to the detection of ICs. Figure 9 shows the map that located the 436 matches found in 2020 and the distance offset ∆d, calculated here as dISS-LIS − dLINET, in 1 km intervals between them. An increase of up to 6 km was observed, followed by a decrease for longer distances up to 20 km (our matching threshold), with a mean location difference of 4.7 km. This result is in line with previous findings presented in [26,28], who compared LIS group locations with comparable ground-based networks. Moreover, considering that the LINET location accuracy is better than 500 m, it is possible to attribute the difference to LIS geolocation uncertainty error, which we therefore estimate to be on the order of 5 km.
Figure 10a,b shows the LINET-LIS matched lightning amplitude distribution (separated for IC and CG flashes) and the emission height of the LINET IC matched with LIS. With respect to the total LINET strokes observed in the Cimone area during the entire period (see Figure 6a), this subset revealed a greater correlation of lightning strikes with current values below ~4–5 kA (vs ~10 kA for LINET only). In addition, the strong discrepancy in this range between the two categories (CGs and ICs) seems to be softening. While Figure 6a showed a strong trend in the detection of CGs, exceeding the IC value by more than 50%, in the case of strokes also detected by LIS, this trend was not preponderant. The reason depends on several factors. On one hand, the probability of satellite sensors to detect ICs developing in the upper parts of clouds is higher than for ground-based sensors; on the other hand, there is a higher sensitivity of ground-based sensors to detect CG discharges at low intensity. Accordingly, we found that this subset distribution peaked around a 9 km altitude, about 3–4 km higher than the mean altitude obtained at Mt. Cimone, including unmatched flashes (see Figure 6b). This implies that LINET flashes detected by ISS-LIS are higher than flashes detected only by LINET.
Table 3 summarizes the characteristics of matched and unmatched flashes, including LINET IC height, and flash energetics expressed by the current amplitude for LINET strokes and radiance for LIS counterparts.

4. Conclusions

A climatology of LINET and ISS-LIS data was produced to investigate the occurrence of lightning over Mt. Cimone (2165 m a.s.l—Italy). The analyses were performed within activities of the GAMMA-FLASH project in support of potential detections of high-energy radiation and particles from thunderstorms. We explored a domain of a 5-km radius around the observational site in comparison with the broader mountain area. LINET sferic statistics over nine years (2012–2020) showed a prevalence of lightning strokes in the summertime during the early afternoon. This is a typical seasonal dependence of lightning over continental areas in contrast to an autumn peak in the activity over the sea, and it is therefore determined by generally large and deep thunderstorms. The climatology showed that most strokes have currents below ~10 kA, with CGs exceeding ICs in number by 50% and IC heights peaking at a 5–6 km altitude (a.s.l.), which is 3–4 km above the observatory site. The occurrence of total lightning activity (IC+CG) was modulated by orography and increased with the surface elevation, highlighting a minor clustering along the longitude direction, due to wind circulation along the region. Moreover, CGs tend to cluster near the mountain top, with a distance between the cluster centroid and the GF site of 250 m, shifted towards N, N/W. On the contrary, IC flashes do not show a dependence on the orography of the surrounding territory, as expected from their occurrence higher in the cloud layer. The clustering at the Cimone mountain top induced by the orography replicated a general feature of the dependence of global lightning hot-spots from elevation [3] and is of great interest in the understanding of the lighting–climate relationship, considering the known effects of elevation-dependent climate change [42]. Since ground-based systems have limited efficiency in detecting ICs, a complementary analysis, including space-based detections, was performed with the ISS-LIS sensor over twelve months of 2020. A good spatial agreement between coincident events was found, but with shortages in the cross-correlation of flashes, with typically a deficiency of LIS in confirming LINET CG detections. To obtain an estimate of the probability of the adopted detection systems in detecting the corresponding flash measured by the other system, an analysis using the Bayesian approach was performed following [20,36]. Such an approach is fundamental considering that, when comparing the performance of two LLSs, neither should be treated as truth since neither can detect the true total lightning distribution but only a fraction of it. These results are compatible with a previous EUCLID/ISS-LIS comparison [20], further highlighting the importance of a synergetic use of LIS and ground-based networks and the validity of their cross-validation. Statistics of matched lightning compared to total lightning revealed that LINET detections with low current values and high height are more likely detected by ISS-LIS. The ISS-LIS energetics exhibit higher radiance values for ISS-LIS-only flashes than for matched ones, indicating that flashes that are more likely to be detected by LINET are often optically less bright (are located at a lower altitude); therefore, their radiance undergoes greater extinction on the way to the LIS. Numerical simulations [22] identify a spatial region of a 3.5-km radius and 8.0-km altitude a.s.l around the experiment site, as is optimal to detect typical TGF emissions. All in all, the statistics performed demonstrate the presence of a substantial number of lightning strokes and, being in line with numerical simulations, show that the site chosen for the GF program is optimal for the detection of high-energy radiation and particles.

Author Contributions

Conceptualization, A.T., A.U., F.F., E.A. and S.D.; methodology, A.T., F.F., E.A. and S.D.; formal analysis, A.T., E.A. and S.D.; investigation, A.T., E.A. and S.D.; resources, S.D. and M.T.; data curation, A.T. writing—original draft preparation, A.T.; writing—review and editing, A.T., A.U., E.A., E.P. and S.D.; supervision, A.T., E.A., E.V., M.T. and S.D. All authors have read and agreed to the published version of the manuscript.

Funding

This research received no external funding.

Data Availability Statement

The data for the ISS-LIS sample presented in this work were provided by the NASA Global Hydrology Resource Center DAAC at https://ghrc.nsstc.nasa.gov/lightning/data/data_lis_iss.html, accessed on 4 September 2021.

Acknowledgments

This study is part of the project ‘GAMMA-FLASH: high-energy radiation and particles in thunderstorms, lightning and Terrestrial Gamma Ray Flashes’ of the Italian Space Agency (ASI), with programmatic and scientific participation of the National Institute of Astrophysics (INAF). It was also supported by the collaboration of numerous institutions and universities such as the Institute for Atmospheric Science and Climate (ISAC-CNR), the National Institute of Nuclear Physics (INFN), the University of Rome “Tor Vergata”, the University of Padova, and the Inter-University Consortium for Space Physics (CIFS).

Conflicts of Interest

The authors declare no conflict of interest.

References

  1. Marchand, M.; Hilburn, K.; Miller, S.D. Geostationary Lightning Mapper and Earth Networks Lightning Detection Over the Contiguous United States and Dependence on Flash Characteristics. J. Geophys. Res. Atmos. 2019, 124, 11552–11567. [Google Scholar] [CrossRef]
  2. Østgaard, N.; Balling, J.E.; Bjørnsen, T.; Brauer, P.; Budtz-Jørgensen, C.; Bujwan, W.; Carlson, B.; Christiansen, F.; Connell, P.; Eyles, C.; et al. The Modular X- and Gamma-Ray Sensor (MXGS) of the ASIM Payload on the International Space Station. Space Sci. Rev. 2019, 215, 23. [Google Scholar] [CrossRef] [Green Version]
  3. Albrecht, R.I.; Goodman, S.J.; Buechler, D.E.; Blakeslee, R.J.; Christian, H.J. Where Are the Lightning Hotspots on Earth? Bull. Am. Meteorol. Soc. 2016, 97, 2051–2068. [Google Scholar] [CrossRef]
  4. Gjesteland, T.; Østgaard, N.; Collier, A.B.; Carlson, B.E.; Eyles, C.; Smith, D.M. A New Method Reveals More TGFs in the RHESSI Data. Geophys. Res. Lett. 2012, 39, L05102. [Google Scholar] [CrossRef] [Green Version]
  5. Grefenstette, B.W.; Smith, D.M.; Hazelton, B.J.; Lopez, L.I. First RHESSI Terrestrial Gamma Ray FLash Catalog. Geophys. Res. 2009, 114, A02314. [Google Scholar] [CrossRef]
  6. Briggs, M.S.; Xiong, S.; Connaughton, V.; Tierney, D.; Fitzpatrick; Hutchins, M.L. Terrestrial Gamma-Ray Flashes in the Fermi Era: Improved Observations and Analysis Methods. J. Geophys. Res. Space Phys. 2013, 118, 3805–3830. [Google Scholar] [CrossRef]
  7. Tavani, M.; Barbiellini, G.; Argan, A.; Boffelli, F.; Bulgarelli, A.; Caraveo, P.; Cattaneo, P.W.; Chen, A.W.; Cocco, V.; Costa, E.; et al. The AGILE Mission. Astron. Astrophys. 2009, 502, 995–1013. [Google Scholar] [CrossRef]
  8. Smith, D.M.; Dwyer, J.R.; Hazelton, B.J.; Grefenstette, B.W.; Martinez-McKinney, G.F.M.; Zhang, Z.Y.; Lowell, A.W.; Kelley, N.A.; Splitt, M.E.; Lazarus, S.M.; et al. Heckman A Terrestrial Gamma Ray Flash Observed from an Aircraft. J. Geophys. Res. Atmos. 2011, 116, D20124. [Google Scholar] [CrossRef] [Green Version]
  9. Bowers, G.S.; Smith, D.M.; Kelley, N.A.; Martinez-McKinney, G.F.; Cummer, S.A.; Dwyer, J.R.; Heckman, S.; Holzworth, R.H.; Marks, F.; Reasor, P.; et al. A Terrestrial Gamma-Ray Flash inside the Eyewall of Hurricane Patricia. J. Geophys. Res. Atmos. 2018, 123, 4977–4987. [Google Scholar] [CrossRef]
  10. Abbasi, R.U.; Abu-Zayyad, T.; Allen, M.; Barcikowski, E.; Belz, J.W.; Bergman, D.R.; Blake, S.A.; Byrne, M.; Cady, R.; Cheon, B.; et al. Gamma Ray Showers Observed at Ground Level in Coincidence with Downward Lightning Leaders. J. Geophys. Res. Atmos. 2018, 123, 6864–6879. [Google Scholar] [CrossRef]
  11. Enoto, T.; Wada, Y.; Furuta, Y.; Nakazawa, K.; Yuasa, T.; Okuda, K.; Makishima, K.; Sato, M.; Sato, Y.; Nakano, T.; et al. Photonuclear Reactions Triggered by Lightning Discharge. Nature 2017, 551, 481–484. [Google Scholar] [CrossRef] [PubMed]
  12. Bowers, G.S.; Smith, D.M.; Martinez-McKinney, G.F.; Kamogawa, M.; Cummer, S.A.; Dwyer, J.R.; Wang, D.; Stock, M.; Kawasaki, Z. Gamma Ray Signatures of Neutrons From a Terrestrial Gamma Ray Flash. Geophys. Res. Lett. 2017, 44, 10063–10070. [Google Scholar] [CrossRef]
  13. Pleshinger, D.J.; Alnussirat, S.T.; Arias, J.; Bai, S.; Banadaki, Y.; Cherry, M.L.; Hoffman, J.H.; Khosravi, E.; Legault, M.D.; Rodriguez, R.; et al. Sunda-Meya Gamma Ray Flashes Produced by Lightning Observed at Ground Level by TETRA-II. J. Geophys. Res. Space Phys. 2019, 124, 9229–9238. [Google Scholar] [CrossRef] [Green Version]
  14. Hare, B.M.; Uman, M.A.; Dwyer, J.R.; Jordan, D.M.; Biggerstaff, M.I.; Caicedo, J.A.; Carvalho, F.L.; Wilkes, R.A.; Kotovsky, D.A.; Gamerota, W.R.; et al. Ground-Level Observation of a Terrestrial Gamma Ray Flash Initiated by a Triggered Lightning. J. Geophys. Res. Atmos. 2016, 121, 6511–6533. [Google Scholar] [CrossRef] [Green Version]
  15. Labanti, C.; Marisaldi, M.; Fuschino, F.; Galli, M.; Argan, A.; Bulgarelli, A.; di Cocco, G.; Gianotti, F.; Tavani, M.; Trifoglio, M. Design and Construction of the Mini-Calorimeter of the AGILE Satellite. Nucl. Instrum. Methods Phys. Res. 2009, 598, 470–479. [Google Scholar] [CrossRef] [Green Version]
  16. Tiberia, A.; Porcú, F.; Marisaldi, M.; Tavani, M.; Dietrich, S. GPM-DPR Observations on TGFs Producing Storms. J. Geophys. Res. Atmos. 2021, 126, e2020JD033647. [Google Scholar] [CrossRef]
  17. Tiberia, A.; Mascitelli, A.; D’Adderio, L.; Stefano, F.; Marisaldi, M.; Porcu, F.; Realini, E.; Gatti, A.; Ursi, A.; Fuschino, F.; et al. Time Evolution of Storms Producing Terrestrial Gamma-Ray Flashes Using ERA5 Reanalysis Data, GPS, Lightning and Geo-Stationary Satellite Observations. Remote Sens. 2021, 13, 784. [Google Scholar] [CrossRef]
  18. Boccippio, D.J.; Cummins, K.L.; Christian, H.J.; Goodman, S.J. Combined Satellite-and Surface-Based Estimation of the Intracloud–Cloud-to-Ground Lightning Ratio over the Continental United States. Mon. Weather. Rev. 2001, 129, 108–122. [Google Scholar] [CrossRef]
  19. Rudlosky, S.; Shea, D.D.T. Evaluating WWLLN Performance Relative to TRMM/LIS. Geophys. Res. Lett. 2013, 40, 2344–2348. [Google Scholar] [CrossRef]
  20. Poelman, D.; Schulz, W. Comparing Lightning Observations of the Ground-Based EUCLID Network and the Space-Based ISS-LIS. 2020. Available online: https://amt.copernicus.org/preprints/amt-2019-435/amt-2019-435.pdf (accessed on 4 September 2021).
  21. Rudlosky, S.; Peterson, M.; Kahn, D. GLD360 Performance Relative to TRMM LIS. J. Atmos. Ocean. Technol. 2017, 34, 1307–1322. [Google Scholar] [CrossRef]
  22. Ursi, A.; Rodriguez Fernandez, G.; Tiberia, A.; Virgilli, E.; Arnone, E.; Preziosi, E.; Campana, R.; Tavani, M. A Study on TGF Detectability at 2165 m Altitude: Estimates for the Mountain-Based Gamma-Flash Experiment. Remote Sens. 2022, 14, 3103. [Google Scholar] [CrossRef]
  23. Betz, H.D.; Schmidt, K.; Laroche, P.; Blanchet, P.; Oettinger, P.; Defer, E.; Dziewit, Z.; Konarski, J. LINET—An International VLF/LF Lightning Detection Network in Europe. Atmos. Res. 2009, 91, 564–573. [Google Scholar] [CrossRef]
  24. Cummins, K.L.; Murphy, M.J.; Bardo, E.A.; Hiscox, W.L.; Pyle, R.B.; Pifer, A.E. A Combined TOA/MDF Technology Upgrade of the U.S. National Lightning Detection Network. J. Geophys. Res. 1998, 103, 9035–9044. [Google Scholar] [CrossRef]
  25. Orville, R.E.; Huffines, G.R.; Burrows, W.R.; Holle, R.L.; Cummins, K.L. The North American Lightning Detection Network (NALDN)—First Results: 1998–2000. Mon. Weather Rev. 2002, 130, 2098–2109. [Google Scholar] [CrossRef]
  26. Jacobson, A.R.; Cummins, K.L.; Carter, M.; Klingner, P.; Roussel-Dupré, D.; Knox, S.O. FORTE Radio-Frequency Observations of Lightning Strokes Detected by the National Lightning Detection Network. J. Geophys. Res. 2000, 105, 15653–15662. [Google Scholar] [CrossRef]
  27. Betz, H.-D.; Schmidt, K.; Oettinger, P.; Wirz, M. Lightning Detection with 3-D Discrimination of Intracloud and Cloud-to-Ground Discharges. Geophys. Res. Lett. 2004, 31, L11108. [Google Scholar] [CrossRef]
  28. Cooray, V. Propagation Effects Due to Finitely Conducting Groung on Lightning -Gnerated Magnetic Fields Evaluated Using Sommerfeld’s Integrals. IEEE Trans. Electromagn. Compat. 2009, 51, 526–531. [Google Scholar] [CrossRef]
  29. Li, D.; Rubinstein, M.; Rachidi, F.; Diendorfer, G.; Schulz, W.; Lu, G. Location Accuracy Evaluation of TaA-Based Lightning Location Systems Iver Mountainous Terrain. J. Geophys. Res. Atmos. 2017, 122, 11760–11775. [Google Scholar] [CrossRef] [Green Version]
  30. Christian, H.; Blakeslee, R.; Goodman, S.; Mach, D.; Stewart, M.; Buechler, D.; Koshak, W.J.; Hall, J.M.; Boeck, W.L.; Driscoll, K.T.; et al. The Lightning Imaging Sensor. 1999. Available online: https://d1wqtxts1xzle7.cloudfront.net/43026184/The_Lightning_Imaging_Sensor20160224-25645-1xhbrfv-with-cover-page-v2.pdf?Expires=1658149160&Signature=TNbKQIIlK9PvFip~VVnPYLZnoGZLe5rBVU7ebXKlc70CftkahtytWdeqFTTXf79Z6-zOytnEAfo-rRQcD9GbiXxn-so9vU1Gm1Dt-ViwD4bkHiDlcJlCOOTIfHioR7nstNZut41l16Fij0s~xvWizJP~uYrN~F~qkEsfhhTe4URiDTm5dLwGdl1iefNPLXTPuTMXQwk1uOjvtioMJTEbX1HQeROtV4lsc4jA2xqBlQiGoId1clZQ4W4eso-9rOJ4LNRn~VJLrOLxnQotGvBwlDiXKsPqDxUPJ6hLkr~Rqgm9RdmWxwTD4575uw2CMXaNYGXH4x7rZX3XdUinux3Kvw__&Key-Pair-Id=APKAJLOHF5GGSLRBV4ZA (accessed on 4 September 2021).
  31. Christian, H.; Blakeslee, R.; Goodman, S.; Mach, D. Algorithm Theoretical Basis Document (atbd) for the Lightning Imaging Sensor (lis). 2000. Available online: https://ci.nii.ac.jp/naid/10029104600/ (accessed on 4 September 2021).
  32. Bitzer, P.M.; Christian, H.J. Timing Uncertainty of the Lightning Imaging Sensor. J. Atmos. Ocean. Technol. 2015, 32, 453–460. [Google Scholar] [CrossRef]
  33. Franklin, V. An Evaluation of the Lightning Imaging Sensor with New Insights on the Discrimination of Lightning Flash and Stroke Detectability. Master’s Thesis, Department of Atmospheric Science, Uniersity of Alabama in Huntsville, Huntsville, AL, USA, 2013. [Google Scholar]
  34. Rubinstein, M. On the Estimation of the Stroke Detection Efficiency by Comparison of Adjacent Lightning Location Systems. In Proceedings of the 22nd International Conference on Lightning Protection (ICLP), Budapest, Hungary, 19–23 September 1994. [Google Scholar]
  35. Bitzer, P.M.; Burchfield, J.C.; Christian, H.J. A Bayesian Approach to Assess the Performance of Lightning Detection Systems. J. Atmos. Ocean.Technol. 2016, 33, 563–578. [Google Scholar] [CrossRef]
  36. Zhang, D.; Cummins, K.L.; Nag, A.; Murphy, M.; Bitzer, P. Evaluation of the National Lightning Detection Network Upgrade Using the Lightning Imaging Sensor. 2016. Available online: https://www.vaisala.com/sites/default/files/documents/Daile%20Zhang%20et%20al.%20Evaluation%20of%20the%20National%20Lightning%20Detection%20Network%20Upgrade%20Using%20the%20Lightning%20Imaging%20Sensor.pdf (accessed on 4 September 2021).
  37. Cristofanelli, P.; Brattich, E.; Decesari, S.; Landi, T.C.; Maione, M.; Putero, D.; Tositti, L.; Bonasoni, P. The “O. Vittori” Observatory at Mt. Cimone: A “Lighthouse” for the Mediterranean Troposphere. In High-Mountain Atmospheric Research: The Italian Mt. Cimone WMO/GAW Global Station (2165 m a.s.l.); Cristofanelli, P., Brattich, E., Decesari, S., Landi, T.C., Maione, M., Putero, D., Tositti, L., Bonasoni, P., Eds.; Springer International Publishing: Cham, Switzerland, 2018; pp. 1–14. ISBN 978-3-319-61127-3. [Google Scholar]
  38. Cristofanelli, P.; Fierli, F.; Graziosi, F.; Steinbacher, M.; Couret, C.; Calzolari, F.; Roccato, F.; Landi, T.; Putero, D.; Bonasoni, P. Decadal O3 Variability at the Mt. Cimone WMO/GAW Global Station (2165 m a.s.l., Italy) and Comparison with Two High-Mountain “Reference” Sites in Europe. Elem. Sci. Anthr. 2020, 8, 00042. [Google Scholar] [CrossRef]
  39. Cristofanelli, P.; Bonasoni, P.; Carboni, G.; Calzolari, F.; Casarola, L.; Zauli Sajani, S.; Santaguida, R. Anomalous High Ozone Concentrations Recorded at a High Mountain Station in Italy in Summer 2003. Atmos. Environ. 2007, 41, 1383–1394. [Google Scholar] [CrossRef]
  40. Arnone, E.; Bór, J.; Chanrion, O.; Barta, V.; Dietrich, S.; Enell, C.-F.; Farges, T.; Füllekrug, M.; Kero, A.; Labanti, R.; et al. Climatology of Transient Luminous Events and Lightning Observed Above Europe and the Mediterranean Sea. Surv. Geophys. 2020, 41, 167–199. [Google Scholar] [CrossRef] [Green Version]
  41. Platnick, S.; Ackerman, S.A.; King, M.D.; Meyer, K.; Menzel, W.P.; Holz, R.E.; Baum, B.A.; Yang, P. NASA MODIS Adaptive Processing System; Goddard Space Flight Center: Greenbelt, MD, USA, 2015.
  42. Pepin, N.C.; Arnone, E.; Gobiet, A.; Haslinger, K.; Kotlarski, S.; Notarnicola, C.; Palazzi, E.; Seibert, P.; Serafin, S.; Schöner, W.; et al. Climate Changes and Their Elevational Patterns in the Mountains of the World. Rev. Geophys. 2022, 60, e2020RG000730. [Google Scholar] [CrossRef]
Figure 1. The Gamma-Flash site located at the Italian Climate Observatory “O. Vittori” on the top of Mt. Cimone (44, 17N, 10, 68E, 2165 m a.s.l.—Northern Italian Apennines).
Remotesensing 14 03501 g001
Figure 2. The LINET time delay scheme associated with IC discharges in the pseudo-3D algorithm. The time delay is related to the travel path used to estimate the height of the flash; L = lightning position; S =station; h = source height; TP = travel path (Adapted with permission from Ref. [27]).
Remotesensing 14 03501 g002
Figure 3. LINET lightning location maps over the Mt. Cimone area: (a,b) total lightning activity along the orography in two cutting directions centered on the GF site; (c) located CG flash detections; (d) located IC flash detections. Area: 5 km around the observatory. Ref. period: 2012–2020. The red placeholder indicates the position of the GF site.
Remotesensing 14 03501 g003aRemotesensing 14 03501 g003b
Figure 4. The LINET lightning amplitude distribution over the Mt. Cimone area. Area: 300 m vs 10 km around the observatory. Ref. period: 2012–2020.
Remotesensing 14 03501 g004
Figure 5. LINET daily (a) and annual (b) lightning distributions. Area considered: 5 km radius around the Mt. Cimone Observatory. Data range: 2012–2020.
Remotesensing 14 03501 g005
Figure 6. (a) LINET lightning amplitude distribution in the Mt. Cimone area divided into CG and IC data in steps of 0.5 kA; (b) LINET IC emission height (steps/0.5 km). Area considered: 5 km radius around the Mt. Cimone Observatory. Data range: 2012–2020.
Remotesensing 14 03501 g006
Figure 7. LINET lightning amplitude distribution in the Mt. Cimone area along the height for IC strokes. Area considered: 5 km radius around the Observatory. Data range: 2012–2020.
Remotesensing 14 03501 g007
Figure 8. ISS-LIS and LINET lightning activity on 3 August 2020 extrapolated from the Moderate Resolution Imaging Spectroradiometer (MODIS). Lightning flashes observed are displayed, as well as the CG and IC flashes detected by LINET. (a) MODIS overpass over Europe; (b) ISS-LIS detection; (c) LINET relative detection; (d,e) LINET detection divided in IC (d) and CG (e).
Remotesensing 14 03501 g008
Figure 9. Match Map of coincident LIS and LINET strokes (left). Ref. period: 2020. Location difference between matches (right) expressed in percentage of occurrence.
Remotesensing 14 03501 g009
Figure 10. (a) LINET IC matched lightning amplitude distribution in the Mt. Cimone area divided into CG and IC data in steps of 0.5 kA. Area considered: 100 km radius around the observatory. Data range: January–December 2020; (b) LINET IC matched emission height (steps/0.5 km). Area considered: 100 km radius around the Mt. Cimone Observatory. Data range: January–December 2020.
Remotesensing 14 03501 g010
Table 1. Detection efficiencies of a ground lightning system (GLS) with respect to a satellite system and vice versa, calculated with the Bayesian approach, including results and correspondent values from the literature.
AuthorsYearSensorsP(LIS|GLS)P(GLS|LIS)
Current work2022ISS-LIS/LINET30.5%12.4%
Poelman et al.2020ISS-LIS/EUCLID36.5%14.7%
Zhang et al.2016TRMM-LIS/NLDN52.9%9.9%
Table 2. LINET and ISS-LIS groups matched as different categories and with the flash number in each category. Data were compared for a 100-km region around Mt. Cimone, from January 2020 to December 2020. LINET useful flashes were selected in each corresponding view time LIS observation. The correlation criteria made use of space and time windows of 20 km and 10 ms, respectively.
Tot.CG-FlashIC-Flash
LINET flash number14391081358
ISS-LIS group number3724
Matched436284152
Table 3. Summary of the characteristics for flashes observed by LINET, LIS, and matched.
hIC_max
[km]
hIC_mean
[km]
Imax
[kA]
Imean
[kA]
Rmax
[µJ m−2 sr−2 nm−1]
Rmean
[µJ m−2 sr−2 nm−1]
LINET only14.40006.7654149.40006.9962
Matched12.20007.165127.10005.13854.0 × 1053.50 × 104
LIS only 2.52 × 1063.13 × 104
ISS-LIS flashes feature 2.52 × 10⁶ maximum radiance, while matched flashes appeared significantly darker (maximum radiance 4 × 10⁵).
Publisher’s Note: MDPI stays neutral with regard to jurisdictional claims in published maps and institutional affiliations.

