1. Introduction
At present, with the development of China’s economy and society, the connection between various regions has increased, and people travel more frequently. The country also began to build its road transportation network vigorously. The development of roads has promoted the rapid development of the national economy, combining social production and consumption, and has become one of the important industries in the current economic structure of the country [
1]. In turn, the high rate of road construction undermines the ability of ecosystems to provide services and causes a variety of ecological problems [
2], such as wildlife habitat fragmentation [
3], land and river pollution [
4], reduced species diversity, decreased vegetation productivity [
5], water cycle disruption, and local climate changes [
6]. It also increases human health risks. Therefore, sufficient scientific references need to be presented to address the issues of ecological degradation and traffic road construction.
Recently, new research on road construction development in China has focused on environmental evaluation research of road landscapes. The emergence and development of landscape ecology theory have brought some new research theories and methods for the environmental evaluation of road landscapes [
7]. In the initial research stage, road ecology mainly focused on exploring the impact of roads on biodiversity and then gradually developed to study the impact of roads on landscape patterns and land space changes along the route. The theoretical system of road ecology has been gradually improved and better understood. The conservation of ecological diversity is an important aspect of ecosystem resilience and an important objective of ecological planning and management by relevant authorities [
8]. Global ecological diversity exists at multiple scales, ranging from different genes to ecosystem and landscape-scale levels for different species [
9]. Landscape diversity is always positively correlated with species diversity indicators [
10] and is therefore considered a measure of ecosystem resilience [
11]. Previous studies have also analyzed the effects of urbanization on ecosystems [
12].
For some areas with a relatively fragile ecological environment, try to avoid them when selecting road routes, while in areas that are difficult to bypass, some measures are used for the compensatory restoration of the ecological environment. Davide et al. chose a new highway passing through a canyon in northern Italy as the research object and adopted four different route selection methods to analyze the ecological landscape along the route [
13]. The results show that because the population of the area passed by the road line is relatively concentrated, some small natural ecosystems play an important role in the protection of local species diversity. To explore the law of the impact of roads on the local ecosystem, several different ecosystems were selected for analysis. However, due to the scarcity and scattered distribution of natural ecosystems in the alpine valleys, the difficulty of road route selection is greatly increased. Davide analyzed the changes in regional landscape diversity and the reduction of landscape area caused by road construction and used Landsat images to classify land use types; by selecting three group landscape patterns indexes, can quantitatively evaluate the impact intensity of roads on road landscape changes, and determine the optimal construction plan according to the evaluation results [
14]. Trombulak pointed out that road construction will have a serious negative impact on fragile ecosystems such as wetlands, and the newly built roads will change the hydrological characteristics of the local surface, which may lead to the destruction of wetlands [
15]. Arif et al. chose the road traffic network in the suburbs of Burdwan, India, as the research object, aiming to analyze the impact of road traffic network changes on the economic, ecological, and social development of the suburban areas [
16]. The research results show that the road traffic network is the most important driving force in the development process of the suburban area. By intervening in the development of the road traffic network, the interaction of the economy, ecology, and society in different areas of the suburban area can be further simplified so that the development of the suburban area will be orderly. At the same time, Arif et al. also mentioned that developing countries are currently facing unprecedented urbanization development, the impact of such rapid urbanization development will have huge consequences, and the urbanization development process should be further evaluated through specific indicators to provide the necessary planning for the sustainable development of urbanization [
17]. Therefore, the construction of roads will have an impact on the landscape pattern of the surrounding land cover, which will lead to the destruction of the ecological environment, which is not conducive to sustainable development.
Based on previous research and analysis, this study will explore the impact of road landscape patterns indexes on the ecological environment, with the purpose of providing a basis for protecting the ecological environment for future urban and road planning and serving the sustainable development of the city. More specifically, our research goals are: (1) Analysis of road landscape patterns indexes in Shanghai; (2) Analysis of the influence of the Shanghai road network on landscape patterns; (3) Provide constructive suggestions for the sustainable development of Shanghai.
2. Study Area and Data Description
2.1. Study Area
As the selected study area, Shanghai is one of the most important cities in the Yangtze River Delta. It is located between longitudes 120°50′~122°55′E and latitudes 30°40′~31°55′N and is near the eastern coastal area of China (
Figure 1). The subtropical monsoon climate in the region brings fertile soil and sufficient rainfall, which makes it a vital ecological protection zone. By 2010, Shanghai had a population of 23,002,000, and its gross domestic product (GDP) accounted for 4.3% of that of the country (Shanghai Bureau of Statistics 2010).
With the sustained growth of the local economy, the level of urbanization has continuously increased, and residents’ income has steadily improved. Shanghai has gradually developed into an international shipping center, trade center, and information center. In the past 30 years, a large transportation network has been established in the eastern coastal areas of China to meet the increasing demands for logistics and tourism. Moreover, by 2010, the highway mileage in Shanghai had expanded to more than 775 km, and the railway mileage was approximately 697 km (Shanghai Bureau of Statistics 2010). Therefore, Shanghai could be used as a typical example to analyze the impacts of land use change and traffic on landscape patterns.
2.2. Data Description
In this study, Landsat Thematic Mapper (TM) images with a spatial resolution of 30 × 30 m from four periods (1995, 2000, 2005 and 2010) in Shanghai were used to extract land cover (LC) maps of the study area as
Figure 2, and most were downloaded from the USGS website (
http://glovis.usgs.gov/ (accessed on 8 April 2022)). To further reduce the influence of data factors on the research results of this paper, this paper screened the data to ensure that the selected data dates are close and the cloudiness and other characteristics are consistent. The data descriptions are as follows in
Table 1 and
Table 2.
We comprehensively utilized the automatic and manual interpretation of the remote sensing images and then obtained the vector graphs of land use/land cover (LULC), which contained five objects: grassland, forestland, construction land, water bodies, and cultivated land. Before interpretation, all images were processed by geometric correction and radiometric correction to ensure the accuracy of classification. For each classified figure, we selected 2000 random points and validated the corresponding features found in Google Earth and other high-resolution images. Through this method, the kappa coefficient was calculated as 0.84 for 1995, 0.87 for 2000, 0.87 for 2005, and 0.89 for 2010, and these values met the minimum standard of 0.7 for the classification of LU [
18]. In addition, the traffic roads were intercepted from the digital traffic data (1:100,000 scale) of Shanghai in 2010. The digital traffic data is from OpenStreetMap, and the digital traffic data in this period corresponds to the Landsat data. They consisted of four types: railway, highway, national way, and provincial road, as shown in
Figure 3.
3. Methodology
3.1. Landscape Metric Analysis
Most landscape metrics can be used to express the landscape composition and spatial configuration [
19]. In a general sense, they are measurable units of landscape composition, which can intuitively reflect the dynamic changes in landscape types and patterns [
20]. In our research, we have chosen seven metrics as shown in
Table 3: the number of patches (NP), total area (TA), edge density (ED), area weighed mean shape index (AWMSI), mean shape index (MSI), total edge (TE), Shannon diversity index (SHDI) and Shannon evenness index (SHEI). Among these metrics, the NP describes the heterogeneity of the entire landscape as a density indicator, the ED and TE represent the dynamic characteristics of landscape elements as an edge index, and the MSI and AWMSI measure the complexity of landscape spatial patterns as a shape index. Moreover, as the most commonly used diversity indices, the SHDI and SHEI refer to the richness and evenness of a landscape pattern.
Furthermore, landscape metrics are beneficial for evaluating the impacts that transportation routes exert on landscapes. Therefore, we selected four additional metrics Patch density (PD) indicates the number of patches within a unit area. A high PD value indicates severe landscape fragmentation caused by the separation of cultivated land, water, construction land, and grassland patches after the roads were built. ED is defined as the edge length between patches of heterogeneous landscape elements in a unit area, and the value represents the complexity and succession of features around a road district. The SHDI is a Shannon index widely used in ecology. It is usually used to describe the richness and uniformity of landscape types. Because the index can reflect the heterogeneity of the landscape and is particularly sensitive to the uneven distribution of various patch types in the landscape, it is often used to evaluate the diversity and heterogeneity of different landscapes or the same landscape in different periods. In this study, the increase in SHDI is mainly due to the frequent conversion of unused land to other patch types or simply due to the further separation of land, arable land, water, construction land, and grassland patches in a certain area due to road expansion, which further leads to the increase in patch types in this area or the balanced distribution of patch types in the overall landscape pattern. The decline may reflect that the study area is usually dominated by a single category. In addition, the intersection juxtaposition index (IJI) was chosen to describe the contagion and interspersion between patches. The greater the IJI is, the higher the degree of proximity between the landscapes, signifying that the features were planned artificially under urbanization.
These metrics were all calculated by Fragstats (The software is developed by the Department of Forest Science of Oregon State University in America and the version is 4.2) and their associated ecological sense studies [
21]. Finally, for further analysis, we calculated the change rate of landscape metrics using the following Equation [
22]:
where
C reflects the change rate of landscape metrics;
refers to the value of landscape metrics in the former year; and
refers to the value of landscape metrics in the latter year.
3.2. Buffer Analysis
Buffer analysis is a classical method used to identify the geographic features within a specific site [
23]. In addition, we applied it here to analyze the relationship between the distance to roads and changes in landscape metrics [
24]. First, we generated a buffer zone around the road using ArcGIS (The software is developed by the Environment System Research Institute in America and the version is 10.1) and then selected features according to whether they were located inside or outside the buffer boundaries. After that, our landscape metrics at different distances from the routes were calculated, as described in
Section 3.1. However, due to the spatial diversities in policy, ecosystem, population density, and others, there is no standard available to determine the explicit extent and quantity of buffer zones [
25]. Taking into account the actual topological characteristics and referring to our experimental results, 10 concentric circles with a diameter from 200 m to 2000 m were ultimately established for each road type [
26]. In addition, to obtain more reasonable analysis results, the widths of roads and some of the roads under construction during the study period were not considered. By evaluating the buffer size and landscape pattern quantitatively, the influence degree and scope of human activity or disturbance on the surrounding landscape patterns can be discussed more precisely [
27].
4. Results and Discussion
4.1. Landscape Metric Analysis in Shanghai
The landscape metric analysis of Shanghai provided evidence of landscape pattern change over the last 15 years. As exhibited in
Table 2, the values of the SHDI and SHEI were 0.86 and 0.53 in 1995, 0.87 and 0.54 in 2000, 0.91 and 0.56 in 2005, and 0.95 and 0.59 in 2010, respectively, and the most significant changes on in landscape diversity occurred between 2005 and 2010. The continuous increases in the two diversity indices during the whole study period suggested that the richness and evenness of the landscape experienced rapid growth, and the distribution of patch types tended to be balanced in the study area.
In addition to the diversity changes, there were varying fluctuations in the dynamic characteristics of the edge index, as shown in displayed in
Table 4. High heterogeneity and notable fragmentation were observed, evidenced by the TE and ED values, which obviously increased in the first two periods from 22,575,064.44 to 24,246,007.88 and from 34.00 to 36.52, respectively, and declined slightly decline afterward. The density index, similar to but not completely consistent with the changing trends of the edge index, experienced a sharp increase from 3991 to 4219 in 1995–2000, while after this period, it encountered a continual decline from 4219 to 3622.
The increase in the three indices of TE, ED, and NP showed that the landscape in the study area had experienced more fragmentation than integration over time. Combined with the analysis of the land use change maps in 1995, 2000, 2005, and 2010 in Shanghai, a large amount of cultivated land and water area were replaced by construction land, and small quantities of grassland and forestland were exploited and became cultivated land. Accordingly, the newly developed land accessible by human activities formed not only numerous scattered patches but also more irregular borders, making it more difficult for animals and plants to inhabit the habitat and thus affecting the diversity of species and the ability of ecosystem regulation. However, with the further development of urbanization in Shanghai, the emerging buildings caused the broken forest, cultivated land, grassland, and water to transition into construction land, resulting in a certain reduction in the edge and density indices in the later stage. In addition, the shape index is critical in landscape pattern research. From the comparison of the MSI and AWMSI in each interval, it was found that both indices reached the highest degree, 35.75 and 50.59, respectively, in 2005. However, after this year, the AWMSI remained stable, while the MSI began to descend slightly from 35.75 to 35.15. Overall, the shape index roughly presented an upward trend, meaning that the complexity of the landscape gradually increased, which was closely related to the process of urbanization in Shanghai. From these results, it can thus be inferred that the ecosystem was affected by human disturbances, which caused its function and structure to become more complex and disordered.
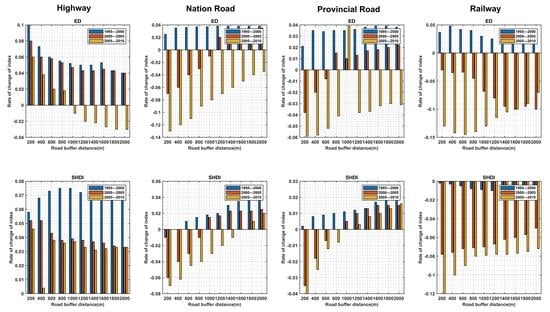
4.2. Impacts of Transportation Networks
As displayed in
Figure 4,
Figure 5,
Figure 6 and
Figure 7. above, in the early stage of the research period, subtle variations and obscure changing rules occurred in the landscape metrics along the regional roads. At that time, roads were relatively rare in China, and therefore external factors such as human activities had little impact on landscape patterns. However, with the development of road construction, the driving forces along the area greatly increased, and the landscape pattern at different distances in the buffer zones gradually showed obvious successional laws.
Figure 4 shows that the changing trend in each period remained roughly consistent during the quick construction process of the highway, while the change rate presented some differences. Among these figures, it is obvious that the change ratio of the SHDI remained positive and drastically increased from 2000–2005, which implied that the landscape diversity increased distinctly at the buffer zone scale. Nevertheless, this result is contrary to previous studies, which believed that the roads would not only hinder the ecological processes but also lead to a decline in landscape diversity [
28]. The promotion of diversity is related to the change in LU types in the buffer zones and the aggravation of fragmentation in the initial stage of urbanization. Usually, people are inclined to settle near roads for convenience [
22], and their movement inside the buffer zone occurs frequently. Dramatic shifts in various features were also common at certain times, so many cultivated lands or wastelands were converted to profitable cash crops, fishing ponds, industrial land, and other uses. Moreover, the Shannon diversity indices were sensitive to the existence of rare LU types. Accordingly, diversity exhibited an uptrend. In addition, our results indicated that the landscape diversity indices changed notably within the 800 m buffer zone, buffer zone, while beyond it, the trends of the indices tended to be stable. It can be inferred that within a certain range, there was greater diversity variation closer to roads.
In every period shown in
Figure 4, the PD displayed an extreme difference. During 1995–2000, the PD value increased gradually, while after 2000, it was only within the 400 m buffer zone and then declined quickly beyond this threshold. Such results displayed apparent discrepancies in distance and time series. For the first period, government capital and social capital were successively input to speed up the process of highway construction, thereby leading to the landscape around the rapidly developing routes being divided into several partitions. Since then, reasonable urban planning has attracted more attention, and thus, the scattered landscape along the line has been continuously merged. Moreover, the change tendency of the PD in
Figure 5,
Figure 6 and
Figure 7 was similar to that in
Figure 4. All these results revealed that the impacts of roads in diverse stages were in close closely associated with national policies.
Synthetically analyzing
Figure 4,
Figure 5,
Figure 6 and
Figure 7, we found that, compared with the provincial roads and railways, the change rate of highways and national roads on the PD value was more extreme. The national roads and railways showed greater influences on the SHDI than the other two routes. In addition, considering the threshold, the impacts were strongest at distances of 600 m for highways, 800 m for provincial roads, and1000 m for national roads and railways. This result indicated that the spatial range needed to quantify the impact of roads was wider for railways and national roads than for highways and provincial roads. In summary, distance, time, and route types constituted the factors influencing the changes in landscape patterns.
4.3. Analysis of the Impact of Transportation Networks on Landscape
At present, a dense road network has been built in the urban area of Shanghai. When building a road network in suburban areas in the future, it is necessary to consider the connectivity of surrounding cultivated land, forest land, wetlands, and grasslands. Because the fragmentation of cultivated land will make it impossible to mechanize the management of the cultivated land, which will reduce the planting efficiency, and the fragmentation of forest land, wetlands, and grassland will lead to the reduction of biodiversity, which is not conducive to ecological environment protection. This is basically consistent with previous studies. Mo et al. found that the expansion of the urban road network will directly lead to the decrease in the landscape dominance of cultivated land, forest land, wetland, and grassland around the road and the increase in the degree of landscape fragmentation, which further leads to the decrease in landscape ecological diversity. The connection is even more alienated and even increases the ecological risk in the urban center [
29]. In addition, the expansion of urban road networks also has significant impacts on abiotic ecosystems such as air, water, and temperature [
30]. Therefore, rational planning of road construction is a necessary means to protect the ecological environment.
5. Conclusions
According to the data, national roads and highways had a greater impact on the landscape patch density (PD) index values, while national roads and railways had a more pronounced impact on landscape diversity. In general, national roads have a wider spatial extent than that of highways and provincial roads, and this affects their impact on landscape diversity. In the future, in the process of road network construction, we will make the land use density, structure, housing, and vegetation along the urban traffic trunk lines more reasonable and further strive to build an ecological traffic network system.
To promote the healthy development of the city, we have the following three suggestions:
- (1)
Government policymakers should implement the “green transportation” plan promoted by the state and continuously promote the “integration” of the urban transportation system and urban land use development.
- (2)
Road designers should consider that the road network has a great impact on the local ecological environment. Reasonable selection of roads and proper planning of road engineering paths can reduce the impact of roads on landscape fragmentation and landscape diversity.
- (3)
Road construction enterprises should implement the “green transportation” plan implemented by the state, conduct a detailed analysis and evaluation of the ecological environment around the road construction, and minimize the damage of road construction to the local ecosystem.
The changes in the two periods from 1995 to 2000 and 2005 to 2010 were more obvious than those from 2000 to 2005, mainly due to the more drastic landscape changes at the beginning of the road construction. With the development over time, artificial planning has had a certain influence on landscape change. This suggests that in a rapidly urbanizing area such as Shanghai, the impact of road construction on the changing landscape pattern in the surrounding area is continuous and temporally variable. Within the road buffer zone, landscape diversity can be used to represent fragmentation, connectivity, and dispersion.
The construction of roads in large urban areas has a nonnegligible impact on their surrounding ecology. The feedback cycle of ecosystems regulates the construction of landscape structures and the uptake, release, and storage of materials. Therefore, high landscape diversity is promoted in most cases to sustain multiple species. However, the positive correlation between diversity and traffic roads does not imply that road construction benefits species management. From this perspective, future researchers can explore the reasons for the positive correlation between biodiversity and traffic roads.
Although this study shows that the changes in Shanghai’s traffic network have a profound impact on the urban landscape pattern, and reasonable planning of the construction of the urban traffic network can improve the urban landscape pattern, there are also some limitations. First, due to the influence of data, this paper only analyzes the changes in the Shanghai traffic network landscape pattern from 1995 to 2010 and does not conduct a more in-depth study on the data in recent years. In addition, only the Shanghai traffic network data in 2010 is used as the absolute reference for the other three periods, which will also interfere with the experimental results of this paper to a certain extent. In the future, we will make a fuller analysis based on the data in recent years. Second, this paper does not consider the ecological significance of the landscape pattern index further. In the research process, only the landscape pattern index of the traffic network was considered, without considering the impact of other specific factors in the research field, and no more in-depth research was conducted based on the graph theory results of network accessibility and connectivity. In the future, more novel methods will be used to analyze more comprehensively the factors that affect the change in urban landscape patterns, such as the distribution of settlements and buildings. Third, this paper focuses on China’s urban expansion, transportation network, land use change, and its consequences, without more discussion on other developing countries. In the future, we will give more consideration to the impact of urbanization development in other developing countries on the landscape pattern to find common laws in the process of urbanization development in developing countries.
Author Contributions
Conceptualization, X.C. and R.X.; methodology, X.H.; software, X.J.; validation, X.C., R.X. and X.H.; formal analysis, X.C.; investigation, X.H.; resources, X.J.; data curation, X.C.; writing—original draft preparation, X.C. and X.H.; writing—review and editing, R.X.; visualization, X.H.; supervision, R.X.; project administration, X.J.; funding acquisition, X.C. and R.X. All authors have read and agreed to the published version of the manuscript.
Funding
This research was funded by the National Natural Science Foundation of China, grant number 41701527 and the Postdoctoral Starting Foundation of Hubei University of Technology, grant number BSQD2020053.
Data Availability Statement
Not applicable.
Conflicts of Interest
The authors declare no conflict of interest.
References
- Liu, W.L.; Oosterveer, P.; Spaargaren, G. Promoting sustainable consumption in China: A conceptual framework and research review. J. Clean. Produc. 2016, 134, 13–21. [Google Scholar] [CrossRef]
- Huang, L.C.; Gu, X. Roads and their major ecological effects. Annu. Rev. Ecol. Syst. 1998, 29, 207–231. [Google Scholar] [CrossRef]
- Downs, J.; Horner, M. Enhancing habitat connectivity in fragmented landscapes: Spatial modeling of wildlife crossing structures in transportation networks. Ann. Assoc. Am. Georaphers 2012, 102, 17–34. [Google Scholar] [CrossRef]
- Kanu, M.O.; Basavaiah, N.; Meludu, O.C.; Oniku, A.S. Investigating the potential of using environmental magnetism techniques as pollution proxy in urban road deposited sediment. Int. J. Environ. Sci. Technol. 2017, 14, 2745–2758. [Google Scholar] [CrossRef]
- Holderegger, R.; Di, G.M. The genetic effects of roads: A review of empirical evidence. Basic Appl. Ecol. 2010, 11, 522–531. [Google Scholar] [CrossRef]
- Wu, D.J.; Zhan, S.Z.; Li, Y.H.; Tu, M.Z.; Zheng, J.Y.; Guo, Y.Y.; Peng, H.Y. New trends and practical research on sponge cities with Chinese characteristics. China Soft Sci. 2016, 1, 79–97. [Google Scholar]
- Cumming, G.; Epstein, G. Landscape sustainability and the landscape ecology of institutions. Landsc. Ecol. 2020, 35, 2163–2638. [Google Scholar] [CrossRef]
- Asaad, I.; Lundquist, C.J.; Erdmann, M.V.; Costello, M.J. Ecological criteria to identify areas for biodiversity conservation. Biol. Conserv. 2017, 213, 309–316. [Google Scholar] [CrossRef]
- Peterson, G.; Allen, C.R.; Holling, C.S. Ecological resilience, biodiversity, and scale. Ecosystems 1998, 1, 6–18. [Google Scholar] [CrossRef]
- Yue, T.X.; Li, Q.Q. Relationship between species diversity and ecotope diversity. Ecol. Complex. Sustain. 2010, 1195, E40–E51. [Google Scholar] [CrossRef]
- Elmqvist, T.; Folke, C.; Nyström, M.; Peterson, G.; Bengtsson, J.; Walker, B.; Norberg, J. Response diversity, ecosystem change, and resilience. Front. Ecol. Environ. 2003, 1, 488–494. [Google Scholar] [CrossRef]
- Peng, J.; Tian, L.; Liu, Y.; Zhao, M.; Wu, J. Ecosystem services response to urbanization in metropolitan areas: Thresholds identification. Sci. Total Environ. 2018, 607, 706–714. [Google Scholar] [CrossRef] [PubMed]
- Geneletti, D.; Beinat, E.; Chung, C.F.; Fabbri, A.G.; Scholten, H.J. Accounting for uncertainty factors in biodiversity impact assessment: Lessons from a case study. Environ. Impact Assess. Rev. 2003, 23, 471–487. [Google Scholar] [CrossRef]
- Geneletti, D. Using spatial indicators and value functions to assess ecosystem fragmentation caused by linear infrastructures. Int. J. Appl. Earth Obs. Geoinf. 2004, 5, 1–15. [Google Scholar] [CrossRef]
- Trombulak, S.C.; Frissell, C.A. Review of ecological effects of roads on terrestrial and aquatic communities. Conserv. Biol. 2000, 14, 18–30. [Google Scholar] [CrossRef]
- Arif, M.; Gupta, K. Application of graph-based model for the quantification of transport network in peri-urban interface of Burdwan City, India. Spat. Inf. Res. 2020, 28, 447–457. [Google Scholar] [CrossRef]
- Arif, M.; Gupta, K. Spatial development planning in peri-urban space of Burdwan City, West Bengal, India: Statutory infrastructure as mediating factors. SN Appl. Sci. 2020, 2, 1779. [Google Scholar] [CrossRef]
- Anderson, J.R.; Hardy, E.E.; Roach, J.T.; Witmer, R.E. A Land Use and Land Cover Classification System for Use with Remote Sensor Data; US Geological Survey Professional Paper 964; US Government Printing Office: Washington, DC, USA, 1976.
- Fang, C.; Li, G.; Wang, S. Changing and differentiated urban landscape in China: Spatio-temporal patterns and driving forces. Environ. Sci. Technol. 2016, 50, 2217–2227. [Google Scholar] [CrossRef]
- Turner, M.G.; Gardner, R.H.; O’neill, R.V. Landscape Ecology in Theory and Practice; Springer: New York, NY, USA, 2001. [Google Scholar]
- Peng, J.; Wang, Y.; Zhang, Y.; Wu, J.; Li, W.; Li, Y. Evaluating the effectiveness of landscape metrics in quantifying spatial patterns. Ecol. Indic. 2010, 10, 217–223. [Google Scholar] [CrossRef]
- Su, C.; Fu, B.; Lu, Y.; Lu, N.; Zeng, Y.; He, A.; Lamparski, H. Land use change and anthropogenic driving forces: A case study in Yanhe River Basin. Chin. Geogr. Sci. 2011, 21, 287–599. [Google Scholar] [CrossRef]
- Liu, S.L.; Cui, B.S.; Dong, S.K.; Yang, Z.F.; Yang, M.; Holt, K. Evaluating the influence of road networks on landscape and regional ecological risk—A case study in Lancang River Valley of Southwest China. Ecol. Eng. 2008, 34, 91–99. [Google Scholar] [CrossRef]
- Porter-Bolland, L.; Ellis, E.A.; Gholz, H.L. Land use dynamics and landscape history in La Montana, Campeche, Mexico. Landsc. Urban Plan. 2007, 82, 198–207. [Google Scholar] [CrossRef]
- Liu, X.H.; Li, J.H. Scientific solutions for the functional zoning of nature reserves in China. Ecol. Model. 2008, 215, 237–246. [Google Scholar] [CrossRef]
- Su, S.; Xiao, R.; Xu, X.; Zhang, Z.; Mi, X.; Wu, J. Multi-scale spatial determinants of dissolved oxygen and nutrients in Qiantang River, China. Reg. Environ. Chang. 2013, 13, 77–89. [Google Scholar] [CrossRef]
- Xiao, D.N. Natural resources and regional exploitation in the Liaohe River Delta. J. Nat. Resour. 1994, 9, 43–50. [Google Scholar] [CrossRef]
- Forman, R.T.; Hersperger, A.M. Adjacency arrangement effects on plant diversity and composition in woodland patches. Oikos 2003, 101, 279–290. [Google Scholar] [CrossRef]
- Mo, W.; Wang, Y.; Zhang, Y.; Zhuang, D. Impacts of road network expansion on landscape ecological risk in a megacity, China: A case study of Beijing. Sci. Total Environ. 2017, 574, 1000–1011. [Google Scholar] [CrossRef]
- Forman, R.T.T.; Sperling, D.; Bissonette, J.A.; Clevenger, A.P.; Cutshall, C.D.; Dale, V.H.; Fahrig, L.; France, R.; Goldman, C.R.; Heanue, K.; et al. Road Ecology: Science and Solutions; Island Press: Washington, DC, USA, 2003. [Google Scholar]
| Publisher’s Note: MDPI stays neutral with regard to jurisdictional claims in published maps and institutional affiliations. |
© 2022 by the authors. Licensee MDPI, Basel, Switzerland. This article is an open access article distributed under the terms and conditions of the Creative Commons Attribution (CC BY) license (https://creativecommons.org/licenses/by/4.0/).


