

Combined Use of GPR and Other NDTs for Road Pavement Assessment: An Overview
by
 , , and
Ahmed Elseicy
1,*,
Alex Alonso-Díaz
1,
Mercedes Solla
1,
Mezgeen Rasol
2 and
and
Sonia Santos-Assunçao
3 1
CINTECX, GeoTECH Research Group, Universidade de Vigo, 36310 Vigo, Spain
2
The Urban and Civil Engineering Testing and Modeling Laboratory (EMGCU), Department of Materials and Structures (MAST), Université Gustave Eiffel, 5 Boulevard Descartes, CEDEX 2, 77454 Marne-la-Valee, France
3
Department of Land Surveying and Geo-Informatics, The Hong Kong Polytechnic University, Block Z, Phase 8, 181 Chatham Road South, Hung Hom, Kowloon, Hong Kong 999077, China
*
Author to whom correspondence should be addressed.
Remote Sens. 2022, 14(17), 4336; https://0-doi-org.brum.beds.ac.uk/10.3390/rs14174336
Submission received: 20 July 2022
/
Revised: 10 August 2022
/
Accepted: 29 August 2022
/
Published: 1 September 2022
(This article belongs to the Special Issue Review of Application Areas of GPR)
Abstract
:Roads are the main transportation system in any country and, therefore, must be maintained in good physical condition to provide a safe and seamless flow to transport people and goods. However, road pavements are subjected to various defects because of construction errors, aging, environmental conditions, changing traffic load, and poor maintenance. Regular inspections are therefore recommended to ensure serviceability and minimize maintenance costs. Ground-penetrating radar (GPR) is a non-destructive testing (NDT) technique widely used to inspect the subsurface condition of road pavements. Furthermore, the integral use of NDTs has received more attention in recent years since it provides a more comprehensive and reliable assessment of the road network. Accordingly, GPR has been integrated with complementary NDTs to extend its capabilities and to detect potential pavement surface and subsurface distresses and features. In this paper, the non-destructive methods commonly combined with GPR to monitor both flexible and rigid pavements are briefly described. In addition, published work combining GPR with other NDT methods is reviewed, emphasizing the main findings and limitations of the most practical combination methods. Further, challenges, trends, and future perspectives of the reviewed combination works are highlighted, including the use of intelligent data analysis.

1. Introduction
Urbanization and reliable connection between cities are crucial for creating significant progress in construction activities—particularly in the road transportation system, which can directly contribute to economic growth and improve societal challenges. In the framework of transport infrastructures, road pavements are a critical transportation component that can facilitate daily transport activities for goods and people in a reliable condition [1,2]. For these reasons, providing a robust and safe road pavement is essential for global and regional continuous development. In addition to frequent assessment and monitoring of road pavements, performance status is fundamental in order to accomplish a better sustainable transportation system [3].
In the past, the most common methods and assessment techniques for pavement evaluation were carried out by destructive inspection supplemented by visual inspection by road engineers and/or road experts.
The use of destructive techniques (DT) such as core sampling is damaging to the structural integrity of the pavement and is time-consuming; further, a large amount of labor work is required to obtain necessary pavement information [4].
However, the use of non-destructive testing (NDT) techniques for the assessment of road pavements has potential in the modern industry’s evolution toward smart sustainable transport infrastructures. NDTs can provide valuable information and accurate profiles from road pavements. Among various NDTs, ground-penetrating radar (GPR) is considered among the most efficient, easy to use, least traffic-disruptive, and multi-application NDT in road transport infrastructure, and civil engineering applications [5,6]. The limitations of each NDT used in the pavement evaluation, the physical properties of the subsurface media, and the environmental conditions during the NDT survey or GPR data collection, in particular, will affect the data-driven investigation in the field.
The lack of a single wide-ranging technique for pavement evaluation, assessment, and comprehensive documentation is another major challenge that demonstrates that combining various non-destructive testing methods with GPR could be a substantial approach to obtaining diverse and extensive pavement information [2].
It could lead to a better understanding of the actual performance status of the road structures and damage inspection. In addition, the detection range is different for individual NDTs. Therefore, integrating GPR results with other possible NDTs could increase the probability of detecting the buried target or damages associated with road pavements. Furthermore, the combination of different NDTs with GPR can be an efficient approach to illustrate the potential defects and features in the inner substructure and outer super-structure of road pavements [7].
In this paper, a critical review of GPR combined with several other NDTs (e.g., visible and thermal imaging, Light Detection and Ranging (LiDAR), covermeter, deflectometers, Schmidt hammer, the Seismic passive method, and ultrasonic pulse-echo) is discussed to provide a systematic recommendation to overcome current challenges in the field of road pavement assessment. Figure 1 shows the main contributions of this study. In order to maximize the benefit obtained through the combined use of GPR with other NDTs, different road pavement damages that normally occur are addressed herein, from superficial distresses to internal failure and subgrade dysfunctionality. What is more, for a more complete analysis, both flexible and rigid pavements are considered, covering all types of roads based on function (e.g., highways, runways, and urban and rural roads). Hence, through the review of the published literature, the main benefits and limitations of each individual method are presented, providing the most interesting combinations and some practical recommendations.
This article is structured as follows: Section 2 introduces the most frequent distresses in flexible and rigid pavements. Then, Section 3 briefly describes the NDT techniques frequently used in combination with GPR to monitor pavements, mentioning their principles and their main applications or findings. After that, Section 4 illustrates the review methodology and selection process, while Section 5 presents the most relevant works in the literature dealing with the combined application of GPR and other NDTs for road pavement monitoring by considering the methodology and the criteria described in Section 4. Finally, Section 6 shows the most interesting NDT combinations addressed in this article in addition to the conclusion and final remarks.
2. Types of Pavements and Most Frequent Distresses
Pavements are categorized into two groups, flexible and rigid pavements. Flexible pavements consist of a mixture of asphaltic or bituminous material and aggregates structured in successive layers of granular material over the subgrade (existing or natural soil). The design of flexible pavements depends on the magnitude and intensity of the loads transmitted downwards from the road surface to the subgrade (load distribution). A flexible pavement typically consists of (i) a surface course, (ii) a binder course, (iii) a base course, (iv) a subbase course and (v) a subgrade. Conversely, rigid pavements are generally composed of (i) a PCC (Portland Cement Concrete) surface course, (ii) a base course, (iii) a subbase course, and (iv) a subgrade. In the design of rigid pavements, the major factor is the flexural strength of the concrete slab to resist traffic loads. This concrete slab usually has reinforcing steel to eliminate or reduce joints.
Failures and instability in any of the pavement layers will result in different types of structural distresses in the pavement system, both superficial and internal. Following the ASTM D6433–20, the most typical of these structural distresses are:
2.1. Superficial Distresses
2.1.1. Flexible Pavements
- Deformation
- Rutting: Grooves and surface depression in the wheel path may be caused by insufficient pavement thickness, weak asphalt mixtures, a lack of compaction, instability of the base surface or heavy traffic.
- Depressions: A depression (also called a bird- bath) is a localized displacement or low spot, with limited size, on the pavement surface. It results from a settlement of the subgrade or the result of improper compaction during construction.
- Swelling: An upward bulge in the surface layer is typically accompanied by surface cracking. It is generally caused by swelling of the subgrade or frost heave.
- Shoving and corrugation: A form of plastic movement in the surface layer that creates a localized bulging of the pavement typified by waves (shoving) or transverse ripples (corrugation). They are usually caused by traffic action (accelerations and decelerations points) combined with other pavement failures such as too soft asphalt, too much fine aggregate, rounded or coarse aggregate, poor bond between layers or too much, as well as a weak granular base or excessive moisture in the subgrade.
- Bumps and sags: Bumps are small localized upward displacements of the pavement surface, while sags are small, localized settlements of the road surface. Several factors can cause bumping in flexible pavements, such as frost heaves (due to expansion), plant roots growing under the pavement or tenting at cracks and joints.
- Cracking
- Longitudinal cracking: Cracks are predominantly parallel to the centerline or lateral. They are usually caused by differential volume changes in the subgrade, shrinkage due to temperature fluctuations, reflection at joints or poor construction of the longitudinal joint in the pavement surface or between two bands of bituminous mixtures.
- Transverse cracking: Cracks that extend perpendicular to the centerline or laydown direction of the road. Usually, this type of cracking is caused by shrinkage due to temperature changes and reflection of a crack or joint in an underlying pavement layer.
- Fatigue cracking (alligator, map or crocodile cracking): Series of interconnected cracks resembling the crocodile skin, with pieces generally less than 0.5 m on the longest side. This distress occurs only in areas subjected to repeated traffic loading or an increase in loading (e.g., wheel paths) together with a lack of bearing capacity or thickness, inadequate compaction, poor drainage or loss of base or subgrade support.
- Block cracking: Series of interconnected cracks that form in a roughly rectangular pattern with blocks ranging in size from 0.3 to 3 m. These cracks are generally due to asphalt binder aging or poor quality, the reflection of cracks in an underlying pavement layer, and shrinkage of the asphalt binder. Unlike fatigue cracking, block cracking is not load associated and occurs over a large portion of the pavement area.
- Slippage cracking: Sliding cracks that look similar to a crescent or a half-moon. This is typically caused by poor bonds between layers and accelerates in pavement areas under high stress, such as vehicle acceleration/deceleration.
- Edge cracking: Cracks located within 0.3 to 0.5 m of the outer edge of the pavement. This distress is typically due to fatigue or deformation of the pavement surface caused by passing heavy vehicles or a surface course excessively rigid compared to the underlying layers.
- Reflection cracking: Cracks that form in an overlay of a deteriorated asphalt pavement. This distress may be caused by the shifting or movement of the underlying old pavement.
- Disintegration
- Raveling and weathering: They are the disintegration of the pavement surface because of the dislodgement of aggregate particles. These distresses indicate an aging or hardening binder, aggregate segregation, and a lack of compaction. Raveling may also be caused by certain types of vehicles such as tracked vehicles and studded tires.
- Potholes: Localized disintegration of the pavement surface in the form of small bowl-shaped holes (usually less than 750 mm in diameter). Typically produced by the continued deterioration of another type of distress, such as fatigue cracking, raveling or failed patching. Continuous traffic together with insufficient pavement thickness and insufficient drainage stimulate pothole formation.
- Polished aggregates: Areas of pavement where the surface aggregates wear down to a smooth texture (there are no rough or angular aggregate particles). This defect may be reflected in a reduction in skid resistance or surface friction, and it is normally due to repeated traffic actions, especially if the aggregate is susceptible to abrasion.
- Patching: The result of repairing localized pavement defects (e.g., filling potholes or other pavement disintegration) or road works (e.g., piping). It is considered a defect because, when pavements are patched, some distress may begin to occur, influenced by compaction and the quality of the surrounding or underlying layers.
- Bleeding
A film of bituminous material on the road surface. Bleeding is caused by excessive asphalt binder or a very low-viscosity binder, insufficient air void content or hot weather. Bleeding is an irreversible process that does not withdraw in winter and increases with time.
2.1.2. Rigid Pavements
- Deformation
- Faulting: This is a difference in elevation between the joints mainly caused by settlement due to a weak foundation or pumping of subbase fine materials due to traffic loading. Additionally, changes in weather conditions and moisture cause curling or wrapping of the slab edges.
- Cracking
- Longitudinal cracking: Cracks along the slab in the direction of the traffic, mainly caused by traffic, thermal or moisture fatigue, but also by an inappropriate distribution of joints. These cracks can evolve into map or slab cracking.
- Durability cracking: Series of closely spaced cracks near a joint, crack, or free edge (corner), caused by freeze–thaw expansion that breaks concrete. Its evolution can generate spalling and disintegration.
- Transverse cracks: Cracks are predominantly perpendicular to the road axis, mainly motivated by a thermal gradient, poor thickness of the slab or inappropriate joints distribution. As longitudinal cracks, these cracks can evolve into map or slab cracking.
- Map cracking or crazing: A series of upper surface cracks, where longitudinal ones are larger, and the transverse ones interconnect them. Usually results from improper curing and/or finishing of the concrete, poor thickness, alkali–silica reactivity, or traffic fatigue. This failure can lead to scaling of the surface.
- Joint-related deficiencies
- Joint spalling: A break in the edge of pavement within 50–60 cm of transverse and longitudinal joints. This does not usually extend vertically through the pavement but at an angle through the joint. Joint spalling is mainly due to infiltration of incompressible materials or weaknesses in the concrete at the joint combined with excessive stresses in the joint caused by traffic loads. Additionally, water accumulation in pavement joints can cause spalling due to freeze–thaw action.
- Pumping: This is the draining of subsurface water and subbase fine materials from the pavement foundation through joints or cracks. This is caused by the deflection of the slab under repeated moving loads. Pumping near the joint is caused by poor sealing and causes voids and a loss of support, and it will eventually lead to cracking or settling and faulting.
- Disintegration
- Popouts: Loss of aggregates from the surface, ranging from 25 to 100 mm in diameter, leaving small divots or pock marks. Usually caused by poor mixture or poor aggregate durability and overloads.
- Blow-ups or buckling: Upward slab movement and buckling or shattering that occurs usually at a joint or transverse crack. This distress can be accelerated by joint spalling, durability cracks and freeze–thaw expansion.
- Polished aggregates: Areas of pavement where the mortar or aggregate extending above the asphalt binder wear down to a smooth texture (there are no rough or angular aggregate particles). The causes are aggregates with poor abrasion resistance, traffic fatigue or improper curing.
- Scaling: Deterioration of the surface course or wearing surface. Caused by improper curing or finishing (too much mortar or faulty sand) and freeze–thaw expansion.
- Patching: Portion of or whole slab replaced by new material (sometimes asphalt concrete) to repair localized pavement defects.
2.2. Internal Failures
2.2.1. Layer Thickness Deficiency
Layer thickness is a vital factor defining the quality of pavements [8]. This parameter is standardized and depends on (i) the type of flexible asphalt, (ii) its position and function in the pavement—variable for each layer composing the pavement structure, and (iii) the traffic loads and the subgrade category of the road. Thickness deficiencies reduce the bearing capacity and lifecycle of pavements. Thickness deficiencies in the surface course may cause cracks or rutting. For rigid pavements, and more particularly for reinforced slabs, there is also a minimum required cover depth aiming to prevent delamination and corrosion, which mainly depends on environmental conditions.
2.2.2. Moisture and Saturated Media
Moisture content is among the main factors that influence pavement performance. Increasing moisture content leads to reduced strength and durability of pavements [9]. Asphalt pavements are subject to moisture-related distresses due to the loss of bond between the bitumen and aggregate surface or the subgrade layers [10]. Defects such as stripping and raveling develop as early-stage effects. Additionally, worse effects such as potholes can expand in later stages under traffic load and environmental changes [11]. Spalling or pumping can occur in rigid pavements when water enters the pavement subgrade through cracks or unsealed joints. Pavement settlement and severe cracking can develop over time under traffic loads if the pavement is not maintained regularly [12]. It is important to also mention that the bearing capacity of the pavement is reduced when soil is saturated.
2.2.3. Non-Compaction and Porosity Changes
Subgrade compaction is essential to achieve optimum density and moisture content that enables the subgrade base to support the load from the pavement structure without having permanent deformation [13]. Poorly compacted subgrades will reduce overall base bearing capacity which leads to deformations such as rutting and settlements. In addition, the subgrade will be more vulnerable to moisture and freeze–thaw changes. Subgrade deformations can reflect on pavement surfaces and cause alligator cracking, pumping, and raveling. On the other hand, porous asphalt pavement usually has an uncompacted subgrade to increase infiltration rates [14]. An overlay of non-woven geotextiles is used to allow water infiltration and prevent the migration of fine particles from the subgrade into top layers.
2.2.4. Debonding
Subsurface interlayer debonding occurs when adjacent asphalt layers lose adhesion to one another and can become separated [15]. Water infiltration through cracks and areas of low mixture density accelerate the deterioration of the asphalt interface or interface bond breakdown [16]. Moreover, debonding can be caused by inadequate tack coat during construction or dirty surfaces. This failure can lead to other superficial distress such as deformation and cracking.
2.2.5. Settlement and Sinkholes/Voids
Settlement is among the most dangerous causes of degradation on pavements [17]. There are many causes of this type of problem, such as poor soil compaction, non-homogeneous consolidation, saturated soils, and weak load-bearing capacity of soils, which seriously affect the conditions and mechanical behavior of the subgrade and foundation soils. When subsidence occurs, cracks, fractures, and potholes can appear on the pavement surface [18].
Generally, the appearance of superficial distresses favors the ingress of water in pavement causing the washing of soil materials. Moreover, alternate wetting and drying causes swelling and shrinkage in some clays, whereas freezing and thawing can weaken sandy silts. When soils shift or are washed away, severe damage can occur such as sinkholes and devastating failures under traffic. Other subsoil alterations such as inadequate drainage or a higher water table can induce sinkhole phenomena. Sinkhole formation could be detectable from the surface due to ground depressions, but the pavement may appear to be intact although not be structurally sufficient to support traffic in many cases.
2.2.6. Corrosion
Corrosion is among the main pathologies which affect the resistance of reinforcement concrete in rigid pavements or composite pavements, in particular in extreme environmental conditions such as nearby seaside or cold regions. Corrosion occurs as a consequence of the deterioration in reinforcement concrete due to different physicochemical and mechanical actions over time [19,20]. In addition, the existence of moisture and oxygen can influence the concrete, steel, and steel-concrete interface to produce corrosion phenomena [21]. This can lead to several damages in the cement concrete pavements, for example, crack propagation, fractures, delamination, reduced durability and stiffness of the pavement structure, and, in some extreme situations, the advance and severe degradation interacts with other factors such as heavy traffic loads on the internal structure and could lead to potholes.
2.2.7. Delamination
Delamination in rigid pavements is a phenomenon that can contribute to pavement surface distresses. This is the detachment of the past layer at the surface from the slab. The main cause of delamination in rigid pavements is improper curing or finishing (presence of a thin layer of air or water causing the separation), freezing or moisture, traffic loading and the corroded steel mesh near the surface [22,23,24,25].
The pictures in Figure 2 give some insights of superficial distresses in both flexible (a to h) and rigid pavements (i to l): (a) slippage, (b) potholes, (c) alligator cracking, (d) bumping, (e) bleeding and raveling, (f) patching, (g) block cracking, (h) longitudinal cracking, (i) patching and durability cracking, (j) map cracking, (k) depressions or surface settlement, and (l) corrosion.
3. Non-Destructive Testing Commonly Used on Pavement Assessment
This section provides a brief description of the NDT techniques frequently used in monitoring both flexible and rigid pavements, mentioning their basic principles and their main applications or findings as an independent test. The structure of this section is arranged from remote to contact, from flexible to rigid pavements.
3.1. Interferometric Synthetic Aperture Radar
Interferometric Synthetic Aperture Radar (InSAR) is a non-destructive technique that has been in progress since the 1990s. InSAR is a non-contact test that uses active remote sensing technology (SAR). InSAR emits spectrum waves (microwaves) over a line of sight (LOS) and collects their echoes to obtain two-dimensional high-resolution images through the phase difference [26]. The equipment can be mounted on satellites or Unmanned Aerial Vehicles (UAV).
Interferometry between the images obtained over time allows for obtaining Digital Elevation Models (DEM) that show the topographic evolution of the object’s study [27]. There are many techniques to obtain DEMs, each dedicated to its applications. In the case of pavements, multipass InSAR techniques such as PSI (Permanent Scatterer Interferometry), SBAS (Small Baseline Aperture System), SqueeSAR, and the mixture of PSI and SBAS (SMPS) are the most used [28,29].
The main application of the InSAR method for pavement assessment is to detect the deviations in terrain levels [26], which are mainly associated with failures such as subsidence [30], corrugation, bumps, rutting, and shoving.
At a network level, InSAR has been used to monitor not only pavement transport infrastructures such as railways [31], bridges [32], highways [33], tunnels [34], and airports [35] but also urban environments [36].
InSAR is used to detect the terrain displacement with a millimetric resolution, but it cannot indicate the related subsurface causes. Hence, it usually used as a complementary tool with other NDT techniques [33], such as GPR [36,37], LiDAR [38], infrared thermography (IRT) [39], seismic reflection [30], seismic (MRS) tomography [40], and electrical resistivity tomography (ERT) [41].
3.2. Imaging Techniques
3.2.1. Spectral Imaging
Spectral imaging comprises multiple bands across the electromagnetic spectrum as it captures simultaneous data in the infrared, the visible spectrum, the ultraviolet, and the X-ray ranges. Spectral imaging includes multispectral (MSI) and hyperspectral (HSI) imaging. Multispectral cameras typically capture from 2 to 20 bands, while hyperspectral cameras capture hundreds, or thousands of bands, assuming a continuous spectrum or spectral signature of the object of analysis and creating the named hypercube of wavelength from 350 to 2500 nm [42]. Hyperspectral imaging has more capability and a better resolution than multispectral imaging. Nevertheless, it adds more complexity since it works with parallel information, pixel alignment, or a larger dataset [43].
Both MSI and HSI have been used in pavement assessment [44]. The devices used to monitor pavements can be mounted on vehicles, UAVs or satellites [45].
Regarding superficial pavement distresses, spectral imaging can detect:
Through superficial distresses such as cracks and potholes, the internal material of the pavement becomes visible. It has been demonstrated that inner layers (characterized by metal oxides) produce different reflection behavior than superficial layers (characterized by hydrocarbons). Thus, the difference in chemical composition allows for identifying the occurrence of these types of defects [50].
3.2.2. Visible Imaging
Visible imaging detects the three wavelength bands of the electromagnetic spectrum or the visible spectrum (400–700 nm): red, green and blue (typically called RGB imaging). The RGB camera can operate mounted on an UAV or in a vehicle. However, the operation mode influences the accuracy and reliability of the data. A resolution less than 0.2 mm can be achieved when operating with the camera mounted in a vehicle and close to the road surface, although costly [54]. Conversely, the resolution is not less than 7 mm if mounted on UAVs. Moreover, data quality is influenced by other conditioning factors such as proper illumination and atmospheric conditions (e.g., fog, heat, and sandstorms) [44].
The information obtained are RGB images and videos that have been used to monitor, most frequently combined with learning techniques for automatic detection. According to the published literature [44,54,55], the main pavement distresses that can be detected are:
- Potholes,
- Cracks,
- Bleeding, and
- Polished aggregates.
3.2.3. Infrared Thermography Imaging
Infrared thermography (IRT) is a non-destructive evaluation method (NDE) that is used for infrastructure condition assessment [59,60]. IRT is a non-contact test that does not require physical contact with the target object. The data can be collected using a camera mounted on a tripod, Unmanned Aerial Vehicles (UAVs), or on top of a vehicle. These advantages enable the inspections to be carried out rapidly and without affecting the traffic [61,62,63].
Infrared thermography helps to detect surface and near-surface damage and defects by detecting the emitted radiation in the infrared range of the electromagnetic spectrum. The defects are identified by capturing the thermal contrast of the inspected surfaces (Figure 3). IRT can be conducted by using two different approaches depending on the source of heat, active or passive [64]. In the active approach, an artificial heat/cooling source is used to add extra energy to the object of interest, and then the variation in the thermal signature of different locations is detected. The passive approach uses natural heat sources, such as solar heating, and radiation emitted from the object’s surface is collected.
The main applications of the IRT method for pavement assessment are:
A limitation of IRT is that it does not provide information about the depth of the defects, as it captures radiation from the surface. Therefore, it can be combined with other non-destructive methods such as GPR [68], Terrestrial Laser Scanning (TLS) [70], and ultrasonic tests [71] to improve the results [72,73].
3.3. Light Detection and Ranging
Light Detection and Ranging (LiDAR) is an emerging technology that is used in infrastructure condition assessment. It is an active remote sensing technology used to obtain an accurate 3D representation of surfaces and objects in the form of point clouds. LiDAR systems can be divided into three categories based on its platform type: airborne LiDAR systems (ALS), terrestrial LiDAR systems (TLS), and mobile LiDAR systems (MLS) [74].
Two methods are mainly used for range measurements of the LiDAR systems: time of flight and phase shift. Time-of-flight (TOF) systems estimate the distance between the scanner and the target object by measuring the time elapsed between the emitted and the reflected laser pulse, while phase shift systems emit a continuous signal, and its travel time can be estimated using the phase difference between the emitted and the reflected signal [54,74]. TOF systems are commonly used for commercially available mobile LiDAR systems, while phase shift systems are mostly used for terrestrial LiDAR systems [75].
Mobile LIDAR systems (MLS), also known as mobile laser scanning systems, become more popular in road surveys as they collect dense 3D point clouds with high accuracy at normal driving speeds and in a cost-effective way [74]. The point density of MLS data can be up to a few thousand points per square meter with centimeter-level point spacing. On the other hand, the point density of ALS data is usually less than 10 points per square meter and typical point spacing is 30–50 cm [54,76].
MLS integrates digital camera(s), an Inertial Measurement Unit (IMU), and a Global Navigation Satellite System (GNSS) into one system, which allows obtaining high-quality georeferenced point clouds in a productive way [77]. The point cloud data usually contain points with XYZ coordinates and intensity values. The RGB color information of data points can be added based on the digital camera in the system. The RGB attributes are useful to obtain more information about road defects or to identify textures of different materials. Figure 4 shows an example of using LiDAR data for the assessment of pathologies in pavements.
The main applications of the LiDAR systems for pavement assessment are:
- Rutting measurement [82], and
3.4. Profilometer
An Inertial Profiler (IP) or a Road Surface Profiler (RSP) is a non-destructive testing method that gives the IRI (International Roughness Index) and rut depth measurements (Figure 5) [86]. The IRI is an indicator for evaluating the quality of the pavement and for defining the characterization of pavement roughness in terms of vertical deviations [87]. On the other hand, rut depth is employed to characterize the pavement texture, which is normally categorized in four levels: (i) microtexture (<0.5 mm), (ii) macrotexture (0.5 mm–5 cm), (iii) megatexture (5–0.5 cm), and (iv) unevenness (>0.5 m). Different indices are used to describe those parameters, such as MPD (Mean Profile Depth), MTD (Mean Texture Depth), and RMS (Root Mean Square). For example, MPD is generally used to characterize macrotexture, while RMS is generally used to describe megatexture. Microtexture may be associated with superficial roughness.
The profilometer is usually mounted on a vehicle that must keep going along the road at a specific velocity to accomplish the standards [88]. The equipment consists of a laser-based profile measuring sensors conformed by [89]:
- Inertial unit (accelerometer) combined with the Quarter-Car System (QCS) and a laser height sensor to balance vertical vehicle motion.
- Distance Measuring Device (DMI) to measure the distance. For instance, an odometer or GPS.
- A system to collect and store the data.
This technique is mainly used in flexible pavements aiming to detect the following superficial distresses:
Roughness and texture measurements can be combined with different NDTs to improve the results. Some of these techniques are FWD [91,92], GPR [93], and skid resistance [94,95].
Apart from the IRI, a pavement management system (PMS) has other pavement condition indicators to evaluate pavement performance, such as the Pavement Condition Index (PCI), the Present Serviceability Index (PSI), the Pavement Structural Condition (PSC), the Pavement Quality Index (PQI) and the Skid Resistance Index (SRI). The PCI is the most practical indicator [96] because it considers the pavement distresses (type, severity, and extent) connected with the IRI [97]. Moreover, among the most crucial factors determining the pavement performance in terms of users’ safety is the level of friction of the surface course. In this regard, skid resistance is defined as the resistive force or friction developed to prevent a tire from sliding along the road surface [98]. A reduction in skid resistance allows for detecting superficial distresses such as polishing aggregates, raveling, and bleeding [99]. Furthermore, work by [100] has recommended the combination of FWD, GPR, the IRI, rut depth and skid resistance measurements to be part of any PMS.
3.5. Ground-Penetrating Radar
Ground-penetrating radar (GPR) is a most effective non-destructive technique (NDT) that is widely used in infrastructure condition assessment [5]. It is a geophysical technique that uses electromagnetic waves to detect objects in the shallow subsurface. GPR transmits electromagnetic waves into the survey medium, and then receives reflected signals from different layers and objects. The characteristics of the received signal depend on the shape, depth, and electromagnetic properties of the reflecting object [101,102].
GPR systems can explore up to a few meters into the ground through materials that are non-homogenous and can absorb radar signals. The frequency range that is commonly used in the civil engineering domain is 100 MHz–2 GHz [103]. For example, GPR systems with antennas in the 10–1000 MHz range are used to investigate road pavements, tunnel liners, and utilities on the meter scale [5], while antennas with a frequency between 900 MHz and 2.0 GHz are used to provide information in the top 0.3–1 m of the pavement [104]. The most typical GPR antennas can be air-coupled or ground-coupled antennas. The air-coupled antennas (from 1 to 2 GHz) are normally mounted on a mobile vehicle and suspended at a certain distance from the surface (from 0.5 to 0.6 m). Conversely, ground-coupled antennas (from 10 MHz to 2 GHz) normally operate in contact with the surface or suspended just above it (from 2 to 5 cm).
The major strength of GPR in infrastructure condition assessment is that it can collect data at driving speeds when using air-coupled antennas and represent the data reliably [103]. Moreover, the image resolution of the GPR system can be on a centimeter scale, depending on the system’s bandwidth. This scale of resolution corresponds well to the scale of mapping required for infrastructure assessment [5]. Figure 6 shows an example of GPR systems, and sample radargrams to detect underground pathologies in pavements.
The main applications of GPR for pavement assessment are:
GPR is used as stand-alone equipment to provide information about pavement condition. However, other NDT methods such as FWD [10], IRT [68,70], ERT [120] and seismic [121] can be combined with the GPR surveys so that the data obtained from different methods can complement each other. Section 5 presents a detailed compilation of selected published works dealing with the combination of GPR and other NDTs.
3.6. Deflectometers
The deflection-based measurement method is a non-destructive test widely used to assess pavement structural conditions. The Falling Weight Deflectometer (FWD) is the most effective and reliable NDT method for pavement deflection measurements worldwide [123]. The FWD simulates pavement responses under traffic load by applying an impulse load that consists of a weight dropped onto a damped spring system mounted on a loading plate. Then, the vertical deflection responses are measured by sensors placed around the load plate. The deflection sensors can be geophones or force–balance seismometers. Figure 7 shows an example scheme of an FWD.
The FWD has other variants developed for specific field test requirements: the light deflectometer (LWD) and the heavy deflectometer (HWD). The LWD is a lightweight and portable variant of the FWD, which is generally used to control the quality of unbound pavement layers as described by the ASTM E2583-07(2020) standard [124]. On the other hand, the HWD employs a heavier load than the FWD, and is used to evaluate the condition of thicker pavements found in airports and container terminals [125].
The FWD is widely used for bearing capacity evaluation [126]. The standard procedure for bearing capacity evaluation is to measure the deflection bowl resulting from a series of geophones located at different distances from the load. The elastic modulus of each layer can be estimated through a back calculation using the deflection values obtained in situ and knowing the thicknesses of the pavement layers [127]. The reliability of the estimated moduli depends on the accuracy of the layer thickness data. While coring is a destructive method of thickness measurements, the GPR method allows continuous assessment of layer thickness in a non-destructive way. Therefore, the combination of FWD and GPR tests improves the quality of pavement structural evaluation results [128].
The main applications of the FWD method for pavement assessment are:
As previously mentioned in Section 3.4 Profilometers, the FWD is widely combined with roughness and textural indicators such as IRI, rut depth and skid resistance measurements. There are also published works combining the FWD with GPR data, aiming to detect cracking and/or debonding [10], and fatigue stress calculation [137].
The FWD is an effective method for evaluation on the project level, but it has limitations when operating on the network level. The FWD is a stationary instrument that requires traffic blockage or lane closure. Therefore, it is not well suited for network-level assessment due to cost and traffic disruption [138]. As a result, deflection-measuring devices that operate at traffic speed, such as a Traffic Speed Deflectometer, a Rolling Weight Deflectometer, and a Rolling Dynamic Deflectometer, are more appropriate for network-level use [139,140,141].
3.7. Passive Seismic Interferometry
Seismic Passive Interferometry (PSI) is considered among the most widely used geophysical surveys for the engineering exploration of the ambient seismic records on the subsurface, by converting the cross-correlation of the recorded noise into a signal as a reflected seismic wave [142,143]. In another meaning, PSI is the detection of the low-frequency spectrum, mainly in the range (0–10 Hz) of the natural movements on the subsurface. Seismic PSI could provide continuous data acquisition on the seismic activities for a specific area. The principle of PSI is divided into two parts; the first part is striking a hammer or aluminum plate on the ground, and the second part is related to the recorded reflected seismic waves (amplitude) by geophones (sensors) at a specific time. This geophone is usually accelerometers or velocity transducers, which convert earth movements to a voltage (amplification magnitude of the ground) [144]. Figure 8 shows an example of a seismic passive test on a test site.
PSI has been used in many civil and geological engineering applications, and some of the main applications related to road inspection are:
Combination of PSI and GPR has been widely considered in different research studies, and results have demonstrated a good agreement for the investigation of shallow geology applications such as seismic microzonation [149].
3.8. Electrical Resistivity Tomography
Electrical resistivity tomography (ERT) has multiple and distinct areas of applications, from civil engineering to hydrology and geology, among others [150]. The technique allows greater penetration when compared with many other geophysical techniques. However, both vertical and horizontal resolutions, that is the ability to clearly identify the anomalies in terms of geometry, are very low. Therefore, this limitation is widely considered when operating to detect small and shallow cracks on the surface or at very shallow depths.
ERT is based on the emission of electrical current through current electrodes-metal poles-into the soil and this is the energy received in the potential electrodes. The methodology started with 1D Vertical Electrical Sounding (VES), but the 1D sounding survey is probably not sufficiently accurate due to lateral changes in the ground resistivity. The geometries of the 2D array are related to the type of application due to the different lateral and vertical resolutions, penetration depth, and signal-to-noise ratios (SNR) that characterize each technique [151]. The Wenner array (Figure 9), where the electrodes are placed at a distance a, generally provides high signal-to-noise ratios, a good resolution of horizontal layers, and good depth sensitivity [152]. The pole–pole array has the greatest depth of investigation. The difference in potential (ΔV) between two electrodes can be converted into the apparent resistivity (ρ); thus, considering a the distance between the electrodes and I the intensity of the current, the solution is given by the expression ΔV = Iρ/2πa. The (apparent) resistivity obtained is then related to the material type, where the electrical resistivity of air is infinite.
The most complex part of the ERT is that it normally requires the insertion of the metal electrodes into the medium. Therefore, in both concrete and asphalt, it is required to drill holes to introduce the electrodes and to achieve contact with the material. The pole needs to be inserted in a way so no space should exist between it and the surrounding medium. The air has very high electrical resistivity; therefore, a bad contact will not allow the electric current to be injected downwards. There are two types of electrode methods for electrical resistivity survey (ERS): the pole electrode method (PEM) and, the most recent one, the flat electrode method (FEM) (Figure 10).
Inversion algorithms are used to determine the true resistivity maps in either 2D or 3D as the apparent resistivity gives a pseudo image of the subsurface resistivity. During the inversion process, the available information on the subsurface structure and resistivity of the study area should be taken into account in order to build a satisfactory inversion model [153].
The asphalt is an electric insulator so the value of the electrical resistivity could not be measured. Park et al. [154] simulated four different cases: field ground with/without cavity and concrete pavement with/without a cavity. Results indicated that all existing cavities were encountered and well delineated in both cases independently of using the PEM and the FEM.
The main applications of the ERT method for road inspection are:
ERT is a great technique to assess the pavement condition, specially it can help to differentiate between cavities with air or water. However, due to the mentioned limitations, it is recommended to integrate with other geophysical or NDT techniques, such as: Very-Low Frequency Electromagnetic (VLF-EM) [155,156,159], gravity [160], magnetics [156], InSAR [161], and GPR [161,165].
Figure 11 illustrates the correlation between GPR and ERT data, showing contamination areas beneath a road surface.
3.9. Rebound Hammer
Comprehensive strength is the most considered parameter for the assessment of the in-site hardness of concrete material. The most widely used non-destructive technique as a complementary method in addition to the hardness method (core sampling) for the evaluation of the in situ concrete is the Sclerometer test (called Rebound or Schmidt hammer). The Sclerometer test procedure is standardized according to the normal condition for the in situ concrete [166]. The principal procedure of the rebound hammer is based on the correlation between the concrete compressive strength and the surface hardness of the concrete (Figure 12). During the application of a rebound hammer on the structural member, or cement concrete pavement, a spring system releases the hammer mass (a circle approximately 15 cm radius), then a plunger strikes the concrete surface; and as a result, the mass rebounds at a certain distance known as the rebound number. Therefore, the compressive strength can be calculated based on the average rebound number and the correlation of the formulas or curve. The examined near-surface concrete layer thickness for the rebound hammer is approximately 30 mm. Data reliability depends on the concrete surface that should be clean, flat, smooth, and dry during the testing campaign, and considering tests on a non-reinforcement steel rebar area is strongly recommended to avoid unreliable results, but to obtain an accurate measurement of rebound number [167,168].
The use of the rebound hammer in civil engineering, and most specifically in pavement assessment, is addressed in different studies:
- Uniformity and quality of the cement concrete [172].
It is recommended to use a rebound hammer as a complementary technique with crushing compressive strength tests based on core samples in order to validate results, and also combined with other semi-destructive and/or non-destructive tests such as chloride testing, covermeter test, half-cell test, and ultrasonic pulse velocity technique [173,174,175].
3.10. Covermeter
The covermeter is among the most usable electromagnetic wave-based non-invasive techniques for the detection and localization of the embedded steel reinforcement rebars in the concrete structural members, or even in the cement concrete pavements [176,177]. Within this technique, the Ferroscan device is among the widely used NDT techniques to determine the rebar diameter thanks to a two-level precision over the first 6 cm of the concrete surface. The equipment has been designed with a display monitor, scanner on a 600 mm scanner square board (Figure 13). Images can be conducted in a horizontal positioning of steel rebars and ducts in any reinforcement concrete structures including cement concrete pavement in a non-destructive way and easy to use. In addition, Ferroscan can be used for concrete cover measurement outside of reinforcement zones or crossing zones [176]. A low-depth penetration technique and the challenge faced in detecting concrete cover in high reinforcement density zones are considered as limitations of the covermeter device.
The main applications of the covermeter technique for road pavement assessment are:
3.11. Ultrasonic Pulse-Echo Test
The ultrasonic pulse-echo (UPE) inspection technique is among the highly recommended non-destructive techniques for the in situ and full field evaluation of rigid pavements, and concrete structures. UPE is considered among the advanced NDTs in the current industry-academia sector, and particularly in field inspection cases. This method uses a pulsed laser or Q-switched laser to produce ultrasonic waves in a remote and contactless way [182]. If the pulse is generated by impact at a single point instead of a pulse from a transducer, it is known as the impact-echo (IE) method.
The configuration of the pulse-echo device is composed of the scanning head, which consists of two lasers for sensing scans and mounted with a two-axis translation stage (Figure 14). Then, the inspector can automatically scan the inspection area by supporting the mentioned stage. The inspection is of a high speed, which is up to 1600 points per second at a specific internal rate of 0.25 mm (or 2500 points per second for the interval of 0.1 mm). The pulse-echo technique has been used for interface defects with a pavement structure in both aspects of detection and survey, and the reliability of results has a good agreement when combined and compared to GPR and other NDTs. This method can be also used for the evaluation of the pavement material properties [183].
The main applications of ultrasonic waves for the assessment of the road transports are:
The ultrasonic technique is widely combined with other NDTs such as GPR and infrared tomography [188], resonant images [197], metal magnetic memory method [198], and seismic wave technology [199].
Table 1 summarizes the damages and dimensions in pavement assessment for each NDT technique described in this section. The order of the techniques is the same as this section; from remote test to contact one, and from flexible to rigid pavement.
4. Methodology for Reviewing Process
This review study focuses on the integration between GPR and one or more non-destructive techniques for pavement assessment. Figure 15 shows the method of the search. The main criteria considered were:
- We used Scopus and Web of Science databases to retrieve the related research publications. A set of keywords of non-destructive tests relevant to our review topic were used to cover a broad area of research articles.
- We considered manuscripts such as review articles, original research, technical notes, and case studies when they matched the search criteria. Then, the redundant or irrelevant publications were excluded from the initial review list based on reading the title and abstract of each publication. For example, publications related to cultural heritage preservation were excluded, as they are not relevant to our review.
- Publications list was from Open Access articles, and our institutional available publishers (Elsevier, IEEE Xplore, ASCE, Springer, and Taylor & Francis).
- A total of 122 publications were relevant to the review topic including 25 articles that were added from the references during the review process, but only 32 articles were selected for the detailed review in Section 5. The selection criteria were based on the completeness and contribution of the work and the overall quality of the research.
The selection of publications to be reviewed in-depth and their relevance reflected the views of the authors. Moreover, this review does not include all the existent papers, but we considered journal articles rather than conference publications when they addressed similar topics, and measured data rather than experimental or simulated data. Original research and case study articles were preferred over review articles, especially those indexed in the Journal Citation Reports (JCR) database.
Studies combining GPR with other NDTs for road pavement assessment have shown more interest in recent years. Figure 16 shows the number of publications relevant to this review topic per year since 1993. The most were published in 2016 and 2017, with 14 each, and then, in 2021, 13 were published. The majority of the publications reviewed were articles and conference papers, at 68% and 28%, respectively, as shown in Figure 17. Elsevier was the top publisher with 37 reviewed publications, while the American Society of Civil Engineers (ASCE) was the second with 17 publications as shown in Figure 18.
5. Review of Combination of GPR with Other NDTs on Pavement Assessment
This section presents the most relevant works in the literature dealing with the combined application of GPR and other NDTs for road pavement monitoring, by considering the methodology and the criteria described in Section 4. Table 2 presents the compilation of these articles, thus providing information about the objective of the work and the NDTs combined, as well as the GPR antennas used, and the main findings obtained from the combination of the different methods.
6. Final Remarks and Further Perspectives
The joint processing of the data can be challenging as well due to data heterogeneity and suitability for the application. Therefore, complementary NDTs should be selected carefully to fit the purpose of the assessment mission. For example, using technologies such as InSAR can be effective in urban areas at a network level to detect sinkhole formation activities or subsidence and identify the critical areas that need to be inspected carefully, then a complimentary inspection using GPR and other NDTs can be performed on the project level within those areas inspected [31,36]. Additionally, GPR can be integrated with other surface and subsurface NDTs to define key performance indicators (KPIs) to support decision making and planning for maintenance [205,221,222]. Table 3 summarizes the most interesting combinations to detect both superficial distresses and superstructure deterioration or failure. Considering that the purpose of this review is the combination of GPR with other NDT, this method is transversal to all the combinations and a specific column for GPR was therefore not included.
This review presents insights into the combined use of GPR in conjunction with other NDTs to assess road pavement conditions. The integral use of the NDTs has received more attention in recent years since it provides a more comprehensive assessment of the road network. Using proper NDTs alongside GPR can provide detailed condition maps for surface and subsurface in the same area under different weather and illumination conditions. As a result, the limitation of each NDT is minimized while the overall value is empowered.
Nevertheless, there are many challenges encountered when working with a combination of systems. The data collection process varies in time and cost among different NDTs. In addition, the manual surveying process is subjected to safety risks due to open traffic [223]. Several studies addressed those issues by proposing data collection methods based on multiple sensors mounted on the inspection vehicles. Using such practices in inspections can minimize the data collection time and the traffic disturbance and lead to more overall collection process efficiency. In addition, using modern robot-based systems [224,225] allows autonomous data collection and provides near real-time data analysis capabilities.
Each NDT can provide georeferenced data when it is integrated with a global positioning system (GPS). However, it is yet processed as independent data by the specialists. Consequently, the lack of communication between those specialists can lead to a loss of required contextual information [176]. Hence, it is essential to use collaborative platforms to share and visualize the processed data among the experts. Thus, integrating such data with geographic information systems (GIS) platforms can contribute to empowering pavement management systems (PMS) [226]. Several studies employed GIS software for visualization on a limited scale [212]. Nevertheless, GIS platforms have capabilities to store, share and visualize the geographic data through both local and online environments, allowing collaboration between different parties.
On the other hand, Digital Twin and its underlying technologies such as 3D GIS, Building Information Modeling (BIM), and Internet of Things (IoT) can enormously contribute to the digital transition and the preventive maintenance procedures for road infrastructures [227]. Progress, assessment methodologies, and maintenance techniques are highly dependent on the quality of interpreting the data-driven from field case studies or construction sites. For this reason, the use of new emerging technologies, such as digital twins, is crucial. Furthermore, extracting detailed information and predictive models from GPR combined with other NDTs datasets is highly recommended. Such results could be incorporated with data-driven road-based sensors for real-time monitoring and predictive maintenance. This could deliver significant supporting tools for decision-making owners/operators for road assessment management plans.
In the same context, the new trends and current knowledge of using intelligent data analysis such as machine learning and deep learning are employed within the project’s lifecycle to automate the process and obtain most of the available data. It can be used in multiple phases, from operating the data acquisition platforms, processing the NDTs datasets, and employing it in PMS and digital twins. For example, GPR data processing is time-consuming, and the interpretation depends on the experience of the specialist. However, recent research is concerned with applying deep learning techniques to interpret and digitize GPR data and use the existing data to make robust learnable detection models. Similarly, machine learning techniques are applied to other NDTs, such as LiDAR, visual imaging, and IRT, for automating the interpretation and digitization process. In addition, most of the real-world systems that integrate multiple data sources incorporate intelligent data analysis to make sense of the data, as it can detect hidden patterns, build reliable predictive models, and enable real-time monitoring [228]. Moreover, using state-of-the-art technologies to monitor road pavements has significant practical and economic benefits for improving overall road network quality and reducing maintenance costs.
In conclusion, GPR and other NDTs can be combined to provide comprehensive knowledge about both surface and subsurface features of rigid and flexible pavements on network and project levels. There are opportunities for using state-of-the-art machine learning techniques to automate data processing and digitization. Moreover, incorporating the extracted data in GIS and BIM environments in addition to using AI is a base to set up robust pavement management systems and digital twins and to support industry 4.0.
Author Contributions
A.E., A.A.-D., M.S., M.R. and S.S.-A. conceived, designed, and wrote this review article. All authors have read and agreed to the published version of the manuscript.
Funding
A. Alonso-Díaz. wants to thank the GAIN, Xunta de Galicia, for the financial support given through the project ENDITí (Ref. ED431F 2021/08). M. Solla acknowledges the grant RYC2019–026604 funded by MCIN/AEI/10.13039/501100011033 and by “ESF Investing in your future”. Moreover, this project has received funding from the European Union’s Horizon 2020 research and innovation program under grant agreements No. 958171 and No. 769129. This document reflects only the views of the author(s). Neither the Innovation and Networks Executive Agency (INEA) or the European Commission is in any way responsible for any use that may be made of the information it contains. The statements made herein are solely the responsibility of the authors.
Data Availability Statement
Not applicable.
Conflicts of Interest
The authors declare no conflict of interest.
References
- Hossain, U.; Wong, J.J.; Ng, S.T.; Wang, Y. Sustainable design of pavement systems in highly urbanized context: A lifecycle assessment. J. Environ. Manag. 2022, 305, 114410. [Google Scholar] [CrossRef] [PubMed]
- Rasol, M.; Pais, J.C.; Pérez-Gracia, V.; Solla, M.; Fernandes, F.M.; Fontul, S.; Ayala-Cabrera, D.; Schmidt, F.; Assadollahi, H. GPR monitoring for road transport infrastructure: A systematic review and machine learning insights. Constr. Build. Mater. 2022, 324, 126686. [Google Scholar] [CrossRef]
- Rasol, M.; Pérez-Gracia, V.; Solla, M.; Pais, J.C.; Fernandes, F.M.; Santos, C. An experimental and numerical approach to combine Ground Penetrating Radar and computational modeling for the identification of early cracking in cement concrete pavements. NDT E Int. 2020, 115, 102293. [Google Scholar] [CrossRef]
- Kheradmandi, N.; Mehranfar, V. A critical review and comparative study on image segmentation-based techniques for pavement crack detection. Constr. Build. Mater. 2022, 321, 126162. [Google Scholar] [CrossRef]
- Lai, W.W.-L.; Dérobert, X.; Annan, P. A review of Ground Penetrating Radar application in civil engineering: A 30-year journey from Locating and Testing to Imaging and Diagnosis. NDT E Int. 2018, 96, 58–78. [Google Scholar] [CrossRef]
- Solla, M.; Pérez-Gracia, V.; Fontul, S. A Review of GPR Application on Transport Infrastructures: Troubleshooting and Best Practices. Remote Sens. 2021, 13, 672. [Google Scholar] [CrossRef]
- Proto, M.; Bavusi, M.; Bernini, R.; Bigagli, L.; Bost, M.; Bourquin, F.; Cottineau, L.-M.; Cuomo, V.; Della Vecchia, P.; Dolce, M.; et al. Transport Infrastructure Surveillance and Monitoring by Electromagnetic Sensing: The ISTIMES Project. Sensors 2010, 10, 10620–10639. [Google Scholar] [CrossRef]
- Maser, K.R. Non-Destructive Measurement of Pavement Layer Thickness; Californian Department of Transportation. 2003. Available online: https://0-scholar-google-com.brum.beds.ac.uk/scholar?cluster=9227942454363219310 (accessed on 28 August 2022).
- Fernandes, F.M.; Pais, J.C. Laboratory observation of cracks in road pavements with GPR. Constr. Build. Mater. 2017, 154, 1130–1138. [Google Scholar] [CrossRef]
- Marecos, V.; Solla, M.; Fontul, S.; Antunes, V. Assessing the pavement subgrade by combining different non-destructive methods. Constr. Build. Mater. 2017, 135, 76–85. [Google Scholar] [CrossRef]
- Zhang, J.; Yang, X.; Li, W.; Zhang, S.; Jia, Y. Automatic detection of moisture damages in asphalt pavements from GPR data with deep CNN and IRS method. Autom. Constr. 2020, 113, 103119. [Google Scholar] [CrossRef]
- ASTM. Standard Practice for Roads and Parking Lots Pavement Condition Index Surveys; ASTM International: West Conshohocken, PA, USA, 2020; Volume D6433. [Google Scholar] [CrossRef]
- Abdelmawla, A.; Kim, S. Prediction of subgrade soil density using dielectric constant of soils. In Eleventh International Conference on the Bearing Capacity of Roads, Railways and Airfields; CRC Press: London, UK, 2021; Volume 1, pp. 448–457. ISBN 9781003222880. [Google Scholar] [CrossRef]
- Hall, K.D.; Schwartz, C.W. Development of Structural Design Guidelines for Porous Asphalt Pavement. Transp. Res. Rec. J. Transp. Res. Board 2018, 2672, 197–206. [Google Scholar] [CrossRef]
- Dérobert, X.; Baltazart, V.; Simonin, J.-M.; Todkar, S.; Norgeot, C.; Hui, H.-Y. GPR Monitoring of Artificial Debonded Pavement Structures throughout Its Life Cycle during Accelerated Pavement Testing. Remote Sens. 2021, 13, 1474. [Google Scholar] [CrossRef]
- Petit, C.; Chabot, A.; Destrée, A.; Raab, C. Recommendation of RILEM TC 241-MCD on interface debonding testing in pavements. Mater. Struct. 2018, 51, 96. [Google Scholar] [CrossRef]
- Capozzoli, L.; De Martino, G.; Polemio, M.; Rizzo, E. Geophysical Techniques for Monitoring Settlement Phenomena Occurring in Reinforced Concrete Buildings. Surv. Geophys. 2019, 41, 575–604. [Google Scholar] [CrossRef]
- Chai, M.; Mu, Y.; Zhang, J.; Ma, W.; Liu, G.; Chen, J. Characteristics of Asphalt Pavement Damage in Degrading Permafrost Regions: Case Study of the Qinghai–Tibet Highway, China. J. Cold Reg. Eng. 2018, 32, 05018003. [Google Scholar] [CrossRef]
- Zaki, A.; Johari, M.A.M.; Hussin, W.M.A.W.; Jusman, Y. Experimental Assessment of Rebar Corrosion in Concrete Slab Using Ground Penetrating Radar (GPR). Int. J. Corros. 2018, 2018, 5389829. [Google Scholar] [CrossRef]
- Sossa, V.; Pérez-Gracia, V.; González-Drigo, R.; Rasol, M.A. Lab Non Destructive Test to Analyze the Effect of Corrosion on Ground Penetrating Radar Scans. Remote. Sens. 2019, 11, 2814. [Google Scholar] [CrossRef]
- Ahmad, S. Reinforcement corrosion in concrete structures, its monitoring and service life prediction––A review. Cem. Concr. Compos. 2003, 25, 459–471. [Google Scholar] [CrossRef]
- Zollinger, D.G.; Senadheera, S.P.; Tang, T. Spalling of Continuously Reinforced Concrete Pavements. J. Transp. Eng. 1994, 120, 394–411. [Google Scholar] [CrossRef]
- Moropoulou, A.; Avdelidis, N.; Koui, M.; Kakaras, K. An application of thermography for detection of delaminations in airport pavements. NDT E Int. 2001, 34, 329–335. [Google Scholar] [CrossRef]
- ASTM. Standard Test Method for Evaluating Asphalt-Covered Concrete Bridge Decks Using Ground Penetrating Radar; ASTM International: West Conshohocken, PA, USA, 2015. [Google Scholar] [CrossRef]
- Dinh, K.; Gucunski, N. Factors affecting the detectability of concrete delamination in GPR images. Constr. Build. Mater. 2020, 274, 121837. [Google Scholar] [CrossRef]
- Pepe, A.; Calò, F. A Review of Interferometric Synthetic Aperture RADAR (InSAR) Multi-Track Approaches for the Retrieval of Earth’s Surface Displacements. Appl. Sci. 2017, 7, 1264. [Google Scholar] [CrossRef]
- Karamvasis, K.; Karathanassi, V. Deformation effects of dams on coastal regions using Sentinel-1 IW TOPS time series: The West Lesvos, Greece Case. In Proceedings of the International Archives of the Photogrammetry, Remote Sensing and Spatial Information Sciences-ISPRS Archives, Tshwane, South Africa, 8–12 May 2017; Volume 42, pp. 91–96. [Google Scholar] [CrossRef]
- D’Amico, F.; Gagliardi, V.; Bianchini Ciampoli, L.; Tosti, F. Integration of InSAR and GPR techniques for monitoring transition areas in railway bridges. NDT E Int. 2020, 115, 102291. [Google Scholar] [CrossRef]
- Gagliardi, V.; Ciampoli, L.B.; Trevisani, S.; D’Amico, F.; Alani, A.M.; Benedetto, A.; Tosti, F. Testing Sentinel-1 SAR Interferometry Data for Airport Runway Monitoring: A Geostatistical Analysis. Sensors 2021, 21, 5769. [Google Scholar] [CrossRef]
- Busetti, A.; Calligaris, C.; Forte, E.; Areggi, G.; Mocnik, A.; Zini, L. Non-Invasive Methodological Approach to Detect and Characterize High-Risk Sinkholes in Urban Cover Evaporite Karst: Integrated Reflection Seismics, PS-InSAR, Leveling, 3D-GPR and Ancillary Data. A NE Italian Case Study. Remote Sens. 2020, 12, 3814. [Google Scholar] [CrossRef]
- Tosti, F.; Gagliardi, V.; D’Amico, F.; Alani, A.M. Transport infrastructure monitoring by data fusion of GPR and SAR imagery information. Transp. Res. Procedia 2020, 45, 771–778. [Google Scholar] [CrossRef]
- Alani, A.M.; Tosti, F.; Bianchini Ciampoli, L.; Gagliardi, V.; Benedetto, A. An integrated investigative approach in health monitoring of masonry arch bridges using GPR and InSAR technologies. NDT E Int. 2020, 115, 102288. [Google Scholar] [CrossRef]
- Ozden, A.; Faghri, A.; Li, M.; Tabrizi, K. Evaluation of Synthetic Aperture Radar Satellite Remote Sensing for Pavement and Infrastructure Monitoring. Procedia Eng. 2016, 145, 752–759. [Google Scholar] [CrossRef]
- Macchiarulo, V.; Milillo, P.; DeJong, M.J.; Martí, J.G.; Sánchez, J.; Giardina, G. Integrated InSAR monitoring and structural assessment of tunnelling-induced building deformations. Struct. Control Health Monit. 2021, 28, e2781. [Google Scholar] [CrossRef]
- Gao, M.; Gong, H.; Chen, B.; Zhou, C.; Chen, W.; Liang, Y.; Shi, M.; Si, Y. InSAR time-series investigation of long-term ground displacement at Beijing Capital International Airport, China. Tectonophysics 2016, 691, 271–281. [Google Scholar] [CrossRef]
- Talib, O.-C.; Shimon, W.; Sarah, K.; Tonian, R. Detection of sinkhole activity in West-Central Florida using InSAR time series observations. Remote Sens. Environ. 2021, 269, 112793. [Google Scholar] [CrossRef]
- Gutiérrez, F.; Galve, J.P.; Lucha, P.; Castañeda, C.; Bonachea, J.; Guerrero, J. Integrating geomorphological mapping, trenching, InSAR and GPR for the identification and characterization of sinkholes: A review and application in the mantled evaporite karst of the Ebro Valley (NE Spain). Geomorphology 2011, 134, 144–156. [Google Scholar] [CrossRef]
- Slatton, K.; Crawford, M.; Evans, B. Fusing interferometric radar and laser altimeter data to estimate surface topography and vegetation heights. IEEE Trans. Geosci. Remote Sens. 2001, 39, 2470–2482. [Google Scholar] [CrossRef]
- Pappalardo, G.; Mineo, S.; Angrisani, A.C.; Di Martire, D.; Calcaterra, D. Combining field data with infrared thermography and DInSAR surveys to evaluate the activity of landslides: The case study of Randazzo Landslide (NE Sicily). Landslides 2018, 15, 2173–2193. [Google Scholar] [CrossRef]
- Hubatka, F. Identification of ground instability in the housing estate complex based on georadar and satellite radar interferometry. Acta Geodyn. et Geomater. 2021, 18, 231–240. [Google Scholar] [CrossRef]
- Martel, R.; Castellazzi, P.; Gloaguen, E.; Trépanier, L.; Garfias, J. ERT, GPR, InSAR, and tracer tests to characterize karst aquifer systems under urban areas: The case of Quebec City. Geomorphology 2018, 310, 45–56. [Google Scholar] [CrossRef] [Green Version]
- Norezan, N.N.M.; Sulaiman, S.A.; Samad, A.M.; Salleh, Z.M. Hyperspectral Imaging Sensor in Civil Structure. In Proceedings of the 2021 IEEE 12th Control and System Graduate Research Colloquium, ICSGRC 2021-Proceedings, Shah Alam, Malaysia, 7 August 2021; Institute of Electrical and Electronics Engineers Inc.: Petaling, Malaysia, 2021; pp. 154–159. [Google Scholar] [CrossRef]
- Nsengiyumva, W.; Zhong, S.; Lin, J.; Zhang, Q.; Zhong, J.; Huang, Y. Advances, limitations and prospects of nondestructive testing and evaluation of thick composites and sandwich structures: A state-of-the-art review. Compos. Struct. 2020, 256, 112951. [Google Scholar] [CrossRef]
- Schnebele, E.; Tanyu, B.F.; Cervone, G.; Waters, N. Review of remote sensing methodologies for pavement management and assessment. Eur. Transp. Res. Rev. 2015, 7, 7. [Google Scholar] [CrossRef]
- Garini, Y.; Young, I.T.; McNamara, G. Spectral imaging: Principles and applications. Cytom. Part A 2006, 69, 735–747. [Google Scholar] [CrossRef]
- Abdellatif, M.; Peel, H.; Cohn, A.G.; Fuentes, R. Pavement Crack Detection from Hyperspectral Images Using A Novel Asphalt Crack Index. Remote. Sens. 2020, 12, 3084. [Google Scholar] [CrossRef]
- Falade, A.H.; Olajuyigbe, O.E.; Oni, A.G.; Falola, H.O.; Ige, A.P.; Ogundipe, E.O. Integrated magnetic and electrical resistivity investigation for assessment of the causes of road pavement failure along the Ife-Osogbo Highway, Southwestern Nigeria. Model. Earth Syst. Environ. 2020, 7, 1425–1441. [Google Scholar] [CrossRef]
- Pan, Y.; Zhang, X.; Cervone, G.; Yang, L. Detection of Asphalt Pavement Potholes and Cracks Based on the Unmanned Aerial Vehicle Multispectral Imagery. IEEE J. Sel. Top. Appl. Earth Obs. Remote Sens. 2018, 11, 3701–3712. [Google Scholar] [CrossRef]
- Riese, F.M.; Keller, S. Fusion of Hyper Spectral and Ground Penetrating Radar Data to Estimate Soil Moisture. In Proceedings of the Workshop on Hyperspectral Image and Signal Processing, Evolution in Remote Sensing, Amsterdam, The Netherlands, 23–26 September 2018; Volume 2018. [Google Scholar] [CrossRef]
- Abdellatif, M.; Peel, H.; Cohn, A.G.; Fuentes, R. Hyperspectral imaging for autonomous inspection of road pavement defects. In Proceedings of the 36th International Symposium on Automation and Robotics in Construction, ISARC 2019, Banff, AL, Canada, 21–24 May 2019; International Association for Automation and Robotics in Construction: Bratislava, Slovakia; pp. 384–392. [Google Scholar] [CrossRef]
- Elaksher, A.F. Fusion of hyperspectral images and lidar-based dems for coastal mapping. Opt. Lasers Eng. 2008, 46, 493–498. [Google Scholar] [CrossRef] [Green Version]
- Mozzi, P.; Fontana, A.; Ferrarese, F.; Ninfo, A.; Campana, S.; Francese, R. The Roman City of Altinum, Venice Lagoon, from Remote Sensing and Geophysical Prospection. Archaeol. Prospect. 2015, 23, 27–44. [Google Scholar] [CrossRef]
- Agapiou, A.; Lysandrou, V.; Sarris, A.; Papadopoulos, N.; Hadjimitsis, D.G. Fusion of Satellite Multispectral Images Based on Ground-Penetrating Radar (GPR) Data for the Investigation of Buried Concealed Archaeological Remains. Geosciences 2017, 7, 40. [Google Scholar] [CrossRef]
- Ragnoli, A.; De Blasiis, M.R.; Di Benedetto, A. Pavement Distress Detection Methods: A Review. Infrastructures 2018, 3, 58. [Google Scholar] [CrossRef]
- Mathavan, S.; Rahman, M.; Kamal, K. Use of a Self-Organizing Map for Crack Detection in Highly Textured Pavement Images. J. Infrastruct. Syst. 2015, 21, 04014052. [Google Scholar] [CrossRef]
- Cohen, B.; Ye, S.; Karaman, G.; Khan, F.; Bartoli, I.; Pradhan, A.; Ellemberg, A.; Moon, F.; Gurian, P.; Kontsos, A.; et al. Design and implementation of an integrated operations and preservation performance monitoring system for asset management of major bridges. In Proceedings of the EWSHM-7th European Workshop on Structural Health Monitoring, INRIA, Nantes, France, 8–11 July 2014; pp. 1521–1528. [Google Scholar]
- Puente, I.; Solla, M.; González-Jorge, H.; Arias, P. NDT Documentation and Evaluation of the Roman Bridge of Lugo Using GPR and Mobile and Static LiDAR. J. Perform. Constr. Facil. 2015, 29, 0000531. [Google Scholar] [CrossRef]
- Li, S.; Yuan, C.; Liu, D.; Cai, H. Integrated Processing of Image and GPR Data for Automated Pothole Detection. J. Comput. Civ. Eng. 2016, 30, 0000582. [Google Scholar] [CrossRef]
- Garrido, I.; Lagüela, S.; Otero, R.; Arias, P. Thermographic methodologies used in infrastructure inspection: A review—data acquisition procedures. Infrared Phys. Technol. 2020, 111, 103481. [Google Scholar] [CrossRef]
- Garrido, I.; Lagüela, S.; Arias, P. Infrared Thermography’s Application to Infrastructure Inspections. Infrastructures 2018, 3, 35. [Google Scholar] [CrossRef]
- Lu, Y.; Golrokh, A.J.; Islam, A. Concrete Pavement Service Condition Assessment Using Infrared Thermography. Adv. Mater. Sci. Eng. 2017, 2017, 3829340. [Google Scholar] [CrossRef]
- Omar, T.; Nehdi, M.L. Remote sensing of concrete bridge decks using unmanned aerial vehicle infrared thermography. Autom. Constr. 2017, 83, 360–371. [Google Scholar] [CrossRef]
- Hiasa, S.; Karaaslan, E.; Shattenkirk, W.; Mildner, C.; Catbas, F.N. Bridge Inspection and Condition Assessment Using Image-Based Technologies with UAVs. In Proceedings of the Structures Congress 2018: Bridges, Transportation Structures, and Nonbuilding Structures—Selected Papers from the Structures Congress, Fort Worth, TX, USA, 19–21 April 2018. [Google Scholar]
- Bagavathiappan, S.; Lahiri, B.; Saravanan, T.; Philip, J.; Jayakumar, T. Infrared thermography for condition monitoring—A review. Infrared Phys. Technol. 2013, 60, 35–55. [Google Scholar] [CrossRef]
- Watase, A.; Birgul, R.; Hiasa, S.; Matsumoto, M.; Mitani, K.; Catbas, F.N. Practical identification of favorable time windows for infrared thermography for concrete bridge evaluation. Constr. Build. Mater. 2015, 101, 1016–1030. [Google Scholar] [CrossRef]
- Ellenberg, A.; Kontsos, A.; Moon, F.; Bartoli, I. Bridge deck delamination identification from unmanned aerial vehicle infrared imagery. Autom. Constr. 2016, 72, 155–165. [Google Scholar] [CrossRef]
- Dhakal, N.; Elseifi, M.A. Use of Infrared Thermography to Detect Thermal Segregation in Asphalt Overlay and Reflective Cracking Potential. J. Mater. Civ. Eng. 2016, 28, 0001413. [Google Scholar] [CrossRef]
- Solla, M.; Lagüela, S.; González-Jorge, H.; Arias, P. Approach to identify cracking in asphalt pavement using GPR and infrared thermographic methods: Preliminary findings. NDT E Int. 2014, 62, 55–65. [Google Scholar] [CrossRef]
- Vyas, V.; Patil, V.J.; Singh, A.P.; Srivastava, A. Application of infrared thermography for debonding detection in asphalt pavements. J. Civ. Struct. Health Monit. 2019, 9, 325–337. [Google Scholar] [CrossRef]
- Lagüela, S.; Solla, M.; Puente, I.; Prego, F.J. Joint use of GPR, IRT and TLS techniques for the integral damage detection in paving. Constr. Build. Mater. 2018, 174, 749–760. [Google Scholar] [CrossRef]
- Nuzzo, L.; Calia, A.; Liberatore, D.; Masini, N.; Rizzo, E. Integration of ground-penetrating radar, ultrasonic tests and infrared thermography for the analysis of a precious medieval rose window. Adv. Geosci. 2010, 24, 69–82. [Google Scholar] [CrossRef]
- Büyüköztürk, O. Imaging of concrete structures. NDT E Int. 1998, 31, 233–243. [Google Scholar] [CrossRef]
- Breysse, D.; Klysz, G.; Dérobert, X.; Sirieix, C.; Lataste, J. How to combine several non-destructive techniques for a better assessment of concrete structures. Cem. Concr. Res. 2008, 38, 783–793. [Google Scholar] [CrossRef]
- Soilán, M.; Sánchez-Rodríguez, A.; del Río-Barral, P.; Perez-Collazo, C.; Arias, P.; Riveiro, B. Review of Laser Scanning Technologies and Their Applications for Road and Railway Infrastructure Monitoring. Infrastructures 2019, 4, 58. [Google Scholar] [CrossRef]
- Guan, H.; Li, J.; Cao, S.; Yu, Y. Use of mobile LiDAR in road information inventory: A review. Int. J. Image Data Fusion 2016, 7, 219–242. [Google Scholar] [CrossRef]
- Yu, Y.; Li, J.; Guan, H.; Wang, C. 3D crack skeleton extraction from mobile LiDAR point clouds. In Proceedings of the International Geoscience and Remote Sensing Symposium (IGARSS), Quebec City, QC, Canada, 13–18 July 2014; Institute of Electrical and Electronics Engineers Inc.: Piscataway, NJ, USA, 2014; pp. 914–917. [Google Scholar] [CrossRef]
- Díaz-Vilariño, L.; González-Jorge, H.; Bueno, M.; Arias, P.; Puente, I. Automatic classification of urban pavements using mobile LiDAR data and roughness descriptors. Constr. Build. Mater. 2016, 102, 208–215. [Google Scholar] [CrossRef]
- Guan, H.; Li, J.; Yu, Y.; Chapman, M.; Wang, H.; Wang, C.; Zhai, R. Iterative Tensor Voting for Pavement Crack Extraction Using Mobile Laser Scanning Data. IEEE Trans. Geosci. Remote Sens. 2014, 53, 1527–1537. [Google Scholar] [CrossRef]
- Chen, X.; Li, J. A feasibility study on use of generic mobile laser scanning system for detecting asphalt pavement cracks. ISPRS Int. Arch. Photogramm. Remote Sens. Spat. Inf. Sci. 2016, XLI-B1, 545–549. [Google Scholar] [CrossRef]
- Wu, H.; Yao, L.; Xu, Z.; Li, Y.; Ao, X.; Chen, Q.; Li, Z.; Meng, B. Road pothole extraction and safety evaluation by integration of point cloud and images derived from mobile mapping sensors. Adv. Eng. Informatics 2019, 42, 100936. [Google Scholar] [CrossRef]
- De Blasiis, M.R.; Di Benedetto, A.; Fiani, M. Mobile Laser Scanning Data for the Evaluation of Pavement Surface Distress. Remote Sens. 2020, 12, 942. [Google Scholar] [CrossRef]
- Gézero, L.; Antunes, C. Road Rutting Measurement Using Mobile LiDAR Systems Point Cloud. ISPRS Int. J. Geo-Inf. 2019, 8, 404. [Google Scholar] [CrossRef]
- De Blasiis, M.; Di Benedetto, A.; Fiani, M.; Garozzo, M. Assessing of the Road Pavement Roughness by Means of LiDAR Technology. Coatings 2020, 11, 17. [Google Scholar] [CrossRef]
- Chang, P.C.; Liu, S.C. Recent Research in Nondestructive Evaluation of Civil Infrastructures. J. Mater. Civ. Eng. 2003, 15, 298–304. [Google Scholar] [CrossRef]
- Puente, I.; Solla, M.; González-Jorge, H.; Arias, P. Validation of mobile LiDAR surveying for measuring pavement layer thicknesses and volumes. NDT E Int. 2013, 60, 70–76. [Google Scholar] [CrossRef]
- Gkyrtis, K.; Loizos, A.; Plati, C. Integrating Pavement Sensing Data for Pavement Condition Evaluation. Sensors 2021, 21, 3104. [Google Scholar] [CrossRef]
- Prasad, J.R.; Kanuganti, S.; Bhanegaonkar, P.N.; Sarkar, A.K.; Arkatkar, S. Development of Relationship between Roughness (IRI) and Visible Surface Distresses: A Study on PMGSY Roads. Procedia Soc. Behav. Sci. 2013, 104, 322–331. [Google Scholar] [CrossRef]
- Pitoňák, M.; Filipovsky, J. GPR Application—Non-destructive Technology for Verification of Thicknesses of Newly Paved Roads in Slovakia. Procedia Eng. 2016, 153, 537–549. [Google Scholar] [CrossRef]
- Uzarowski, L.; Henderson, V.; Rizvi, R.; Mohammad, K.; Lakkavalli, V. Use of FWD, GPR and IP in combination on complex pavement projects-including case studies. In Proceedings of the 2016 Transportation Association of Canada’s Conference and Exhibition, TAC 2016, Toronto, ON, Canada, 25–28 September 2016; Transportation Association of Canada: Ottawa, ON, Canada, 2016. [Google Scholar]
- Kırbaş, U. IRI Sensitivity to the Influence of Surface Distress on Flexible Pavements. Coatings 2018, 8, 271. [Google Scholar] [CrossRef]
- Hasanuddin; Setyawan, A.; Yulianto, B. Evaluation of Road Performance Based on International Roughness Index and Falling Weight Deflectometer. IOP Conf. Series Mater. Sci. Eng. 2018, 333, 012090. [Google Scholar] [CrossRef]
- Šroubek, F.; Šorel, M.; Žák, J. Precise International Roughness Index Calculation. Int. J. Pavement Res. Technol. 2021, 1–7. [Google Scholar] [CrossRef]
- Pedret Rodés, J.; Martínez Reguero, A.; Pérez-Gracia, V. GPR Spectra for Monitoring Asphalt Pavements. Remote Sens. 2020, 12, 1749. [Google Scholar] [CrossRef]
- Tighe, S.; Li, N.; Falls, L.C.; Haas, R. Incorporating Road Safety into Pavement Management. Transp. Res. Rec. J. Transp. Res. Board 2000, 1699, 1–10. [Google Scholar] [CrossRef]
- Nekula, L.; Stryk, J.; Nekulova, P.; Brezina, I. Potential improvement in data interpretation regarding simultaneous measurement of friction coefficient and IRI. In Proceedings of the Symposium on Pavement Surface Characteristics (SURF), Brisbane, QLD, Australia, 2–4 May 2018. [Google Scholar]
- Imam, R.; Murad, Y.; Asi, I.; Shatnawi, A. Predicting Pavement Condition Index from International Roughness Index using Gene Expression Programming. Innov. Infrastruct. Solutions 2021, 6, 139. [Google Scholar] [CrossRef]
- Cruz, O.G.D.; Mendoza, C.A.; Lopez, K.D. International Roughness Index as Road Performance Indicator: A Literature Review. IOP Conf. Series Earth Environ. Sci. 2021, 822, 012016. [Google Scholar] [CrossRef]
- Rasol, M.; Schmidt, F.; Ientile, S.; Adelaide, L.; Nedjar, B.; Kane, M.; Chevalier, C. Progress and Monitoring Opportunities of Skid Resistance in Road Transport: A Critical Review and Road Sensors. Remote Sens. 2021, 13, 3729. [Google Scholar] [CrossRef]
- Gökalp, I.; Uz, V.E.; Saltan, M. A laboratory evaluation on skid resistance performance of surface coatings manufactured by both natural aggregates and by-products. In Bearing Capacity of Roads, Railways and Airfields; CRC Press: London, UK, 2017; pp. 929–934. ISBN 9781138295957. [Google Scholar]
- Rukavina, T.; Domitrović, J.; Krnić, L.; Krpan, M. Evaluation of Pavement Bearing Capacity by FWD-Example from Practice. In Proceedings of the 26th World Road Congress, Abu Dhabi, United Arab Emirates, 6–10 October 2019. [Google Scholar]
- Daniels, D.J. (Ed.) Ground Penetrating Radar; Institution of Engineering and Technology: London, UK, 2004; ISBN 9780444533487. [Google Scholar]
- Benedetto, A.; Benedetto, F. Application Field-Specific Synthesizing of Sensing Technology: Civil Engineering Application of Ground-Penetrating Radar Sensing Technology. In Comprehensive Materials Processing; Elsevier: Amsterdam, The Netherlands, 2014; Volume 13, pp. 393–425. ISBN 9780080965338. [Google Scholar]
- Pajewski, L.; Fontul, S.; Solla, M. Ground-penetrating radar for the evaluation and monitoring of transport infrastructures. In Innovation in Near-Surface Geophysics. Instrumentation, Application, and Data Processing Methods; Elsevier: Amsterdam, The Netherlands, 2019. [Google Scholar] [CrossRef]
- Hu, J.; Vennapusa, P.K.R.; White, D.J.; Beresnev, I. Pavement thickness and stabilised foundation layer assessment using ground-coupled GPR. Nondestruct. Test. Evaluation 2015, 31, 267–287. [Google Scholar] [CrossRef]
- Diamanti, N.; Redman, D. Field observations and numerical models of GPR response from vertical pavement cracks. J. Appl. Geophys. 2012, 81, 106–116. [Google Scholar] [CrossRef]
- Fernandes, F.M.; Fernandes, A.; Pais, J. Assessment of the density and moisture content of asphalt mixtures of road pavements. Constr. Build. Mater. 2017, 154, 1216–1225. [Google Scholar] [CrossRef]
- Al-Qadi, I.L.; Lahouar, S. Measuring layer thicknesses with GPR–Theory to practice. Constr. Build. Mater. 2005, 19, 763–772. [Google Scholar] [CrossRef]
- Loizos, A.; Plati, C. Accuracy of pavement thicknesses estimation using different ground penetrating radar analysis approaches. NDT E Int. 2007, 40, 147–157. [Google Scholar] [CrossRef]
- Varela-González, M.; Solla, M.; Martínez-Sánchez, J.; Arias, P. A semi-automatic processing and visualisation tool for ground-penetrating radar pavement thickness data. Autom. Constr. 2014, 45, 42–49. [Google Scholar] [CrossRef]
- Chen, D.-H.; Hong, F.; Zhou, W.; Ying, P. Estimating the hotmix asphalt air voids from ground penetrating radar. NDT E Int. 2014, 68, 120–127. [Google Scholar] [CrossRef]
- Hoegh, K.; Khazanovich, L.; Dai, S.; Yu, T. Evaluating asphalt concrete air void variation via GPR antenna array data. Case Stud. Nondestruct. Test. Eval. 2015, 3, 27–33. [Google Scholar] [CrossRef]
- Cueto, M.; Olona, J.; Fernández-Viejo, G.; Pando, L.; López-Fernández, C. Karst-induced sinkhole detection using an integrated geophysical survey: A case study along the Riyadh Metro Line 3 (Saudi Arabia). Near Surf. Geophys. 2018, 16, 270–281. [Google Scholar] [CrossRef]
- Solla, M.; Fernández, N. GPR analysis to detect subsidence: A case study on a loaded reinforced concrete pavement. Int. J. Pavement Eng. 2022, 1–15. [Google Scholar] [CrossRef]
- Alani, A.M.; Aboutalebi, M.; Kilic, G. Applications of ground penetrating radar (GPR) in bridge deck monitoring and assessment. J. Appl. Geophys. 2013, 97, 45–54. [Google Scholar] [CrossRef]
- Dinh, K.; Gucunski, N.; Duong, T.H. An algorithm for automatic localization and detection of rebars from GPR data of concrete bridge decks. Autom. Constr. 2018, 89, 292–298. [Google Scholar] [CrossRef]
- Liu, H.; Lin, C.; Cui, J.; Fan, L.; Xie, X.; Spencer, B.F. Detection and localization of rebar in concrete by deep learning using ground penetrating radar. Autom. Constr. 2020, 118, 103279. [Google Scholar] [CrossRef]
- Hugenschmidt, J.; Loser, R. Detection of chlorides and moisture in concrete structures with ground penetrating radar. Mater. Struct. 2007, 41, 785–792. [Google Scholar] [CrossRef]
- Klysz, G.; Balayssac, J.-P. Determination of volumetric water content of concrete using ground-penetrating radar. Cem. Concr. Res. 2007, 37, 1164–1171. [Google Scholar] [CrossRef]
- Kaplanvural, I.; Pekşen, E.; Özkap, K. Volumetric water content estimation of C-30 concrete using GPR. Constr. Build. Mater. 2018, 166, 141–146. [Google Scholar] [CrossRef]
- Gómez-Ortiz, D.; Martín-Crespo, T. Assessing the risk of subsidence of a sinkhole collapse using ground penetrating radar and electrical resistivity tomography. Eng. Geol. 2012, 149-150, 1–12. [Google Scholar] [CrossRef]
- Whiteley, R.J.; Kelly, R.B.; Stewart, S.B. Case studies of geophysical imaging for road foundation design on soft soils and embankment risk assessment. Explor. Geophys. 2015, 46, 394–402. [Google Scholar] [CrossRef]
- Prego, F.J.; Nieto, L.; Solla, M.; Puente, I. A mobile android tool for simplified GPR data processing in construction applications. Autom. Constr. 2018, 89, 170–182. [Google Scholar] [CrossRef]
- Pearson, D. Deterioration and Maintenance of Pavements, 1st ed.; ICE Publishing: London, UK, 2011. [Google Scholar] [CrossRef]
- ASTM. Standard Test Method for Measuring Deflections with a Light Weight Deflectometer (LWD); ASTM International: West Conshohocken, PA, USA, 2020. [Google Scholar] [CrossRef]
- Gopalakrishnan, K.; Ceylan, H.; Kim, S.; Yang, S. 3—Wireless MEMS for transportation infrastructure health monitoring. In Wireless MEMS Networks and Applications; Uttamchandani, D., Ed.; Woodhead Publishing Series in Electronic and Optical Materials; Woodhead Publishing: Cambridge, UK, 2017; pp. 53–76. ISBN 978-0-08-100449-4. [Google Scholar] [CrossRef]
- Fontul, S. Structural Evaluation of Flexible Pavements Using Non-Destructive Tests. Ph.D. Thesis, University of Coimbra, Coimbra, Portugal, 2004. [Google Scholar]
- Tarefder, R.A.; Ahmed, M.U. Consistency and accuracy of selected FWD backcalculation software for computing layer modulus of airport pavements. Int. J. Geotech. Eng. 2013, 7, 21–35. [Google Scholar] [CrossRef]
- Scullion, T.; Saarenketo, T. Integrating ground penetrating radar and falling weight deflectometer technologies in pavement evaluation. In Nondestructive Testing of Pavements and Backcalculation of Moduli; ASTM International: West Conshohocken, PA, USA, 2000; Volume 3. [Google Scholar] [CrossRef]
- Mehta, Y.; Roque, R. Evaluation of FWD Data for Determination of Layer Moduli of Pavements. J. Mater. Civ. Eng. 2003, 15, 25–31. [Google Scholar] [CrossRef]
- Korsgaard, H.C.; Pedersen, J.P.; Rasmussen, M. Rehabilitation by cracking and seating of concrete pavement optimized by FWD analysis. In Proceedings of the 7th International Conference on the Bearing Capacity of Roads, Railways and Airfields, Trondheim, Norway, 27–29 July 2005. [Google Scholar]
- Qiu, X.; Yang, Q.; Wang, F. Diagnostic analysis of dynamic deflection for cracked asphalt pavements under FWD impulsive loading. J. Vibroengineering 2014, 16, 2426–2437. [Google Scholar]
- Shoukry, S.N.; Martinelli, D.R.; Selezneva, O.I. Dynamic Performance of Composite Pavements Under Impact. Transp. Res. Rec. J. Transp. Res. Board 1997, 1570, 163–171. [Google Scholar] [CrossRef]
- Al Hakim, B.; Cheung, L.W.; Armitage, R.J. Use of FWD Data for Prediction of Bonding Between Pavement Layers. Int. J. Pavement Eng. 1999, 1, 49–59. [Google Scholar] [CrossRef]
- Nabizadeh, H.; Hajj, E.Y.; Siddharthan, R.V.; Elfass, S.; Nimeri, M. Application of falling weight deflectometer for the estimation of in-situ shear strength parameters of subgrade layer. In Proceedings of the 10th International Conference on the Bearing Capacity of Roads, Railways and Airfields, BCRRA 2017, Athens, Greece, 28–30 June 2017; CRC Press/Balkema: Boca Raton, FL, USA, 2017; pp. 743–749. [Google Scholar] [CrossRef]
- Calhoon, T.; Zegeye, E.; Velasquez, R.; Calvert, J. Using Falling Weight Deflectometer (FWD) and Ground Penetrating Radar (GPR) to monitor the effects of seasonal moisture variation on the structural capacity of pavements. Constr. Build. Mater. 2022, 351, 128831. [Google Scholar] [CrossRef]
- Marecos, V.; Fontul, S.; de Lurdes Antunes, M.; Solla, M. Evaluation of a highway pavement using non-destructive tests: Falling Weight Deflectometer and Ground Penetrating Radar. Constr. Build. Mater. 2017, 154, 1164–1172. [Google Scholar] [CrossRef]
- Zhao, W.; Yang, Q.; Wu, W.; Liu, J. Structural condition assessment and fatigue stress analysis of cement concrete pavement based on the GPR and FWD. Constr. Build. Mater. 2022, 328, 127044. [Google Scholar] [CrossRef]
- Maser, K.; Schmalzer, P.; Shaw, W.; Carmichael, A. Integration of Traffic Speed Deflectometer and Ground-Penetrating Radar for Network-Level Roadway Structure Evaluation. Transp. Res. Rec. J. Transp. Res. Board 2017, 2639, 55–63. [Google Scholar] [CrossRef]
- Katicha, S.; Flintsch, G.; Diefenderfer, B. Ten Years of Traffic Speed Deflectometer Research in the United States: A Review. Transp. Res. Rec. J. Transp. Res. Board 2022. [Google Scholar] [CrossRef]
- Flintsch, G.W.; McGhee, K.K. Quality Management of Pavement Condition Data Collection; The National Academies Press: Washington, DC, USA, 2009. [Google Scholar] [CrossRef]
- Elbagalati, O.; Mousa, M.; Elseifi, M.A.; Gaspard, K.; Zhang, Z. Development of a methodology to backcalculate pavement layer moduli using the traffic speed deflectometer. Can. J. Civ. Eng. 2018, 45, 377–385. [Google Scholar] [CrossRef]
- De Ridder, S.A.L. Passive Seismic Surface-Wave Interferometry for Reservoir-Scale Imaging; Department of Geophysics, Stanford University: Stanford, CA, USA, 2014. [Google Scholar]
- Picotti, S.; Francese, R.; Giorgi, M.; Pettenati, F.; Carcione, J.M. Estimation of glacier thicknesses and basal properties using the horizontal-to-vertical component spectral ratio (HVSR) technique from passive seismic data. J. Glaciol. 2017, 63, 229–248. [Google Scholar] [CrossRef] [Green Version]
- Alfaro, A.; Pujades, L.G.; Goula, X.; Susagna, T.; Navarro, M.; Sanchez, J.; Canas, J.A. Preliminary Map of Soil’s Predominant Periods in Barcelona Using Microtremors. Pure Appl. Geophys. 2001, 158, 2499–2511. [Google Scholar] [CrossRef]
- Gouveia, F.; Gomes, R.C.; Lopes, I. Shallow and in depth seismic testing in urban environment: A case study in Lisbon Miocene stiff soils using joint inversion of active and passive Rayleigh wave measurements. J. Appl. Geophys. 2019, 169, 199–213. [Google Scholar] [CrossRef]
- Levenberg, E.; Garg, N. Estimating the coefficient of at-rest earth pressure in granular pavement layers. Transp. Geotech. 2014, 1, 21–30. [Google Scholar] [CrossRef]
- Erhan, S.; Dicleli, M. Effect of dynamic soil–bridge interaction modeling assumptions on the calculated seismic response of integral bridges. Soil Dyn. Earthq. Eng. 2014, 66, 42–55. [Google Scholar] [CrossRef]
- Wang, Y.; Tran, K.T.; Horhota, D. Road sinkhole detection with 2D ambient noise tomography. Geophys. 2021, 86, KS123–KS135. [Google Scholar] [CrossRef]
- Salinas Naval, V.; Santos-Assunçao, S.; Pérez-Gracia, V. GPR Clutter Amplitude Processing to Detect Shallow Geological Targets. Remote. Sens. 2018, 10, 88. [Google Scholar] [CrossRef]
- Attwa, M.; Ali, H. Resistivity characterization of aquifer in coastal semiarid areas: An approach for hydrogeological evaluation. In Groundwater in the Nile Delta; Springer International Publishing: Cham, Switzerland, 2019; Volume 73, pp. 213–233. ISBN 978-3-319-94283-4. [Google Scholar] [CrossRef]
- Szalai, S.; Novák, A.; Szarka, L. Depth of Investigation and Vertical Resolution of Surface Geoelectric Arrays. J. Environ. Eng. Geophys. 2009, 14, 15–23. [Google Scholar] [CrossRef]
- Ward, S.H. Resistivity and Induced Polarization Methods. Environ. Geophys. 1990, 147–190. [Google Scholar] [CrossRef]
- Ducut, J.D.; Alipio, M.; Go, P.J.; Ii, R.C.; Vicerra, R.R.; Bandala, A.; Dadios, E. A Review of Electrical Resistivity Tomography Applications in Underground Imaging and Object Detection. Displays 2022, 73, 102208. [Google Scholar] [CrossRef]
- Park, C.-S.; Jeong, J.-H.; Park, H.-W.; Kim, K. Experimental Study on Electrode Method for Electrical Resistivity Survey to Detect Cavities under Road Pavements. Sustainability 2017, 9, 2320. [Google Scholar] [CrossRef]
- Ozegin, K.O.; Oseghale, A.; Okolie, E.C.; Ujuanbi, O. Integration of very low-frequency electromagnetic (VLF- EM) and electrical resistivity methods in mapping subsurface geologic structures favourable to road failures. Int. J. Water Resour. Environ. Eng. 2011, 3, 126–131. [Google Scholar]
- Adeyemo, I.; Omosuyi, G. Geophysical investigation of road pavement instability along part of Akure-Owo express way, Southwestern Nigeria. Am. J. Sci. Ind. Res. 2012, 3, 191–197. [Google Scholar] [CrossRef]
- Peter, J.E.; Rafiu, A.A.; Udensi, E.E.; Salako, K.A.; Alhassan, U.D.; Adetona, A.A. 2D Electrical Resistivity Imaging Investigation on Causes of Road Failure Along Kutigi Street, Minna, North Central, Nigeria. Am. J. Innov. Res. Appl. Sci. 2018, 6, 221–226. [Google Scholar]
- Victor, E.; Mamah, L. Geophysical investigation of road failure the case of Opoji in Nigeria. Int. J. Sci. Eng. Res. 2014, 5, 1769–1779. [Google Scholar]
- Tejero, A.; Chávez, R.E.; Urbieta, J.; Flores-Márquez, E.L. Cavity Detection in the Southwestern Hilly Portion of Mexico City by Resistivity Imaging. J. Environ. Eng. Geophys. 2002, 7, 130–139. [Google Scholar] [CrossRef]
- Kaufmann, G. Geophysical mapping of solution and collapse sinkholes. J. Appl. Geophys. 2014, 111, 271–288. [Google Scholar] [CrossRef]
- Carbonel, D.; Rodríguez-Tribaldos, V.; Gutiérrez, F.; Galve, J.P.; Guerrero, J.; Zarroca, M.; Roqué, C.; Linares, R.; McCalpin, J.P.; Acosta, E. Investigating a damaging buried sinkhole cluster in an urban area (Zaragoza city, NE Spain) integrating multiple techniques: Geomorphological surveys, DInSAR, DEMs, GPR, ERT, and trenching. Geomorphology 2015, 229, 3–16. [Google Scholar] [CrossRef]
- Ungureanu, C.; Priceputu, A.; Bugea, A.L.; Chirică, A. Use of electric resistivity tomography (ERT) for detecting underground voids on highly anthropized urban construction sites. Procedia Eng. 2017, 209, 202–209. [Google Scholar] [CrossRef]
- Chouteau, M.; Vallieres, S.; Miralles, M. Assessment of continuous resistivity profiling for the characterization of paved roads. In Proceedings of the AGU Spring Meeting Abstracts, San Francisco, CA, USA, 15–19 December 2004; Volume 2004, p. NS43A-03. [Google Scholar]
- Fontul, S.; Mínguez, R.; Solla, M.; Santos-Assunção, S. The use of geophysics for the condition assessment of railway infrastructure. Non-Destr. Tech. Eval. Struct. Infrastruct. 2016, 11, 195–212. [Google Scholar] [CrossRef]
- Amran, T.S.T.; Amin, M.S.M.; Ahmad, M.R.; Azreen, N.M.; Sani, S.; Adnan, M.A.K.; A Razak, N.; Sayuti, S. NDT methods in inspecting road and highway structures. IOP Conf. Series Mater. Sci. Eng. 2021, 1106, 012034. [Google Scholar] [CrossRef]
- BSI BS EN 12504-2:2012; Testing Concrete in Structures: Part 2: Non-destructive Testing-Determination of Rebound Number. British Standards Institution: London, UK, 2012.
- Rasol, M.A. Applied Nonlinear Seismic Performance and Retrofitting of the Building; Pomogaibog, O., Ed.; “LAP” Lambert Publishing Company: București, Romania, 2014; ISBN 978-3-659-20739-6. [Google Scholar] [CrossRef]
- Wróblewska, J.; Kowalski, R. Assessing concrete strength in fire-damaged structures. Constr. Build. Mater. 2020, 254, 119122. [Google Scholar] [CrossRef]
- Tay, D.; Tam, C. In situ investigation of the strength of deteriorated concrete. Constr. Build. Mater. 1996, 10, 17–26. [Google Scholar] [CrossRef]
- Kowalski, R.; Wróblewska, J. Application of a Sclerometer to the Preliminary Assessment of Concrete Quality in Structures After Fire. Arch. Civ. Eng. 2018, 64, 171–186. [Google Scholar] [CrossRef]
- Panedpojaman, P.; Tonnayopas, D. Rebound hammer test to estimate compressive strength of heat exposed concrete. Constr. Build. Mater. 2018, 172, 387–395. [Google Scholar] [CrossRef]
- Murthi, P.; Poongodi, K.; Gobinath, R. Correlation between rebound hammer number and mechanical properties of steel fibre reinforced pavement quality concrete. Mater. Today Proc. 2020, 39, 142–147. [Google Scholar] [CrossRef]
- Jain, A.; Kathuria, A.; Kumar, A.; Verma, Y.; Murari, K. Combined Use of Non-Destructive Tests for Assessment of Strength of Concrete in Structure. Procedia Eng. 2013, 54, 241–251. [Google Scholar] [CrossRef]
- Galvão, J.; Flores-Colen, I.; de Brito, J.; Veiga, M. Variability of in-situ testing on rendered walls in natural ageing conditions—Rebound hammer and ultrasound techniques. Constr. Build. Mater. 2018, 170, 167–181. [Google Scholar] [CrossRef]
- Shubbar, A.; Al-Khafaji, Z.; Nasr, M.; Falah, M. Using non-destructive tests for evaluating flyover footbridge: Case study. Knowl. Based Eng. Sci. 2020, 1, 23–39. [Google Scholar] [CrossRef]
- Dérobert, X.; Aubagnac, C.; Abraham, O. Comparison of NDT techniques on a post-tensioned beam before its autopsy. NDT E Int. 2002, 35, 541–548. [Google Scholar] [CrossRef]
- Mezgeen, A.R.; Serhan, S. Ozgur Eren Comparison between Static and Dynamic Seismic Performance Analysis of Reinforced Concrete Structure through a Case Study of “Seaside Hotel”. In Proceedings of the 1st International Conference on Engineering and Innovative Technology, SU-ICEIT 2016, Kurdistan, Iraq, 12–14 April 2016; Volume 28, pp. 96–103. [Google Scholar] [CrossRef]
- Agred, K.; Klysz, G.; Balayssac, J.-P. Location of reinforcement and moisture assessment in reinforced concrete with a double receiver GPR antenna. Constr. Build. Mater. 2018, 188, 1119–1127. [Google Scholar] [CrossRef]
- James, A.; Bazarchi, E.; Chiniforush, A.A.; Aghdam, P.P.; Hosseini, M.R.; Akbarnezhad, A.; Martek, I.; Ghodoosi, F. Rebar corrosion detection, protection, and rehabilitation of reinforced concrete structures in coastal environments: A review. Constr. Build. Mater. 2019, 126, 1026–1039. [Google Scholar] [CrossRef]
- Yücel, O. Ferroscan and radar based detection and analysis technologies for non-destructive testing. In Proceedings of the SMAR 2015—Third Conference on Smart Monitoring, Assesment and Rehabilitation of Civil Structures, Antalya, Turkey, 7–9 September 2015. [Google Scholar]
- Rasol, M. Seismic Performance Assessment and Strengthening of a Multi-Story RC Building through a Case Study of “Seaside Hotel”; Eastern Mediterranean University (EMU): Famagusta, Cyprus, 2014. [Google Scholar]
- Lee, Y.-J.; Lee, J.-R.; Ihn, J.-B. Composite repair patch evaluation using pulse-echo laser ultrasonic correlation mapping method. Compos. Struct. 2018, 204, 395–401. [Google Scholar] [CrossRef]
- Simonin, J.M.; Villain, G. Detection and Survey of Interface Defects within a Pavement Structure with Ultrasonic Pulse Echo. In RILEM Bookseries; Springer: Maastricht, The Netherlands, 2016; Volume 13, pp. 673–678. [Google Scholar]
- Krause, M.; Bärmann, M.; Frielinghaus, R.; Kretzschmar, F.; Kroggel, O.; Langenberg, K.; Maierhofer, C.; Müller, W.; Neisecke, J.; Schickert, M.; et al. Comparison of pulse-echo methods for testing concrete. NDT E Int. 1997, 30, 195–204. [Google Scholar] [CrossRef]
- Chen, H.; Nie, X.; Gan, S.; Zhao, Y.; Qiu, H. Interfacial imperfection detection for steel-concrete composite structures using NDT techniques: A state-of-the-art review. Eng. Struct. 2021, 245, 112778. [Google Scholar] [CrossRef]
- Laureti, S.; Ricci, M.; Mohamed, M.; Senni, L.; Davis, L.; Hutchins, D. Detection of rebars in concrete using advanced ultrasonic pulse compression techniques. Ultrasonics 2017, 85, 31–38. [Google Scholar] [CrossRef]
- Ito, Y.; Uomoto, T. Nondestructive testing method of concrete using impact acoustics. NDT E Int. 1997, 30, 217–222. [Google Scholar] [CrossRef]
- Janků, M.; Cikrle, P.; Grošek, J.; Anton, O.; Stryk, J. Comparison of infrared thermography, ground-penetrating radar and ultrasonic pulse echo for detecting delaminations in concrete bridges. Constr. Build. Mater. 2019, 225, 1098–1111. [Google Scholar] [CrossRef]
- Andrade, C.; Alonso, C.; Molina, F.J. Cover cracking as a function of bar corrosion: Part I-Experimental test. Mater. Struct. 1993, 26, 453–464. [Google Scholar] [CrossRef]
- Miró, M.; Eiras, J.; Poveda, P.; Climent, M.; Ramis, J. Detecting cracks due to steel corrosion in reinforced cement mortar using intermodulation generation of ultrasonic waves. Constr. Build. Mater. 2021, 286, 122915. [Google Scholar] [CrossRef]
- Fritsch, C.; Veca, A. Detecting small flaws near the interface in pulse-echo. Ultrasonics 2004, 42, 797–801. [Google Scholar] [CrossRef]
- Huang, Y.; Turner, J.A.; Song, Y.; Ni, P.; Li, X. Enhanced ultrasonic detection of near-surface flaws using transverse-wave backscatter. Ultrasonics 2019, 98, 20–27. [Google Scholar] [CrossRef]
- Khalili, M.; Karakouzian, M. Feasibility of ultrasonic measurements for characterizing rheological properties of asphalt binders. Constr. Build. Mater. 2015, 75, 220–226. [Google Scholar] [CrossRef]
- Liu, X.; Sun, D.; Liu, D.; Meng, K.; Ni, C.; Shao, Z.; Sun, L. Simulation of ultrasonic propagation in porous cellular concrete materials. Constr. Build. Mater. 2021, 285, 122852. [Google Scholar] [CrossRef]
- Choi, W.Y.; Park, K.K. Array type miniaturized ultrasonic sensors to detect urban sinkholes. Measurement 2019, 141, 371–379. [Google Scholar] [CrossRef]
- Seo, H.; Lee, K.; Jhang, K.-Y. In-Line Ultrasonic Monitoring for Sediments Stuck on Inner Wall of a Polyvinyl Chloride Pipe. Sci. World J. 2014, 2014, 731621. [Google Scholar] [CrossRef] [PubMed]
- Álvarez-Arenas, T.G.; Camacho, J. Air-Coupled and Resonant Pulse-Echo Ultrasonic Technique. Sensors 2019, 19, 2221. [Google Scholar] [CrossRef] [PubMed]
- Pospisil, K.; Manychova, M.; Stryk, J.; Korenska, M.; Matula, R.; Svoboda, V. Diagnostics of Reinforcement Conditions in Concrete Structures by GPR, Impact-Echo Method and Metal Magnetic Memory Method. Remote Sens. 2021, 13, 952. [Google Scholar] [CrossRef]
- Jiang, Z.Y.; Ponniah, J.; Cascante, G. Field condition assessment of longitudinal joints in asphalt pavements using seismic wave technology. In Proceedings of the TAC/ATC 2008—2008 Annual Conference and Exhibition of the Transportation Association of Canada: Transportation—A Key to a Sustainable Future, Toronto, ON, Canada, 21–24 September 2008; Volume 2124. [Google Scholar]
- Xiong, C.; Yu, J.; Zhang, X. Use of NDT systems to investigate pavement reconstruction needs and improve maintenance treatment decision-making. Int. J. Pavement Eng. 2021, 1–15. [Google Scholar] [CrossRef]
- Lin, S.-J.; Liu, T.-Y.; Chou, N.N.; Chen, P.-H.; Liao, C.-L. Soil Improvement and Inspection Techniques for the Base Course of Rigid Pavement for an Airport Runway. J. Perform. Constr. Facil. 2021, 35, 06021001. [Google Scholar] [CrossRef]
- Chen, D.-H.; Bilyeu, J.; Scullion, T.; Nazarian, S.; Chiu, C.-T. Failure Investigation of a Foamed-Asphalt Highway Project. J. Infrastruct. Syst. 2006, 12, 33–40. [Google Scholar] [CrossRef]
- Chen, D.H.; Scullion, T. Forensic Investigations of Roadway Pavement Failures. J. Perform. Constr. Facil. 2008, 22, 35–44. [Google Scholar] [CrossRef]
- Chen, D.-H.; Si, Z.; Saribudak, M. Roadway Heaving Caused by High Organic Matter. J. Perform. Constr. Facil. 2009, 23, 100–108. [Google Scholar] [CrossRef]
- Zegeye-Teshale, E.; Calhoon, T.; Johnson, E.; Dai, S. Application of Advanced Multi-Sensor Non-Destructive Testing System for the Evaluation of Pavements Affected by Transverse Crack-Heaving. Transp. Res. Rec. J. Transp. Res. Board 2021, 2675, 1149–1162. [Google Scholar] [CrossRef]
- Li, M.; Anderson, N.; Sneed, L.; Torgashov, E. Condition assessment of concrete pavements using both ground penetrating radar and stress-wave based techniques. J. Appl. Geophys. 2016, 135, 297–308. [Google Scholar] [CrossRef]
- Razak, N.A.; Senin, S.F.; Hamid, R. Detection of Sizes and Locations Air Voids in Reinforced Concrete Slab using Ground Penetrating Radar and Impact-Echo Methods. J. Teknol. 2015, 74, 4553. [Google Scholar] [CrossRef]
- Maser, K.; Martino, N.; Doughty, J.; Birken, R. Understanding and Detecting Bridge Deck Deterioration with Ground-Penetrating Radar. Transp. Res. Rec. J. Transp. Res. Board 2012, 2313, 116–123. [Google Scholar] [CrossRef]
- Robison, T.W.; Barnes, C.L.; Tinkey, Y.; Tanner, J.E. Evaluating Concrete Damage in Bridge Decks with and without Overlays Using Nondestructive Testing Procedures. J. Test. Evaluation 2019, 48, 20180555. [Google Scholar] [CrossRef]
- Scott, M.; Rezaizadeh, A.; Delahaza, A.; Santos, C.; Moore, M.; Graybeal, B.; Washer, G. A comparison of nondestructive evaluation methods for bridge deck assessment. NDT E Int. 2003, 36, 245–255. [Google Scholar] [CrossRef]
- Slabej, M.; Grinč, M.; Kováč, M.; Decký, M.; Šedivý, Š. Non-invasive diagnostic methods for investigating the quality of Zilina airport’s runway. Contrib. Geophys. Geod. 2015, 45, 237–254. [Google Scholar] [CrossRef]
- Abu Dabous, S.; Yaghi, S.; Alkass, S.; Moselhi, O. Concrete bridge deck condition assessment using IR Thermography and Ground Penetrating Radar technologies. Autom. Constr. 2017, 81, 340–354. [Google Scholar] [CrossRef]
- Omar, T.; Nehdi, M.L.; Zayed, T. Rational Condition Assessment of RC Bridge Decks Subjected to Corrosion-Induced Delamination. J. Mater. Civ. Eng. 2018, 30, 04017259. [Google Scholar] [CrossRef]
- Kushwaha, S.K.P.; Raghavendra, S.; Pande, H.; Agrawal, S. Analysis and Integration of Surface and Subsurface Information of Different Bridges. J. Indian Soc. Remote Sens. 2019, 48, 315–331. [Google Scholar] [CrossRef]
- Baek, J.; Al-Qadi, I.L.; Xie, W.; Buttlar, W.G. In Situ Assessment of Interlayer Systems to Abate Reflective Cracking in Hot-Mix Asphalt Overlays. Transp. Res. Rec. J. Transp. Res. Board 2008, 2084, 104–113. [Google Scholar] [CrossRef]
- Diallo, M.C.; Cheng, L.Z.; Rosa, E.; Gunther, C.; Chouteau, M. Integrated GPR and ERT data interpretation for bedrock identification at Cléricy, Québec, Canada. Eng. Geol. 2018, 248, 230–241. [Google Scholar] [CrossRef]
- Miśkiewicz, M.; Daszkiewicz, K.; Lachowicz, J.; Tysiac, P.; Jaskula, P.; Wilde, K. Nondestructive methods complemented by FEM calculations in diagnostics of cracks in bridge approach pavement. Autom. Constr. 2021, 128, 103753. [Google Scholar] [CrossRef]
- Wiwatrojanagul, P.; Sahamitmongkol, R.; Tangtermsirikul, S. A method to detect lap splice in reinforced concrete using a combination of covermeter and GPR. Constr. Build. Mater. 2018, 173, 481–494. [Google Scholar] [CrossRef]
- De Giorgi, L.; Leucci, G. Detection of Hazardous Cavities Below a Road Using Combined Geophysical Methods. Surv. Geophys. 2014, 35, 1003–1021. [Google Scholar] [CrossRef]
- Orlando, L.; Cardarelli, E.; Cercato, M.; De Donno, G.; Di Giambattista, L. Pavement testing by integrated geophysical methods: Feasibility, resolution and diagnostic potential. J. Appl. Geophys. 2017, 136, 462–473. [Google Scholar] [CrossRef]
- Shrestha, S.; Katicha, S.W.; Flintsch, G.W.; Thyagarajan, S. Application of Traffic Speed Deflectometer for Network-Level Pavement Management. Transp. Res. Rec. J. Transp. Res. Board 2018, 2672, 348–359. [Google Scholar] [CrossRef]
- D’Amico, F.; Ciampoli, L.B.; Di Benedetto, A.; Bertolini, L.; Napolitano, A. Integrating Non-Destructive Surveys into a Preliminary BIM-Oriented Digital Model for Possible Future Application in Road Pavements Management. Infrastructures 2022, 7, 10. [Google Scholar] [CrossRef]
- La, H.M.; Gucunski, N.; Kee, S.-H.; Van Nguyen, L. Data analysis and visualization for the bridge deck inspection and evaluation robotic system. Vis. Eng. 2015, 3, 6. [Google Scholar] [CrossRef]
- Gucunski, N.; Basily, B.; Kim, J.; Yi, J.; Duong, T.; Dinh, K.; Kee, S.-H.; Maher, A. RABIT: Implementation, performance validation and integration with other robotic platforms for improved management of bridge decks. Int. J. Intell. Robot. Appl. 2017, 1, 271–286. [Google Scholar] [CrossRef]
- Gibb, S.; La, H.M.; Le, T.; Nguyen, L.; Schmid, R.; Pham, H. Nondestructive evaluation sensor fusion with autonomous robotic system for civil infrastructure inspection. J. Field Robot. 2018, 35, 988–1004. [Google Scholar] [CrossRef]
- Dong, Z.; Ye, S.; Gao, Y.; Fang, G.; Zhang, X.; Xue, Z.; Zhang, T. Rapid Detection Methods for Asphalt Pavement Thicknesses and Defects by a Vehicle-Mounted Ground Penetrating Radar (GPR) System. Sensors 2016, 16, 2067. [Google Scholar] [CrossRef]
- Gao, Y.; Qian, S.; Li, Z.; Wang, P.; Wang, F.; He, Q. Digital Twin and Its Application in Transportation Infrastructure. In Proceedings of the IEEE International Conference on Digital Twins & Parallel Intelligence, Beijing, China, 15 July–15 August 2021; pp. 298–301. [Google Scholar] [CrossRef]
- Madni, A.M.; Madni, C.C.; Lucero, S.D. Leveraging Digital Twin Technology in Model-Based Systems Engineering. Systems 2019, 7, 7. [Google Scholar] [CrossRef] [Green Version]
Figure 1.
Main contributions of this review study (GPR combined with other NDTs and pavement damages covered).
Figure 1.
Main contributions of this review study (GPR combined with other NDTs and pavement damages covered).

Figure 2.
Examples of superficial distresses in both flexible (a–h) and rigid (i–l) pavements.

Figure 3.
IRT. (a) A thermographic camera mounted on an UAV and (b) examples of thermograms showing superficial pathologies in pavements (adapted from [70]).
Figure 3.
IRT. (a) A thermographic camera mounted on an UAV and (b) examples of thermograms showing superficial pathologies in pavements (adapted from [70]).

Figure 4.
LiDAR. (a) Terrestrial laser scanner (Riegl LMS Z-390i), (b) Mobile Mapper Scanner (Lynx), and (c) RGB orthoimage and Z-value orthoimage (Z or height values of the point cloud; from 0 cm (dark blue) to 35 cm (dark green)) showing pavement pathologies (adapted from [70]).
Figure 4.
LiDAR. (a) Terrestrial laser scanner (Riegl LMS Z-390i), (b) Mobile Mapper Scanner (Lynx), and (c) RGB orthoimage and Z-value orthoimage (Z or height values of the point cloud; from 0 cm (dark blue) to 35 cm (dark green)) showing pavement pathologies (adapted from [70]).

Figure 5.
The IRI. (a) Two profilometers mounted on a vehicle and (b–d) examples of roughness, MPD and IRI measurements, respectively.
Figure 5.
The IRI. (a) Two profilometers mounted on a vehicle and (b–d) examples of roughness, MPD and IRI measurements, respectively.

Figure 6.
GPR. (a) Air-coupled system, (b) array multi-channel (ground coupled) system, (c) 500 MHz radargram showing reinforcement settlement (red rectangle) and early sinkhole (red ellipse), and (d) 1 GHz radargram showing both surface cracks (white ellipses) and embedded cracks (white rectangles) [122].

Figure 7.
Falling Weight Deflectometer. (a) FWD scheme, (b) two different FWD devices, and (c) example of FWD measured deflections on a road section [136].
Figure 7.
Falling Weight Deflectometer. (a) FWD scheme, (b) two different FWD devices, and (c) example of FWD measured deflections on a road section [136].

Figure 8.
Passive Seismic Interferometry method. (a) Seismic passive test on site, (b) display screen of seismic passive test, and (c) seismograph.
Figure 8.
Passive Seismic Interferometry method. (a) Seismic passive test on site, (b) display screen of seismic passive test, and (c) seismograph.

Figure 9.
A scheme for Wenner array.

Figure 10.
Two different methods exhibited in [154]: (a) the pole electrode method (PEM), and (b) the flat electrode method (FEM).
Figure 10.
Two different methods exhibited in [154]: (a) the pole electrode method (PEM), and (b) the flat electrode method (FEM).

Figure 11.
GPR profile (top) showing saturated/contaminated area surrounded by red dots, and the corresponding ERT profile (bottom) surrounded by black dots [165].
Figure 11.
GPR profile (top) showing saturated/contaminated area surrounded by red dots, and the corresponding ERT profile (bottom) surrounded by black dots [165].

Figure 12.
Rebound hammer typical scheme [167].
Figure 12.
Rebound hammer typical scheme [167].

Figure 13.
Covermeter (Ferroscan) and site scanning. (a) Scanning in vertical direction, (b) scanning in horizontal direction including Ferroscan device, and (c) a typical sample of a Ferroscan image for steel reinforcement details [177,181].

Figure 14.
Pulse-echo ultrasound technique scheme [196].
Figure 14.
Pulse-echo ultrasound technique scheme [196].

Figure 15.
Flowchart for the search method.

Figure 16.
Number of related publications reviewed in this work (122 selection), per year since 1993.
Figure 16.
Number of related publications reviewed in this work (122 selection), per year since 1993.

Figure 17.
Publications reviewed in this work categorized by their type as stated in the Scopus database.
Figure 17.
Publications reviewed in this work categorized by their type as stated in the Scopus database.

Figure 18.
Number of relevant publications (122 selection) per publisher since 1993.


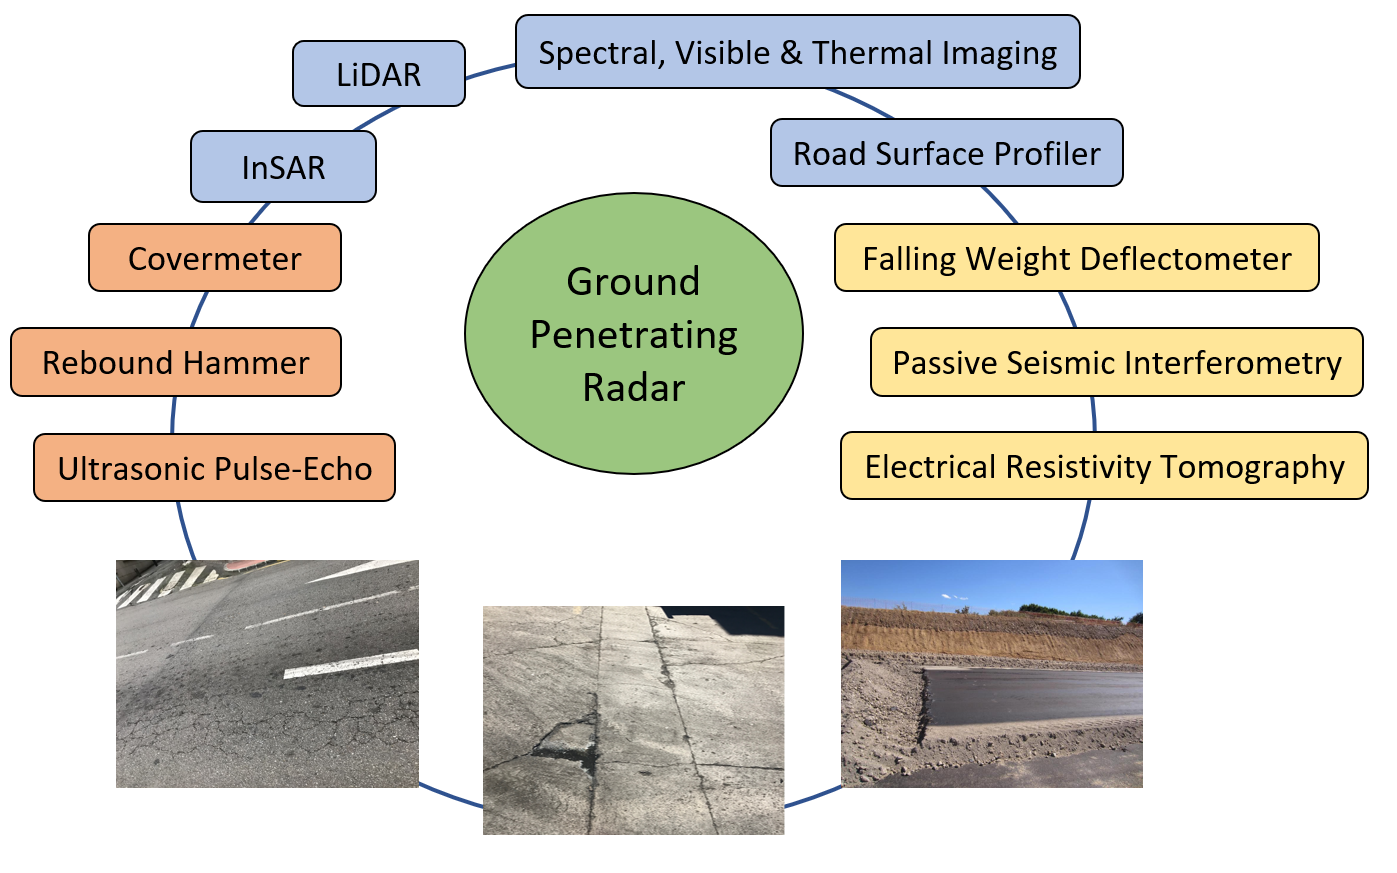
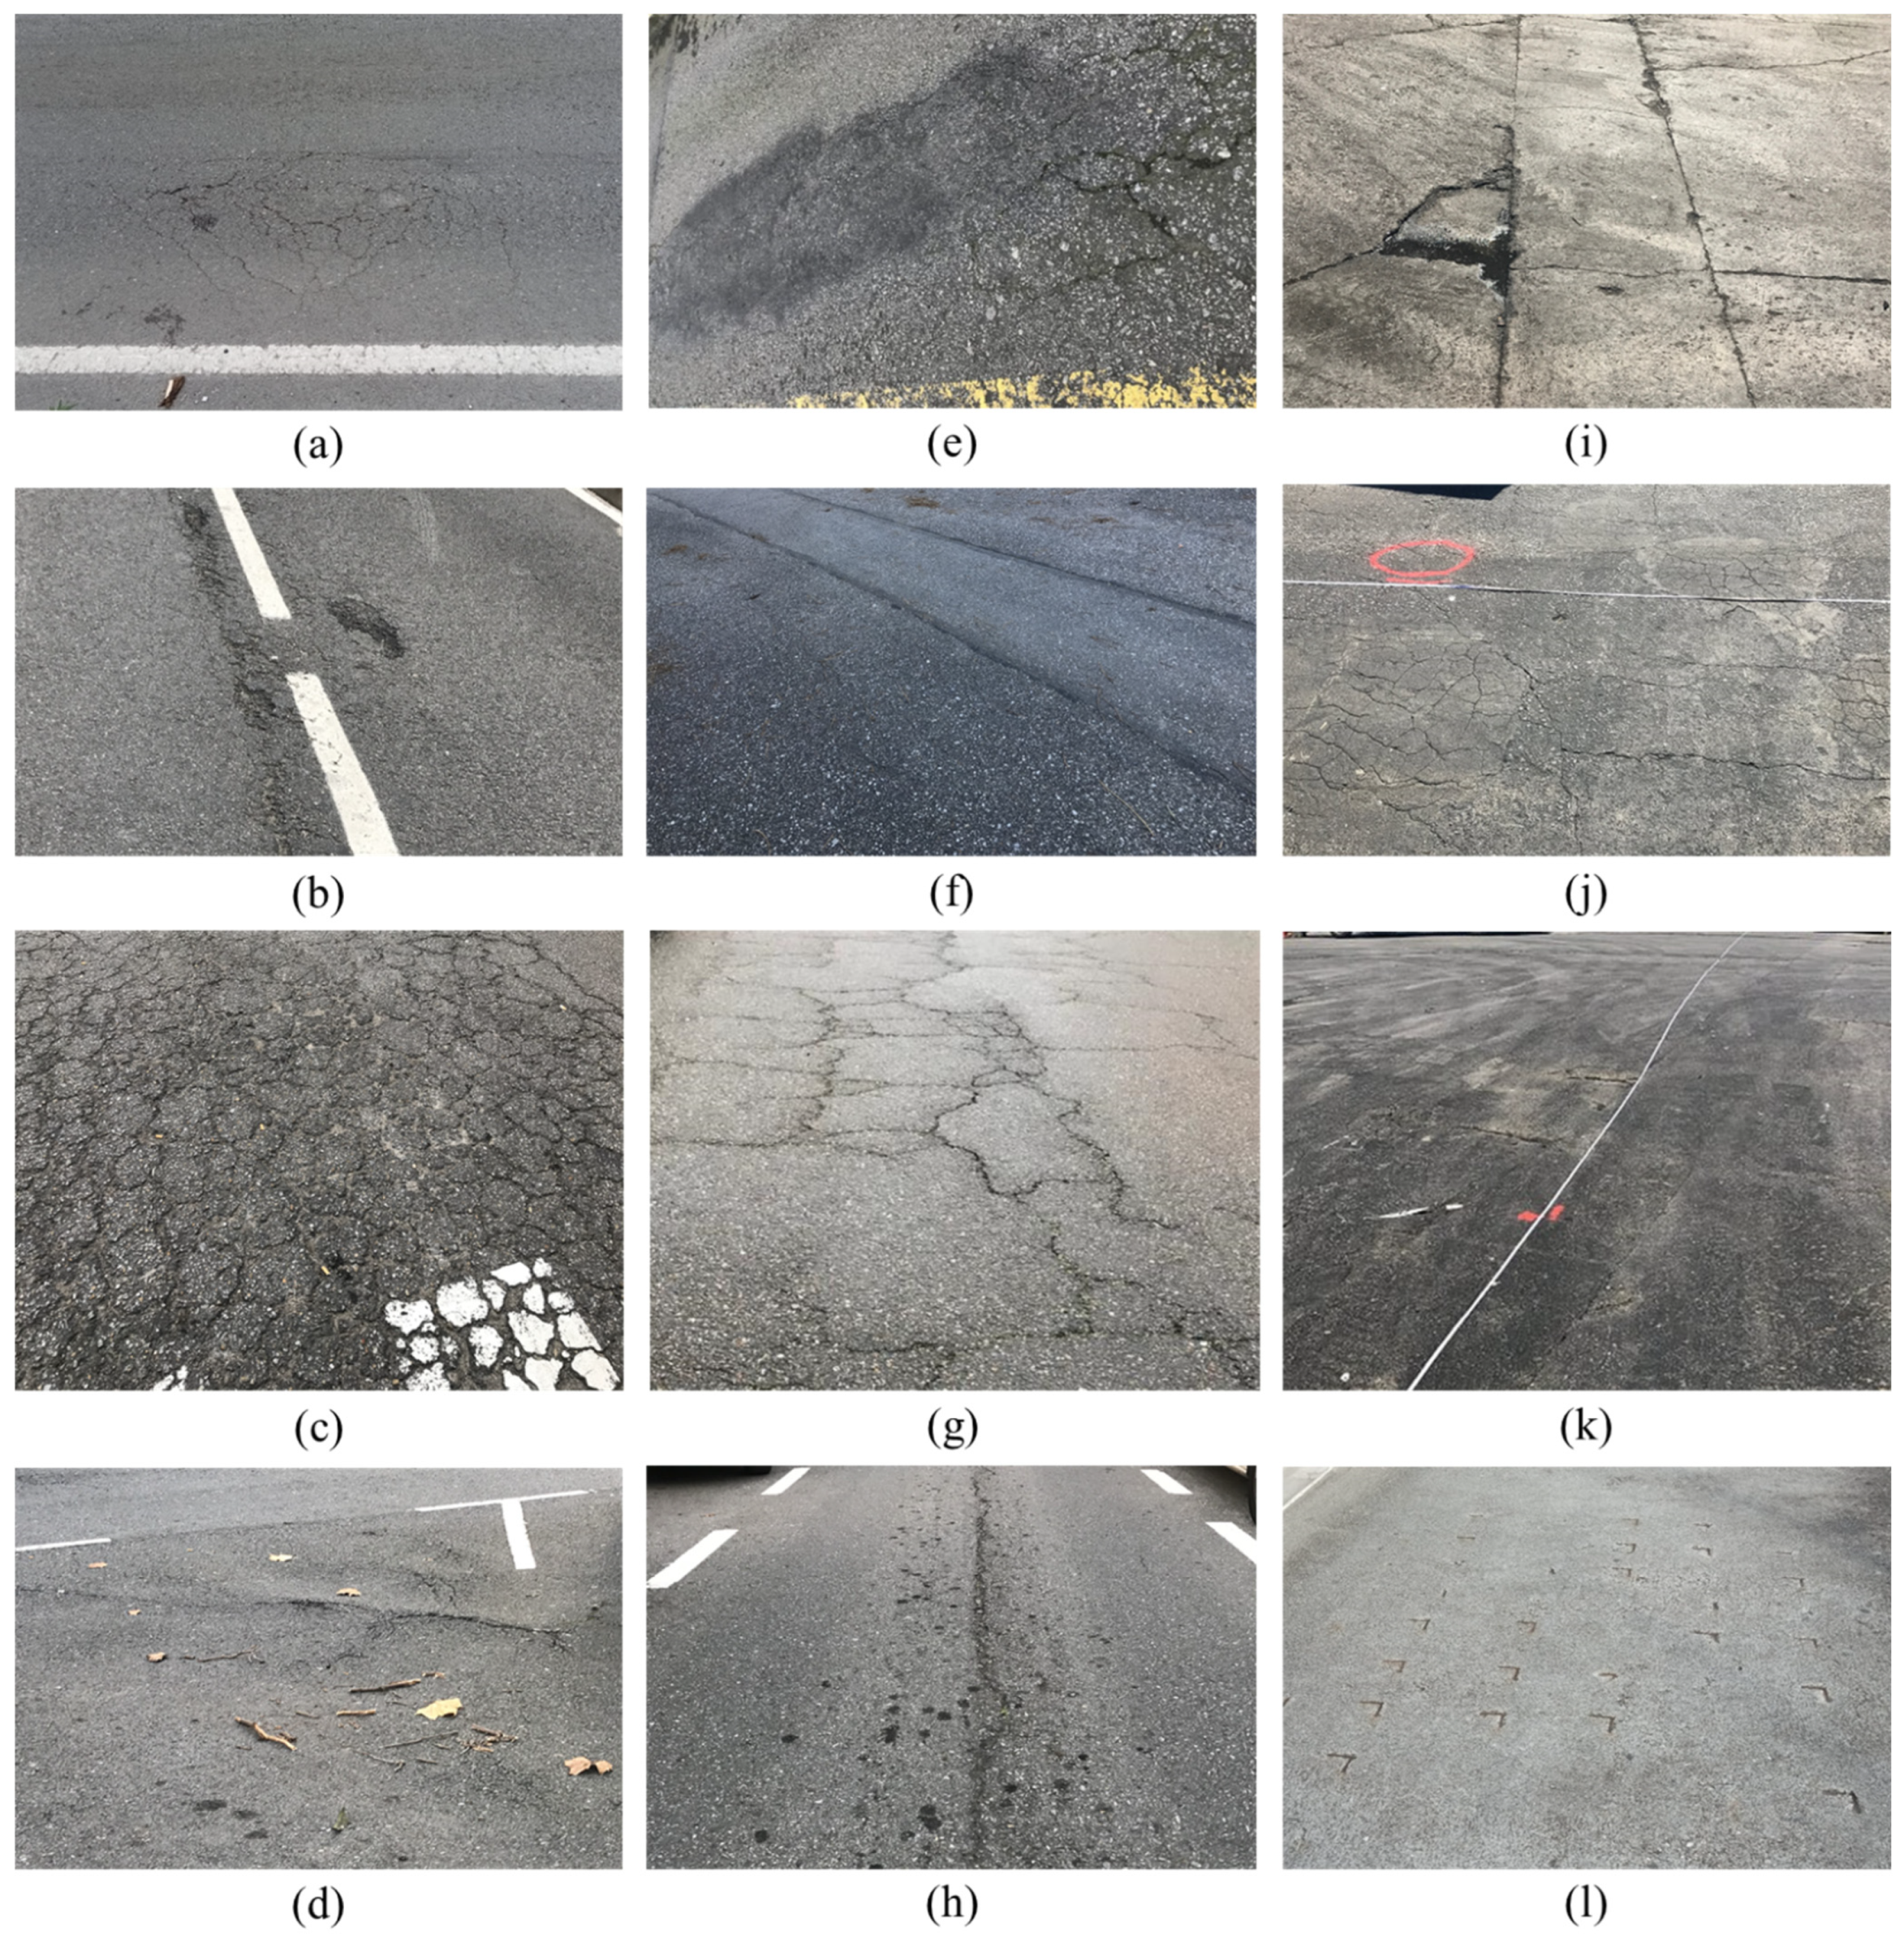
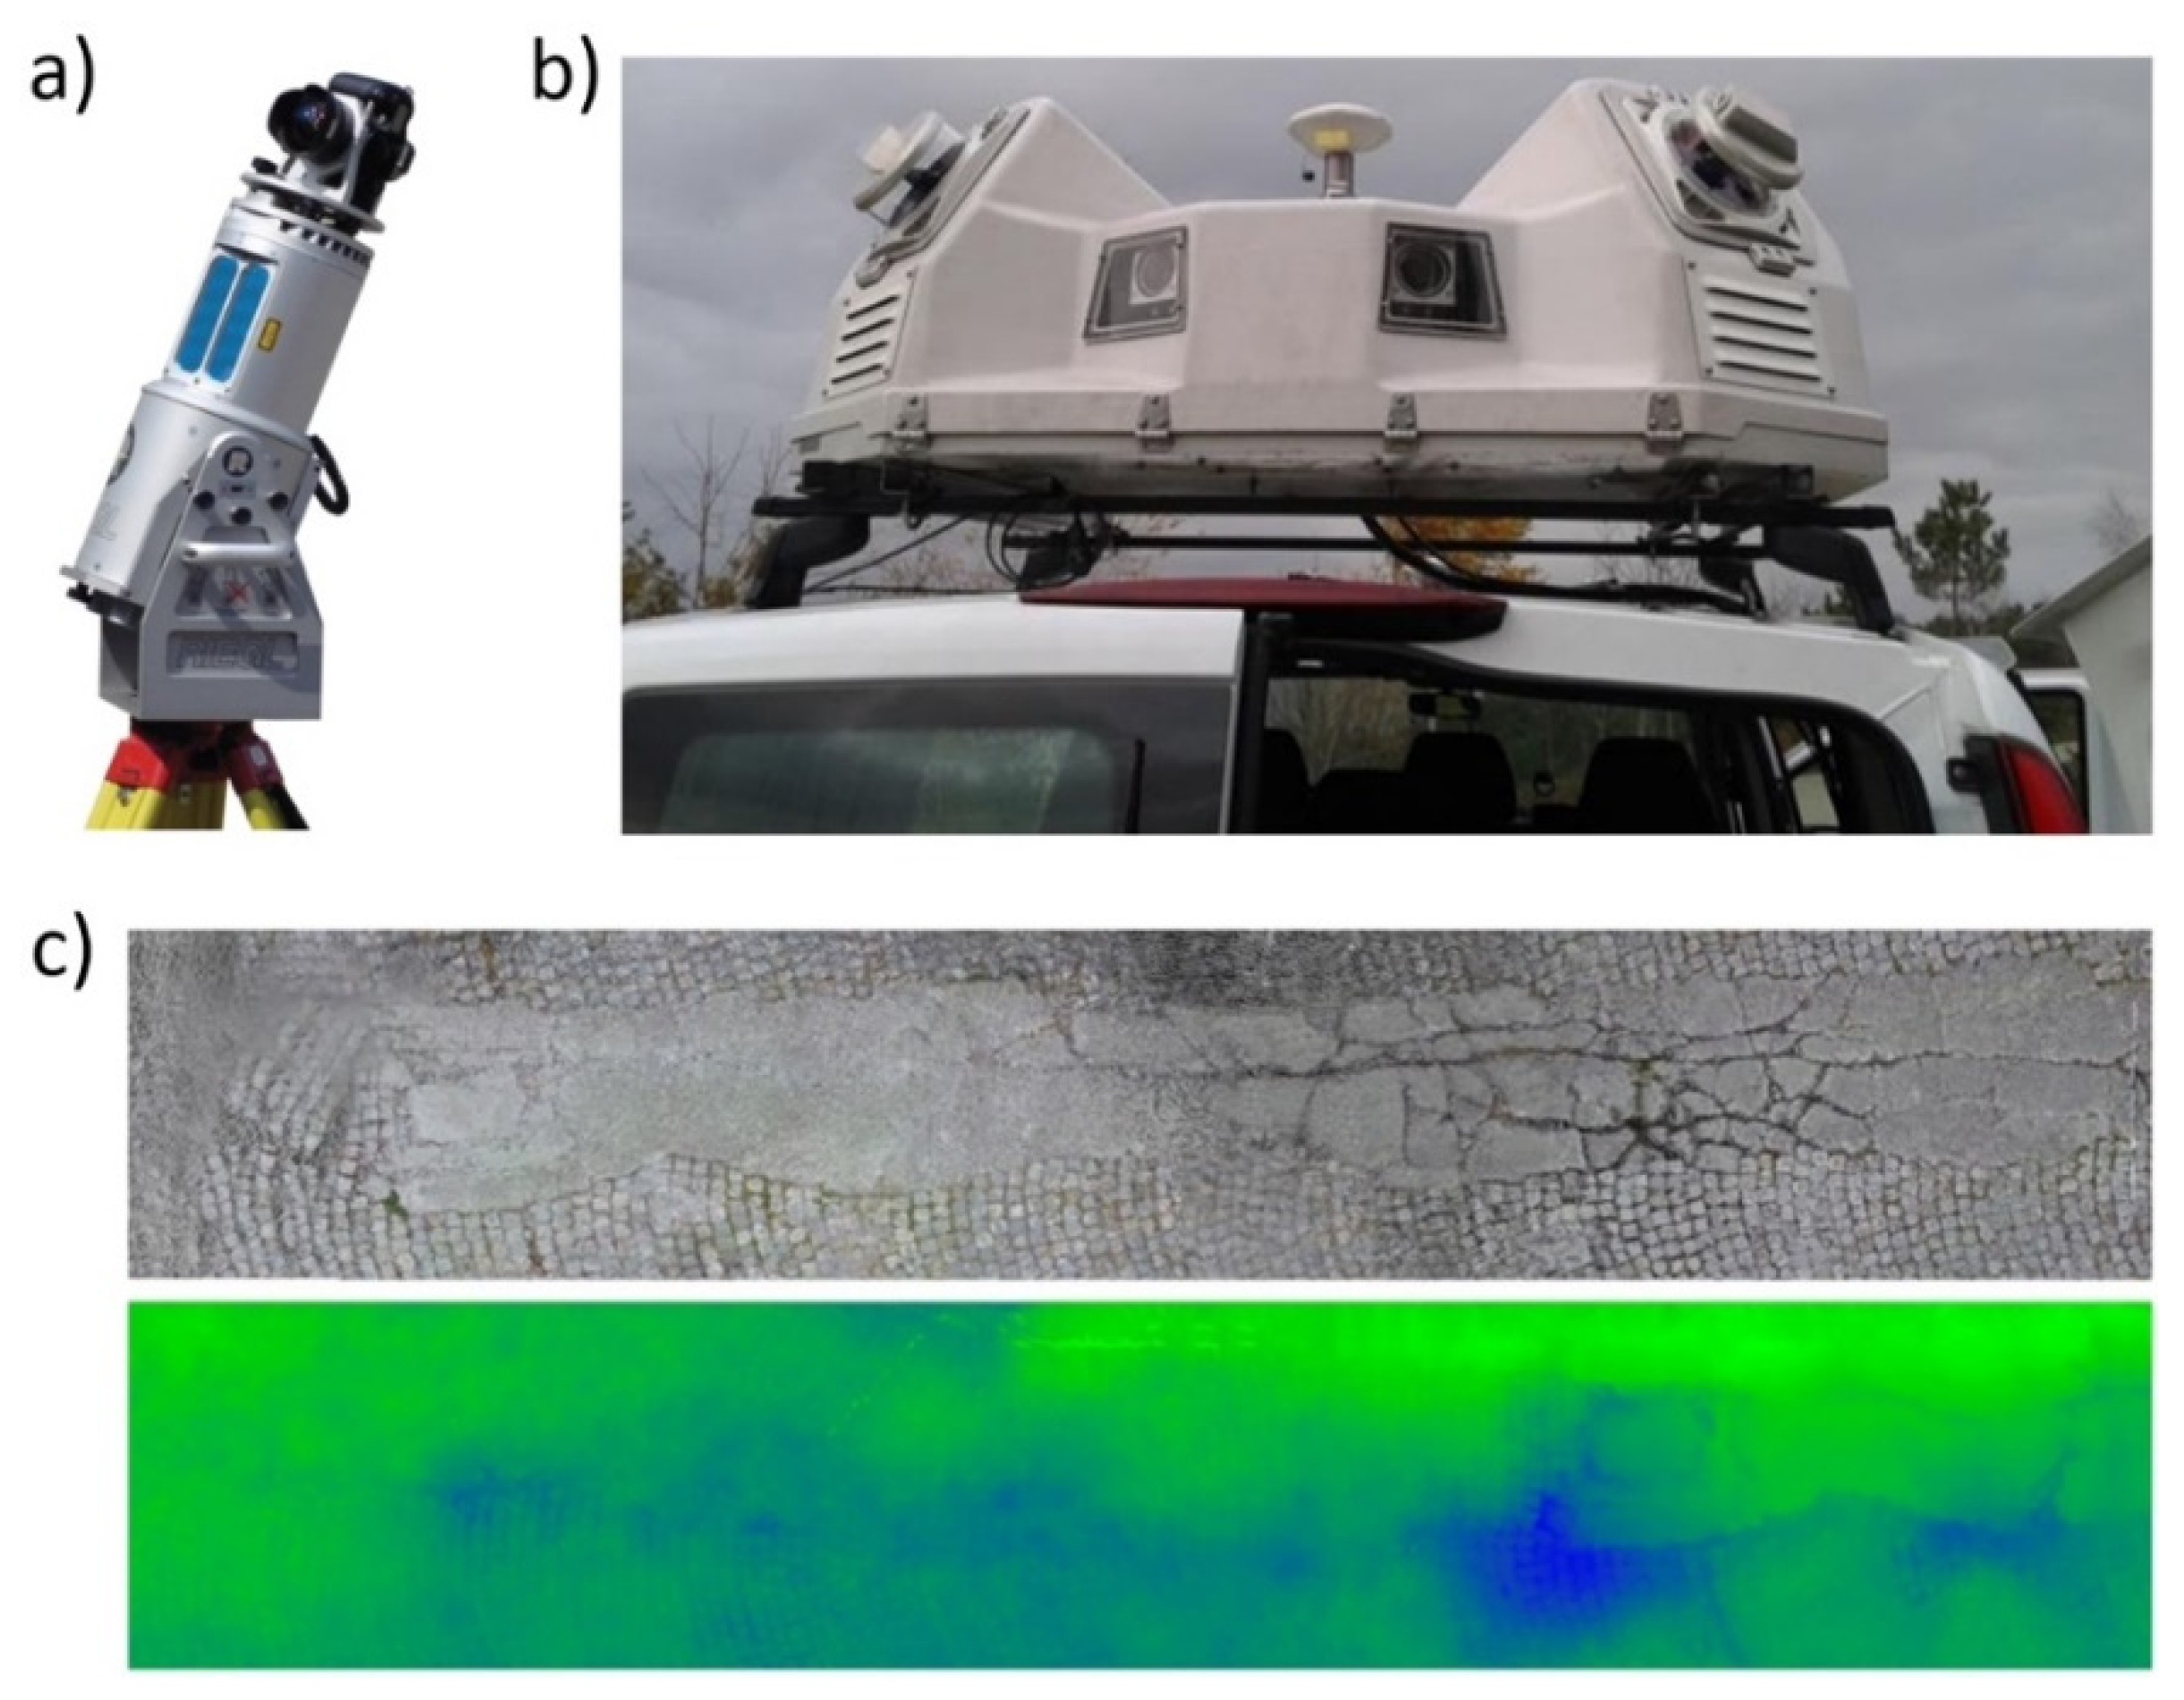
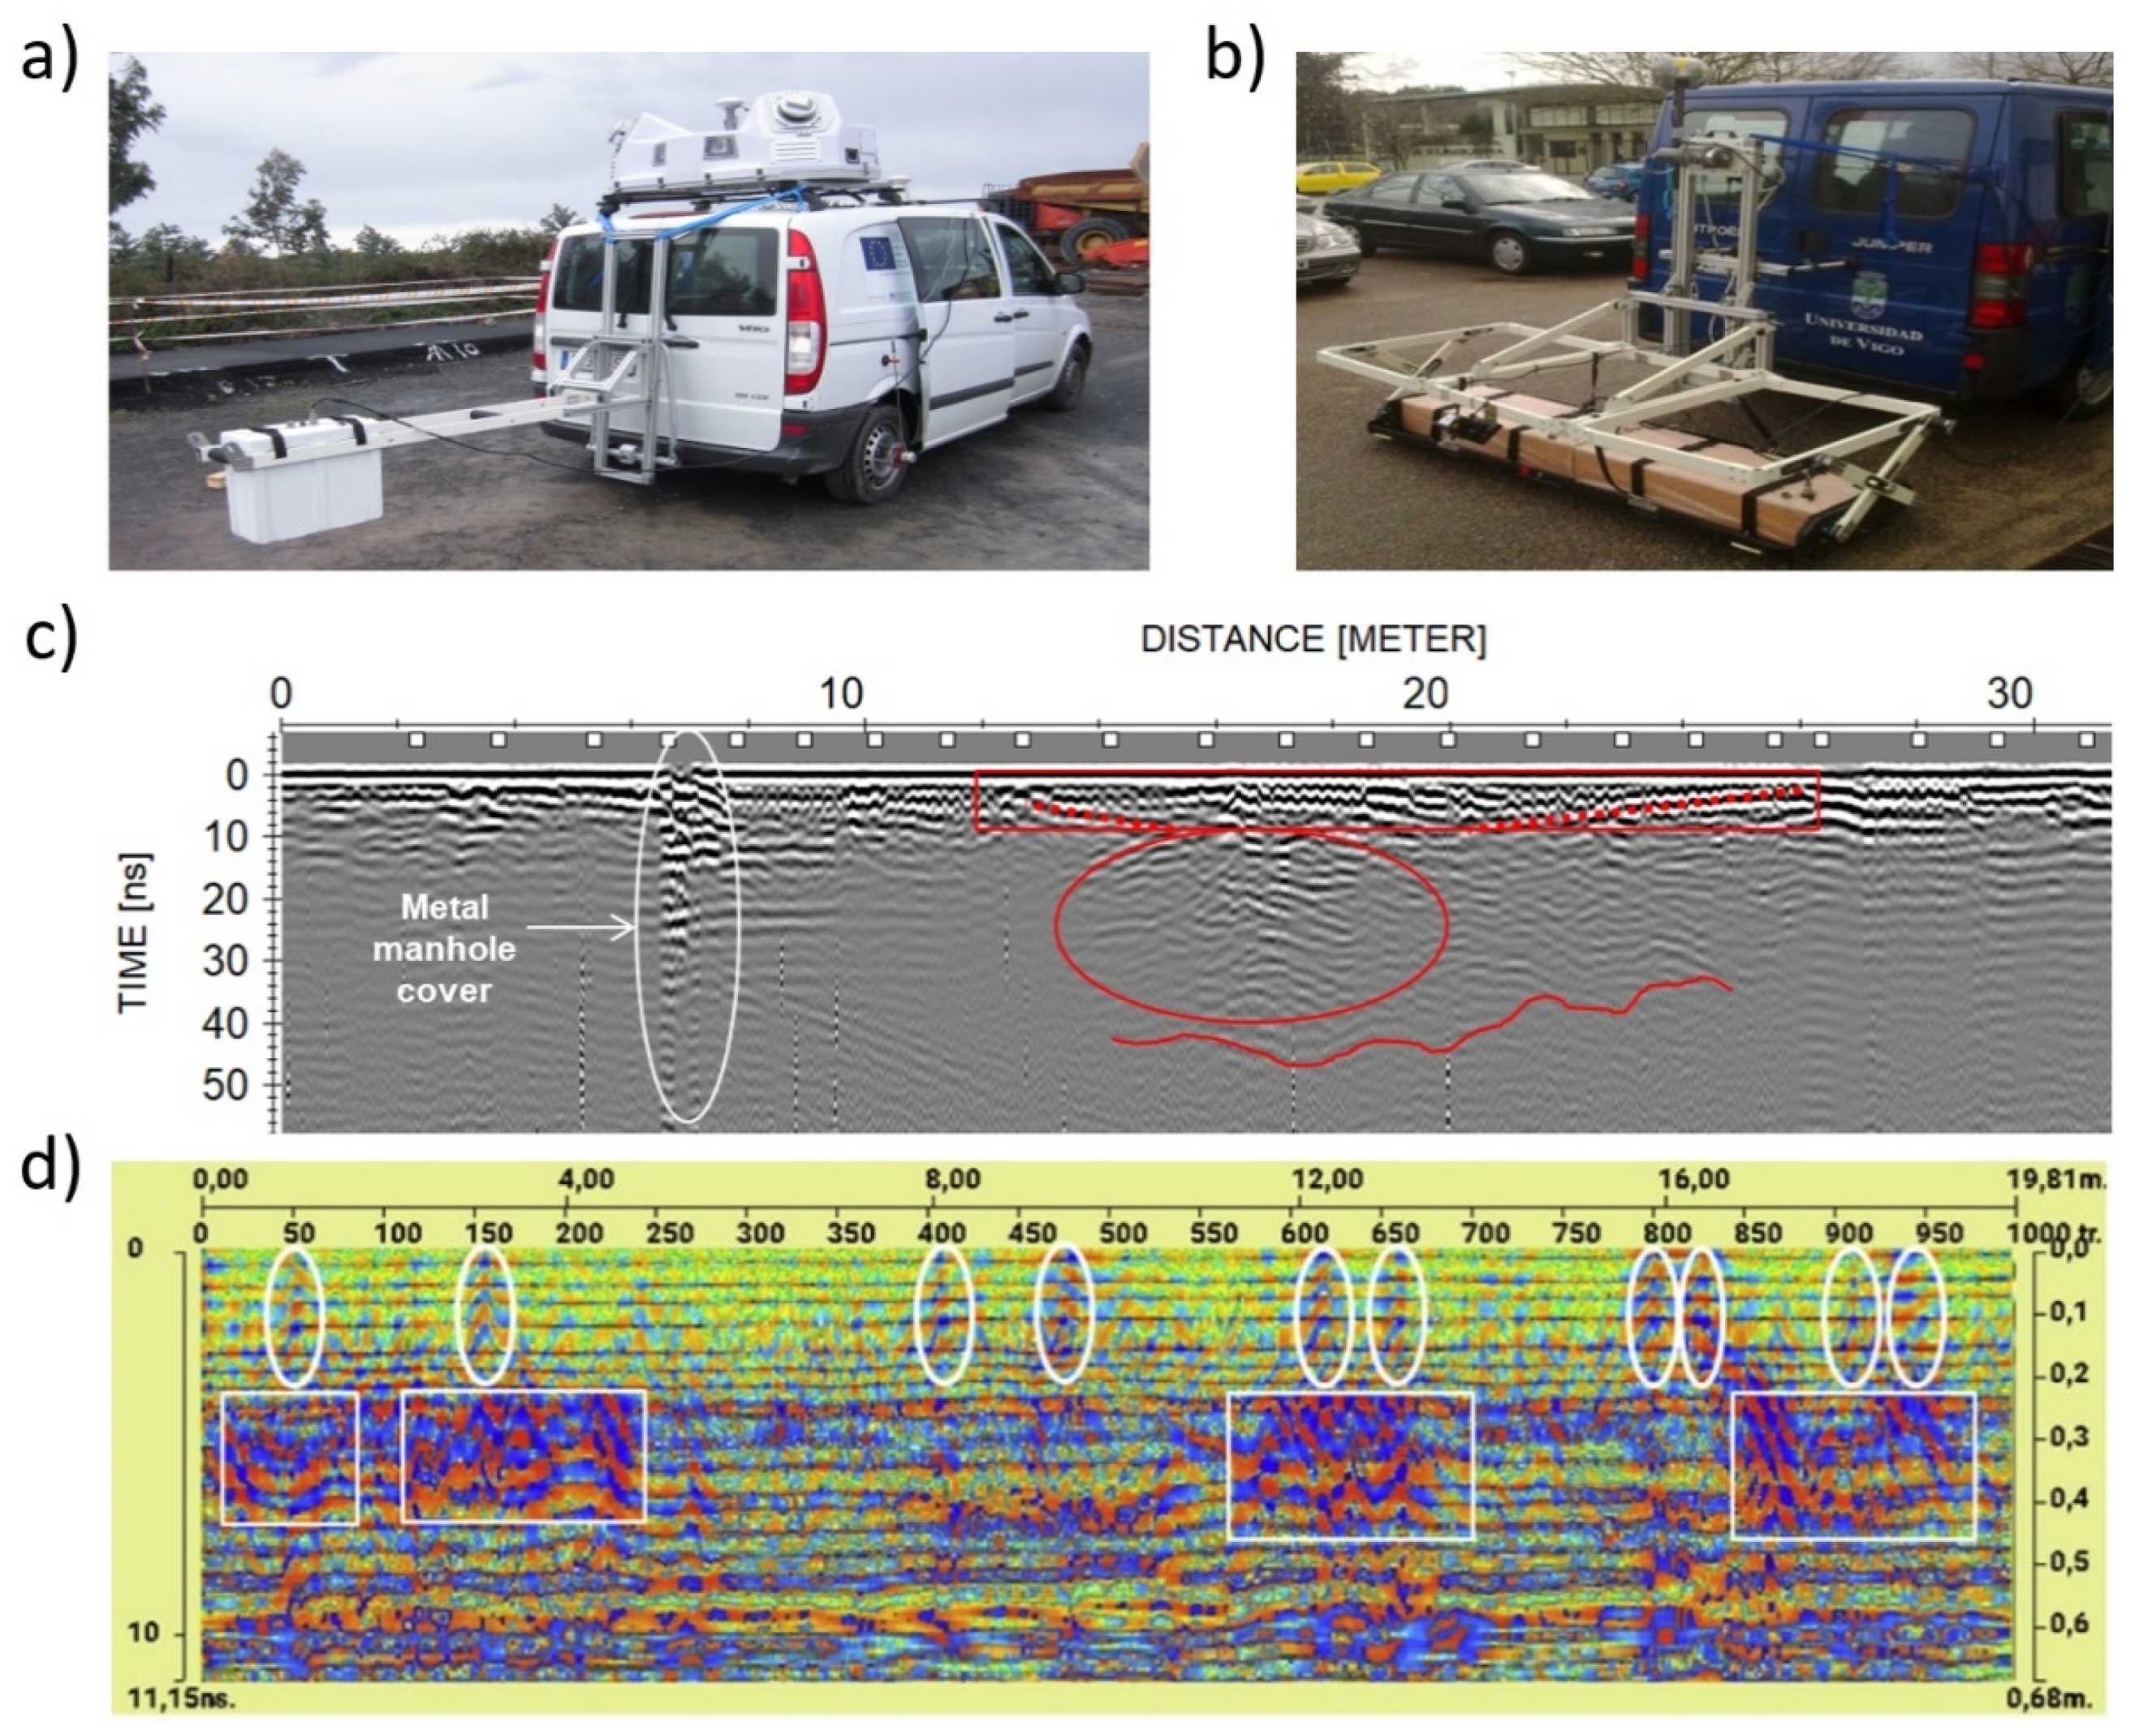
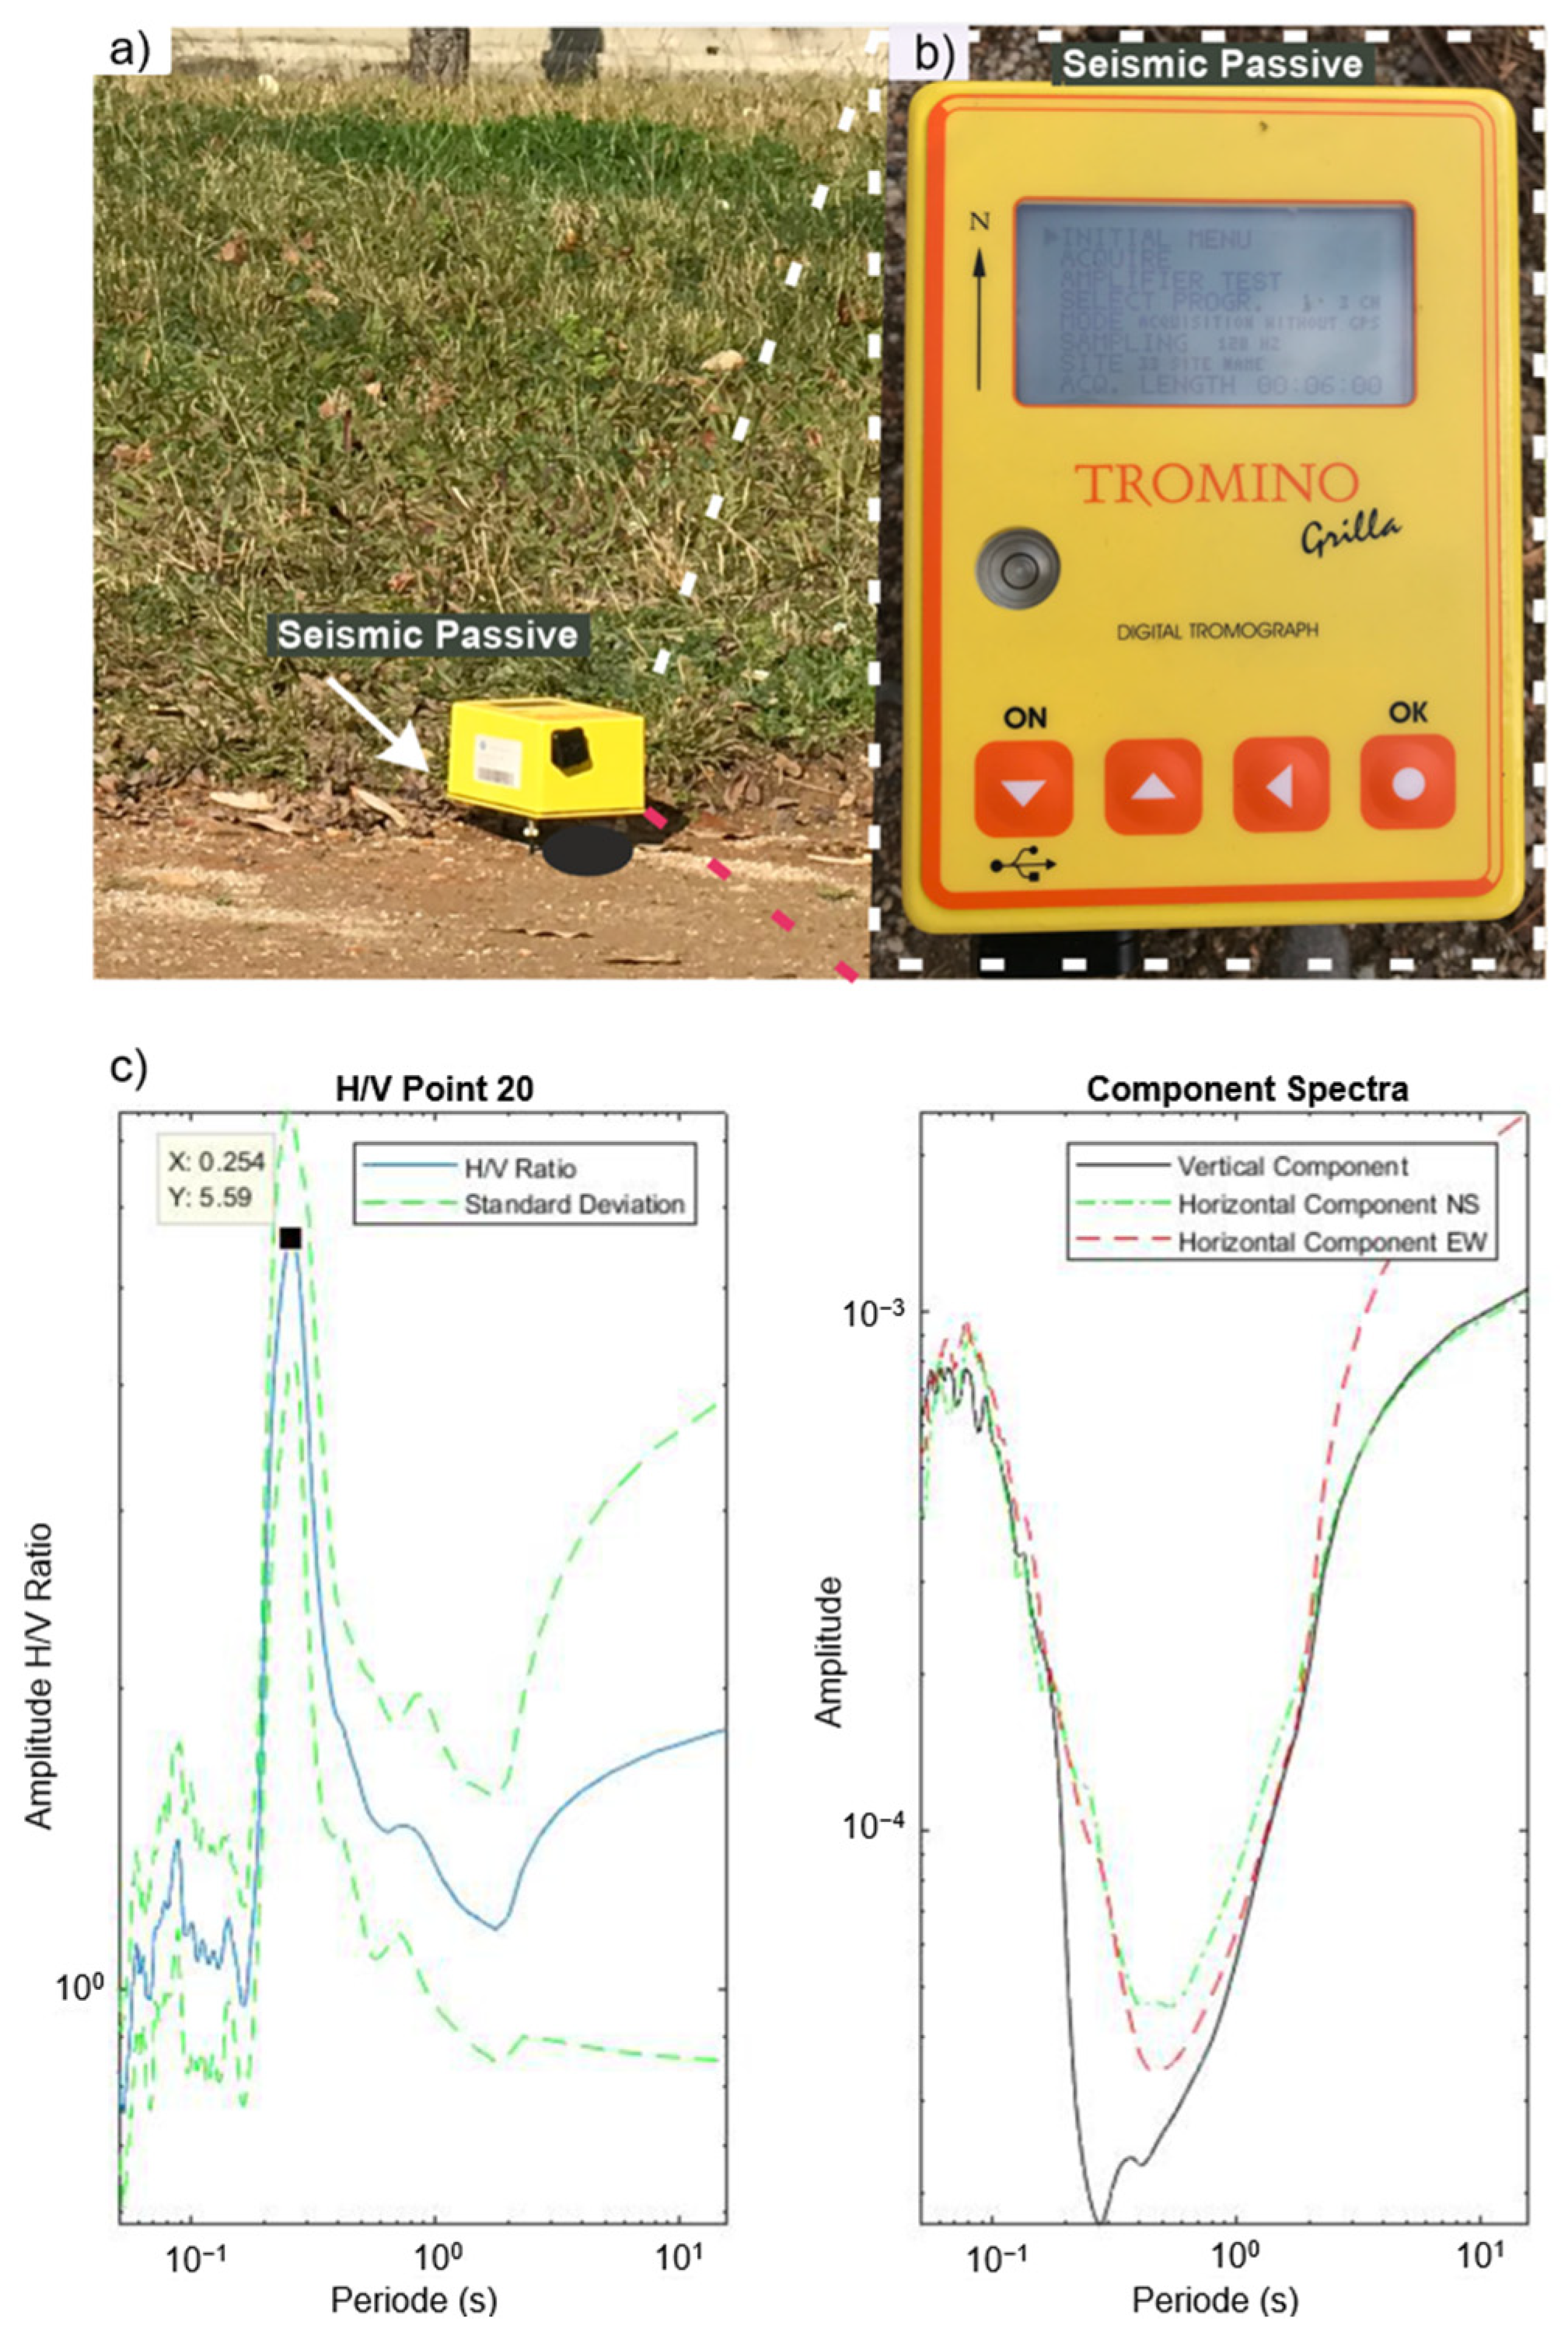
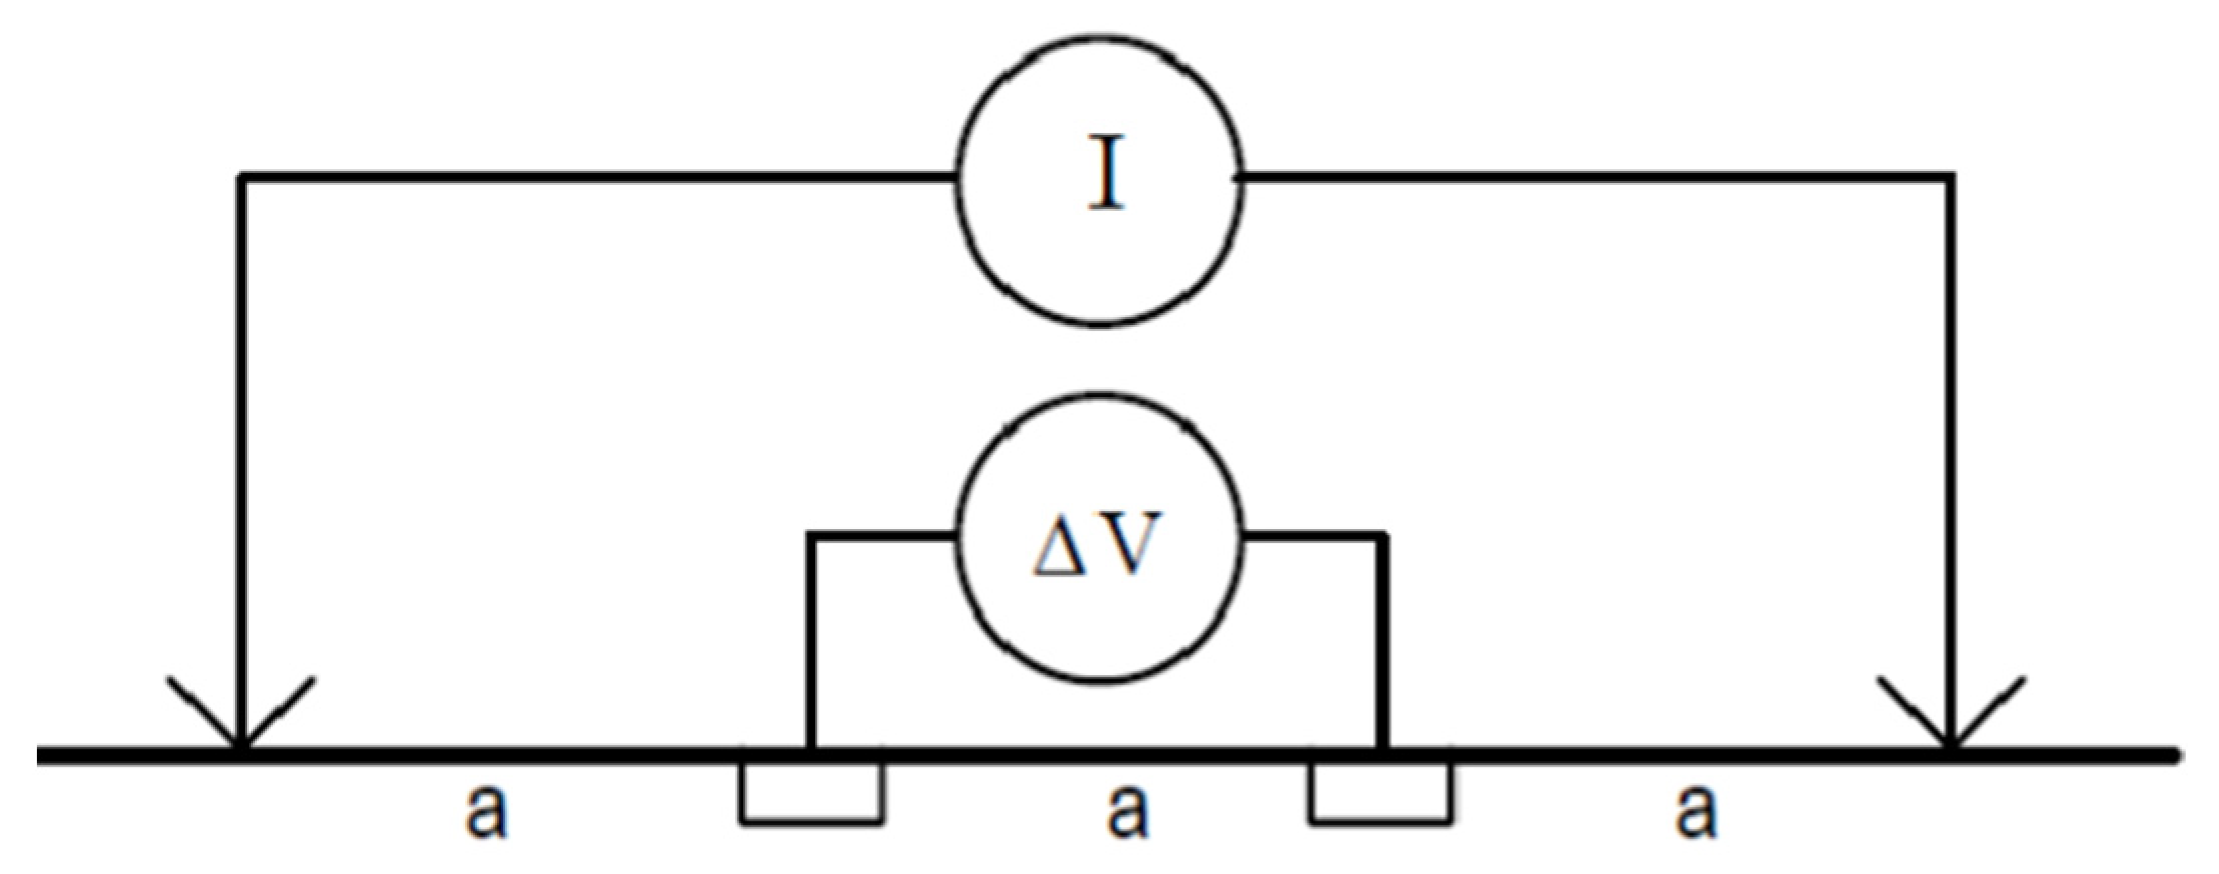
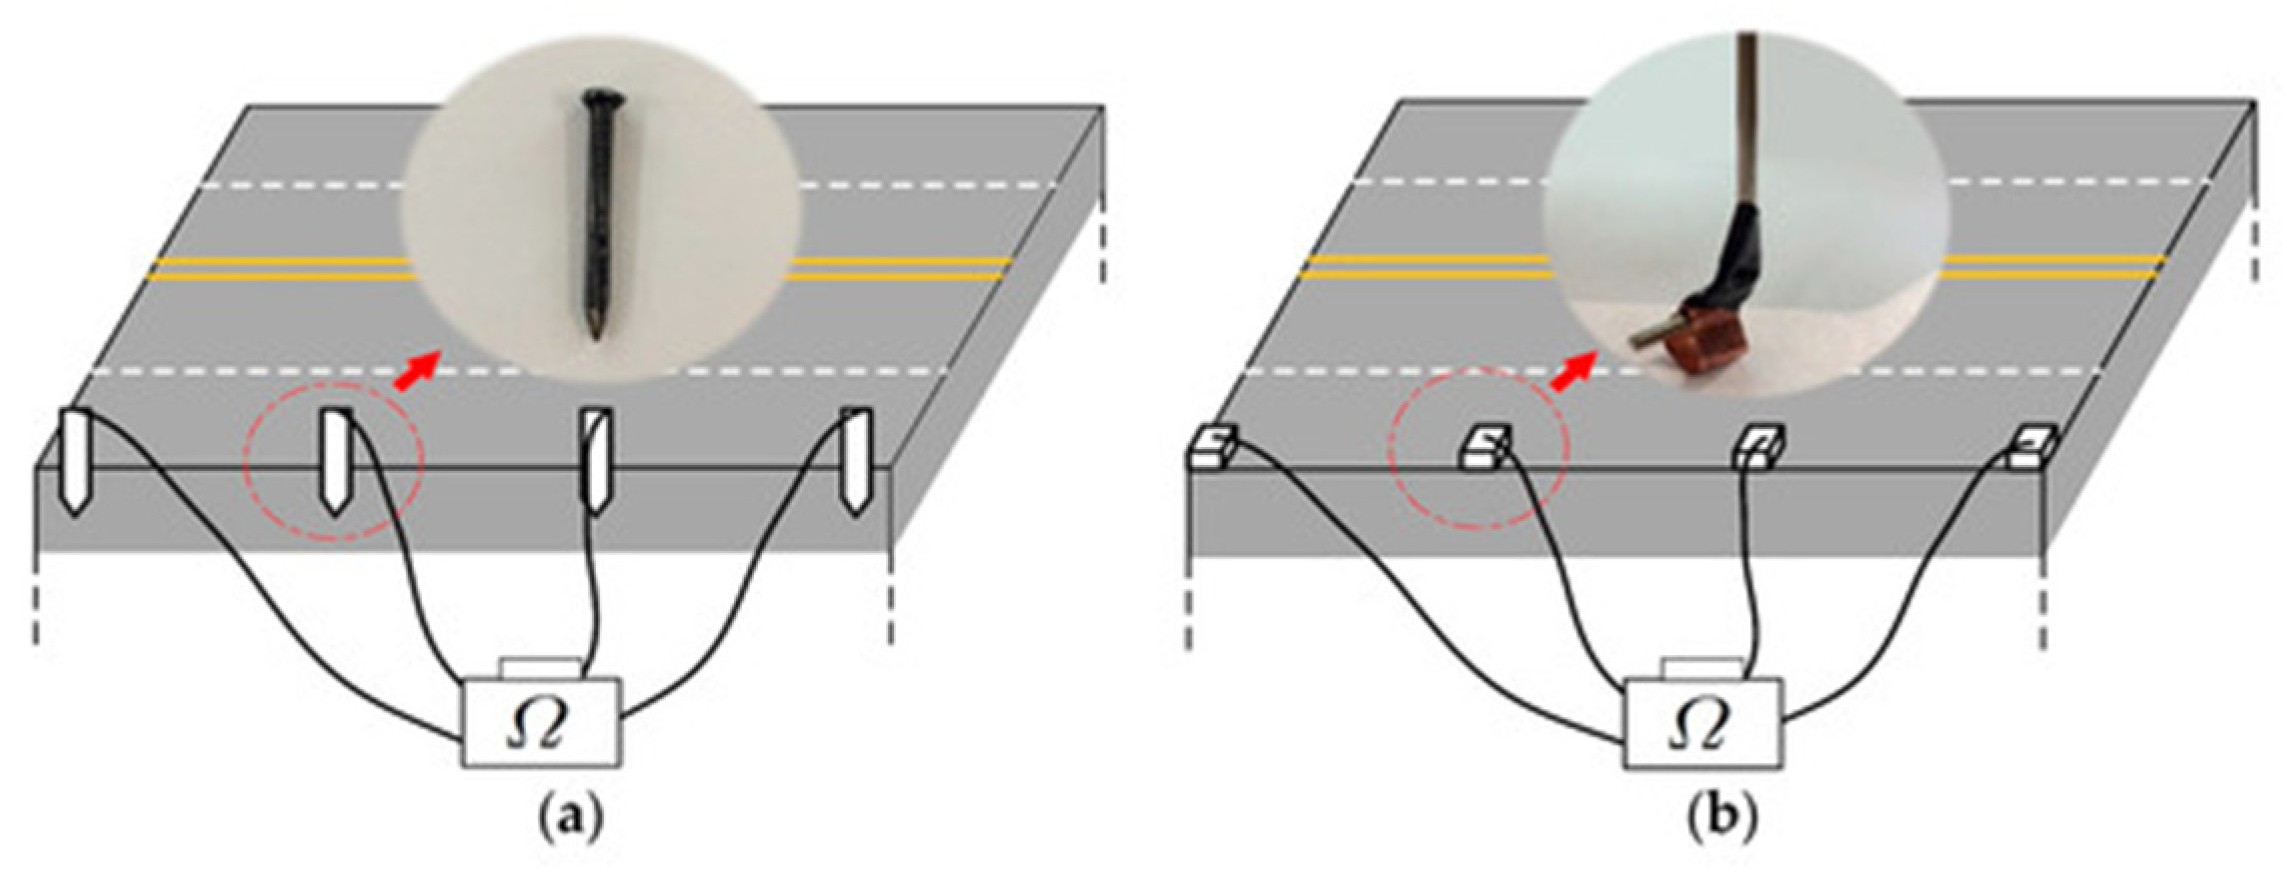
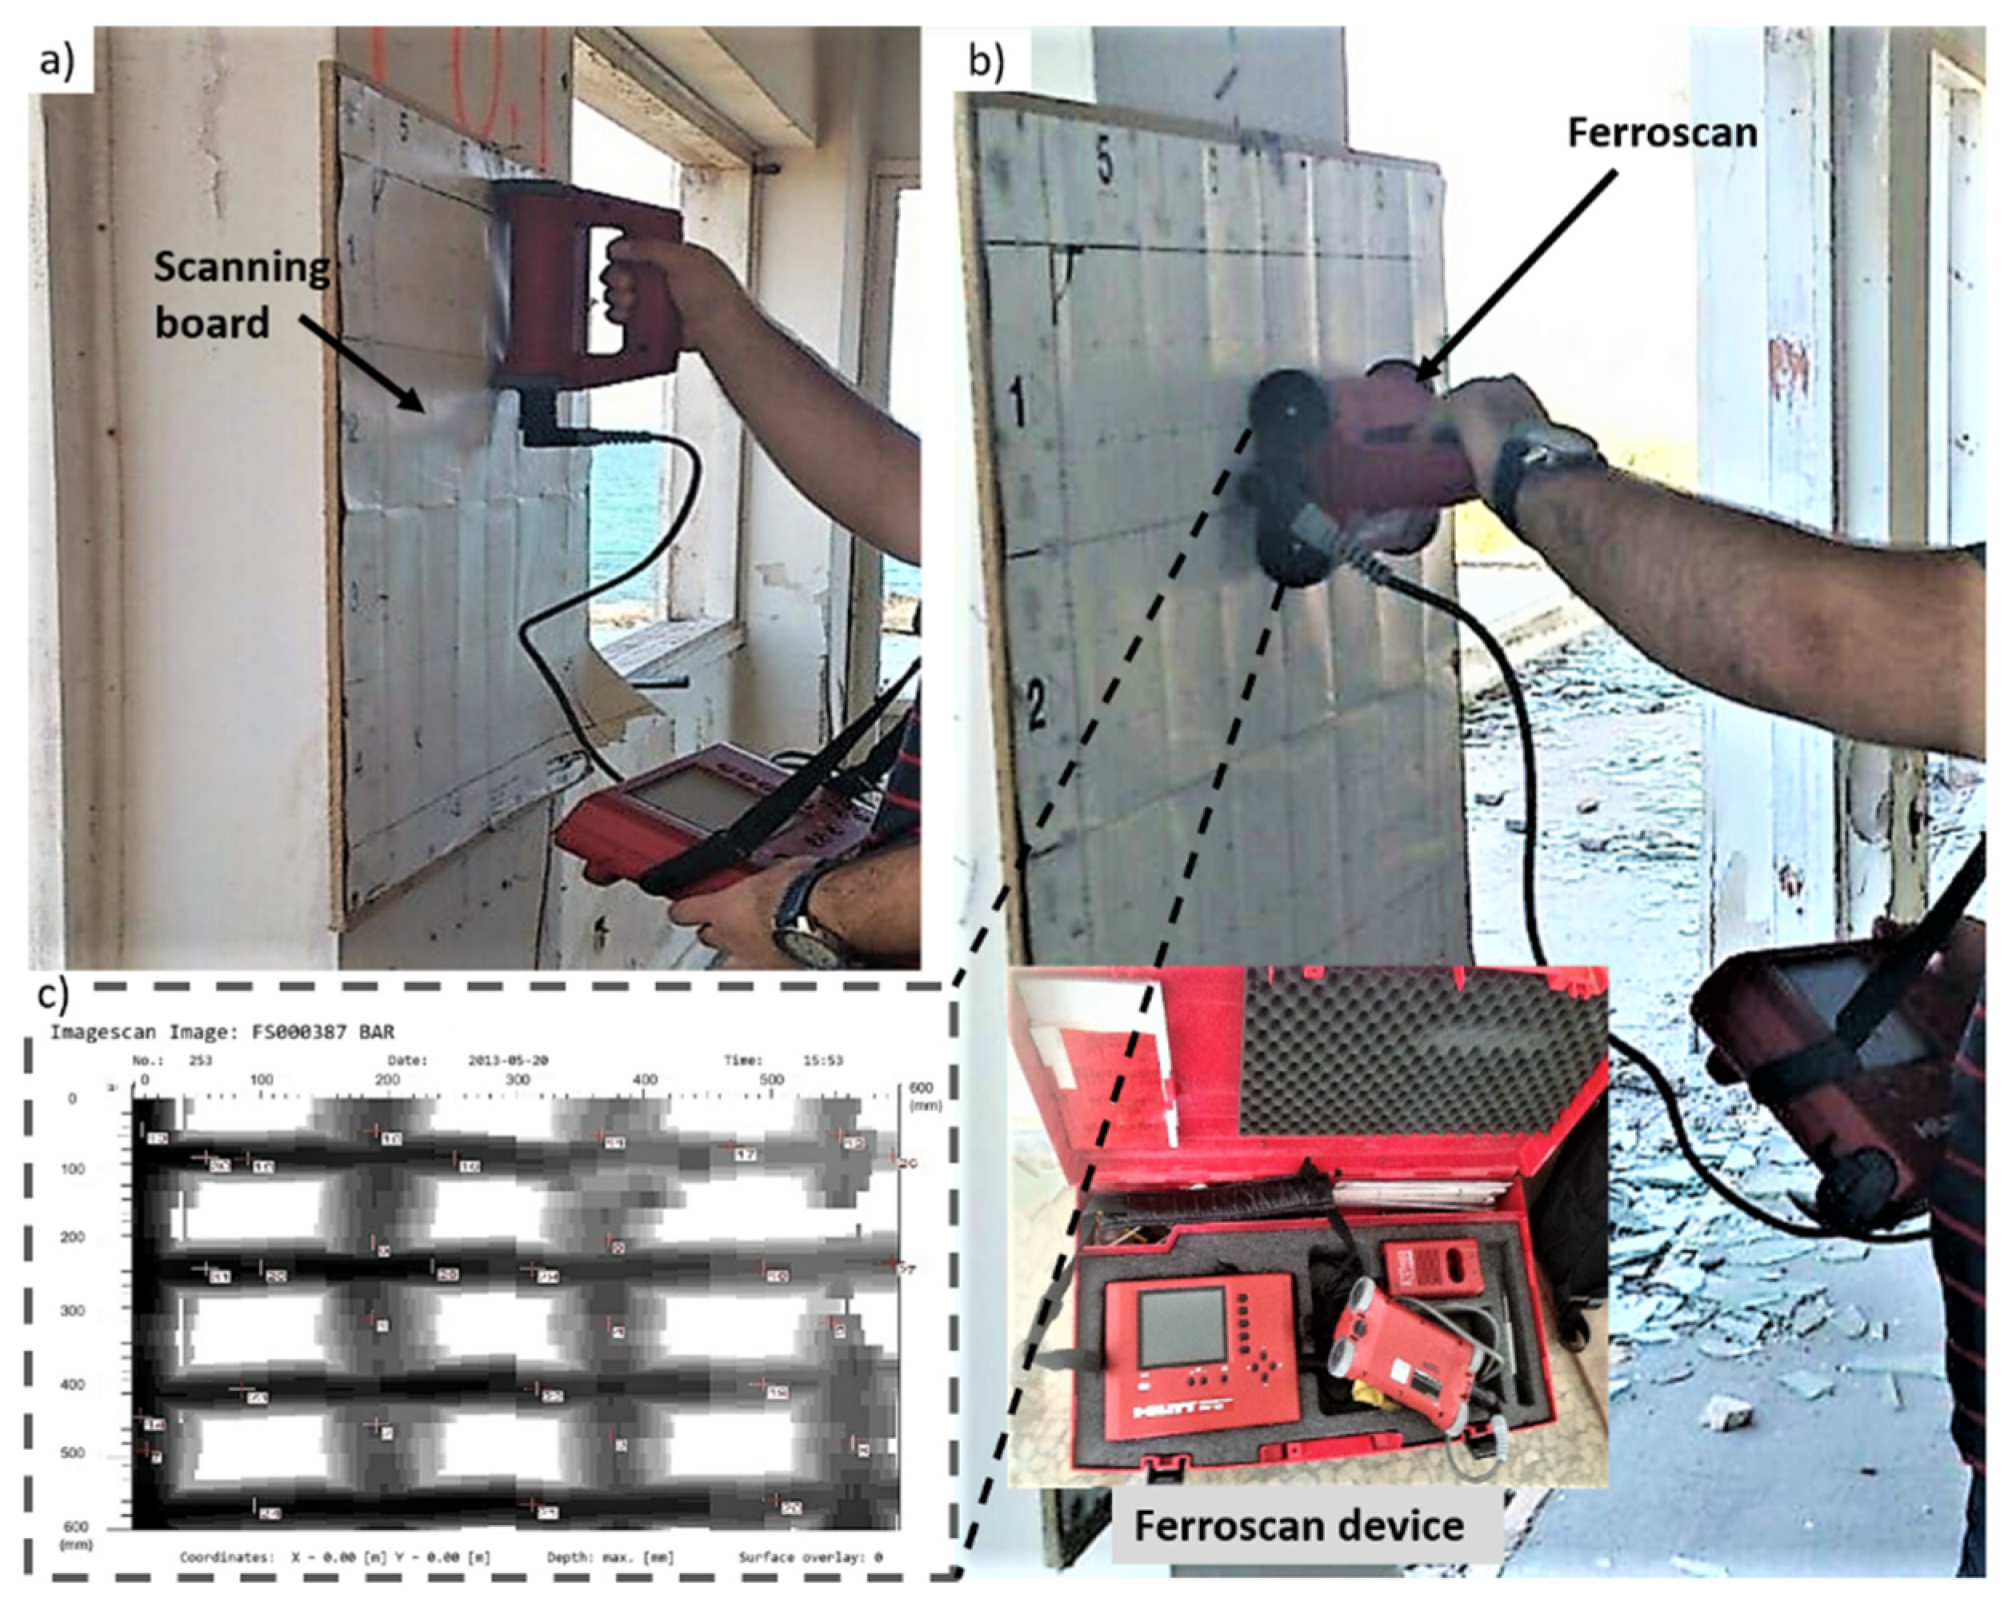
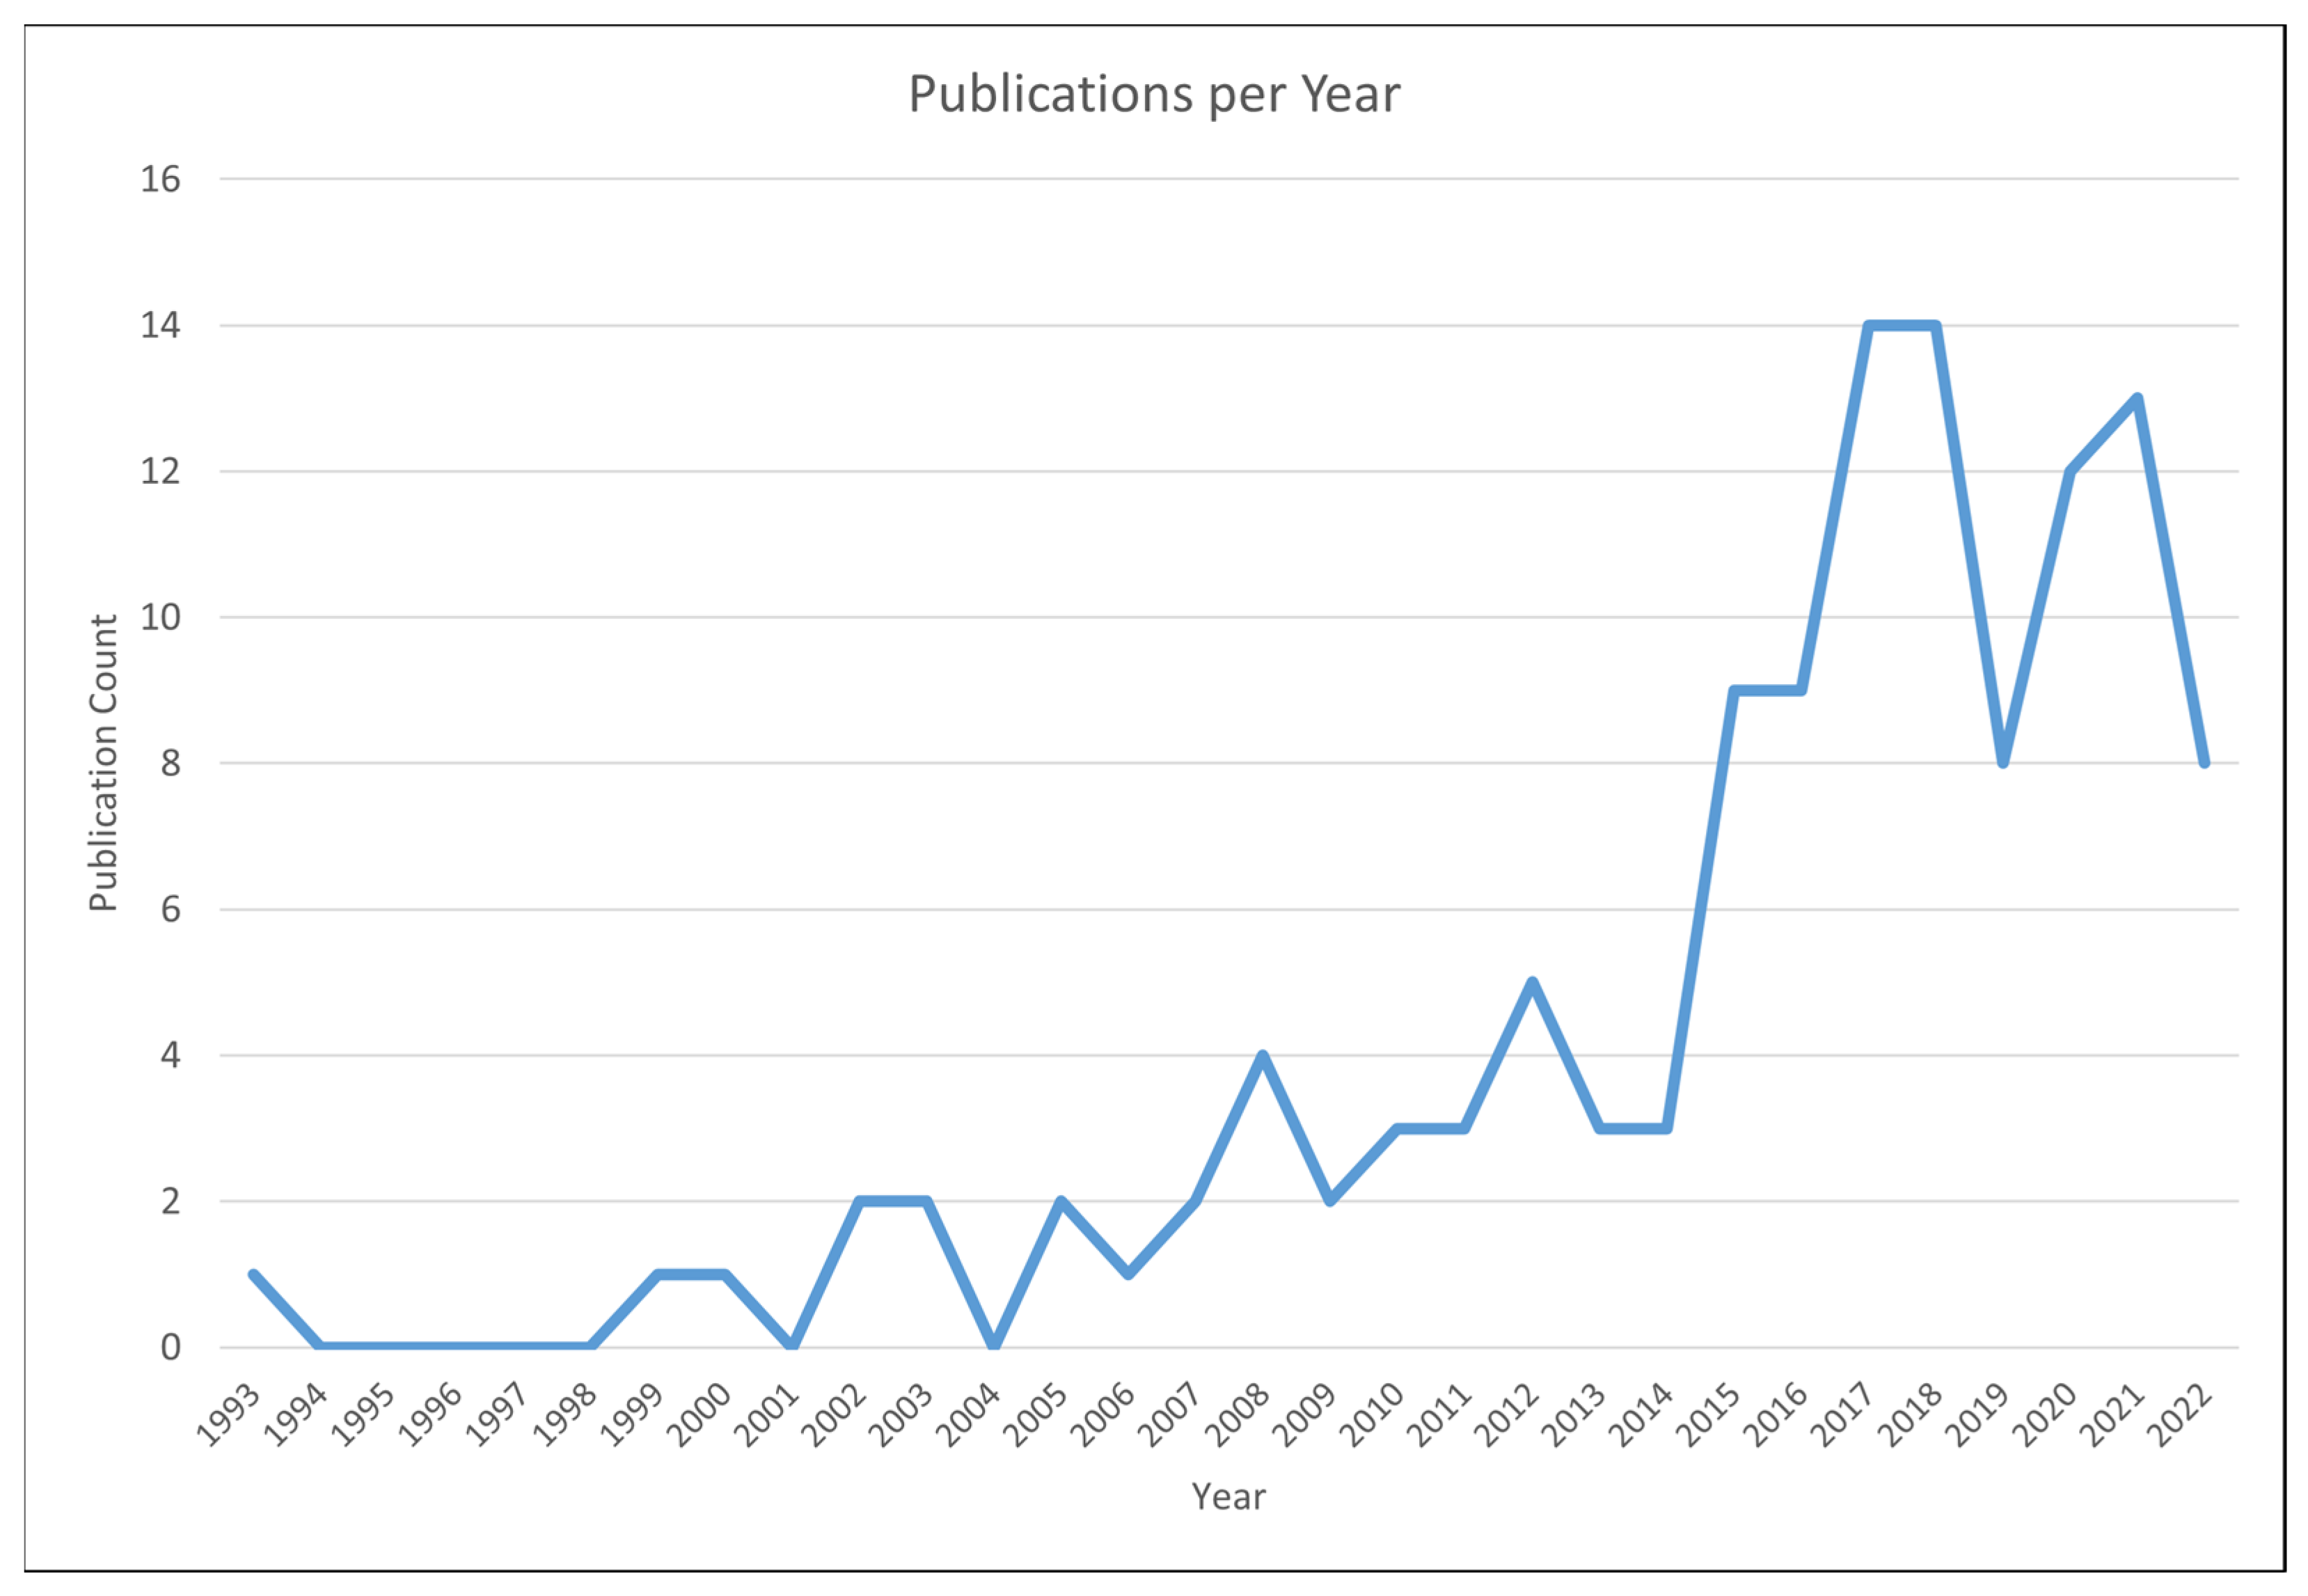
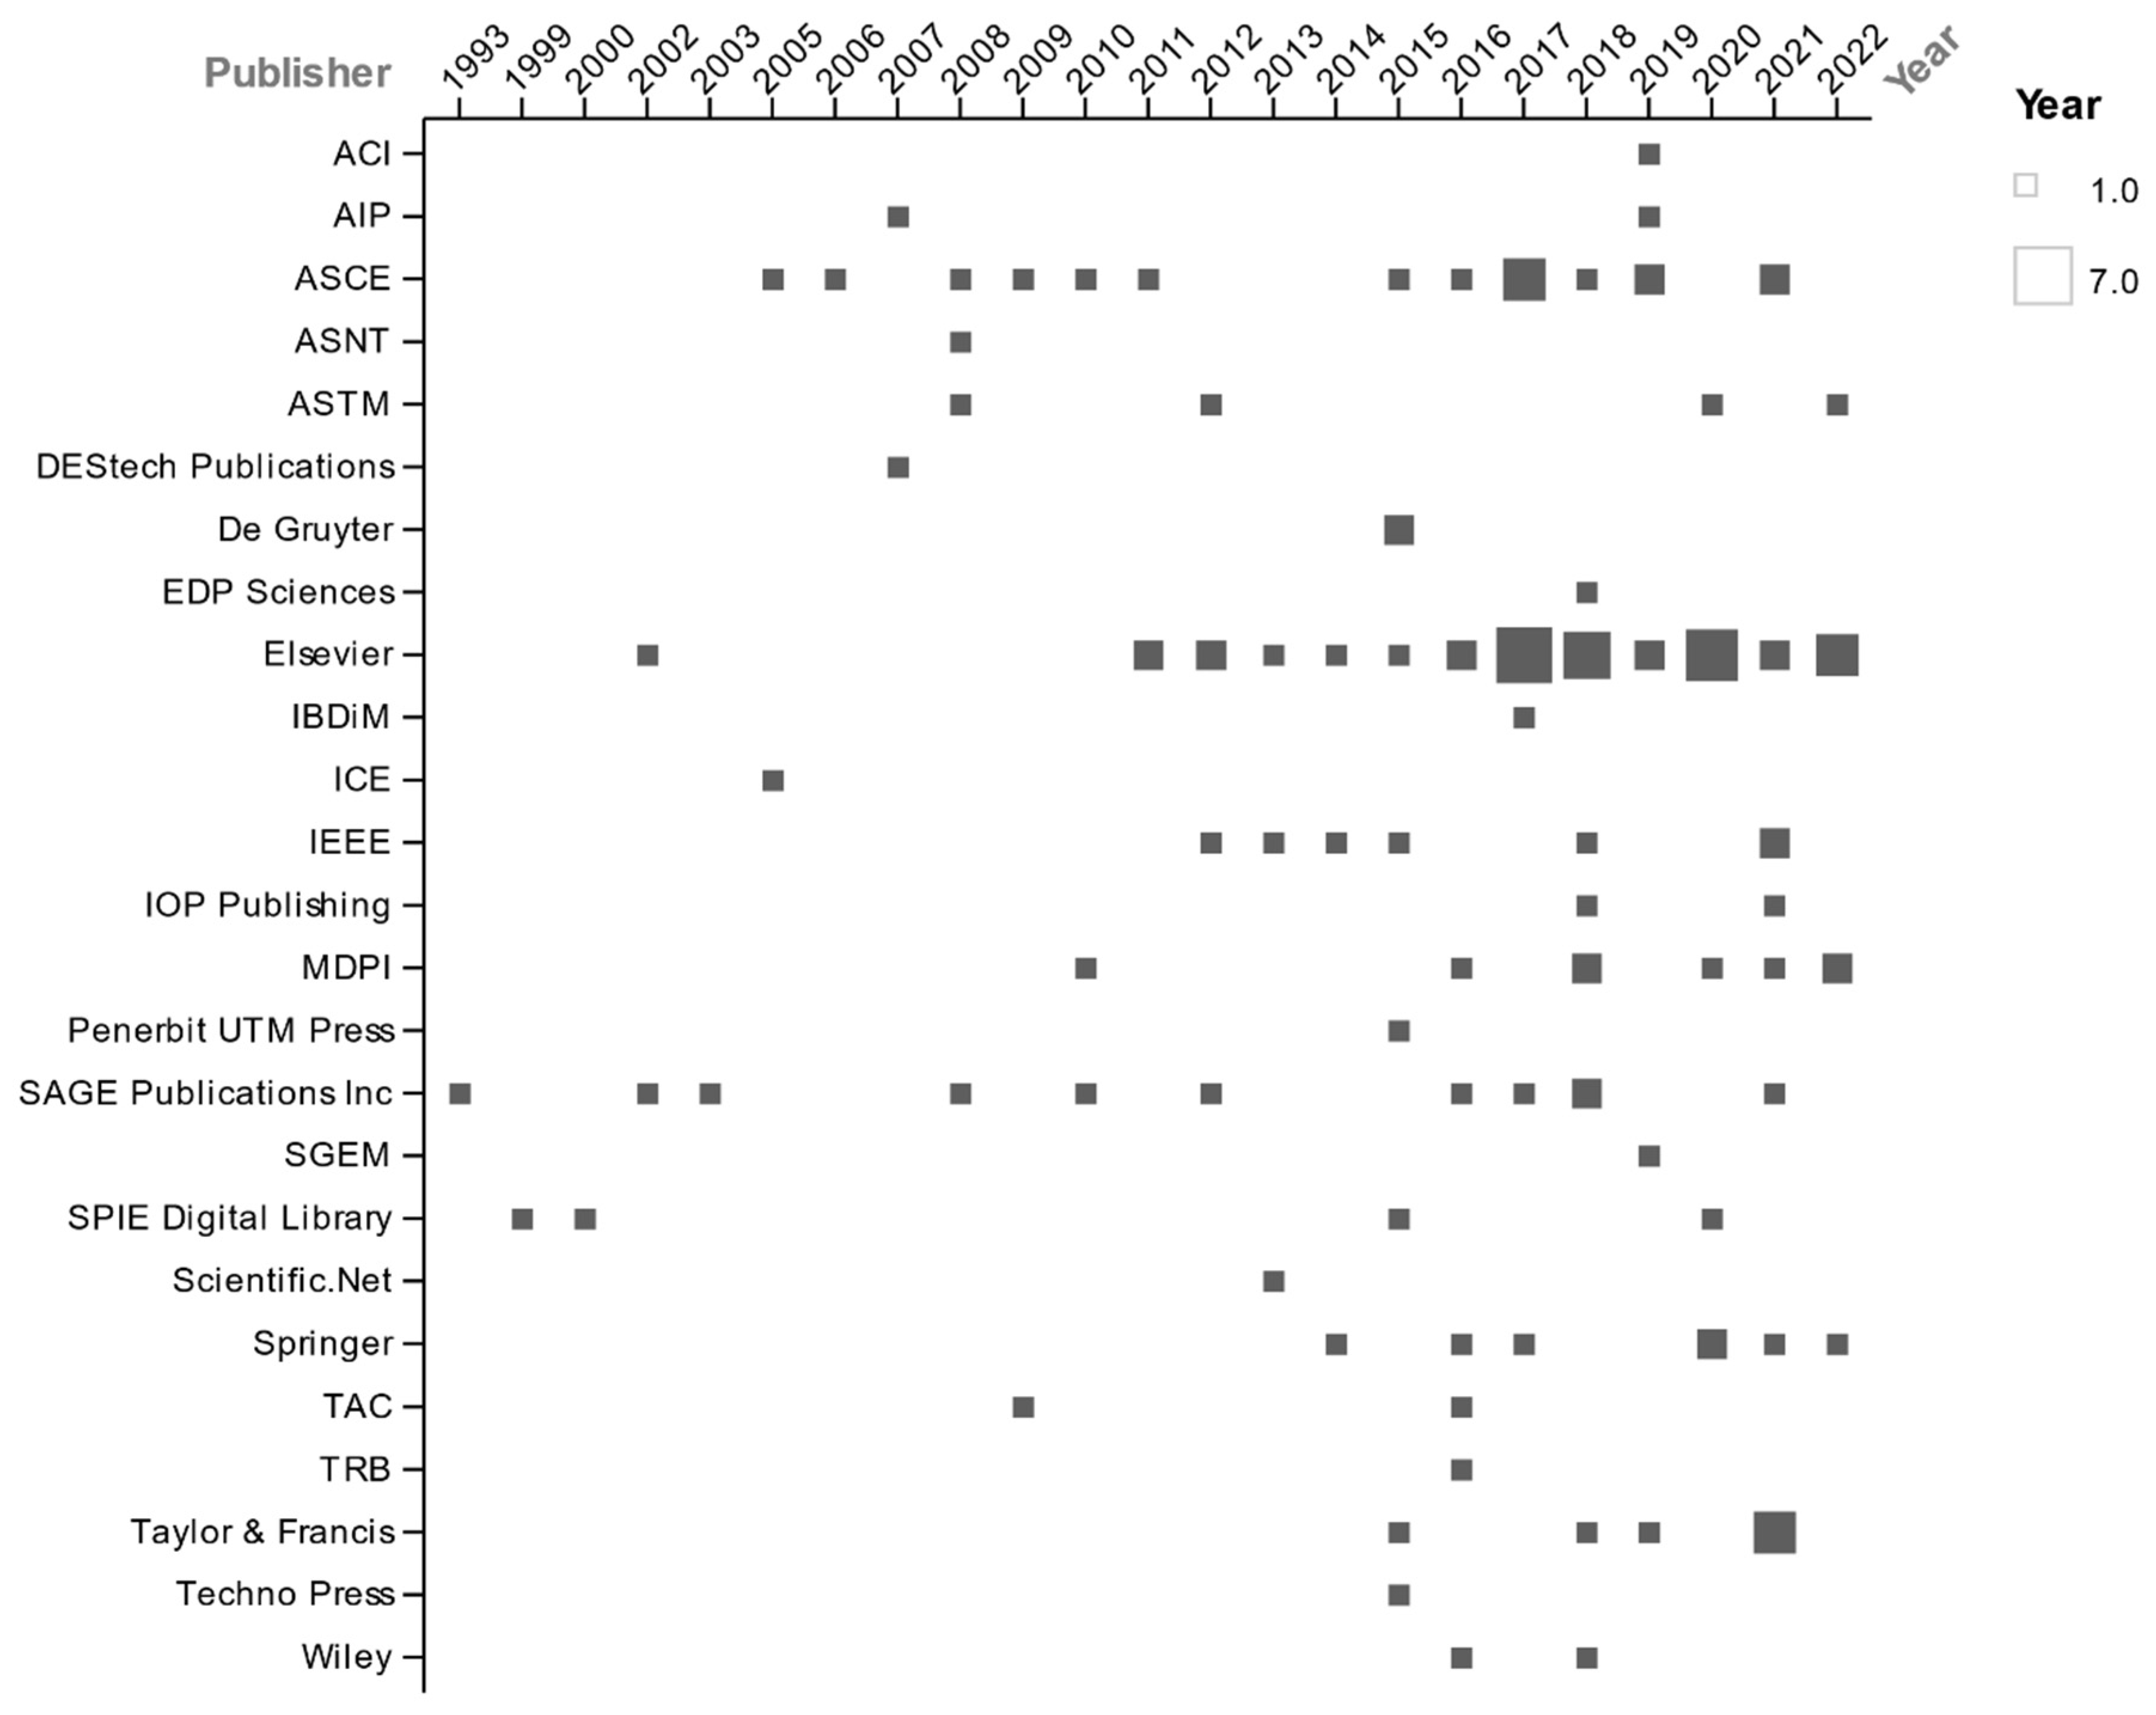
Table 1.
Table summarizing the damages and dimensions in pavement assessment for each NDT technique described in this section.
Table 1.
Table summarizing the damages and dimensions in pavement assessment for each NDT technique described in this section.
| Techniques | Damage/Dimension | |||||||||||
|---|---|---|---|---|---|---|---|---|---|---|---|---|
| Superficial Deformation & Disintegration | Cracking | Layer Thickness Deficiency | Bearing Capacity | Soil-Foundation & Bedrock Structure | Voids & Cavities | Subsidence & Sinkholes | Debonding & Delamination | Concrete Cover Depth | Concrete Quality & Strength | Rebar Detection & Corrosion | Moisture | |
| InSAR | ✔ | ✔ | ||||||||||
| Spectral imaging | ✔ | ✔ | ✔ | |||||||||
| RGB imaging | ✔ | ✔ | ||||||||||
| IRT imaging | ✔ | ✔ | ✔ | ✔ | ||||||||
| LiDAR | ✔ | ✔ | ||||||||||
| Profilometer | ✔ | ✔ | ||||||||||
| GPR | ✔ | ✔ | ✔ | ✔ | ✔ | ✔ | ✔ | ✔ | ✔ | |||
| Deflectometers | ✔ | ✔ | ✔ | ✔ | ||||||||
| PSI | ✔ | ✔ | ✔ | |||||||||
| ERT | ✔ | ✔ | ✔ | ✔ | ✔ | ✔ | ||||||
| Rebound Hammer | ✔ | |||||||||||
| Covermeter | ✔ | ✔ | ||||||||||
| Ultrasonics | ✔ | ✔ | ✔ | ✔ | ✔ | |||||||
Table 2.
Relevant published works combining GPR with other NDTs on road pavement assessment.
| Objective | NDTs | GPR Antennas | Findings | Publisher | Reference |
|---|---|---|---|---|---|
| To establish a maintenance treatment decision-making system using the NDT technology based on an expressway | RSP, FWD, 3D GPR | Ground-coupled antennas with a frequency bandwidth of 200–3000 MHz (antennas separation of 7.5 cm) | FWD was able to determine the modulus of each structural layer (bearing capacity evaluation), but the deflection values obtained cannot describe the level of the integrity of the pavement structure nor the existence of internal defects and extent. 3D GPR measured the thickness of each structural layer (to determine thickness deficiency) and to detect the internal damage distribution (crack rate ratio) in the pavement structure (width and weight of damage). | Taylor & Francis | [200] |
| To demonstrate the power of integrating multi-sensing data in the framework of pavement conditions. The test site was an interurban motorway | RSP, FWD, GPR | Air-coupled antennas (frequency antenna not provided) | The modeling approach presented demonstrated (i) the material moduli estimated through back-calculation (deflectometric data integrated with GPR-based thicknesses), based on the multi-layer elastic theory, showed a interquartile range of RMS varying from 2.3 (25%) to 4.9 (75%); (ii) that the IRI is a significant predictor of critical subgrade strains (with p values less than 0.05). | MDPI | [86] |
| To provide a method to improve the soil condition under the rigid pavement of a damaged airport runway: the underpanel grouting method (UPGM) and its verification by two inspection techniques, GPR and FWD | FWD, GPR | Ground-coupled antennas (frequency antenna not provided) | GPR was used to measure the layers’ boundaries of the soil after grouting. No noticeable thickness deviation was observed with GPR. The FWD showed that deflections were significantly reduced after grouting. Thus, the combination of both techniques has demonstrated the efficiency and effectiveness of the UPGM. | ASCE | [201] |
| To assess the bearing capacity of a flexible highway pavement. The importance of using GPR measured thickness in the back-calculation process (to obtain layers’ elastic moduli) is addressed in this study | FWD, GPR | Air-coupled bistatic antennas with a central frequency of 1.0 GHz | For a road extension of 31 km, the results showed that 70% of the GPR thicknesses estimated were under the design thickness, and almost ⅔ of the section would have a significant error in the pavement response models if GPR-estimated thickness is not used. | Elsevier | [136] |
| To investigate the cause of structural distress (cracking and rutting) in a foamed-asphalt warranty project | FWD, GPR, seismic | Not provided | The section showing severe distress demonstrated higher FWD deflections (three to 4-fold higher). The SPA (Seismic Pavement Analyzer) has shown much lower base moduli in the distressed area than in the intact locations. DCP (Dynamic Cone Penetrometer) demonstrated that the base in the distressed area was loose and lacked cohesion. However, SPA has indicated that the subgrade modulus is uniform throughout the project, which suggests that the distress is not associated with variations in subgrade strength. GPR was used to evaluate moisture content at distressed areas, but significant variations were not observed (as supported by laboratory testing). The combination has shown that failure is associated with the base (foamed asphalt) lack of strength. | ASCE | [202] |
| To investigate the integrated approach of GPR and FWD to locate failure in roadway pavements. Three different case studies are addressed | FWD GPR | Air-coupled bistatic antennas with a central frequency of 1.0 GHz | GPR was able to detect; Project 1—(i) the extent of stripping problems at various depths and high porosity that caused delamination, (ii) high dielectric measurements indicating wet base, and (iii) a poorly compacted AC layer and poor longitudinal joints; Project 2—(i) a porous layer (high reflections) causing debonding and surface distress; Project 3—(i) a poorly compacted AC layer (high air void content) and wet base. FWD was able to detect: Project 1—(i) that the areas with high deflections have stripping (from GPR), (ii) base stiffness, (iii) inadequate pavement structure (or bearing capacity); Project 2—(i) loss of support or weak structure (high deflections), and (ii) thinner layers (debonding). | ASCE | [203] |
| To investigate the premature pavement failure of heaving and cracking on a roadway | RSP, FWD, GPR, ERT | Air-coupled bistatic antennas with a central frequency of 1.0 GHz | GPR has detected approximately 84% of the bumps/dips detected by the profiler (RSP). Moreover, there was a section of the roadway showing the same GPR signature (not identified by the RSP) that could indicate further heave in the future. FWD and complementary DCP showed that the heaved/cracked areas are losing structural load support most probably due to ineffective stabilization. As GPR does not penetrate through the clay layer, ERT was able to map the soil strata, identifying anomalies with high organic contents. It was concluded that heaving was caused by high organic content. | ASCE | [204] |
| To develop a rapid testing methodology and testing parameters to assist in detecting and quantifying tented cracks in asphalt pavements by using a multi-sensor non-destructive testing system with a single positioning and navigation system | GPR, LiDAR, IRT, video cameras, IRI | GSSI 400 MHz ground-coupled antenna | The study introduced two parameters; peak height value (PHV) and spacing between two consecutive peaks (SBP) to assess the intensity and frequency of tented cracks; (i) these parameters have a strong relationship to the ride quality indicator IRI; (ii) these parameters can be used to determine the extent and location of critically affected segments of the road; (iii) GPR, LIDAR, video, thermal, the IRI, and pavement inspection data were used to successfully validate the parameters, which were obtained from surface profile measurements; further; (iv) GPR can be used to detect moisture conditions that contributes to the formation of the tented cracks. | SAGE Publications Inc | [205] |
| To assess the condition of visible deteriorated concrete pavement that includes a layer of concrete, a granular base and their interface (with presence of air voids at the interface) | GPR, IE, USW | Bistatic ground-coupled antennas with a central frequency of 1.5 GHz | GPR was able to accurately estimate pavement thickness and to locate air voids between concrete and granular base layers. The USW allowed estimating the dynamic elastic modulus and wave phase velocities of the concrete, although the existence of air voids at the interface could affect these results (more affected at full wavelength range). The IE was fairly accurate in estimating thickness of concrete pavements, but as in the USW method, these estimations could be affected when using the full wavelength range. | Elsevier | [206] |
| To compare the GPR and IE methods in detecting the size and depth of air voids in concrete slabs | GPR, IE | Antenna with a central frequency of 1.6 GHz | GPR can accurately estimate both the air voids diameters and depths, while the IE is only able to determine voids depths. GPR was able to detect air voids larger than 20 mm in diameter with −8.9 to 30% error. The void depth estimation by GPR was more accurate only for larger voids (up to 67 mm), while IE was more accurate in estimating depths for smaller sizes. This later could be caused by the presence of moisture content in the slab attenuating GPR signals, in addition to the frequency resolution (with a theoretical minimum diameter of 15.6 mm). | Penerbit UTM Press | [207] |
| To evaluate deteriorated bridge deck slabs through the combination of NDT methods: GPR, hammer sounding (RH), ultrasonic impact-echo, and half-cell potential (HCP) | GPR, RH, IE, HCP | Multiple ground- and air-coupled GPR systems, which ranged from 1.0 to 2.6 GHz | GPR created GPR condition (delamination) maps and corrosion (through signal attenuation). The IE was able to estimate thicknesses and to detect delamination. The RH detected spalled areas and delamination. HCP was able to detect corrosion. The correlation between different NDTs was analyzed, resulting in 90.2% for GPR vs. HCP, 79.3% for GPR vs. IE, and 76.4% for HPC vs. IE. | SAGE Publications Inc | [208] |
| To evaluate bridge deck condition using combined NDTs. Three different case studies on bridge decks are addressed | GPR, IE, IRT | 1.5 GHz ground-coupled antenna and 1.0 GHz air-coupled (horn) antenna | Damage maps were created for each technique, and it was found that IE, IRT, and GPR methods correlated well. The IE and IRT methods have estimated similar levels of damages, while GPR estimations were significantly lower (most probably due to debonding and signal attenuation caused by excesses of moisture and chloride contents). However, the IE method is preferred over IRT imaging because it was less subjective to weather conditions, and its analysis was more quantitative than IRT. Comparing the field time for each technique, IE and IRT have comparable times, although the IRT processing was considerably higher. Regarding GPR, the field time should be lower, but it can be larger due to obstacles in the road surface that makes the data acquisition process difficult. | ASNT | [209] |
| To assess the capabilities of different methods (chain drag, GPR and impact-echo) used to evaluate a concrete bridge deck showing corrosion-induced delamination, and validation with coring | GPR, IE, chain drag | A ground-coupled antenna with a 1.5 GHz center frequency, and an array of 64 air-coupled antennas with 2.4 GHz center frequency | The acoustic techniques, chain drag and IE, showed results consistent with coring. Nevertheless, the chain drag is susceptible to errors due to subjective interpretation, and the IE method, although more quantitative, is extremely time-consuming and the results are not always conclusive. The GPR method demonstrated its capability to detect delamination, even through asphalt-overlaid decks. | Elsevier | [210] |
| To measure the depth and size of cavities in concrete panel, through the combination of three different NDTs and validation with coring | GPR, IRT, UPE | Ground-coupled (dipole) antennas with 2.6 and 1.5 GHz | Field measurements revealed the limited capability of GPR to detect cavities beneath the surface, whereas UPE completely failed to detect cavities. Conversely, IRT was successful at detecting cavities near the surface under convenient weather conditions. GPR and UPE detect defects deeper inside material, while IRT is incapable to determine depths. GPR is rather accurate to determine depths (for defects not too close to the surface), and IRT is the most suitable to detect defects at lowest depths. The fastest method during field work was IRT, while GPR was the most time-consuming. For GPR depth estimations, the dielectric properties of media need to be calibrated. UPE was unable to detect shallow cavities or provide overestimated values. | Elsevier | [188] |
| To propose a new surveying methodology aiming to evaluate the structural integrity in masonry arch bridges based on the integration of multi-source, multi-scale and multi-temporal radar data | GPR, INSAR | Array with 8 double-polarized antennas with 2 GHz center frequency (10 cm spacing), and dual-frequency 200 and 600 MHz antenna system | GPR provided subsurface geometry of the superstructure (asphalt layer thicknesses and base/masonry boundaries) and exact positioning of the structural ties. High frequencies to detect thicknesses and low frequencies to detect structural ties. InSAR (PSI technique) was able to measure structural displacements mainly caused by flooding. | Elsevier | [32] |
| To investigate a sinkhole in an urban area using different NDTs | GPR, INSAR, LiDAR, ERT | Shielded ground-coupled antennas with 180 MHz center frequency | InSAR (DInSAR technique) was able to estimate subsidence and deformation rates in the zone. DEM (Digital Elevation Model), from LiDAR data, allowed assessing the topographic changes by anthropogenic infill of the sinkholes and ground leveling. GPR identified a concealed sinkhole that seems to be affected by the highest subsidence rate detected by DInSAR. Moreover, GPR revealed that subsidence was mainly caused by sagging. However, GPR was affected by the presence of highly conductive anthropogenic deposits and the gardened areas of the park. ERT detected subvertical discontinuities and faults related to the development of a concealed sinkhole, although this method was restricted by urban elements. | Elsevier | [161] |
| To detect sinkholes in urban areas through an integrated and non-invasive multi-scale approach combining seismic reflection, InSAR, topographic leveling and 3D GPR | GPR, INSAR, reflection seismic | Array with 5 transmitting and 4 receiving 400 MHz shielded antennas (8 cm spacing) | Reflection seismic allowed identifying, from top to bottom: a sediment layer, the bedrock and a deeper layer of evaporites (exceeding 60 m); showing this later poor geotechnical properties and sinking. InSAR (PSI technique) was able to measure a vertical downward displacement due to ground instability. Reflection seismic was validated using coring/borehole, while InSAR was validated with leveling techniques. InSAR identifies critical areas of deformation but is not able to detect sinkholes. GPR was useful to detect surface breaks, sinkholes, and down-dipping layers (sinking areas) related to the presence of forming sinkholes. Furthermore, the use of 3D GPR allows obtaining the 3D depth volumes of deterioration. The penetration depth of GPR was more limited than reflection seismic (the evaporite layer was only detected by seismic). With InSAR it is possible to delineate the area affected by subsidence phenomena, especially in urban areas where the presence of targets (e.g., buildings) allows an excellent coverage; but for vegetated and cultivated areas, GPR is recommended (especially in roads or grasslands). | MDPI | [30] |
| To investigate the quality of the pavement surface in a runway | GPR, RSP | Air-coupled (horn) antenna with central frequency of 2 GHz | GPR was able to measure thicknesses of pavement construction layers, and two layers were identified. GPR results were validated with coring. The RSP allowed determining a low-quality pavement but sufficient to remain in use. | De Gruyter | [211] |
| To combine ground-penetrating radar and infrared thermography to evaluate the cracks in asphalt pavements | GPR, IRT | Ground-coupled antenna with a central frequency of 1 GHz | Cracks on the road surface can be detected by analyzing amplitude variations of GPR data. Additionally, crack depth can be estimated by detecting the hyperbolic reflection at the bottom of the crack with an error of 5.5%. Infrared thermography can detect cracks by analyzing the temperature change between the crack and the asphalt surface. Combining the two technologies allows for the assessment of crack depth, detection of filler material, and identification of the crack’s origins and severity. | Elsevier | [68] |
| To propose an integrated method of combining ground-penetrating radar (GPR) and infrared thermography (IRT) for concrete bridge deck condition assessment and to compare the results with other inspection methods | GPR, IRT | Antenna with a central frequency of 1600 MHz | The integration method enhanced the identification and quantification of subsurface delamination of bridge decks. Additionally, it showed consistent results with the traditional methods based on the inspector assessment. However, the proposed method needs to be validated with different use cases and to be within an automated framework. | Elsevier | [212] |
| To use GPR and IRT to generate comprehensive condition maps for RC bridge decks | GPR, IRT | Antenna with a central frequency of 1600 MHz | Combining GPR and IRT technologies for bridge condition assessment expands their capabilities and reduces their limitations. Based on the results of the two bridges, integrating GPR and IRT data provided reliable condition maps and prevented possible overestimating or underestimating the bridge’s deck condition. | ASCE | [213] |
| To propose a combined use of GPR, IRT, and TLS techniques to detect road deterioration and its possible root causes | GPR, IRT, RGB, TLS | Ground-coupled antennas with 500 and 800 MHz central frequencies | Joint interpretation of data from different non-destructive techniques can lead to efficient maintenance planning by detecting the internal damages that can affect the internal structure before having any sign of the damage on the surface. (i) GPR is used to identify the defects through the scattering attenuation of the GPR signal, while IRT is used to detect areas with deep cracks or material loss based on their higher surface temperature compared to the surroundings. TLS is used to measure the width and length of any defect detected at a superficial level. (ii) The relation between surface defects and their subsurface root causes was associated by integrating the interpretation of data from the three techniques. (iii) A sinkhole at 2 m under the surface was identified in the study area, using subsurface GPR and IRT data without prior knowledge or signs on the surface. (iv) The overall data interpretation can be improved when using higher GPR antenna frequencies to analyze the data in the same depth range as IRT. | Elsevier | [70] |
| To use a combination of non-destructive tests for condition evaluation of different bridges | GPR, TLS, DSLR cameras | Dual-frequency ground-coupled antennas (200 and 600 MHz) | (i) Three types of bridges with different construction systems were used in this study; (ii) TLS and DSLR cameras were used to assess the surface condition of the bridges and to detect corrosion, vegetation, biological crust, and water presence. The overall classification accuracy of the point cloud data was 92.49%, while it was 79.69% for image classification. The ground-truth validation was done through on-site visual inspection with the help of a laser distance meter and measuring tape; (iii) GPR was used to detect subsurface targets such as bridge piers, asphalt layer, and rebar in addition to defects such as moisture damage, voids, and cracks; (iv) point cloud data can be visualized in addition to GPR data to improve the overall interpretation of the bridge condition. Additionally, enriching point cloud data with RGB data captured by the DSLR camera can improve classification accuracy. | Springer | [214] |
| To propose a systematic approach for detecting reflective cracks using a GPR and video integration system, and to introduce new indices for evaluating interlayer systems in hot-mix asphalt (HMA) overlays | GPR, video cameras | 1 GHz horn antenna; 1 GHz air-coupled antenna; and 1.5 GHz ground-coupled antenna. | The proposed approach was used for four types of interlayer systems: nonwoven reinforcing fabric with an asphalt binder (system A), sand anti-fracture (SAF), an interlayer stress-absorbing composite (ISAC), and a modified leveling binder. GPR was used to estimate overlay thickness and detect joints and dowel bars of PCC pavements. The GPR and video integration system was used to identify surface cracks in overlays with the help of a crack map. Joint associated reflective cracks were transverse cracks that exist over a joint, while other transverse cracks were not considered as reflective cracks. Reflective cracking appearance ratio (RRCA) and transverse cracking appearance ratio (RTCA) indices were developed to evaluate strip and areawide interlayer systems. Additionally, a weight function was introduced to categorize crack severity. The ISAC system showed the best performance over time. Although the modified IL-4.75 leveling binder system reduced the increase rate of RTCA, it was not as effective as the other evaluated interlayer systems. | SAGE Publications Inc | [215] |
| To propose a method for integrating two-dimensional images and GPR data to automate accurate and efficient pothole detection | GPR, two high-definition camcorders (RGB) | GPR with an 800 MHz antenna | GPR is an effective tool to differentiate between potholes and other defects, such as pavement patches or shoving, as GPR is sensitive to material changes. However, the result was inaccurate in case of defects with embedded air voids such as alligator and block cracking. Potholes were first detected from GPR data, then the image processing process was applied, and the pothole segmentation region was performed using a geometrical active contour model. The pothole position and shape were extracted by integral processing of GPR and image data with mean and standard deviation of error percentage in pothole shape extraction 12.8 and 6.5%, respectively. The proposed method achieved 94.7% precision, 90% recall, and 88% accuracy. Further improvements can be applied by incorporating more data at traveling speed and using multiple GPR antennas to cover the full width of the traffic lane. | ASCE | [58] |
| To detect and characterize cavities and galleries and evaluate the risk of subsidence in the Sima de Madrona area (Segovia Province, Spain) by using ground-penetrating radar and electrical resistivity tomography | GPR, ERT | 200 and 400 MHz antennas | (i) GPR reached a maximum depth of 5 m while ERT provided a depth of 8 m. However, GPR detected cavities at depths up to 3 m, while results were less beneficial beyond that depth. ERT could identify cavities at depths of over 5 m; (ii) it was possible to obtain more detailed results of small targets with GPR as it has a better horizontal and vertical resolution than ERT; (iii) a map showing the detected galleries and cavities was created based on the joint interpretation of GPR and ERT profiles. It was possible to tell this risk of collapse of an area, based on the depth at which cavities were detected and the observed materials. | Elsevier | [120] |
| Interpretation of the subsurface lithology in the Cléricy district, Québec, Canada | GPR, ERT | Antennas with four different frequencies, unshielded antennas of 100 MHz and shielded antennas of 80, 160, and 450 MHz | GPR scans were effective to a depth of 5 m for identifying near-surface materials, while ERT profiles were beneficial when the bedrock was at depths over 5 m, and they were used for estimating the elevation of the bedrock surface in the study area. GPR data captured using 450 MHz had the best resolution, and it was possible to detect the underground infrastructures in the area. ERT data complemented the interpretation where there were surficial conductive clays, causing GPR signal attenuation. Clay deposits corresponded to areas of low resistivity less than 100 Ω.m while the resistivity of the bedrock has been estimated at values more than 600 Ω.m. Average bedrock depth map for the streets was created based on the interpreted data from GPR and ERT. | Elsevier | [216] |
| To use laser scanning and GPR complemented by finite element method (FEM) calculations to diagnose cracks in bridge approach pavement | GPR, laser scanning | Two antennas with operating frequencies of 400 and 900 MHz | The combined application of GPR, laser scanning, and FEM computations can be used to assess road pavement conditions. GPR was used to detect inhomogeneous compaction zones and to assess the condition of the pavement structure, while laser scanning was used to detect cracks and deformation of the pavement surface. The results of standard intrusive tests validate the effectiveness of NDT methods in evaluating bridge structures where deformations have occurred. The complement 3D finite element model (FEM) of the approach pavement showed how the transverse cracks were started and expanded at the abutment wall. | Elsevier | [217] |
| To propose a method for lap splice detection and the estimation of summation of a diameter of the two rebars of the lap splice in reinforced concrete using a combined utilization of GPR and covermeter | GPR, Covermeter | A hand-held system with a central frequency of 1500 MHz | The combined use of GPR and covermeter can be used in detecting the location of lap splices and to determine the direction of the overlap. Additionally, the sum of the diameter of the two rebars at the lap splice was estimated with an average error of 2.35% and a SEE value of 1.34 mm. | Elsevier | [218] |
| To develop a new approach based on the amplitude of the backscattering energy to detect shallow geological targets | GPR, Seismic | Antenna with a central frequency of 25 MHz | The analysis of the amplitude of clutter caused by random scattering (GPR signal) allowed detecting sedimentary structures such as subterranean streams and paleochannels. Not detected by ordinary GPR results (coherent signal). Numerical simulation was used to validate the interpretations. Passive seismic (PSI) was used to validate GPR results, showing a good correlation. Thus, the steam presence was associated with a typical double peak (PSI) while, in the GPR data, it was interpreted as high backscattering amplitude. | MDPI | [149] |
| To identify forming sinkholes and karstic features on a cracked road (coast roadway) | GPR, Seismic | Dual antennas with 200 and 600 MHz center frequencies | GPR was able to detect subsidence, fractured rock, and cavities. Moreover, 3D GPR data provided the extent of the damage. Seismic refraction tomography (SRT) was able to delineate areas of fractured rock and cavities. GPR and SRT were in good agreement and the integration, together with geological studies, revealed an incipient subsidence (indicating a potential sinkhole geohazard). | Springer | [219] |
| To assess a rigid airport pavement through the combination of several geophysical methods | GPR, IRT, Seismic (SRT), EM, ERT | Dual antennas of 200 and 600 MHz, and single antenna with 900 MHz center frequencies | Low electromagnetic (EM) measurements detected a pre-existent pavement, although this method has a low vertical resolution compared with GPR. The 900 MHz, with the best resolution, focused on the shallower pavement (slab, base, and subbase), while the 200–600 MHz antenna reached the subgrade and subsoil interface. GPR also detected a pre-existent pavement located below the subbase layer. Moreover, GPR gave a quantitative estimation of the slab thicknesses, with an absolute error of 3 cm. ERT was used to characterize the deeper part of the pavement and foundation soil. Thus, ERT identified the same layers configuration of the pavement identified by GPR (thickness and depth), as well as the pre-existent structure. Moreover, ERT allowed identifying anomalous areas (e.g., cracking-prone zones). Finally, seismic refraction tomography (SRT) was able to estimate mechanical parameters. | Elsevier | [220] |
Table 3.
Most interesting NDT combinations for the assessment of both flexible and rigid pavements.
| InSAR | MSI/HSI | RGB | IRT | LiDAR | RSP | FWD | PSI/USW Seismic | ERT | RH | Covermeter | Ultrasonics |
|---|---|---|---|---|---|---|---|---|---|---|---|
| LiDAR | InSAR | InSAR | InSAR | InSAR | LiDAR | RSP | GPR | InSAR | Covemeter | GPR | IRT |
| IRT | LiDAR | LiDAR | LiDAR | MSI/HSI | RGB | GPR | Ultrasonics | FWD | Half-cell Potential | Ultrasonics | RH |
| GPR | IRT | IRT | MSI/HSI | RGB | FWD | Seismic | GPR | Ultrasonics | Half-cell potential | ||
| Seismic | GPR | GPR | IRT | GPR | ERT | Magnetic | GPR | ||||
| ERT | Ultrasonics | GPR | Gravity | Chain drag | |||||||
| Seismic | |||||||||||
| Resonant images | |||||||||||
| Metal Magnetic Memory |
Publisher’s Note: MDPI stays neutral with regard to jurisdictional claims in published maps and institutional affiliations. |
© 2022 by the authors. Licensee MDPI, Basel, Switzerland. This article is an open access article distributed under the terms and conditions of the Creative Commons Attribution (CC BY) license (https://creativecommons.org/licenses/by/4.0/).
Share and Cite
MDPI and ACS Style
Elseicy, A.; Alonso-Díaz, A.; Solla, M.; Rasol, M.; Santos-Assunçao, S. Combined Use of GPR and Other NDTs for Road Pavement Assessment: An Overview. Remote Sens. 2022, 14, 4336. https://0-doi-org.brum.beds.ac.uk/10.3390/rs14174336
AMA Style
Elseicy A, Alonso-Díaz A, Solla M, Rasol M, Santos-Assunçao S. Combined Use of GPR and Other NDTs for Road Pavement Assessment: An Overview. Remote Sensing. 2022; 14(17):4336. https://0-doi-org.brum.beds.ac.uk/10.3390/rs14174336
Chicago/Turabian StyleElseicy, Ahmed, Alex Alonso-Díaz, Mercedes Solla, Mezgeen Rasol, and Sonia Santos-Assunçao. 2022. "Combined Use of GPR and Other NDTs for Road Pavement Assessment: An Overview" Remote Sensing 14, no. 17: 4336. https://0-doi-org.brum.beds.ac.uk/10.3390/rs14174336
Note that from the first issue of 2016, this journal uses article numbers instead of page numbers. See further details here.