
An Empirical Study on Retinex Methods for Low-Light Image Enhancement


1
College of Computer Science and Software Engineering, Shenzhen University, Shenzhen 518060, China
2
Computer Science Department, Middlesex University, Hendon, London NW4 4BT, UK
*
Author to whom correspondence should be addressed.
†
These authors contributed equally to this work.
Remote Sens. 2022, 14(18), 4608; https://0-doi-org.brum.beds.ac.uk/10.3390/rs14184608
Submission received: 7 August 2022
/
Revised: 9 September 2022
/
Accepted: 11 September 2022
/
Published: 15 September 2022
(This article belongs to the Special Issue Advanced Machine Learning and Deep Learning Approaches for Remote Sensing)
Abstract
:A key part of interpreting, visualizing, and monitoring the surface conditions of remote-sensing images is enhancing the quality of low-light images. It aims to produce higher contrast, noise-suppressed, and better quality images from the low-light version. Recently, Retinex theory-based enhancement methods have gained a lot of attention because of their robustness. In this study, Retinex-based low-light enhancement methods are compared to other state-of-the-art low-light enhancement methods to determine their generalization ability and computational costs. Different commonly used test datasets covering different content and lighting conditions are used to compare the robustness of Retinex-based methods and other low-light enhancement techniques. Different evaluation metrics are used to compare the results, and an average ranking system is suggested to rank the enhancement methods.
1. Introduction
Low-light enhancement methodologies try to recover buried details, remove the noise, restore the color details, and increase the dynamic range and contrast of the low-light images. Low light has inescapable effects on remote monitoring equipment and computer vision tasks. Low signal-to-noise ratio (SNR) causes severe noise in low-light imaging and makes it difficult to extract features for interpreting remote-sensing via computer vision tasks, whereas the performance of computer vision tasks entirely depends on accurate feature extraction [1]. Remote-sensing image enhancement has a wide range of applications in object detection [2,3], object tracking [4,5,6,7], video surveillance [8,9], military applications, daily life [10,11,12,13,14], atmospheric sciences [15], driver assistance systems [16], and agriculture. Earth is continuously being monitored by analyzing the images taken by satellites. Analyzing remotely taken images to help in fire detection, flood prediction, and understanding other environmental issues. Low-light enhancement of these images is playing a vital role in understanding these images in a better way. Even the accuracy of other remote sensing algorithms, such as classification and object detection, depends entirely on the image’s quality. In the literature, different methodologies exist for enhancing such degraded low-light images. Retinex theory-based enhancement methods are widely accepted among these enhancement methodologies due to their robustness. The main purpose of this study is to compare the Retinex-based methods with other non-Retinex-based enhancement methods experimentally. For comparison, we have categorized all the enhancement methods into two major groups (i.e., Retinex-based and non-Retinex-based methods). The Retinex group includes classical and deep learning-based Retinex enhancement methods. Meanwhile, the non Retinex group includes histogram equalization, gamma correction, fusion, and deep learning-based enhancement methods.
According to Retinex theory [17], an image can be decomposed into reflectance and illumination component. The reflectance component is considered an intrinsic component of the image and remains consistent under any lighting condition, whereas the illumination component represents the different lighting conditions. Later on, different Retinex theory based methods, such as single-scale retinex (SSR), [18] multiscale retinex with color restoration (MSRCR) [19], simultaneous reflectance and illumination estimation (SRIE) [20], and low-light illumination map estimation (LIME) [21] were developed for low-light enhancement. These methods produce promising results but may require fine-tuning of parameters and may fail to decompose the image correctly into reflectance and illumination parts. Wei et al. is the first one to introduce a real low/normal-light LOw-Light (LOL) dataset and Retinex theory-based deep network (Retinex-Net) in [22]. Retinex-Net comprises Decom-Net for decomposing the image into reflectance and illumination parts and an Enhance-Net for illumination adjustment. Later on, different Retinex theory-based deep learning methods were developed for low-light image enhancement algorithm [22,23,24,25].
Non-Retinex method such as histogram equalization is one of the simplest methods for enhancing low-light images. It flattens the distribution of pixel values throughout the image to improve contrast. In addition, using entire histogram information may over brighten some regions of the image, deteriorate its visual quality and introduce some artifacts in it. Different histogram-based methods such as local histogram equalization [26] and dynamic histogram equalization [27] were introduced to address these issues. However, these methods require higher computation power, the quality of the output depends on the fine-tuning of parameters, and in case of severe noise, it may produce artifacts. On the other hand, gamma correction based methods [28,29,30] apply the pixel-wise nonlinear operation to enhance the image. The main drawback of these methods is that each pixel is considered an individual entity, and their relationship with neighbor pixels is entirely ignored. Due to this, the output may be inconsistent with real scenes. Lore et al. [31] is the first to propose a learning-based enhancement network named LLNet using a synthetic dataset. Later on, different low-light training datasets (e.g., LOL [22], SID [32], SICE [33], VV (https://sites.google.com/site/vonikakis/datasets (accessed on 7 July 2021)), TM-DIED (https://sites.google.com/site/vonikakis/datasets (accessed on 7 July 2021)), and LLVIP [34]) were developed in order to assist the development of learning-based architectures [35,36,37,38].
Wang et al. [39] present a technical evaluation of different methods for low-light imaging. Most of the methods reviewed are classical, and comparing evaluations on five images is quite unfair. Later on, Qi et al., in [40], provide an overview of low-light enhancement techniques, whereas the quantitative analysis of a few methods only on the synthetic dataset (without noise) is provided. Noise is the most critical part of low-light enhancement and a single synthetic low-light dataset cannot compare performance. In [41], Li et al. propose a low-light image and video dataset to examine the generalization of existing deep learning-based image and video enhancement methods. In sum, low-light enhancement has a wide range of applications and is one of the most important image processing fields. To the best of our knowledge, no such study paper is present in the literature mentioned above that extensively provides the technical evaluation of low-light enhancement methods.
The main purpose of this research is to fairly compare the performance of Retinex-based enhancement methods with non-Retinex enhancement methods on a wide range of test datasets covering different contents and lighting conditions. For a fair comparison, the experimental evaluation criteria are defined first, and then all the methods are compared based on the criteria. In addition, an average ranking system is suggested to rank the enhancement methods based on their robustness. Computational complexity analysis of methods is also carried out on four different image sizes for real-time application. This experimental comparison and suggested ranking system of enhancement methods help the research community to understand their shortcomings and to design more robust models in the future.
The main contribution of this research can be summarized as follows:
- A comprehensive literature review is presented for Retinex-based and non-Retinex methods.
- A detailed experimental analysis is provided for a variety of Retinex-based and non-Retinex methods on a variety of publicly available test datasets using well-known image quality assessment metrics. Experimental results provide a holistic view of this field and provide readers with an understanding of the advantages and disadvantages of existing methodologies. In addition, the inconsistency of commonly used evaluation metrics is pointed out.
- An analysis of the computational effectiveness of enhancement methods is also conducted on images of different sizes. As a result of this computation cost, we can determine which enhancement methods are more suitable for real-time applications.
- Publicly available low-light test datasets were ranked based on experimental analysis. In developing more robust enhancement methods, the reader will benefit from this ranking of benchmarking test datasets.
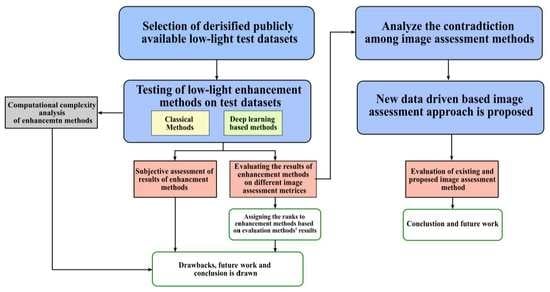
The rest of the paper is organized as follows. Section 2 presents the relevant background knowledge of non-Retinex-based, and Retinex-based classical and advanced low-light enhancement methodologies. Section 3 presents the objectives of overall paper. In Section 4, experimental setup is defined, a detailed discussion of the qualitative, quantitative, and computational analysis of the classical and advanced low-light enhancement methodologies are provided. Section 5, reports the challenges and the future trends. Finally, the conclusion is drawn in Section 6.
2. Fundamentals
A thorough review of the literature related to Retinex-based and non-Retinex-based classical and advanced learning-based low-light enhancement methods is presented in this section. The following subsections contain literature on each of the categories mentioned above.
2.1. Retinex-Based Methods
Classical Retinex-based methods: The Retinex theory was developed by Land after he studied the human retina-and-cortex system in detail [17]. According to the presented theory, an image can be decomposed into two parts: reflectance and illumination. Reflectance is considered an intrinsic property and remains the same regardless of the lighting condition. Illumination is determined by the intensity of light. The following representation can be used to explain it:
where S, R and I represent the source image, reflectance and illumination, respectively and the operator ∘ denotes the element-wise multiplication between R and I. As time progressed, different implementations of Retinex theory were proposed in the literature. Path-based implementation of the Reinex [42,43,44,45,46,47] uses different geometry to calculate the relative brightness of adjacent pixels to obtain the reflection component. Marini and Rizzi proposed a biologically inspired implementation of Retinex for dynamic adjustment and color constancy in their article [45]. In [44], the authors examine the different path-wise approaches in detail and propose a mathematical formula to analyze these approaches. It is worth noting that the number of paths has a significant impact on the accuracy of the results. As a result, these path-wise implementations of Retinex theory suffer from a high degree of dependency on the path and sampling noise, as well as a high cost of computation when fine-tuning parameters.
The new method, random spray Retinex (RSR), was developed by Provenzi after replacing the paths with 2-D pixels sprays in [48]. When paths are replaced with 2-D random points distributed across the image, it is possible to determine the locality of color perception. Even though this approach is faster, the spray radius, radial density function, number of sprays, and pixels per spray must be adjusted. Jobson et al., in [18], used a single-scale Retinex (SSR) to implement Retinex for color constancy, and lightness and color rendition of grayscale images. It is not possible for the SSR to provide both dynamic range compression (small scale) and tonal rendition (large scale) simultaneously. However, it can only perform one of these tasks. Later, the authors of SSR extended their idea to multiscale retinex with color restoration (MSRCR) [19]. As a result of MSRCR, dynamic range compression, color consistency, and tonal rendition can be provided. SSR and MSRCR both improve lighting and scene restoration for digital images, but halo artifacts are visible near edges [49]. The majority of Retinex-based algorithms ignore the illumination component and only extract the reflection component as an enhanced result, but this results in unnaturalness. Enhancing an image is not just about enhancing details but also about maintaining its natural appearance. To solve the unnatural appearance, Wang et al. [50] make three contributions: (1) lightness-order-error metrics are proposed to measure objective quality, (2) bright-pass filters decompose images into reflectance and illumination, and (3) bi-log transformations to map illumination while maintaining the balance between details and naturalness.
Zosso et al. reviewed Retinex-based methods and classified them into five broad categories in [51]. Additionally, a two-step non-local unifying framework is proposed to enhance the results and address the Retinex problem. In the first step, a quasi gradient filter is obtained which satisfies gradient-sparsity and gradient-fidelity prior constraints. As a second step, additional constraints are applied to the calculated quasi-gradient filter in order to make it fit the reflectance data. Guo et al. devised a method named low-light illumination map estimation (LIME) [21] to estimate the illumination of each pixel first; then, apply a structure to that illumination map and use it as the final illumination map. A variational based framework (VF) was introduced for Retinex for the first time by Kimmel et al. [52]. In accordance with previous methods, the objection function is based on the assumption that the illumination field is smooth. On the other hand, this model lacks information regarding reflectance. Later on, different variational approaches to Retinex theory are presented [53,54,55]. In [56], a total variational model (TVM) for Retinex is proposed, assuming spatial smoothness of illumination and piecewise continuity of reflection. In order to minimize TVM, a split Bregman iteration is used. VF and TVM differ primarily in that TVM also takes into account reflection.
Fu et al. proposed a linear domain probabilistic method for simultaneous illumination and reflectance estimation (PM-SIRE) [49]. By using an alternating direction multiplier method, maximum a posteriori (MAP) is employed to estimate illumination and reflectance effectively. Later, Fu et al. presented a weighted variational model for simultaneous illumination and reflectance estimation (WV-SIRE) [20]. A WV-SIRE model is capable of preserving more details about the estimated reflectance as well as suppressing noise more effectively than a log-transformed model. The PM-SIRE and WV-SIRE both assume that illumination changes smoothly over time, which may lead to incorrect illumination estimation. Based on the luminous source, different surfaces are illuminated in different directions.
A fusion-based method for enhancing weakly illuminated images is proposed in [57]. This fusion method decomposes a weakly illuminated image into a reflectance map and an illumination map. By using sigmoid and adaptive histogram equalization functions, the illumination map is further decomposed into luminance-improved and contrast-enhanced versions, and two weights are designed for each. Finally, an enhanced image is obtained by combining the luminance-improved and contrast-improved versions with their corresponding weights in a multi-scale manner. For the purpose of preserving intrinsic and extrinsic priors, Cai et al. proposed a joint intrinsic-extrinsic prior (JieP) model [58]. In JieP, shape prior is used to preserve structure information, texture prior is used to estimate illumination with fine details, and illumination prior is used to capture luminous information. Ying et al. [59] simulate the camera response model (CRM) by investigating the relationship between two different exposure images and use the illumination estimation to estimate the exposure ratio map. Later, the CRM and exposure ratio map are used to produce the enhanced image. According to the CRM algorithm, some dark parts of the body, such as the hair, are misinterpreted as dark backgrounds, and they are over-enhanced as well.
Advanced Retinex-based methods: The robustness of Retinex theory makes it applicable to deep learning methods as well. Wei et al. were the first to combine the idea of Retinex theory with deep learning by proposing the Retinex-Net network. Retinex-Net consists of a Decom-Net for decomposing the image into reflectance and illumination parts and an Enhance-Net for adjusting illumination. Furthermore, they introduce a real low/normal-light Low-Light (LOL) dataset [22]. As a further development of the Retinex theory, Zhang et al. proposed the kindling the darkness (KinD) network in [36]. There are three components of KinD: layer decomposition, reflectance restoration, and illumination adjustment. As a result of layer decomposition, the input image is divided into reflectance and illumination elements, the reflectance part is improved by reflecting restoration and the illumination part is smoothed piece-by-piece by illumination adjustment. By combining the outputs of the reflectance and illumination modules, the final result is achieved. Artifacts, overexposure, and uneven lighting are common problems with KinD outputs. For mitigating these effects, Zhange et al. proposed an improved version of KinD in [60]. This improved version of KinD implements a multi-scale illumination attention module, known as KinD++. KinD++ has improved the quality of output images, but it has a lower computational efficiency than KinD. In [61], a Retinex-based real-low to real-normal network (R2RNet) was proposed. R2RNet consists of a decomposition network, a denoise network, and a relight network, each of which is trained separately using decomposition loss, denoise loss, and relight loss, respectively. As a result of decomposition, illumination and reflectance maps are produced. The denoise-net uses the illumination map as a constraint to reduce the noise in the reflectance map, and the relight-net utilizes the denoised illumination map and reflectance map in order to produce an enhanced output. It is noteworthy that three separately trained networks are utilized to solve the low-light enhancement problem, which is not an optimal strategy. Decomposing an image into illumination and reflectance is a computationally inefficient process. Retinex-based transfer functions were introduced by Lu and Zhange in [23] to solve this decomposition problem. As opposed to decomposing the image, the network learn the transfer function to obtain the enhanced image. Liu et al. [62] introduces reference free Retinex-inspired unrolling with architecture search (RUAS) to reduce computational burden and construct lightweight yet effective enhancement. First, RAUS exploits the intrinsic underexposed structure of low-light images; then, it unrolls the optimization process to establish a holistic propagation model. Wang et al. [63] presents paired seeing dynamic scene in the dark (SDSD) datasets. A self-supervised end-to-end framework based on Retinex is also proposed in order to simultaneously reduce noise and enhance illumination. This framework consists of modules for progressive alignment, self-supervised noise estimation, and illumination map prediction. With progressive alignment, temporal information is utilized to produce blur-free frames, self-supervised noise estimation estimates noise from aligned feature maps of the progressive module, and illumination estimation estimates illumination maps consistent with frame content.
Retinex theory is also used in semi-supervised and zero-shot learning-based techniques for enhancing low light visibility. In Zhang et al. [24], a self-supervised maximum entropy Retinex (ME-Retinex) model is presented. In the ME-Retinex model, a network for enhancing image contrast is coupled with a network for re-enhancing and denoising. Zhao et al. [64] proposed a zero-reference framework named RetinexDIP that draws inspiration from the concept of a deep image prior (DIP). The Retinex decomposition is carried out in a generative manner in RetinexDIP. From random noises as input, RetinexDIP generates both reflectance and illumination maps simultaneously, and enhances the illumination map resulting from this process. The proposed model generalizes well to various scenes, but producing an illumination map requires hundreds of iterations. This iterative learning approach consumes a lot of time to produce optimized results. The robust retinex decomposition network (RRDNet) is a three-branch zero-shot network that is proposed in RRDNet [25] to decompose low-light input images into illumination, reflectance, and noise. RRDNet weights are updated by a zero-shot scheme using a novel non-reference loss function. In the proposed loss function, there are three components: the first part reconstructs the image, the second part enhances the texture of the dark region, and the third part suppresses noise in the dark regions. Qu et al., in [65], segmented an image into sub-images, applied deep reinforcement learning to learn the local exposure for each sub-image and finally adversarial learning is applied to approximate the global aesthetic function. It is also proposed to learn discriminators asynchronously and reuse them as value functions.
2.2. Non-Retinex Methods
Histogram equalization (HE) [66] is one of the earlier methods used for enhancing the dynamic range of low-light images. It is a well-known method due to its simplicity. When the entire image histogram is balanced, the visual quality of the image is deteriorated, false contours are introduced, and annoying artifacts are introduced into the image [67]. As a result, some uniform regions become saturated with very bright and very dark intensities [68]. Gamma correction [69] is a non-linear classical technique that is used for image enhancement. It increases the dark portion of the image while suppressing the bright portion. During gamma correction, each pixel is treated as an individual. It is possible that some regions of the image will be under- or over-enhanced due to a single transformation function used for each pixel.
In later years, deep learning has been applied to my field of study. Lore et al. [31] were the first one to use a stacked sparse based autoencoder approach called LLNet for joint enhancement and noise reduction. There is evidence that deeper networks perform better than non-deeper networks; however, deeper networks suffer from gradient vanishing problems. To use a deeper network and solve the gradient vanishing problem, Tao et al. in LLCNN [70] proposed a special module to utilize multiscale feature maps for low-light enhancement. A multi-branch low-light enhancement network (MBLLEN) is designed by Lv et al. in [71] to extract features of different levels, enhance these multi-level features, and fuse them in order to produce an enhanced image. Additionally, Lv et al. also propose a novel loss function that takes into account the structure information, context information, and regional differences of the image. Wang et al., in [72], propose the global illumination-aware and detail-preserving network (GLADNet). In the first step, GLADNet uses an encoder-decoder network to estimate the global illumination and then reconstructs the details lost during the rescaling process. The major disadvantage of LLNet, LLCN, MBBLEN and GLADNet is that they were trained on synthetically darkened and noise-added datasets. Chen et al. [32] used a Unet based pipeline for enhancing and denoising extremely low-light images using the RAW training see-in-the-dark (SID) dataset. This Unet-based pipeline is designed specifically for images in RAW format. Practically, the most common image format is sRGB. The majority of previous methods have used pixel-wise reconstruction losses and failed to provide effective regularization of the local structure of the image, which in turn undermines the network’s performance. The pixel-to-pixel deterministic mapping results in improperly exposed regions, introduces artifacts, and fails to describe the visual distance between the reference and the enhanced image. A flow-based low-light enhancement method (LLFlow) has been proposed by Wang et al. [38] to address this pixel-to-pixel mapping issue. It is possible to map multi-modal image manifolds into latent distributions using the normalizing flow. Effectively enhanced manifolds can be constructed using the latent distribution.
Getting low-light and normal-light images paired can be difficult, expensive, or impractical. An unpaired low-light enhancement method called EnlightenGAN is proposed by Jiang et al. [73] to eliminate the need for paired training datasets. A global-local discriminator structure and an easy-to-use attention U-net generator are proposed in EnlightenGAN. By designing the attention U-net only to enhance the dark regions more, the image is neither overexposed nor underexposed. A dual global-local discriminator strategy contributes to the balance between local and global enhancement of low-light images. Xiong et al. [74] considered low-light enhancements as two subtasks: illumination enhancement and noise reduction. A two-stage framework referred to as decoupled networks is proposed for handling each task. In decoupled networks, there are two encoder-decoder architectures, the first architecture enhances illumination, and the second architecture suppresses noise by taking the original input along with the enhanced output from stage one. To facilitate unsupervised learning, an adaptive content loss and pseudo triples are proposed. Xia et al. [75] used two images of the scene taken in quick succession (with and without a flash) to generate a noise-free and accurate display of ambient colors. Using a neural network, an image taken without flash is analyzed for color and mood, while an image taken with a flash is analyzed for surface texture and details. One of the major disadvantages of this method is that paired images with and without flash are not generally available.
The camera sensors on mobile phones perform poorly in low-light conditions. An improved face verification method using a semisupervised decomposition and reconstruction network is proposed in [76] to improve accuracy for low-light images of faces. Yang et al. [77] proposes a deep semi-supervised recursive band network (DRBN) to address the decreased visibility, intensive noise, and biased color of low-light images. DRBN learns in two stages, the first stage involves learning the linear band representation by comparing low- and normal-light images, and the second stage involves recomposing the linear band representation from the first stage to fit the visual properties of high-quality images through adversarial learning. Further improvement of the DRBN is impeded by the separation of supervised and unsupervised modules. Qiao et al. [78] further improved DRBN performance by introducing a joint training based semi-supervised algorithm. Wu et al. [79] proposed the lightweight two stream method to overcome the limitations of the training data due to sample bias and the hurdle of the large number of parameters in real-time deployment. Additionally, a self-supervised loss function is proposed to overcome the sample bias of the training data.
Guo et al. [80] proposes zero-reference deep curve estimation (Zero-DCE) rather than performing image-to-image mapping. In order to preserve the contrast of the neighboring pixels, Zero-DCE creates high-order curves from low-light images and then adjusts low-light images pixel-by-pixel using these high-order curves. It is superior to existing GAN-based methods since it does not require paired or unpaired data for its training. Enhanced images are produced with four non-reference loss functions: spatial consistency loss, exposure control loss, color constancy loss, and illumination smoothness loss. The re-design and reformulation of the network structure were subsequently carried out by Li et al., who introduced Zero-DCE++, which is an accelerated and lighter version of Zero-DCE.
3. Objectives of Experimental Study
This research study aims to address the following questions:
- 1.
- It has been noted that although there have been a large number of algorithms developed for low-light enhancement, Retinex theory-based models are gaining more attention due to their robustness. Retinex theory is even used in deep learning-based models. Specifically, this paper attempts to compare the performance of Retinex theory-based classical and deep learning low-light enhancement models with other state-of-the-art models.
- 2.
- Several low-light enhancement methods perform well on some test datasets but fail in real-world scenarios. An extensive range of real-world images should be used to test the robustness of the low-light enhancement models. As a means of assessing the robustness of enhancement methods in real-world scenarios, various test datasets spanning a wide range of lighting conditions and contents need to be selected, and the performance of Retinue-based models needs to be compared with that of other enhancement techniques on these test datasets.
- 3.
- The trend of real-time cellphone night photography is increasing day by day. Therefore, analyzing the computational costs associated with low-light enhancement methods is necessary. Comparison of not only the parameters of these methods but also the processing time for the images of four different sizes (i.e., , , and ) is required. A computational analysis of different sizes of images will enable the researchers to determine whether the computational cost increases linearly or exponentially as the image size increases.
- 4.
- The quality of low-light enhancement methods needs to be evaluated using a variety of image quality assessment (IQA) methods. Every metric aims to identify the particular quality of the predicted image. The LOE measures the naturalness of the image, whereas the information entropy measures the information contained in the image. What is the most effective method of comparing the robustness of low-light enhancement methods when comparing results based on these evaluation metrics?
4. Quantitative and Qualitative Analysis
This subsections of this section present the experimental setup for farily comparing the methods, qualitative, quantitative comparison, and computational cost analysis of enhancement methods. In addition, it also discusses the evaluation metrics and test datasets.
4.1. Experimental Criteria for Enhancement Methods Comparison
To conduct a fair comparison to analyze the enhancement methods generalization, we have selected the nine different publicly available test datasets widely used in the literature for comparing the performance of enhancement methods [64,73,81]. The selected datasets include LIME [21], LOL [22], DICM [82], VV (https://sites.google.com/site/vonikakis/datasets (accessed on 7 July 2021)), MEF [83], NPE [50], LSRW [61], SLL [84] and ExDark [85]. The main purpose of selecting these different nine test datasets is to cover diversified scenes, camera devices, lighting conditions (i.e., weak lighting, under exposure, twilight, dark), and contents. In summary, each test dataset covers a different aspect of low-lighting, scene or content. Therefore, these test datasets are useful to compare the performance of enhancement methods from different aspects.
The four most commonly used no-reference metrics for the quantitative evaluation of low-light enhancement methods are used. These metrics include entropy [86], BRISQUE [87], NIQE [88], and LOE [50]. The entropy measures the information content of an image. a higher value of entropy indicates richer details and a higher contrast level of an image. Blind/referenceless image spatial quality evaluator (BRISQUE) is another commonly used model to quantify the quality of low-light enhancement methods. It does not compute the distortion specific feature, but instead it uses the scene statistics to quantify the loss of naturalness in an image due to the presence of distortion. BRISQIE uses a space vector machine (SVM) regressor to predict the quality of the image. Natural image quality evaluator (NIQE) quantifies the quality of the distorted image by measuring the distance of natural scene statistic (NSS) feature model and the multivariate Gaussian (MVG) feature model of distorted image. Lightness order error (LOE) is designed to measure the order of lightness. The order of lightness represents the direction of the light source and helps to quantify the naturalness preservation. LOE can be defined as follows:
where is a unit step function. It returns 1 if and returns 0 otherwise. m, n represents height and width of the image, respectively. Moreover, and are maximum values among the three color channels at location for the original image and enhanced image, respectively.
In this study, the performance of 17 Retinex-based methods and 17 non-Retinex will be compared. We consider the publicly available codes and recommended settings of these methods to have a fair comparison. The higher value of entropy indicates better quality and for the other three methods (i.e., LOE, NIQE, and BRISQUE) lower values of entropy indicate the better image quality. To show a better understanding the comparison, average ranking has been suggested to enhancement methods based on these IQA methods. For example, the enhancement methods that got the highest average score of entropy on all test datasets are given rank 1 and vice versa. Similarly, the enhancement methods show the lowest average score according to LOE or NIQE or BRISQUE are assigned rank 1 and the highest average score is assigned the highest rank. Rank 1 indicates the best performance and the rank with higher value indicates the worst performance.
In addition, we compare the computational complexity of classical methods on images of four different sizes. The classical codes computational complexity is computed on CPU, whereas those of deep learning-based methods on NVIDIA Titan Xp GPU.
4.2. Qualitative Evaluation of Enhancement Methods
In this section, we provide a detailed description of the qualitative evaluation of enhancement methods. The comparative visual results of the top ten classical and advanced methods on six publicly available test datasets are shown in Figure 1 and Figure 2, respectively. These figures’ first to sixth columns indicate the enhancement results of different methods on LIME, LARW, DICM, ExDark, LOL, and SLL datasets, respectively. For simplicity, deep learning and classical methods are discussed one by one. It is encouraged to zoom in to compare the results.
Zero-shot learning-based methods (i.e., ZeroDCE and RetinexDIP) produce darker and noisy images compared to other methods. The results of GLADNet, TBEFN, and LLFlow are more realistic, sharper, less noisy, and have accurate color rendition. The output images of MBLLEN are over-smoothed and darker but less dark than ZeroDCE. GLADNet, TBEFN, LLFlow, MBLLEN, and KinD are trained on paired data. The supervised learning-based models achieved the appropriate restoration of color and textures, noise suppression, and better generalization. However, no method has produced good results on all the datasets. For example, GLADNet results on DICM are too noisy and produce artifacts on the ExDark image. Similarly, strange artifacts on DICM images are produced by TBEFN. LLFLow produces greenish color around the edges of LSRM image. As it can be seen, StableLLVE has a lighter washed-out effect and smoothed edges on all the results. KinD results look realistic, but some parts of the image look too dark, such as the background chairs in the LOL image. SS-Net produces a good result on the VV test image but produces poor results on DICM and ExDark. Moreover, the strange pattern, missing color information, and other details can be observed easily on the ExDark image. The results of Retinex-based methods (i.e., TBEFN, KinD, SS-Net, RetinexDIP) look more natural and real.
The classical methods (i.e., CVC, DHE, BIMEF, IAGC, and AGCWD) shown in the Figure 2 belong to the non-Retinex category, and PM-SIRE, WV-SRIE, JieP, EFF, and NPE belongs to Retinex theory. If we closely observe their visual results, one thing that is common among majority of these methods is noise. Except for BIMEF and EFF, most results can easily observe noise. The average brightness of BIMEF is too low and does not enhance the overall image. On the other hand, EFF produces higher brightness results, but the image’s details are not too sharp. CVC and IAGC do not accurately render the color information, making their results look black and white. Although some classical methods’ results quality is good, their results are still darker than deep learning-based methods. The results produced by BIMEF, IAGE, and CVC are darker as compared to other classical methods. Over-enhancement, severe noise and loss of color information can be seen in the results of DHE. The results of CVC are not only darker but also lost color information. AGCWD produces low contrast and less bright images, and some parts of the image are too dark (for example background buildings in the LIME test image and the background wall in the LOL test image). Gamma correction-based methods (i.e., AGCWD and IAGC) enhance some parts of the image while darker parts become darker. Strange artifacts around the fire can be easily seen in the IAGC result on the ExDark image.
The results of Retinex-based methods (NPE and WV-SIRE) enhance the image’s brightness, contrast, and sharpness, but fail to suppress the noise. The major issue with the majority of traditional methods is noise suppression. Histogram-based methods work to balance the histogram of the image to increase the brightness and contrast, but there is no such mechanics to remove the noise. Meanwhile, gamma correction-based methods treat each pixel individually and fail to exploit their relationship with neighbor pixels, which results in different artifacts and noise. In contrast, Retinex theory-based methods create different algorithms for successfully decomposing low-light images into reflectance and illumination components. In the case of severe noise, decomposing the image becomes difficult. The noise is not considered a major factor in any of these approaches. Therefore, noise dominates the visual results of these methods. When Figure 1 and Figure 2 are compared, it is evident that deep learning-based methods produce brighter, sharper, cleaner, and higher contrast results. There is still some noise in some results, but compared to traditional methods, it is very low. Contrary to this, traditional visual results have many shortcomings. For example, some results have a lower average brightness, a lesser contrast level, a lesser degree of sharpness, failure to remove noise, and serious color shifts. Some of them enhance the image and the noise associated with it.
4.3. Quantitative Comparison of Enhancement Methods
Four non-reference evaluation metrics were used for the quantitative comparison. There are two reasons for using no-reference-based IQA metrics: (1) the majority of widely used test datasets are no-reference, and (2) unsupervised methods are emerging. Metrics adopted for evaluation include NIQE [88], BRISQUE [87], LOE [50], and Entropy. Low NIQE, BRISQIE, and LOE values indicate better image quality. In contrast, higher values of entropy indicate richer information. Table 1, Table 2, Table 3 and Table 4 provide quantitative results for these metrics. Red indicates the best scores obtained on each dataset, while blue and green indicate the second and third best scores. The LOE indicates that non-Retinex methods perform better, whereas the other three metrics show that performance is uniform across both categories (i.e., Retinex and non-Retinex). Each method is evaluated by four metrics. There is no winner on all four metrics. To determine which method generalizes well, the enhancement methods score on all test data is averaged. The last column of the aforementioned tables represents the average score of enhancement methods on all test datasets. Based on averaged score, ranking number is assigned to each method and we summarize these rankings in Figure 3. Ranking 1 goes to the method with the best average score, and ranking 31 to the method with the worst average score. Different metrics rank enhancement methods differently. For instance, AGCWD ranked first according to LOE metric, whereas the same method is ranked as fifth, eighteenth, and twenty-ninth according to BRISQIE, NIQE, and entropy, respectively. Instead of analyzing the enhancement methods based on different metrics, we have taken the average of the ranking assigned based on the mentioned metrics and discussed the results of this average ranking.
The red line in Figure 3 represents the average ranking achieved by enhancement methods on all test datasets. The average ranking puts GLADNet, TBEFN, and LLFlow in first, second, and third, respectively. GLADNet generalizes well despite being trained on 5000 synthetic images using loss. Retinex-based methods TBEFN, WV-SIRE, JieP, and KinD also generalized well and received the 2nd, 4th, 5th, and 6th rankings, respectively. TBEFN [23] is trained on a mixture of 14,531 patches collected from SICE [33] and LOL [22] datasets using SSIM, total variation, and VGG loss. KinD is based on Retinex theory and trained on LOL. A self-supervised network and a zero-shot-based Retinex method (i.e., self-supervised network and RetinexDIP) ranked 12th and 21st, respectively. MBLLEN is also a supervised learning-based networks and ranked 10th. Meanwhile, MBLLEM is a multi-branch fusion network trained on the PASCAL VOC dataset [101]. Zero-shot learning-based methods such as Zero-DCE got 19th. Among all deep learning-based methods, the top six methods are supervised learning-based methods. It is also worth noticing that among the top ten methods, five are Retinex-based methods and 5 are non-Retinex methods.
4.4. Computational Complexity Analysis of Enhancement Methods
The computational complexity analysis of classical methods and deep learning-based methods is presented in Table 5 and Table 6, respectively. The analysis is conducted on four different test datasets (i.e., LOL, LSRW, VV, and SID). Table 5 and Table 6 report the average time taken and the resolution of a single image for each dataset. For each of these tables, red, blue, and green colors are used to indicate the best, second best, and third best performance, respectively. Results shown in Table 5 have been obtained using a CPU, while results shown in Table 6 have been obtained using an NVIDIA Titan Xp GPU. HE has the shortest runtime of all classical methods. HE just takes around 20.3ms to process an image of resolution . The majority of HE-based methods, such as BPDHE, WAHE, LDR, CVC, and BiHE, are time-efficient, except for DHE. DHE continuously divides an image into several sub-histogram units in order to avoid leaving a dominant portion in newly created sub-histograms. Due to the continual dividing process, this method is the slowest of all the HE-based methods mentioned. Gamma correction-based methods also have good computational efficiency. IAGC takes relatively longer than other methods because it truncates an image’s cumulative distribution function (CDF) and adaptively corrects each truncated CDF.
Furthermore, Retinex-based methods are more computationally expensive than HE and gamma correction-based methods. NPE, PM-SIRE, and WV-SRIE are among the Retinex-based methods that experience significant increases in computation costs with increasing image size. These methods are computationally inefficient due to their iterative approach to finding the optimal solution and use of Gaussian filtering operations. The efficiency of deep learning-based methods depends on the number of parameters that are used. Zero-DCE is the fastest deep learning-based method due to its simplest network architecture and fewer parameters. The majority of deep learning-based methods’ average runtime is between 1.7 ms and 2.57 s. RRDNet iteratively minimizes the error to produce the final enhanced output. The number of iterations varies for different inputs. The iteratively solving the problem makes it the slowest among all the networks. RetinexDIP is another zero-shot learning-based method and performs 300 iterations on each input to produce the final output. The iteratively solving problem makes RetinexDIP and RRDNet the slowest methods. A scatter plot of methods’ performance versus time taken on CPU and GPU is shown in Figure 4 and Figure 5, respectively. We consider CPU methods with less than 1s processing time and GPU methods with less than 0.5s. Methods closer to the origin have a lower computational cost and better performance.
4.5. Difficulty Analysis of Test Datasets
Results of enhancement methods have also been used to rank the nine test datasets. The last row of Table 1, Table 2, Table 3 and Table 4 shows the average score of different enhancement methods on the test datasets based on LOE, NIQE, Entropy, and BRISQUE, respectively. Figure 6 shows the difficulty rank for each dataset across IQA methods. A red line shows the average of all rankings in Figure 6. As determined by the average ranking score, VV is the easiest test dataset, while SLL is the most challenging. SLL is the synthetic dataset with severe noise added. There is too much noise to remove and produce better results. Meanwhile, VV has a lower noise level, making it the easiest dataset. LOL and ExDark are the second and third most difficult datasets. A test dataset’s difficulty level is determined by its noise level. The higher the noise level, the harder it is to recover color details and other information.
4.6. Evaluation IQA methods
To analyze the objective quality of different enhancement methods, we have used LOE, NIQE, Entropy, and BRISQUE as described in Table 1, Table 2, Table 3 and Table 4, respectively. We can easily identify the differences in the evaluations of these metrics if we compare their values among themselves. The best result was produced by the BPDHE enhancement method, according to LOE and NIQE, whereas BRISQUE evaluated MSRCR and Entropy evaluated GLADnet as best methods. Each metric measures a different aspect of the predicted image, which makes their results different. To easily depict and analyze the overall performance of enhancement methods, we have suggested the average rank from 1 to 31 (depending on how many methods are compared) to compare their performance. The best performance is ranked 1, and the worst performance is ranked 31. These rankings can be seen in Figure 3, where the x-axis represents the enhancement methods, and the y-axis represents the ranking. Green, dotted black, blue, and yellow lines in Figure 3 show the rankings of enhancement methods based on LOE, NIQE, BRISQUE, and Entropy metrics, respectively. Moreover, the red line in Figure 3 represents the average of all the rankings mentioned earlier (given based on different metrics). The best method can be chosen based on this average ranking system.
5. Discussion
In this section, we summarize the results obtained and the findings of the overall paper.
- i
- The enhancement methods are evaluated using four evaluation metrics. No method has emerged as the clear winner on all four metrics (LOE, entropy, NIQE, BRISQUE). This is due to the fact that each evaluation method measures a different aspect of enhancement methods (e.g., LOE measures naturalness, entropy measures information content, and NIQE measures distortion). A suggested average ranking system is found to be the most reliable method of comparing the overall performance of enactment methods.
- ii
- In the average ranking system, it has been observed that the three most successful enhancement methods (GLADNet, TBEFN, LLFlow) are based on supervised learning. Among the top ten methods, five are based on Retinex. In comparison to classical, advanced self-supervised, and zero-short learning methods, supervised learning is more effective. Denosing is the most challenging part in enhancement. Noise can be observed in the visual results of outperforming methods.
- iii
- There is no Retinex-based method among the top three fastest methods. As a result of the image decomposition, these methods are more time consuming. As the size of the image increases, the computational time of classical Retinex-based methods increases dramatically. Zero-DCE is the fastest learning-based method, taking approximately 0.017 s to process an image of size . However, it ranks 20th in terms of performance. GLADNet, on the other hand, is ranked first, but it takes approximately 2.772 s to process an image of the same size.
- iv
- The average ranking of all enhancement methods is observed in a broader sense. The results indicate that five methods in the top ten are based on Retinex theory (i.e., TBEFN, WV-SRIE, JieP, KinD, and PM-SIRE). The remaining five fall into different categories (i.e., HE, gamma correction, deep learning). When it comes to real-world scenarios, Retinex theory algorithms are more robust. In contrast, decomposing the image into illumination and reflectance makes them more computationally intensive and, therefore, slower. Computational complexity is the bottleneck for their development in real-world scenarios.
6. Conclusions
In this study, we present an experimental comparison of Retinex-based methods with other non-Retinex methods on nine diversified datasets. According to this study, five out of the top 10 methods are based on Retinex. Researchers are aiming to develop methods that can be generalized and produce enhanced, denoised, color rendered results in real time. Based on the comparisons, ZeroDCE is considered to be the fastest method for processing high-resolution images within 17 milliseconds. However, ZeroDCE ranked 19th and its results were darker and noisy. In contrast, Retinex-based methods have a greater degree of robustness and generalization. The decomposition of the image is a time-consuming process and is a bottleneck in the processing time of Retinex-based methods. Based on the overall ranking, supervised learning methods (e.g., GLADNet, TBEFN, LLFLow) perform better than all other methods. Training images for GLADNet and patches for TBEFN are 5000 images and 14,531 patches, respectively. Both GLADNet and TBEFN are able to generalize well due to their large training data, as well as their Unet architecture which makes them more efficient as compared to other heavy network designs. Moreover, this research evaluated the results of enhancement methods on four different metrics and suggested a method for ranking enhancement methods according to their performance. This research study may help the research community develop more robust and lightweight models for real-time photography and video shooting.
Author Contributions
Conceptualization, M.T.R.; methodology, M.T.R.; software, M.T.R.; validation, M.T.R. and G.G.; formal analysis, M.T.R.; investigation, G.G.; resources, D.S.; data curation, H.K.; writing—original draft preparation, G.G.; writing—review and editing, H.K.; visualization, H.K.; supervision, D.S.; project administration, X.C.; funding acquisition, D.S. All authors have read and agreed to the published version of the manuscript.
Funding
This work is supported by Ministry of Science and Technology China (MOST) Major Program on New Generation of Artificial Intelligence 2030 No. 2018AAA0102200. It is also supported by Natural Science Foundation China (NSFC) Major Project No. 61827814 and Shenzhen Science and Technology Innovation Commission (SZSTI) project No. JCYJ20190808153619413.
Data Availability Statement
Not applicable.
Conflicts of Interest
The authors declare no conflict of interest.
References
- Wang, J.; Wang, W.; Wang, R.; Gao, W. CSPS: An adaptive pooling method for image classification. IEEE Trans. Multimed. 2016, 18, 1000–1010. [Google Scholar] [CrossRef]
- Zhao, Q.; Sheng, T.; Wang, Y.; Tang, Z.; Chen, Y.; Cai, L.; Ling, H. M2det: A single-shot object detector based on multi-level feature pyramid network. In Proceedings of the AAAI Conference on Artificial Intelligence, Atlanta, GA, USA, 8–12 October 2019; Volume 33, pp. 9259–9266. [Google Scholar]
- Rezatofighi, H.; Tsoi, N.; Gwak, J.; Sadeghian, A.; Reid, I.; Savarese, S. Generalized intersection over union: A metric and a loss for bounding box regression. In Proceedings of the IEEE/CVF Conference on Computer Vision and Pattern Recognition, Long Beach, CA, USA, 15–20 June 2019; pp. 658–666. [Google Scholar]
- Bertinetto, L.; Valmadre, J.; Henriques, J.F.; Vedaldi, A.; Torr, P.H. Fully-convolutional siamese networks for object tracking. In Proceedings of the European Conference on Computer Vision, Munich, Germany, 8–14 September 2016; Springer: Berlin/Heidelberg, Germany, 2016; pp. 850–865. [Google Scholar]
- He, A.; Luo, C.; Tian, X.; Zeng, W. A twofold siamese network for real-time object tracking. In Proceedings of the IEEE Conference on Computer Vision and Pattern Recognition, Salt Lake City, UT, USA, 18–22 June 2018; pp. 4834–4843. [Google Scholar]
- Luo, W.; Sun, P.; Zhong, F.; Liu, W.; Zhang, T.; Wang, Y. End-to-end active object tracking via reinforcement learning. In Proceedings of the International Conference on Machine Learning, PMLR, Stockholm, Sweden, 10–15 July 2018; pp. 3286–3295. [Google Scholar]
- Ristani, E.; Tomasi, C. Features for multi-target multi-camera tracking and re-identification. In Proceedings of the IEEE Conference on Computer Vision and Pattern Recognition, Salt Lake City, UT, USA, 18–23 June 2018; pp. 6036–6046. [Google Scholar]
- Saini, M.; Wang, X.; Atrey, P.K.; Kankanhalli, M. Adaptive workload equalization in multi-camera surveillance systems. IEEE Trans. Multimed. 2012, 14, 555–562. [Google Scholar] [CrossRef]
- Feng, W.; Ji, D.; Wang, Y.; Chang, S.; Ren, H.; Gan, W. Challenges on large scale surveillance video analysis. In Proceedings of the IEEE Conference on Computer Vision and Pattern Recognition Workshops, Salt Lake City, UT, USA, 18–23 June 2018; pp. 69–76. [Google Scholar]
- Ko, S.; Yu, S.; Kang, W.; Park, C.; Lee, S.; Paik, J. Artifact-free low-light video enhancement using temporal similarity and guide map. IEEE Trans. Ind. Electron. 2017, 64, 6392–6401. [Google Scholar] [CrossRef]
- Rasheed, M.T.; Shi, D. LSR: Lightening super-resolution deep network for low-light image enhancement. Neurocomputing 2022, 505, 263–275. [Google Scholar] [CrossRef]
- Khan, H.; Wang, X.; Liu, H. Handling missing data through deep convolutional neural network. Inf. Sci. 2022, 595, 278–293. [Google Scholar] [CrossRef]
- Khan, H.; Wang, X.; Liu, H. Missing value imputation through shorter interval selection driven by Fuzzy C-Means clustering. Comput. Electr. Eng. 2021, 93, 107230. [Google Scholar] [CrossRef]
- Khan, H.; Liu, H.; Liu, C. Missing label imputation through inception-based semi-supervised ensemble learning. Adv. Comput. Intell. 2022, 2, 1–11. [Google Scholar] [CrossRef]
- Ellrod, G.P. Advances in the detection and analysis of fog at night using GOES multispectral infrared imagery. Weather. Forecast. 1995, 10, 606–619. [Google Scholar] [CrossRef]
- Negru, M.; Nedevschi, S.; Peter, R.I. Exponential contrast restoration in fog conditions for driving assistance. IEEE Trans. Intell. Transp. Syst. 2015, 16, 2257–2268. [Google Scholar] [CrossRef]
- Land, E.H. The retinex theory of color vision. Sci. Am. 1977, 237, 108–129. [Google Scholar] [CrossRef]
- Jobson, D.J.; Rahman, Z.U.; Woodell, G.A. Properties and performance of a center/surround retinex. IEEE Trans. Image Process. 1997, 6, 451–462. [Google Scholar] [CrossRef] [PubMed]
- Jobson, D.J.; Rahman, Z.U.; Woodell, G.A. A multiscale retinex for bridging the gap between color images and the human observation of scenes. IEEE Trans. Image Process. 1997, 6, 965–976. [Google Scholar] [CrossRef] [PubMed]
- Fu, X.; Zeng, D.; Huang, Y.; Zhang, X.P.; Ding, X. A weighted variational model for simultaneous reflectance and illumination estimation. In Proceedings of the IEEE Conference on Computer Vision and Pattern Recognition, Las Vegas, NV, USA, 26 June–1 July 2016; pp. 2782–2790. [Google Scholar]
- Guo, X.; Li, Y.; Ling, H. LIME: Low-light image enhancement via illumination map estimation. IEEE Trans. Image Process. 2016, 26, 982–993. [Google Scholar] [CrossRef] [PubMed]
- Wei, C.; Wang, W.; Yang, W.; Liu, J. Deep retinex decomposition for low-light enhancement. arXiv 2018, arXiv:1808.04560. [Google Scholar]
- Lu, K.; Zhang, L. TBEFN: A two-branch exposure-fusion network for low-light image enhancement. IEEE Trans. Multimed. 2020, 23, 4093–4105. [Google Scholar] [CrossRef]
- Zhang, Y.; Di, X.; Zhang, B.; Li, Q.; Yan, S.; Wang, C. Self-supervised Low Light Image Enhancement and Denoising. arXiv 2021, arXiv:2103.00832. [Google Scholar]
- Zhu, A.; Zhang, L.; Shen, Y.; Ma, Y.; Zhao, S.; Zhou, Y. Zero-shot restoration of underexposed images via robust retinex decomposition. In Proceedings of the 2020 IEEE International Conference on Multimedia and Expo (ICME), London, UK, 6–10 July 2020; pp. 1–6. [Google Scholar]
- Gonzalez, R.C. Digital Image Processing, 2nd ed.; Addison-Wesley: Boston, MA, USA, 1992. [Google Scholar]
- Abdullah-Al-Wadud, M.; Kabir, M.H.; Dewan, M.A.A.; Chae, O. A dynamic histogram equalization for image contrast enhancement. IEEE Trans. Consum. Electron. 2007, 53, 593–600. [Google Scholar] [CrossRef]
- Rahman, S.; Rahman, M.M.; Abdullah-Al-Wadud, M.; Al-Quaderi, G.D.; Shoyaib, M. An adaptive gamma correction for image enhancement. EURASIP J. Image Video Process 2016, 35, 2016. [Google Scholar] [CrossRef]
- Huang, S.C.; Cheng, F.C.; Chiu, Y.S. Efficient contrast enhancement using adaptive gamma correction with weighting distribution. IEEE Trans. Image Process. 2012, 22, 1032–1041. [Google Scholar] [CrossRef]
- Wang, Z.G.; Liang, Z.H.; Liu, C.L. A real-time image processor with combining dynamic contrast ratio enhancement and inverse gamma correction for PDP. Displays 2009, 30, 133–139. [Google Scholar] [CrossRef]
- Lore, K.G.; Akintayo, A.; Sarkar, S. LLNet: A deep autoencoder approach to natural low-light image enhancement. Pattern Recognit. 2017, 61, 650–662. [Google Scholar] [CrossRef]
- Chen, C.; Chen, Q.; Xu, J.; Koltun, V. Learning to see in the dark. In Proceedings of the IEEE Conference on Computer Vision and Pattern Recognition, Salt Lake City, UT, USA, 18–23 June 2018; pp. 3291–3300. [Google Scholar]
- Cai, J.; Gu, S.; Zhang, L. Learning a deep single image contrast enhancer from multi-exposure images. IEEE Trans. Image Process. 2018, 27, 2049–2062. [Google Scholar] [CrossRef] [PubMed]
- Jia, X.; Zhu, C.; Li, M.; Tang, W.; Zhou, W. LLVIP: A Visible-infrared Paired Dataset for Low-light Vision. In Proceedings of the IEEE/CVF International Conference on Computer Vision, Montreal, QC, Canada, 10–17 October 2021; pp. 3496–3504. [Google Scholar]
- Park, J.; Lee, J.Y.; Yoo, D.; Kweon, I.S. Distort-and-recover: Color enhancement using deep reinforcement learning. In Proceedings of the IEEE Conference on Computer Vision and Pattern Recognition, Salt Lake City, UT, USA, 18–23 June 2018; pp. 5928–5936. [Google Scholar]
- Zhang, Y.; Zhang, J.; Guo, X. Kindling the darkness: A practical low-light image enhancer. In Proceedings of the 27th ACM International Conference on Multimedia, Nice, France, 21–25 October 2019; pp. 1632–1640. [Google Scholar]
- Zheng, C.; Shi, D.; Shi, W. Adaptive Unfolding Total Variation Network for Low-Light Image Enhancement. In Proceedings of the IEEE/CVF International Conference on Computer Vision, Montreal, QC, Canada, 10–17 October 2021; pp. 4439–4448. [Google Scholar]
- Wang, Y.; Wan, R.; Yang, W.; Li, H.; Chau, L.P.; Kot, A.C. Low-Light Image Enhancement with Normalizing Flow. arXiv 2021, arXiv:2109.05923. [Google Scholar] [CrossRef]
- Wang, W.; Wu, X.; Yuan, X.; Gao, Z. An experiment-based review of low-light image enhancement methods. IEEE Access 2020, 8, 87884–87917. [Google Scholar] [CrossRef]
- Qi, Y.; Yang, Z.; Sun, W.; Lou, M.; Lian, J.; Zhao, W.; Deng, X.; Ma, Y. A Comprehensive Overview of Image Enhancement Techniques. Arch. Comput. Methods Eng. 2021, 29, 583–607. [Google Scholar] [CrossRef]
- Li, C.; Guo, C.; Han, L.H.; Jiang, J.; Cheng, M.M.; Gu, J.; Loy, C.C. Low-light image and video enhancement using deep learning: A survey. IEEE Trans. Pattern Anal. Mach. Intell. 2021, 1. [Google Scholar] [CrossRef]
- Land, E.H.; McCann, J.J. Lightness and retinex theory. Josa 1971, 61, 1–11. [Google Scholar] [CrossRef]
- Land, E.H. Recent advances in retinex theory and some implications for cortical computations: Color vision and the natural image. Proc. Natl. Acad. Sci. USA 1983, 80, 5163. [Google Scholar] [CrossRef]
- Provenzi, E.; De Carli, L.; Rizzi, A.; Marini, D. Mathematical definition and analysis of the Retinex algorithm. JOSA A 2005, 22, 2613–2621. [Google Scholar] [CrossRef]
- Marini, D.; Rizzi, A. A computational approach to color adaptation effects. Image Vis. Comput. 2000, 18, 1005–1014. [Google Scholar] [CrossRef]
- Land, E.H. An alternative technique for the computation of the designator in the retinex theory of color vision. Proc. Natl. Acad. Sci. USA 1986, 83, 3078–3080. [Google Scholar] [CrossRef] [PubMed]
- Cooper, T.J.; Baqai, F.A. Analysis and extensions of the Frankle-McCann Retinex algorithm. J. Electron. Imaging 2004, 13, 85–92. [Google Scholar] [CrossRef]
- Provenzi, E.; Fierro, M.; Rizzi, A.; De Carli, L.; Gadia, D.; Marini, D. Random spray Retinex: A new Retinex implementation to investigate the local properties of the model. IEEE Trans. Image Process. 2006, 16, 162–171. [Google Scholar] [CrossRef] [PubMed]
- Fu, X.; Liao, Y.; Zeng, D.; Huang, Y.; Zhang, X.P.; Ding, X. A probabilistic method for image enhancement with simultaneous illumination and reflectance estimation. IEEE Trans. Image Process. 2015, 24, 4965–4977. [Google Scholar] [CrossRef] [PubMed]
- Wang, S.; Zheng, J.; Hu, H.M.; Li, B. Naturalness preserved enhancement algorithm for non-uniform illumination images. IEEE Trans. Image Process. 2013, 22, 3538–3548. [Google Scholar] [CrossRef] [PubMed]
- Zosso, D.; Tran, G.; Osher, S.J. Non-Local Retinex—A Unifying Framework and Beyond. SIAM J. Imaging Sci. 2015, 8, 787–826. [Google Scholar] [CrossRef]
- Kimmel, R.; Elad, M.; Shaked, D.; Keshet, R.; Sobel, I. A variational framework for retinex. Int. J. Comput. Vis. 2003, 52, 7–23. [Google Scholar] [CrossRef]
- Ma, W.; Osher, S. A TV Bregman iterative model of Retinex theory. Inverse Probl. Imaging 2012, 6, 697. [Google Scholar] [CrossRef]
- Ma, W.; Morel, J.M.; Osher, S.; Chien, A. An L 1-based variational model for Retinex theory and its application to medical images. In Proceedings of the CVPR, Colorado Springs, CO, USA, 20–25 June 2011; pp. 153–160. [Google Scholar]
- Fu, X.; Zeng, D.; Huang, Y.; Ding, X.; Zhang, X.P. A variational framework for single low light image enhancement using bright channel prior. In Proceedings of the 2013 IEEE Global Conference on Signal and Information Processing, Austin, TX, USA, 3–5 December 2013; pp. 1085–1088. [Google Scholar]
- Ng, M.K.; Wang, W. A total variation model for Retinex. SIAM J. Imaging Sci. 2011, 4, 345–365. [Google Scholar] [CrossRef]
- Fu, X.; Zeng, D.; Huang, Y.; Liao, Y.; Ding, X.; Paisley, J. A fusion-based enhancing method for weakly illuminated images. Signal Process. 2016, 129, 82–96. [Google Scholar] [CrossRef]
- Cai, B.; Xu, X.; Guo, K.; Jia, K.; Hu, B.; Tao, D. A joint intrinsic-extrinsic prior model for retinex. In Proceedings of the IEEE International Conference on Computer Vision, Venice, Italy, 22–29 October 2017; pp. 4000–4009. [Google Scholar]
- Ying, Z.; Li, G.; Ren, Y.; Wang, R.; Wang, W. A new low-light image enhancement algorithm using camera response model. In Proceedings of the IEEE International Conference on Computer Vision Workshops, Venice, Italy, 22–29 October 2017; pp. 3015–3022. [Google Scholar]
- Zhang, Y.; Guo, X.; Ma, J.; Liu, W.; Zhang, J. Beyond brightening low-light images. Int. J. Comput. Vis. 2021, 129, 1013–1037. [Google Scholar] [CrossRef]
- Hai, J.; Xuan, Z.; Yang, R.; Hao, Y.; Zou, F.; Lin, F.; Han, S. R2RNet: Low-light Image Enhancement via Real-low to Real-normal Network. arXiv 2021, arXiv:2106.14501. [Google Scholar]
- Liu, R.; Ma, L.; Zhang, J.; Fan, X.; Luo, Z. Retinex-inspired unrolling with cooperative prior architecture search for low-light image enhancement. In Proceedings of the IEEE/CVF Conference on Computer Vision and Pattern Recognition, Nashville, TN, USA, 20–25 June 2021; pp. 10561–10570. [Google Scholar]
- Wang, R.; Xu, X.; Fu, C.W.; Lu, J.; Yu, B.; Jia, J. Seeing Dynamic Scene in the Dark: A High-Quality Video Dataset With Mechatronic Alignment. In Proceedings of the IEEE/CVF International Conference on Computer Vision, Montreal, QC, Canada, 10–17 October 2021; pp. 9700–9709. [Google Scholar]
- Zhao, Z.; Xiong, B.; Wang, L.; Ou, Q.; Yu, L.; Kuang, F. RetinexDIP: A Unified Deep Framework for Low-light Image Enhancement. IEEE Trans. Circuits Syst. Video Technol. 2021, 32, 1076–1088. [Google Scholar] [CrossRef]
- Yu, R.; Liu, W.; Zhang, Y.; Qu, Z.; Zhao, D.; Zhang, B. Deepexposure: Learning to expose photos with asynchronously reinforced adversarial learning. In Proceedings of the 32nd International Conference on Neural Information Processing Systems, Montreal, QC, Canada, 3–8 December 2018; pp. 2153–2163. [Google Scholar]
- Cheng, H.; Shi, X. A simple and effective histogram equalization approach to image enhancement. Digit. Signal Process. 2004, 14, 158–170. [Google Scholar] [CrossRef]
- Kim, Y.T. Contrast enhancement using brightness preserving bi-histogram equalization. IEEE Trans. Consum. Electron. 1997, 43, 1–8. [Google Scholar]
- Ibrahim, H.; Kong, N.S.P. Brightness preserving dynamic histogram equalization for image contrast enhancement. IEEE Trans. Consum. Electron. 2007, 53, 1752–1758. [Google Scholar] [CrossRef]
- Guan, X.; Jian, S.; Hongda, P.; Zhiguo, Z.; Haibin, G. An image enhancement method based on gamma correction. In Proceedings of the 2009 Second International Symposium on Computational Intelligence and Design, Changsha, China, 12–14 December 2009; Volume 1, pp. 60–63. [Google Scholar]
- Tao, L.; Zhu, C.; Xiang, G.; Li, Y.; Jia, H.; Xie, X. LLCNN: A convolutional neural network for low-light image enhancement. In Proceedings of the 2017 IEEE Visual Communications and Image Processing (VCIP), St. Petersburg, FL, USA, 10–13 December 2017; pp. 1–4. [Google Scholar]
- Lv, F.; Lu, F.; Wu, J.; Lim, C. MBLLEN: Low-Light Image/Video Enhancement Using CNNs. In Proceedings of the BMVC, Newcastle, UK, 3–6 September 2018; p. 220. [Google Scholar]
- Wang, W.; Wei, C.; Yang, W.; Liu, J. GLADNet: Low-light enhancement network with global awareness. In Proceedings of the 2018 13th IEEE International Conference on Automatic Face & Gesture Recognition (FG 2018), Jodhpur, India, 15–18 December 2018; pp. 751–755. [Google Scholar]
- Jiang, Y.; Gong, X.; Liu, D.; Cheng, Y.; Fang, C.; Shen, X.; Yang, J.; Zhou, P.; Wang, Z. Enlightengan: Deep light enhancement without paired supervision. IEEE Trans. Image Process. 2021, 30, 2340–2349. [Google Scholar] [CrossRef]
- Xiong, W.; Liu, D.; Shen, X.; Fang, C.; Luo, J. Unsupervised real-world low-light image enhancement with decoupled networks. arXiv 2020, arXiv:2005.02818. [Google Scholar]
- Xia, Z.; Gharbi, M.; Perazzi, F.; Sunkavalli, K.; Chakrabarti, A. Deep Denoising of Flash and No-Flash Pairs for Photography in Low-Light Environments. In Proceedings of the IEEE/CVF Conference on Computer Vision and Pattern Recognition, Nashville, TN, USA, 20–25 June 2021; pp. 2063–2072. [Google Scholar]
- Le, H.A.; Kakadiaris, I.A. SeLENet: A semi-supervised low light face enhancement method for mobile face unlock. In Proceedings of the 2019 International Conference on Biometrics (ICB), Crete, Greece, 4–7 June 2019; pp. 1–8. [Google Scholar]
- Yang, W.; Wang, S.; Fang, Y.; Wang, Y.; Liu, J. From fidelity to perceptual quality: A semi-supervised approach for low-light image enhancement. In Proceedings of the IEEE/CVF Conference on Computer Vision and Pattern Recognition, Seattle, WA, USA, 13–19 June 2020; pp. 3063–3072. [Google Scholar]
- Qiao, Z.; Xu, W.; Sun, L.; Qiu, S.; Guo, H. Deep Semi-Supervised Learning for Low-Light Image Enhancement. In Proceedings of the 2021 14th International Congress on Image and Signal Processing, BioMedical Engineering and Informatics (CISP-BMEI), Online. 23–25 October 2021; pp. 1–6. [Google Scholar]
- Wu, W.; Wang, W.; Jiang, K.; Xu, X.; Hu, R. Self-Supervised Learning on A Lightweight Low-Light Image Enhancement Model with Curve Refinement. In Proceedings of the ICASSP 2022–2022 IEEE International Conference on Acoustics, Speech and Signal Processing (ICASSP), Singapore, 22–27 May 2022; pp. 1890–1894. [Google Scholar]
- Guo, C.G.; Li, C.; Guo, J.; Loy, C.C.; Hou, J.; Kwong, S.; Cong, R. Zero-reference deep curve estimation for low-light image enhancement. In Proceedings of the IEEE Conference on Computer Vision and Pattern Recognition (CVPR), Seattle, WA, USA, 13–19 June 2020; pp. 1780–1789. [Google Scholar]
- Wang, L.W.; Liu, Z.S.; Siu, W.C.; Lun, D.P. Lightening network for low-light image enhancement. IEEE Trans. Image Process. 2020, 29, 7984–7996. [Google Scholar] [CrossRef]
- Lee, C.; Lee, C.; Kim, C.S. Contrast enhancement based on layered difference representation of 2D histograms. IEEE Trans. Image Process. 2013, 22, 5372–5384. [Google Scholar] [CrossRef]
- Ma, K.; Zeng, K.; Wang, Z. Perceptual quality assessment for multi-exposure image fusion. IEEE Trans. Image Process. 2015, 24, 3345–3356. [Google Scholar] [CrossRef] [PubMed]
- Lv, F.; Li, Y.; Lu, F. Attention guided low-light image enhancement with a large scale low-light simulation dataset. arXiv 2019, arXiv:1908.00682. [Google Scholar] [CrossRef]
- Loh, Y.P.; Chan, C.S. Getting to know low-light images with the exclusively dark dataset. Comput. Vis. Image Underst. 2019, 178, 30–42. [Google Scholar] [CrossRef]
- Gonzalez, R.C. Digital Image Processing; Pearson Education India: Noida, India, 2009. [Google Scholar]
- Mittal, A.; Moorthy, A.K.; Bovik, A.C. No-reference image quality assessment in the spatial domain. IEEE Trans. Image Process. 2012, 21, 4695–4708. [Google Scholar] [CrossRef] [PubMed]
- Mittal, A.; Soundararajan, R.; Bovik, A.C. Making a “completely blind” image quality analyzer. IEEE Signal Process. Lett. 2012, 20, 209–212. [Google Scholar] [CrossRef]
- Papasaika-Hanusch, H. Digital image PROCESSING Using Matlab; Institute of Geodesy and Photogrammetry, ETH Zurich: Zurich, Switzerland, 1967; Volume 63. [Google Scholar]
- Celik, T.; Tjahjadi, T. Contextual and variational contrast enhancement. IEEE Trans. Image Process. 2011, 20, 3431–3441. [Google Scholar] [CrossRef]
- Pizer, S.M. Contrast-limited adaptive histogram equalization: Speed and effectiveness stephen m. pizer, r. eugene johnston, james p. ericksen, bonnie c. yankaskas, keith e. muller medical image display research group. In Proceedings of the First Conference on Visualization in Biomedical Computing, Atlanta, GA, USA, 22–25 May 1990; Volume 337. [Google Scholar]
- Cao, G.; Huang, L.; Tian, H.; Huang, X.; Wang, Y.; Zhi, R. Contrast enhancement of brightness-distorted images by improved adaptive gamma correction. Comput. Electr. Eng. 2018, 66, 569–582. [Google Scholar] [CrossRef]
- Ying, Z.; Li, G.; Gao, W. A bio-inspired multi-exposure fusion framework for low-light image enhancement. arXiv 2017, arXiv:1711.00591. [Google Scholar]
- Afifi, M.; Derpanis, K.G.; Ommer, B.; Brown, M.S. Learning Multi-Scale Photo Exposure Correction. In Proceedings of the IEEE/CVF Conference on Computer Vision and Pattern Recognition, Nashville, TN, USA, 20–25 June 2021; pp. 9157–9167. [Google Scholar]
- Zhang, F.; Li, Y.; You, S.; Fu, Y. Learning Temporal Consistency for Low Light Video Enhancement From Single Images. In Proceedings of the IEEE/CVF Conference on Computer Vision and Pattern Recognition (CVPR), Nashville, TN, USA, 20–25 June 2021; pp. 4967–4976. [Google Scholar]
- Li, C.; Guo, J.; Porikli, F.; Pang, Y. LightenNet: A convolutional neural network for weakly illuminated image enhancement. Pattern Recognit. Lett. 2018, 104, 15–22. [Google Scholar] [CrossRef]
- Hu, Y.; He, H.; Xu, C.; Wang, B.; Lin, S. Exposure: A white-box photo post-processing framework. ACM Trans. Graph. (TOG) 2018, 37, 1–17. [Google Scholar] [CrossRef]
- Ying, Z.; Li, G.; Ren, Y.; Wang, R.; Wang, W. A new image contrast enhancement algorithm using exposure fusion framework. In Proceedings of the International Conference on Computer Analysis of Images and Patterns, Ystad, Sweden, 22–24 August 2017; Springer: Berlin/Heidelberg, Germany, 2017; pp. 36–46. [Google Scholar]
- Pu, T.; Wang, S. Perceptually motivated enhancement method for non-uniformly illuminated images. IET Comput. Vis. 2018, 12, 424–433. [Google Scholar] [CrossRef]
- Al-Ameen, Z. Nighttime image enhancement using a new illumination boost algorithm. IET Image Process. 2019, 13, 1314–1320. [Google Scholar] [CrossRef]
- Everingham, M.; Van Gool, L.; Williams, C.K.; Winn, J.; Zisserman, A. The pascal visual object classes (voc) challenge. Int. J. Comput. Vis. 2010, 88, 303–338. [Google Scholar] [CrossRef] [Green Version]
Figure 1.
A visual representation of results from top ten deep learning methods on six datasets. The rows are showing the results produced by different algorithms, whereas the columns are showing datasets.
Figure 1.
A visual representation of results from top ten deep learning methods on six datasets. The rows are showing the results produced by different algorithms, whereas the columns are showing datasets.

Figure 2.
A visual representation of results from top ten classical methods on six datasets. The rows are showing the results produced by different algorithms, whereas the columns are showing datasets.
Figure 2.
A visual representation of results from top ten classical methods on six datasets. The rows are showing the results produced by different algorithms, whereas the columns are showing datasets.

Figure 3.
Different IQA metrics are used to rank the enhancement methods. Rank values range from 1 to 31. A rank value of 1 indicates the highest performance based on a particular IAQ method, and a rank value of 1 indicates the worst performance. The average rank is shown in red.
Figure 3.
Different IQA metrics are used to rank the enhancement methods. Rank values range from 1 to 31. A rank value of 1 indicates the highest performance based on a particular IAQ method, and a rank value of 1 indicates the worst performance. The average rank is shown in red.

Figure 4.
Avg. ranking versus Time is shown for each enhancement method. Only the methods take less than 1 s on CPU (Intel(R) Core(TM) i7-6700 CPU @ 3.40 GHz 3.41 GHz) with 16 GB RAM to process the image of size is shown in the figure. Red dots represent non-Retinex methods, while blue dots represent Retinex methods.

Figure 5.
Avg. ranking versus Time is shown for each enhancement method. Only the methods take less than 0.5 s on GPU (NVIDIA Titan Xp GPU) to process the image of size is shown in the figure. Red dots represent non-Retinex methods, while blue dots represent Retinex methods.
Figure 5.
Avg. ranking versus Time is shown for each enhancement method. Only the methods take less than 0.5 s on GPU (NVIDIA Titan Xp GPU) to process the image of size is shown in the figure. Red dots represent non-Retinex methods, while blue dots represent Retinex methods.

Figure 6.
Each test dataset has been ranked based on its difficulty. Rank values range from 1 to 9. A lower rank indicates less difficulty, a higher rank indicates more difficulty.
Figure 6.
Each test dataset has been ranked based on its difficulty. Rank values range from 1 to 9. A lower rank indicates less difficulty, a higher rank indicates more difficulty.


Table 1.
Quantitative comparison of enhancement algorithms on nine test datasets using LOE metric. A lower value of the LOE metric indicates better performance. The first, second, and third best scores are highlighted with red, blue, and green colors, respectively.
Table 1.
Quantitative comparison of enhancement algorithms on nine test datasets using LOE metric. A lower value of the LOE metric indicates better performance. The first, second, and third best scores are highlighted with red, blue, and green colors, respectively.
| Datasets | LIME | LOL | DICM | VV | MEF | NPE | LSRW | SLL | ExDark | Average | |
|---|---|---|---|---|---|---|---|---|---|---|---|
| Methods | |||||||||||
| Non-Retinex Methods | HE [89] | 290.280 | 423.910 | 283.980 | 280.750 | 406.930 | 184.590 | 122.84 | 753.990 | 408.76 | 358.222 |
| DHE [27] | 7.663 | 22.227 | 75.608 | 21.013 | 7.852 | 23.974 | 13.930 | 10.177 | 138.049 | 35.610 | |
| BPDHE [68] | 6.960 | 125.046 | 14.936 | 4.110 | 5.480 | 7.643 | 5.985 | 382.146 | 134.774 | 76.342 | |
| CVC [90] | 99.386 | 286.840 | 135.324 | 91.217 | 97.464 | 131.478 | 124.946 | 324.260 | 189.896 | 164.534 | |
| CLAHE [91] | 183.094 | 397.432 | 386.183 | 209.867 | 224.280 | 379.588 | 242.572 | 504.013 | 252.236 | 308.807 | |
| AGCWD [29] | 10.075 | 0.1325 | 57.482 | 14.777 | 6.046 | 31.432 | 1.463 | 6.132 | 137.990 | 31.932 | |
| IAGC [92] | 63.028 | 170.190 | 53.502 | 55.943 | 66.710 | 41.488 | 77.123 | 278.054 | 165.790 | 113.600 | |
| BIMEF [93] | 136.898 | 141.159 | 239.271 | 102.891 | 155.616 | 225.588 | 117.777 | 480.848 | 237.563 | 212.589 | |
| MBLLEN [71] | 122.188 | 302.577 | 176.580 | 79.013 | 131.243 | 123.871 | 168.128 | 484.809 | 190.384 | 207.076 | |
| GLADNet [72] | 123.603 | 349.720 | 285.239 | 145.034 | 199.632 | 203.488 | 204.887 | 518.189 | 262.524 | 254.702 | |
| DLN [81] | 132.594 | 264.065 | 404.673 | 325.572 | 189.831 | - | 176.527 | 528.411 | 212.723 | - | |
| Zero-DCE [80] | 135.032 | 209.426 | 340.803 | 145.435 | 164.262 | 312.392 | 219.127 | 539.673 | 315.084 | 280.775 | |
| Exposure Correction [94] | 242.461 | 438.420 | 362.552 | 220.876 | 275.476 | 314.833 | 288.659 | 588.132 | 307.881 | 349.604 | |
| StableLLVE [95] | 134.130 | 267.686 | 476.374 | 192.262 | 198.069 | 394.811 | 179.101 | 344.573 | 248.400 | 287.660 | |
| LightenNet [96] | 681.834 | 387.204 | 772.380 | 328.510 | 896.201 | 714.390 | 930.978 | 924.638 | 636.000 | 698.788 | |
| White-box [97] | 90.876 | 125.682 | 195.516 | 124.115 | 96.704 | 120.687 | 84.279 | 370.972 | 135.606 | 156.695 | |
| LLFlow [38] | 365.530 | 367.153 | 563.765 | 300.058 | 430.534 | 538.078 | 685.344 | 764.261 | 445.274 | 511.808 | |
| Retinex-based Methods | LIME [21] | 559.618 | 404.114 | 818.660 | 460.440 | 618.480 | 870.215 | 434.485 | 1103.98 | 575.987 | 649.553 |
| NPE [50] | 300.505 | 317.399 | 264.604 | 352.294 | 344.953 | 257.010 | 435.676 | 293.158 | 358.018 | 327.889 | |
| JieP [58] | 249.137 | 314.798 | 287.305 | 137.026 | 292.798 | 305.435 | 216.597 | 690.829 | 345.754 | 323.818 | |
| PM-SIRE [49] | 113.631 | 73.558 | 152.779 | 113.031 | 166.640 | 104.945 | 143.945 | 189.09 | 193.194 | 142.148 | |
| WV-SRIE [20] | 106.308 | 83.806 | 162.224 | 69.480 | 210.261 | 155.683 | 131.724 | 236.846 | 220.823 | 158.856 | |
| MSRCR [19] | 842.029 | 1450.95 | 1185.11 | 1280.68 | 973.893 | 1252.07 | 893.216 | 1211.11 | 676.415 | 1115.43 | |
| CRM [59] | 271.652 | 21.818 | 450.102 | 174.751 | 285.250 | 534.275 | 119.712 | 619.537 | 352.672 | 314.419 | |
| EFF [98] | 136.898 | 141.159 | 239.271 | 102.891 | 155.616 | 255.588 | 117.777 | 480.848 | 237.563 | 207.512 | |
| pmea [99] | 491.663 | 725.647 | 477.792 | 318.569 | 679.002 | 610.183 | 418.046 | 1005.66 | 529.189 | 595.511 | |
| RetinexNet [22] | 472.189 | 770.105 | 636.160 | 391.745 | 708.250 | 838.310 | 591.278 | 950.895 | 548.905 | 679.456 | |
| KinD [36] | 214.893 | 434.595 | 261.771 | 134.844 | 275.474 | 241.221 | 379.899 | 479.139 | 308.869 | 303.412 | |
| RetinexDIP [64] | 767.042 | 1084.35 | 852.782 | 396.417 | 926.948 | 1099.39 | 572.429 | 1283.77 | 633.489 | 856.197 | |
| RRDNet [25] | 72.917 | 21.438 | 261.429 | 168.601 | 100.735 | - | 136.011 | 380.747 | 1.100 | - | |
| KinD++ [60] | 573.877 | 720.025 | 493.882 | 258.744 | 629.841 | - | 727.695 | 555.363 | 484.989 | - | |
| IBA [100] | 14.657 | 0.1616 | 445.574 | 169.714 | 12.823 | 364.810 | 137.727 | 21.758 | 284.333 | 179.613 | |
| Self-supervised Network [24] | 241.639 | 322.628 | 737.847 | 282.273 | 311.342 | 581.691 | 261.280 | 467.892 | 333.842 | 412.349 | |
| TBEFN [23] | 289.754 | 464.947 | 617.100 | 271.871 | 419.666 | 527.675 | 386.583 | 859.878 | 389.558 | 492.160 | |
| Average | 178.196 | 342.070 | 387.311 | 227.201 | 313.656 | 378.930 | 286.698 | 548.053 | 320.401 | - |
Table 2.
Quantitative comparison of enhancement algorithms on nine test datasets using NIQE metric. A lower value of the NIQE metric indicates better performance. The first, second, and third best scores are highlighted with red, blue, and green colors, respectively.
Table 2.
Quantitative comparison of enhancement algorithms on nine test datasets using NIQE metric. A lower value of the NIQE metric indicates better performance. The first, second, and third best scores are highlighted with red, blue, and green colors, respectively.
| Datasets | LIME | LOL | DICM | VV | MEF | NPE | LSRW | SLL | ExDark | Average | |
|---|---|---|---|---|---|---|---|---|---|---|---|
| Methods | |||||||||||
| Non-Retinex Methods | Input | 4.357 | 6.748 | 4.274 | 3.524 | 4.263 | 3.717 | 5.391 | 5.358 | 5.128 | 4.800 |
| HE [89] | 3.884 | 8.413 | 3.850 | 2.662 | 3.870 | 3.535 | 3.963 | 6.438 | 4.752 | 4.685 | |
| DHE [27] | 3.914 | 8.987 | 3.780 | 2.648 | 3.518 | 3.510 | 3.626 | 6.292 | 4.518 | 4.610 | |
| BPDHE [68] | 3.827 | NaN | 3.786 | 2.857 | 3.902 | 3.531 | 3.935 | NaN | 4.727 | - | |
| CVC [90] | 4.029 | 8.014 | 3.823 | 2.692 | 3.636 | 3.498 | 4.127 | 5.828 | 4.662 | 4.535 | |
| CLAHE [91] | 3.907 | 7.268 | 3.792 | 2.784 | 3.606 | 3.461 | 4.581 | 5.756 | 4.734 | 4.490 | |
| AGCWD [29] | 4.032 | 7.528 | 3.868 | 2.970 | 3.629 | 3.544 | 3.733 | 5.660 | 4.582 | 4.434 | |
| IAGC [92] | 3.951 | 7.418 | 4.015 | 3.012 | 3.652 | 3.598 | 3.963 | 5.740 | 4.557 | 4.494 | |
| BIMEF [93] | 3.859 | 7.515 | 3.845 | 2.807 | 3.329 | 3.540 | 3.879 | 5.747 | 4.514 | 4.397 | |
| MBLLEN [71] | 4.513 | 4.357 | 4.230 | 4.179 | 4.739 | 3.948 | 4.722 | 3.979 | 4.478 | 4.329 | |
| GLADNet [72] | 4.128 | 6.475 | 3.681 | 2.790 | 3.360 | 3.522 | 3.397 | 5.066 | 3.767 | 4.009 | |
| DLN [81] | 4.341 | 4.883 | 3.789 | 3.228 | 4.022 | - | 4.419 | 4.376 | 4.415 | - | |
| Zero-DCE [80] | 3.769 | 7.767 | 3.567 | 3.216 | 3.283 | 3.582 | 3.720 | 5.998 | 3.917 | 4.381 | |
| Exposure Correction [94] | 4.215 | 7.886 | 3.588 | 3.078 | 4.456 | 3.414 | 3.820 | 4.942 | 4.357 | 4.443 | |
| StableLLVE [95] | 4.234 | 4.372 | 4.061 | 3.420 | 3.924 | 3.486 | 4.367 | 4.185 | 4.053 | 3.984 | |
| LightenNet [96] | 3.731 | 7.323 | 3.539 | 2.995 | 3.350 | 3.407 | 3.583 | 5.453 | 4.025 | 4.209 | |
| White-box [97] | 4.598 | 7.819 | 4.630 | 3.558 | 4.622 | 4.004 | 4.314 | 7.138 | 5.534 | 5.202 | |
| LLFlow [38] | 3.956 | 5.445 | 3.765 | 3.026 | 3.441 | 3.498 | 3.564 | 4.722 | 4.094 | 3.944 | |
| Retinex-based Methods | LIME [21] | 4.109 | 8.129 | 3.860 | 2.494 | 3.576 | 3.658 | 3.655 | 6.372 | 4.588 | 4.542 |
| NPE [50] | 3.578 | 8.158 | 3.736 | 2.471 | 3.337 | 3.426 | 3.576 | 5.771 | 4.220 | 4.337 | |
| JieP [58] | 3.719 | 6.872 | 3.678 | 2.765 | 3.390 | 3.522 | 4.015 | 5.622 | 4.215 | 4.260 | |
| PM-SIRE [49] | 4.050 | 7.506 | 3.978 | 3.010 | 3.450 | 3.531 | 3.984 | 5.435 | 4.383 | 4.410 | |
| WV-SRIE [20] | 3.786 | 7.286 | 3.898 | 2.849 | 3.474 | 3.450 | 3.826 | 5.453 | 4.241 | 4.310 | |
| MSRCR [19] | 3.939 | 8.006 | 3.948 | 2.814 | 3.688 | 3.780 | 3.872 | 5.574 | 4.904 | 4.573 | |
| CRM [59] | 3.854 | 7.686 | 3.801 | 2.617 | 3.264 | 3.562 | 3.721 | 6.008 | 4.525 | 4.391 | |
| EFF [98] | 3.859 | 7.515 | 3.845 | 2.807 | 3.329 | 3.540 | 3.879 | 5.747 | 4.514 | 4.390 | |
| pmea [99] | 3.843 | 8.281 | 3.836 | 2.573 | 3.431 | 3.598 | 3.694 | 6.237 | 4.296 | 4.493 | |
| RetinexNet [22] | 4.597 | 8.879 | 4.415 | 2.695 | 4.410 | 4.464 | 4.150 | 7.573 | 4.551 | 5.142 | |
| KinD [36] | 4.763 | 4.709 | 4.150 | 3.026 | 3.876 | 3.557 | 3.543 | 4.450 | 4.340 | 3.956 | |
| RetinexDIP [64] | 3.735 | 7.096 | 3.705 | 2.496 | 3.245 | 3.638 | 4.081 | 5.8828 | 4.234 | 4.297 | |
| RRDNet [25] | 3.936 | 7.436 | 3.637 | 2.814 | 3.508 | - | 4.126 | 5.524 | 4.010 | - | |
| KinD++ [60] | 4.385 | 4.616 | 3.804 | 2.660 | 3.738 | - | 3.354 | 5.090 | 4.343 | - | |
| IBA [100] | 4.062 | 7.884 | 3.723 | 3.310 | 3.536 | 3.630 | 3.728 | 5.837 | 4.273 | 4.490 | |
| Self-supervised Network [24] | 4.819 | 3.753 | 4.717 | 3.548 | 4.351 | 4.602 | 4.061 | 5.400 | 4.048 | 4.310 | |
| TBEFN [23] | 3.954 | 3.436 | 3.503 | 2.884 | 3.227 | 3.292 | 3.478 | 4.648 | 3.621 | 3.511 | |
| Average | 3.935 | 6.728 | 3.889 | 2.956 | 3.698 | 3.626 | 3.933 | 5.409 | 4.403 | - |
Table 3.
Quantitative comparison of enhancement algorithms on nine test datasets using entropy [86] metric. A higher value of the entropy metric indicates better performance. The first, second, and third best scores are highlighted with red, blue, and green colors, respectively.
Table 3.
Quantitative comparison of enhancement algorithms on nine test datasets using entropy [86] metric. A higher value of the entropy metric indicates better performance. The first, second, and third best scores are highlighted with red, blue, and green colors, respectively.
| Datasets | LIME | LOL | DICM | VV | MEF | NPE | LSRW | SLL | ExDark | Average | |
|---|---|---|---|---|---|---|---|---|---|---|---|
| Methods | |||||||||||
| Non-Retinex Methods | Input | 6.148 | 4.915 | 6.686 | 6.715 | 6.075 | 7.017 | 5.415 | 5.616 | 5.744 | 6.023 |
| HE [89] | 7.342 | 7.184 | 7.221 | 7.383 | 7.118 | 7.756 | 6.874 | 6.662 | 6.708 | 7.113 | |
| DHE [27] | 7.097 | 6.749 | 7.141 | 7.225 | 6.913 | 7.512 | 6.531 | 6.741 | 6.613 | 6.930 | |
| BPDHE [68] | 6.610 | 5.932 | 6.968 | 6.977 | 6.420 | 7.348 | 6.260 | 5.191 | 6.188 | 6.413 | |
| CVC [90] | 6.875 | 6.409 | 7.055 | 7.216 | 6.755 | 7.402 | 6.318 | 6.549 | 6.465 | 6.772 | |
| CLAHE [91] | 6.764 | 5.679 | 7.088 | 7.056 | 6.583 | 7.408 | 6.033 | 6.591 | 6.302 | 6.595 | |
| AGCWD [29] | 6.792 | 6.415 | 6.925 | 7.021 | 6.648 | 7.398 | 6.394 | 6.278 | 6.248 | 6.666 | |
| IAGC [92] | 6.991 | 6.247 | 7.015 | 7.193 | 6.878 | 7.351 | 6.318 | 6.698 | 6.554 | 6.782 | |
| BIMEF [93] | 7.006 | 6.145 | 7.029 | 7.243 | 6.898 | 7.311 | 6.516 | 6.452 | 6.464 | 6.760 | |
| MBLLEN [71] | 7.164 | 7.303 | 7.255 | 7.333 | 7.081 | 7.386 | 7.236 | 7.197 | 7.132 | 7.240 | |
| GLADNet [72] | 7.502 | 7.356 | 7.404 | 7.447 | 7.408 | 7.452 | 7.393 | 7.581 | 7.250 | 7.412 | |
| DLN [81] | 7.121 | 7.277 | 7.250 | 7.535 | 7.255 | - | 7.202 | 7.576 | 7.129 | - | |
| Zero-DCE [80] | 7.166 | 6.531 | 7.224 | 7.572 | 7.093 | 7.402 | 7.035 | 6.545 | 6.932 | 7.042 | |
| Exposure Correction [94] | 7.112 | 7.244 | 7.256 | 6.962 | 6.955 | 7.531 | 7.039 | 7.247 | 6.907 | 7.142 | |
| StableLLVE [95] | 7.227 | 6.625 | 7.010 | 7.385 | 7.241 | 7.042 | 6.846 | 7.439 | 7.129 | 7.090 | |
| LightenNet [96] | 7.234 | 6.119 | 7.263 | 7.411 | 7.308 | 7.398 | 7.599 | 6.130 | 6.688 | 6.990 | |
| White-box [97] | 5.984 | 5.925 | 6.051 | 5.475 | 5.391 | 7.380 | 6.352 | 5.460 | 5.275 | 5.914 | |
| LLFlow [38] | 7.468 | 7.462 | 7.425 | 7.565 | 7.366 | 7.564 | 7.343 | 7.304 | 7.125 | 7.394 | |
| Retinex-based Methods | LIME [21] | 7.315 | 7.129 | 6.946 | 7.395 | 7.139 | 7.332 | 7.279 | 6.418 | 6.582 | 7.031 |
| NPE [50] | 7.368 | 6.971 | 7.208 | 7.550 | 7.405 | 7.446 | 7.318 | 6.418 | 6.772 | 7.139 | |
| JieP [58] | 7.087 | 6.443 | 7.218 | 7.457 | 7.104 | 7.427 | 6.794 | 6.473 | 6.631 | 6.943 | |
| PM-SIRE [49] | 7.006 | 6.322 | 7.084 | 7.309 | 6.894 | 7.404 | 6.696 | 6.325 | 6.441 | 6.812 | |
| WV-SRIE [20] | 6.999 | 6.348 | 7.088 | 7.401 | 6.942 | 7.386 | 6.663 | 6.190 | 6.463 | 6.812 | |
| MSRCR [19] | 6.563 | 6.841 | 6.677 | 6.957 | 6.455 | 6.762 | 6.895 | 5.936 | 6.319 | 6.605 | |
| CRM [59] | 6.487 | 4.971 | 6.640 | 6.559 | 6.203 | 7.026 | 5.494 | 6.068 | 5.921 | 6.115 | |
| EFF [98] | 7.006 | 6.145 | 7.029 | 7.243 | 6.898 | 7.311 | 6.516 | 6.452 | 6.464 | 6.760 | |
| pmea [99] | 7.284 | 6.824 | 7.220 | 7.479 | 7.273 | 7.449 | 7.074 | 6.638 | 6.725 | 7.088 | |
| RetinexNet [22] | 7.489 | 7.233 | 7.413 | 7.575 | 7.448 | 7.463 | 7.243 | 7.385 | 7.273 | 7.379 | |
| KinD [36] | 7.388 | 7.017 | 7.211 | 7.498 | 7.328 | 7.435 | 7.209 | 7.408 | 6.905 | 7.251 | |
| RetinexDIP [64] | 6.974 | 5.375 | 7.214 | 7.557 | 6.661 | 7.381 | 6.352 | 6.213 | 6.668 | 6.678 | |
| RRDNet [25] | 6.646 | 5.457 | 7.142 | 7.275 | 6.453 | - | 6.775 | 6.077 | 6.426 | - | |
| KinD++ [60] | 7.486 | 7.065 | 7.332 | 7.627 | 7.463 | - | 7.316 | 7.452 | 7.034 | - | |
| IBA [100] | 5.905 | 4.913 | 6.826 | 7.255 | 5.749 | 7.035 | 7.146 | 5.465 | 6.971 | 6.420 | |
| Self-supervised Network [24] | 7.497 | 7.404 | 6.675 | 7.298 | 7.469 | 6.997 | 7.397 | 7.484 | 7.296 | 7.253 | |
| TBEFN [23] | 7.436 | 6.875 | 7.328 | 7.507 | 7.383 | 7.366 | 7.047 | 7.519 | 7.313 | 7.292 | |
| Average | 7.000 | 6.481 | 7.072 | 7.247 | 6.904 | 7.340 | 6.798 | 6.605 | 6.659 | - |
Table 4.
Quantitative comparison of enhancement algorithms on nine test datasets using BRISQUE metric. A lower value of the BRISQUE metric indicates better performance. The first, second, and third best scores are highlighted with red, blue, and green colors, respectively.
Table 4.
Quantitative comparison of enhancement algorithms on nine test datasets using BRISQUE metric. A lower value of the BRISQUE metric indicates better performance. The first, second, and third best scores are highlighted with red, blue, and green colors, respectively.
| Datasets | LIME | LOL | DICM | VV | MEF | NPE | LSRW | SLL | ExDark | Average | |
|---|---|---|---|---|---|---|---|---|---|---|---|
| Methods | |||||||||||
| Non-Retinex Methods | Input | 25.142 | 21.929 | 28.115 | 29.380 | 29.066 | 26.673 | 32.726 | 25.304 | 34.015 | 28.401 |
| HE [89] | 21.411 | 39.559 | 25.359 | 18.937 | 25.313 | 25.444 | 28.219 | 40.015 | 29.034 | 28.985 | |
| DHE [27] | 22.336 | 37.866 | 25.993 | 24.380 | 21.466 | 27.008 | 26.477 | 38.248 | 28.951 | 28.719 | |
| BPDHE [68] | 21.728 | NaN | 25.0972 | 25.183 | 22.345 | 26.425 | 25.129 | NaN | 27.417 | - | |
| CVC [90] | 22.589 | 27.101 | 24.620 | 21.766 | 19.285 | 25.693 | 26.808 | 29.007 | 26.979 | 25.126 | |
| CLAHE [91] | 23.274 | 29.463 | 24.248 | 23.480 | 22.701 | 25.368 | 29.570 | 31.579 | 28.543 | 26.825 | |
| AGCWD [29] | 21.964 | 28.421 | 24.725 | 23.961 | 19.420 | 26.4117 | 23.367 | 29.740 | 26.161 | 25.276 | |
| IAGC [92] | 24.314 | 24.058 | 27.026 | 26.617 | 21.843 | 26.044 | 23.854 | 32.813 | 27.429 | 26.211 | |
| BIMEF [93] | 23.135 | 27.651 | 26.811 | 22.542 | 20.220 | 25.504 | 24.077 | 34.982 | 27.910 | 26.174 | |
| MBLLEN [71] | 30.386 | 23.078 | 31.603 | 35.076 | 32.389 | 29.423 | 30.328 | 22.103 | 29.012 | 29.127 | |
| GLADNet [72] | 22.286 | 26.073 | 26.253 | 24.068 | 22.908 | 24.969 | 22.802 | 33.754 | 24.765 | 25.657 | |
| DLN [81] | 27.715 | 28.985 | 26.914 | 29.782 | 28.378 | - | 33.597 | 26.798 | 31.187 | - | |
| Zero-DCE [80] | 23.334 | 30.305 | 30.653 | 30.786 | 25.484 | 30.159 | 25.827 | 36.572 | 26.761 | 29.568 | |
| Exposure Correction [94] | 27.483 | 28.357 | 29.847 | 31.694 | 29.597 | 26.768 | 26.391 | 28.632 | 32.520 | 29.204 | |
| StableLLVE [95] | 28.885 | 32.194 | 28.150 | 28.295 | 28.475 | 25.662 | 30.563 | 25.850 | 27.749 | 28.367 | |
| LightenNet [96] | 19.523 | 28.062 | 28.791 | 23.502 | 21.469 | 27.667 | 25.144 | 28.055 | 25.924 | 26.077 | |
| White-box [97] | 28.807 | 31.721 | 33.212 | 35.733 | 33.599 | 26.671 | 25.081 | 39.450 | 37.429 | 32.862 | |
| LLFlow [38] | 22.856 | 29.709 | 25.072 | 23.157 | 25.673 | 25.392 | 22.011 | 28.041 | 26.133 | 25.649 | |
| Retinex-based Methods | LIME [21] | 23.572 | 33.973 | 27.137 | 25.394 | 25.158 | 28.576 | 27.658 | 35.829 | 28.704 | 28.986 |
| NPE [50] | 22.506 | 33.858 | 25.493 | 24.654 | 22.320 | 24.986 | 27.195 | 33.861 | 28.452 | 27.539 | |
| JieP [58] | 22.193 | 27.087 | 23.633 | 22.941 | 21.214 | 25.498 | 23.421 | 30.207 | 25.309 | 24.914 | |
| PM-SIRE [49] | 24.659 | 27.694 | 27.597 | 24.287 | 24.321 | 27.342 | 25.345 | 30.014 | 26.676 | 26.635 | |
| WV-SRIE [20] | 24.181 | 27.611 | 27.698 | 24.434 | 22.088 | 25.760 | 24.700 | 28.281 | 26.750 | 25.894 | |
| MSRCR [19] | 19.384 | 30.345 | 25.799 | 19.282 | 19.091 | 24.189 | 25.789 | 30.300 | 25.415 | 24.957 | |
| CRM [59] | 23.477 | 29.599 | 26.601 | 22.368 | 20.716 | 25.726 | 24.396 | 37.723 | 28.733 | 26.939 | |
| EFF [98] | 23.135 | 27.651 | 26.811 | 22.542 | 20.220 | 25.504 | 24.077 | 34.982 | 27.910 | 26.174 | |
| pmea [99] | 21.390 | 32.913 | 25.832 | 24.972 | 21.756 | 26.358 | 25.358 | 38.132 | 28.321 | 27.874 | |
| RetinexNet [22] | 26.101 | 39.586 | 26.656 | 22.459 | 26.036 | 29.086 | 29.021 | 41.506 | 30.170 | 30.565 | |
| KinD [36] | 26.773 | 26.645 | 30.696 | 28.887 | 30.438 | 27.753 | 26.763 | 30.539 | 29.256 | 28.872 | |
| RetinexDIP [64] | 21.723 | 19.679 | 25.199 | 25.338 | 23.605 | 26.671 | 25.081 | 32.618 | 32.175 | 26.296 | |
| RRDNet [25] | 24.499 | 26.834 | 29.621 | 23.396 | 17.750 | - | 27.100 | 29.205 | 27.606 | - | |
| KinD++ [60] | 20.025 | 25.086 | 27.852 | 28.164 | 30.024 | - | 26.973 | 34.978 | 31.775 | - | |
| IBA [100] | 24.336 | 31.117 | 32.103 | 34.646 | 23.748 | 29.933 | 25.826 | 32.537 | 26.639 | 29.569 | |
| Self-supervised Network [24] | 30.192 | 19.768 | 29.529 | 30.183 | 28.355 | 29.159 | 26.205 | 32.016 | 27.990 | 27.901 | |
| TBEFN [23] | 25.720 | 17.346 | 23.606 | 23.651 | 24.435 | 24.0355 | 22.929 | 30.676 | 25.064 | 23.968 | |
| Average | 23.009 | 27.752 | 27.267 | 25.841 | 24.312 | 26.621 | 26.280 | 31.267 | 28.425 | - |
Table 5.
Computational time of classical methods in terms of seconds on CPU is reported. The red, blue, and green colors are used to indicate the best, second best, and third best performance, respectively.
Table 5.
Computational time of classical methods in terms of seconds on CPU is reported. The red, blue, and green colors are used to indicate the best, second best, and third best performance, respectively.
| Image Size | 400 × 600 × 3 | 640 × 960 × 3 | 2304 × 1728 × 3 | 2848 × 4256 × 3 | Avg. | |
|---|---|---|---|---|---|---|
| Methods | ||||||
| Non-Retinex Methods | HE [89] | 0.00079 | 0.0014 | 0.0071 | 0.0203 | 0.00742 |
| DHE [27] | 23.590 | 59.625 | 409.628 | 1253.897 | 436.685 | |
| BPDHE [68] | 0.078 | 0.338 | 1.630 | 3.318 | 1.341 | |
| CVC [90] | 0.086 | 0.230 | 1.150 | 3.533 | 1.250 | |
| CLAHE [91] | 0.00033 | 0.00099 | 0.0058 | 0.0226 | 0.00743 | |
| AGCWD [29] | 0.031 | 0.053 | 0.344 | 1.079 | 0.377 | |
| IAGC [92] | 0.038 | 0.155 | 1.025 | 2.253 | 0.867 | |
| BIMEF [93] | 0.123 | 0.359 | 1.811 | 5.101 | 1.848 | |
| Exposure Correction [94] | 0.721 | 0.778 | 0.903 | 18.501 | 5.226 | |
| LightenNet [96] | 3.091 | 7.126 | 45.990 | 137.835 | 48.510 | |
| LLFlow [38] | 24.740 | 60.022 | 363.281 | 1403.92 | 462.991 | |
| Retinex-based Methods | LIME [21] | 0.090 | 0.296 | 1.506 | 4.650 | 1.635 |
| NPE [50] | 13.061 | 31.025 | 213.168 | 648.832 | 226.522 | |
| JieP [58] | 0.646 | 0.874 | 2.307 | 6.597 | 2.606 | |
| PM-SIRE [49] | 0.402 | 1.340 | 28.948 | 28.423 | 14.778 | |
| WV-SRIE [20] | 0.915 | 3.136 | 40.701 | 182.267 | 56.755 | |
| MSRCR [19] | 0.322 | 0.704 | 2.787 | 8.531 | 3.086 | |
| CRM [59] | 0.166 | 0.436 | 2.626 | 8.134 | 2.840 | |
| EFF [98] | 0.136 | 0.407 | 1.973 | 5.422 | 1.984 | |
| pmea [99] | 0.646 | 0.874 | 2.307 | 6.597 | 2.606 | |
| IBA [100] | 0.032 | 0.0829 | 0.512 | 1.385 | 0.503 |
Table 6.
The computation time (seconds) and number of parameters (millions) for deep learning-based methods on GPUs (NVIDIA TITAN Xp) are reported. The red, blue, and green colors are used to indicate the best, second best, and third best performance, respectively.
Table 6.
The computation time (seconds) and number of parameters (millions) for deep learning-based methods on GPUs (NVIDIA TITAN Xp) are reported. The red, blue, and green colors are used to indicate the best, second best, and third best performance, respectively.
| Image Size | 400 × 600 × 3 | 640 × 960 × 3 | 2304 × 1728 × 3 | 2848 × 4256 × 3 | Avg. | Parameters. | |
|---|---|---|---|---|---|---|---|
| Methods | |||||||
| Non-Retinex | StableLLVE [95] | 0.0047 | 0.005 | 0.0076 | 0.097 | 0.028 | 4.310 M |
| MBLLEN [71] | 0.240 | 0.327 | 1.601 | 8.133 | 2.575 | 0.450 M | |
| GLADNet [72] | 0.147 | 0.161 | 0.676 | 2.772 | 0.939 | 0.930 M | |
| White-box [97] | 6.040 | 6.483 | 9.833 | 15.200 | 9.389 | 8.560 M | |
| DLN [81] | 0.009 | 0.015 | 0.058 | 0.197 | 0.070 | 0.700 M | |
| Zero-DCE [80] | 0.0025 | 0.0026 | 0.021 | 0.043 | 0.017 | 0.079 M | |
| Retinex | RetinexNet [22] | 0.155 | 0.162 | 0.591 | 1.289 | 0.549 | 0.440 M |
| KinD [36] | 0.334 | 0.604 | 3.539 | 5.213 | 2.423 | 0.255 M | |
| RetinexDIP [64] | 33.924 | 37.015 | 63.443 | 112.545 | 61.732 | 0.707 M | |
| RRDNet [25] | 59.479 | 128.217 | 893.0 | 3003.5 | 1021.1 | 0.128 M | |
| KinD++ [60] | 0.337 | 0.857 | 5.408 | 19.746 | 6.587 | 8.275 M | |
| Self-supervised Net [24] | 0.022 | 0.054 | 0.366 | 1.212 | 0.414 | 0.485 M | |
| TBEFN [23] | 0.171 | 0.166 | 0.550 | 0.887 | 0.444 | 0.490 M |
Publisher’s Note: MDPI stays neutral with regard to jurisdictional claims in published maps and institutional affiliations. |
© 2022 by the authors. Licensee MDPI, Basel, Switzerland. This article is an open access article distributed under the terms and conditions of the Creative Commons Attribution (CC BY) license (https://creativecommons.org/licenses/by/4.0/).
Share and Cite
MDPI and ACS Style
Rasheed, M.T.; Guo, G.; Shi, D.; Khan, H.; Cheng, X. An Empirical Study on Retinex Methods for Low-Light Image Enhancement. Remote Sens. 2022, 14, 4608. https://0-doi-org.brum.beds.ac.uk/10.3390/rs14184608
AMA Style
Rasheed MT, Guo G, Shi D, Khan H, Cheng X. An Empirical Study on Retinex Methods for Low-Light Image Enhancement. Remote Sensing. 2022; 14(18):4608. https://0-doi-org.brum.beds.ac.uk/10.3390/rs14184608
Chicago/Turabian StyleRasheed, Muhammad Tahir, Guiyu Guo, Daming Shi, Hufsa Khan, and Xiaochun Cheng. 2022. "An Empirical Study on Retinex Methods for Low-Light Image Enhancement" Remote Sensing 14, no. 18: 4608. https://0-doi-org.brum.beds.ac.uk/10.3390/rs14184608
Note that from the first issue of 2016, this journal uses article numbers instead of page numbers. See further details here.