Article

Analyses of GLONASS and GPS+GLONASS Precise Positioning Performance in Different Latitude Regions

1
School of Land Science and Technology, China University of Geosciences, Beijing 100083, China
2
Research Institute for Frontier Science, Beihang University, Beijing 100191, China
3
GNSS Research Center, Wuhan University, Wuhan 430079, China
*
Author to whom correspondence should be addressed.
Remote Sens. 2022, 14(18), 4640; https://0-doi-org.brum.beds.ac.uk/10.3390/rs14184640
Submission received: 3 August 2022 / Revised: 10 September 2022 / Accepted: 12 September 2022 / Published: 16 September 2022
(This article belongs to the Special Issue Precise Point Positioning with GPS, GLONASS, BeiDou, and Galileo)

Abstract

:
The orbital inclination angle of the GLONASS constellation is about 10° larger than that of GPS, Galileo, and BDS. Theoretically, the higher orbital inclination angle could provide better observation geometry in high latitude regions. A wealth of research has investigated the positioning accuracy of GLONASS and its impact on multi-GNSS, but rarely considered the contribution of the GLONASS constellation’s large orbit inclination angle. The performance of GLONASS in different latitude regions is evaluated in both stand-alone mode and integration with GPS in this paper. The performance of GPS is also presented for comparison. Three international GNSS service (IGS) networks located in high, middle, and low latitudes are selected for the current study. Multi-GNSS data between January 2021 and June 2021 are used for the assessment. The data quality check shows that the GLONASS data integrity is significantly lower than that of GPS. The constellation visibility analysis indicates that GLONASS has a much better elevation distribution than GPS in high latitude regions. Both daily double-difference network solutions and daily static Precise Point Positioning (PPP) solutions are evaluated. The statistical analysis of coordinate estimates indicates that, in high latitude regions, GLONASS has a comparable or even better accuracy than that of GPS, and GPS+GLONASS presents the best estimate accuracy; in middle latitude regions, GPS stand-alone constellation provides the best positioning accuracy; in low latitude regions, GLONASS offers the worst accuracy, but the positioning accuracy of GPS+GLONASS is better than that of GPS. The tropospheric estimates of GLONASS do not present a resemblance regional advantage as coordinate estimates, which is worse than that of GPS in all three networks. The PPP processing with combined GPS and GLONASS observations reduces the convergence time and improves the accuracy of tropospheric estimates in all three networks.

1. Introduction

Currently, four satellite navigation systems with global coverage have been developed: GPS, GLONASS, BDS, and Galileo. A notable design difference among the different constellations is the satellite orbital inclination angle. The inclination angle is 55° for GPS, 56° for Galileo, 55° for BDS, and 64.8° for GLONASS. Among the four constellations, the GLONASS has the largest orbit inclination angle, which is about 10° larger than other systems, to provide the availability of the high-latitude of the Soviet Union.
The first Final Operational Capability (FOC) of GLONASS was achieved in 1995. However, due to the short satellite service life and the budget decrease, the GLONASS constellation dropped to 7 satellites by 2002 [1]. During 2001–2011, the GLONASS program progressed steadily, and by late 2011, GLONASS declared FOC again.
During the period of several satellites, many studies have been performed to investigate the advantages and disadvantages of combining GPS and GLONASS [2,3]. Bruyninx [4] concluded that using the GLONASS constellation of 13 satellites does not significantly improve the precision of the double-difference (DD) network solutions, and similar results have been obtained with IGS and CODE (Center of Orbit Determination in Europe) orbits. Habrich [5] obtained similar results with 16 GLONASS satellites. Additionally, Cai and Gao [6] indicated that adding GLONASS satellites in Precise Point Positioning (PPP) would reduce the convergence time and improve the positioning accuracy.
As GLONASS was gradually restored, in terms of DD network processing, Alcay et al. [7] illustrated that the GLONASS stand-alone baseline solutions are inconsistent compared to that of GPS and that solutions using the combined GPS and GLONASS constellations do not provide any superiority over stand-alone GPS. Nardo et al. [8] presented that the additional GLONASS observations add little improvement to the estimates of the coordinates when compared to GPS-only processing. Zheng et al. [9] concluded that the repeatability of GLONASS coordinates is slightly worse than that of GPS. The research on GLONASS PPP increased as the usage of PPP increased. Cai and Gao [10] indicated that integrating the GLONASS with GPS could not significantly improve the PPP accuracy if the stand-alone GPS has adequate visible satellites with good observation geometry. Yigit et al. [11] also revealed that the static PPP performance among GPS, GLONASS, and GPS+GLONASS with long observation periods was similar. Choy et al. [12] further demonstrated that the benefits of combining GLONASS with GPS in daily static PPP are negligible. Mohammed et al. [13] assessed the static PPP performance of GPS, GLONASS, and GPS+GLONASS, and concluded that the GLONASS PPP could achieve similar coordinate estimate accuracy as GPS and GPS+GLONASS in daily solutions. However, Malik [14] provided a different conclusion that the accuracy of undifferenced ionosphere-free dual-frequency PPP with GPS and GLONASS observations is better than that of GPS. Hamed et al. [15] obtained similar results with single-frequency PPP. The analysis of PPP convergence time indicates that the combination of GPS and GLONASS significantly shortened the convergence time of static PPP solutions [10,16]. Li and Zhang [17] studied the combination of GPS and GLONASS and illustrated that the convergence time of ambiguity-float static PPP could be reduced by 45.9% compared to GPS.
There are also many studies concerning the contribution of GLONASS to three or more GNSS systems’ combined constellations [18,19,20]. However, the previous research rarely considers the constellation characteristics of GLONASS, especially the effect of the large orbit inclination angle of the GLONASS constellation, which benefits the positioning performance in high latitude regions. Therefore, this paper aims to evaluate the performance of GLONASS and its contribution to GPS+GLONASS processing in different latitude regions in terms of satellite visibility and positioning performance. Three networks located in high, middle, and low latitude regions are employed. The performance of both daily DD network solutions and daily static PPP solutions is used for the study.
The structure of this article is arranged as follows. Section 2 describes the methods of data quality evaluation, the positioning strategies, and the evaluation indicators. Section 3 describes the data and data selection factors. Section 4 presents the data quality results, the constellation visibility of different systems, as well as the analysis and discussion of the performance of the DD network and PPP solutions. Finally, the main conclusions and findings are shown in Section 5.

2. Evaluation Methods

This section describes the methods and metrics of data quality check, the analysis indicators for satellite visibility of different systems, and the positioning strategies of DD network and PPP processing, as well as the evaluation indicator for DD network solutions and PPP solutions.

2.1. Data Quality Check

The measurement quality assessment aimed to detect the GLONASS and GPS poor observations, which further affect the positioning performance of different combinations. TEQC [21] toolkit was employed to perform the quality assessment of GLONASS and GPS L1 and L2 signals, which are used for performance assessment. The quality check was conducted using the following indicators:
  • Data Integrity (DI). Data integrity rate is the recorded valid observation data divided by the receivable observation data calculated by ephemeris and the station location.
  • Signal-to-Noise Ratio (SNR). SNR is the ratio of signal power to noise power within a given bandwidth. It is usually expressed in the unit of decibels.
  • Pseudorange Multipath (MP). Pseudorange multipath indicators are computed using the linear combination of pseudorange and carrier phase observations:
MP 1 = P 1 ( 1 + 2 α 1 ) 1 + ( 1 + 2 α 1 ) 1
MP 2 = P 2 ( 2 α α 1 ) 1 + ( 2 α α 1 1 ) 2
where MP1 denotes the multipath effect on L1 frequency and MP2 indicates the multipath effect on L2 frequency; P 1 and P 2 denote the pseudorange observations at L1 and L2 frequencies, respectively; 1 and 2 denote the carrier phase observations of L1 and L2 frequencies, respectively; α = ( f 1 f 2 ) 2 , where f 1 denotes the L1 frequency, and f 2 denotes the L2 frequency.

2.2. Constellation Visibility Analysis

The visibility of GPS, GLONASS, and GPS+GLONASS in different latitude networks was analyzed and evaluated using the following criteria:
  • The number of visible satellites. The mean number of visible satellites in each network at each epoch is computed, and the observed probability of different positioning combinations is also analyzed.
  • The elevation angle of visible satellites. The mean elevation angle of visible satellites in each network at each epoch is computed, and the occurrence probability corresponding to different degrees is evaluated.
  • The Position Dilution of Precision (PDOP). The mean PDOP of each network at each epoch is calculated.
As the GLONASS constellation geometry repeats about every 8 sidereal days, we used observation data from 28 March 2021 (day of year (DOY) 087) to 4 April 2021 (DOY 094) to evaluate the observation quality. The elevation cutoff angle was set to 3°. The study employed the same data set as the data quality check for visibility assessment.

2.3. DD Network Processing Strategy

The DD network processing was conducted using the Bernese GNSS Software, Version 5.2. The software is developed at the Astronomical Institute of the University of Bern (AIUB), Bern, Switzerland. A daily batch processing scheme is used for the data processing. The final precise orbits from CODE were adopted, containing consistent orbits for GPS and GLONASS. The different code biases (DCB) files and the Earth Rotation Parameters (ERP) of CODE were also used for consistency. The PCC model used was igs14.atx. The ocean tides model used was FES2004 (Finite Element Solutions). The elevation mask for data preprocessing was set to 3°. The baselines were defined with the OBS-MAX strategy. An attempt to fix the GPS and GLONASS integer value ambiguities was attempted with the Quasi Ionospheric Free (QIF) strategy [22]. The VMF1 (Vienna Mapping Function) [23] grid file [24] and NET WET model were used for the tropospheric estimate. Zenith Tropospheric Delay (ZTD) parameter was estimated per hour. The datum definition was realized with the minimum-constraint solution by a set of reference stations of IGS14. The processing scheme is displayed in Figure 1.

2.4. Static PPP Processing Strategy

The static PPP processing was carried out by FUSING (FUSing IN GNSS) software [25], Version 2.0, developed by Wuhan University, Wuhan, China. The Ionosphere-free (IF) linear combination with L1 and L2 was employed. The elevation mask, the precise products, and the ocean tides model, as well as the PCC model, were the same as the DD processing strategy. The GPT2 (Global Pressure and Temperature) [26] model and VMF1 [23] model were used for the tropospheric estimate. PPP static in 24 h window was processed with a forward extended Kalman filter. The processing strategies of PPP are summarized in Table 1.
DD network and static PPP processing were carried out for different positioning combination modes: GPS stand-alone positioning mode, GLONASS stand-alone positioning mode, and GPS+GLONASS combined positioning mode.

2.5. Accuracy Assessment

The station coordinates and ZTDs provided by the IGS were used as references to assess the accuracy of DD network solutions and PPP solutions. The Root Mean Square Error (RMSE) of daily coordinate estimates was used as the accuracy assessment indicator,
RMSE COORDINATE = ( COORDINATE estimated COORDINATE IGS ) 2 n
where n is the total number of daily coordinate estimates.
The tropospheric products from IGS are sampled every 300 s, while, in this paper, the ZTDs estimated interval by DD strategy was one hour, and 30 s by PPP strategy. Thus, the tropospheric estimates or the IGS products needed to be resampled to match the sampling intervals. The current study resampled the IGS tropospheric products to 1 h and the PPP tropospheric to 300 s to coincide with IGS products. The RMSE of ZTD estimates is,
RMSE ZTD =   ( ZTD estimated ZTD IGS ) 2 n
where n is the total number of available ZTD estimates after resampling.

3. Data Selection

To comprehensively study the GLONASS performance, three networks located in high, middle, and low latitude regions were employed. In addition to the differences in latitude, the following three factors were also considered in the selection of the IGS station:
  • To comprehensively evaluate and compare the performance of GLONASS stand-alone mode, GPS stand-alone mode, and GPS+GLONASS combined mode, the station’s receiver should receive both GPS and GLONASS observations. The receivers employed in the three networks are listed in Table 2, Table 3 and Table 4, respectively.
  • Using the GPS antenna PCC model for GLONASS will introduce systematic bias [9,27,28]. To avoid this bias, the station’s antenna and radome types should have GPS and GLONASS-specific PCC models in the IGS antenna files. The antenna and radome types used in the three networks are also given in Table 2, Table 3 and Table 4, respectively.
  • The baseline accuracies are related to the length of the baseline [29]. To precisely assess the performance of GLONASS in terms of DD network processing, the mean baseline lengths of the networks should be similar.
According to the above station select criterion, 21 IGS stations were selected and formed 3 networks, distributed in high, middle, and low latitude regions, as shown in Figure 2. The high latitude network locates between 60°N and the North Pole, the middle latitude network lies between 30°N and 60°N, and the low latitude network situates between the equator and 30°S. The baseline lengths of the three networks are approximately 660 km, 880 km, and 778 km, respectively. The performance evaluation period was from 1 January 2021 (DOY 001) to 30 June 2021 (DOY 181). The GPS and GLONASS observations were downloaded from NASA CDDIS [30].

4. Results and Discussion

The data quality of GPS and GLONASS, the constellation visibility of GPS, GLONASS, and GPS+GLONASS, and the performance of the DD network solutions and PPP solutions, are shown and discussed in this section.

4.1. Data Quality

The DI rate, MP1, MP2, SN1 (the SNR of L1), and SN2 (the SNR of L2) of GPS and GLONASS observations for each station are calculated and presented in Figure 3. The mean value of each indicator is listed in Table 5, where G and R denote GPS and GLONASS, respectively.
The data integrity rate of GLONASS in 21 stations of the 3 networks is lower than that of GPS, as is evident in Figure 3. As shown in Table 5, the calculated average data integrity rates of GLONASS in the three networks are 82.37%, 83.46%, and 81.33%, respectively, significantly lower than those of GPS with 94.33%, 96.11%, and 94.81%, respectively.
The MP1 and MP2 of GPS presented similar performance to that of GLONASS in the high latitude network. However, the MP1 and MP2 of GPS in the middle latitude network are smaller than those of GLONASS in most stations, except station HERT. By contrast, the MP1 and MP2 of GLONASS in the low latitude network are smaller than those of GPS. The calculated average value of MP1 and MP2 in Table 5 indicates similar results, but the differences in MP1 and MP2 between GPS and GLONASS are insignificant.
The difference in SN1 between GPS and GLONASS is minor in the three networks, except SOD3 and SVTL in the high latitude network and WARN in the middle latitude network. The SN2 of GLONASS is significantly better than that of GPS in the high and low latitude networks and similar to that of GPS in the middle latitude network.
Among the 21 tracking stations, however, the data quality of SALU in the low latitude network is significantly worse than other stations. The DI rate of SALU is 84.3% for GPS and 71.6% for GLONASS. The MP1 of SALU is up to 0.99 m and 0.89 m for GPS and GLONASS observations, respectively, much larger than those calculated average values, 0.39 m and 0.46 m for GPS and GLONASS. The MP2 of SALU presented similar results as that of MP1.

4.2. Constellation Visibility

The average number of visible satellites, the average PDOP value, and the satellite elevation distribution of the three tracking networks were analyzed with numerical comparison and statistical study. The number of visible satellites and their statistical property is shown in Figure 4 and Figure 5, respectively.
From Figure 5, during the 8 days test period, both constellations have the largest average number of visible satellites in the high latitude network among the three networks. The average visible number of GPS in high latitude regions is significantly larger than in the middle and low latitude regions. The average number of visible satellites of GLONASS in the high and the middle latitude regions is similar but significantly larger than that of the low latitude region.
From the statistical point of view, the GLONASS visible satellites have the smallest standard deviation in the high and middle latitude networks. The percentages of most observed 9 and 8 GLONASS satellites in the high latitude network are 52.37% and 27.63%, respectively. The percentages of most observed 9 and 8 GLONASS satellites in the middle latitude network are 34.20% and 33.64%, respectively. However, the number of GLONASS visible satellites reduces significantly, and the standard deviation increases significantly in the low latitude network. Moreover, the standard deviation of GPS+GLONASS is relatively larger than GPS or GLONASS, and the average number of visible satellites is also larger than those of GPS and GLONASS. The probability of observing satellites less than 12 in three networks of combined GPS and GLONASS is almost zeros, indicating that the combined constellations provide more than 12 visible satellites in most cases.
The histogram of the elevation distribution related to GLONASS, GPS, and GLONASS+GPS is also presented in Figure 6 to further evaluate the quality of the observed satellites.
From Figure 6, GLONASS has a much better elevation distribution than GPS in the high latitude network. The most observed GLONASS satellites’ elevation angles in the high latitude network are between 13–33 degrees, while those of GPS are between 6–26 degrees, which are obviously lower than that of GLONASS. In addition, the mean elevation angle of GLONASS is 35.01°, which is 3.97° higher than that of GPS. In the middle latitude network, the elevation angle distribution and average elevation angle between GPS and GLONASS have inconspicuous disparity. In the low latitude network, the percentage peak of GLONASS corresponds to an obviously lower elevation angle than GPS. The elevation distribution of GPS+GLONASS lies between GPS and GLONASS.
The PDOP of GPS, GLONASS, and GPS+GLONASS during the testing period is illustrated in Figure 7.
Figure 7 shows that the PDOP values of GPS are less than 3.0 in all three regions, and the most stable PDOP values appear in middle latitude regions, indicating that the observation geometry of GPS in that region is the best among the three regions. Moreover, the PDOP values of GPS exist daily period in all three regions. GLONASS has the most stable PDOP in high latitude regions, which is more stable than GPS in the same region. However, the PDOP values of GLONASS increase obviously as the latitude decreases. In addition, the PDOP values of GLONASS at low latitude regions show some abnormally large values, up to 92.68, as shown in the upper right corner of the subfigure for low latitude GLONASS PDOP. The PDOP values of GPS+GLONASS exhibit better performance than both GLONASS and GPS stand-alone systems. Although some periods exist in high latitude regions where the PDOP of GPS is up to 2.80, the PDOP values of GPS+GLONASS are quite stable and less than 1.55. Although the PDOP of GPS is up to 2.75 in some periods in low latitudes and the PDOP of GLONASS is very large at certain epochs, the PDOP of GPS+GLONASS remains stable and below 1.44. The combined GPS and GLONASS constellations have the most obvious improvement in observation geometry at low latitudes.

4.3. DD Network Solutions

The accuracy of coordinates, the ambiguity fixing rate, and the accuracy of ZTD estimates with the DD network processing strategy were analyzed.

4.3.1. Accuracy of Coordinates

Taking IGS daily coordinates as the reference value, the differences between the estimated coordinates and the IGS daily coordinates were calculated. The stations SOD3 (in the high latitude network), WTZR (in the middle latitude network), and SPTU (in the low latitude network) were employed to illustrate the positioning performance of GPS, GLONASS, and GPS+GLONASS. The other stations present results similar to these three stations. The coordinate error in the North (N), East (E), and Up (U) components of the three selected stations are presented in Figure 8.
As shown in Figure 8, the GLONASS coordinate error components of station SOD3 and WTZR, located in the high and middle latitude networks, respectively, are as steady as GPS and GPS+GLONASS results. The GLONASS error components are more fluctuated than that of GPS and GPS+GLONASS results for the low latitude station SPTU.
The RMSE of N, E, and U components, together with the three-dimensions (3D) RMSE for all the stations, were calculated and are presented in Figure 9. Figure 9 shows that in the low latitude network, the GLONASS positioning accuracy is obviously worse than that of GPS and GPS+GLONASS. The coordinates of the SALU station exhibit the worst accuracy, and the station also has poor data quality, as shown in Figure 3. Similar results can be found from the mean RMSE of coordinate estimates of each network, as shown in Table 6.
The RMSE results clearly show that the accuracies of coordinates estimated with GLONASS are 13.79% and 6.35% better than that of GPS on N and U components in the high latitude network. On the E components, however, the GLONASS positioning accuracy decreased by 16.17% compared to GPS. Therefore, the 3D accuracy of GLONASS is 6.50% better than that of GPS. In addition, the GPS+GLONASS combined mode presents the best results among the three constellations, the accuracy improvements on N and U components are 24.29% and 4.66% compared to GPS, respectively, and the 3D accuracy is 6.05% better than that of GPS. The positioning performance is consistent with the analysis of PDOP in Section 4.2. The stable and good PDOP enables the high positioning accuracy of GLONASS. The PDOP of the combined constellations significantly improved over GPS; therefore, GPS+GLONASS shows the highest accuracy in the high latitude network.
The positioning accuracy of the middle latitude network reveals that GPS presents the best positioning results in E and U, as well as 3D components. GLONASS and GPS+GLONASS exhibit a slightly better positioning accuracy of 1.14% and 4.48% than GPS on the N component, respectively. The positioning accuracies of GLONASS on E and U components are 30.17% and 15.79% worse than that of GPS. In addition, the positioning accuracies of GPS+GLONASS on E and U components are 11.77% and 4.59% worse than that of GPS. Furthermore, the 3D positioning accuracy of GLONASS and GPS+GLONASS is reduced by 14.74% and 3.96% than that of GPS, respectively. As can be seen from Figure 7, GPS has the best and the most stable PDOP values in the middle latitudes when compared with the PDOP of high and low latitudes. The improvement of the GPS+GLONASS combined constellations’ PDOP over GPS is weaker when compared to high and low latitudes. Besides, currently, the accuracy of GLONASS satellite ephemerides is about 3 cm, a bit lower than that of GPS, with a 2.5 cm accuracy. Hence, it can be inferred that when the stand-alone GPS has adequate visible satellites with good observation geometry, the addition of GLONASS observations shows no positive contribution to the accuracy of the coordinates. This is consistent with the conclusion of Cai and Gao [10].
The positioning accuracy of the middle latitude network shows that GLONASS presented the worst positioning accuracy among the three modes. The positioning accuracies of GLONASS on N, E, and U components are 22.13%, 62.86%, and 38.24% worse than that of GPS, and the 3D positioning accuracy is 39.93% lower than that of GPS. The positioning accuracy of GPS+GLONASS, however, is better than that of GPS, which is 1.37%, 2.39%, and 10.89% on N, E, and U components, respectively, and the 3D accuracy increases by 9.00%. The poor positioning results of GLONASS and the improvement of GPS+GLONASS positioning performance by introducing GLONASS observations are consistent with the analysis of PDOP.

4.3.2. Ambiguity Fixing Rate

The ambiguity fixing rate of GPS, GLONASS, and GPS+GLONASS modes of the three networks is listed in Table 7. GPS has the lowest ambiguity fixing rate in the middle latitude network but the highest ambiguity fixing rate in the low latitude network. As there is no obvious difference in the GPS positioning accuracy of the three networks, we analyzed the types of receivers used. The receivers of the high latitude network were of 3 brands and 5 models, the receivers of the middle latitude network were of 3 brands and 6 types, while in the low latitude network, there were only 2 brands and 2 models receivers. This suggests that the different levels of ambiguity fixing rate could be related to the number of receiver types used in different networks. The different signal distortion biases between inhomogeneous receivers affect the GNSS data processing [31,32]. Despite having the best receiver homogeneity, the ambiguity fixing rate of GLONASS in the low latitude network was only 26.4%, but 74.7% for GPS.

4.3.3. Tropospheric Estimates

Taking IGS tropospheric products as the reference value, the differences between the estimated ZTDs and the IGS products were calculated. The stations SOD3, WTZR, and SPTU were also used to illustrate the estimation accuracy of three different positioning modes. The ZTD errors are presented in Figure 10. The data gaps in Figure 10 were caused by missing observations or the reference data. It can be seen that the ZTD estimates present wider discrepancies as the latitude decreases.
The RMSE of all the stations is shown in Figure 11. The mean RMSE of each network and their comparison between different processing modes are shown in Table 8.
The statistical results show that, in all the three networks, the ZTD estimates of GLONASS are obviously worse than that of GPS, which are 15.85%, 12.26%, and 32.24% lower in the high, middle, and low latitude networks, respectively. The accuracy of GPS+GLONASS in the high latitude network is 2.08% worse than that of GPS but slightly better in the middle and low latitude networks, about 1.06% and 4.00%, respectively. The consistency between the estimated results and the IGS products decreases as the latitude decreases for GPS, GLONASS, and GPS+GLONASS.

4.4. Static PPP Results

The positioning accuracy, the convergence time, and the accuracy of ZTD estimates with the PPP processing strategy are analyzed.

4.4.1. Positioning Accuracy

Taking IGS daily coordinates as the reference value, the coordinate difference between the estimated coordinates with PPP and the IGS daily coordinates was calculated. The coordinate error series of GPS, GLONASS, and GPS+GLONASS modes on N, E, and U components of SOD3, WTZR, and SPTU are shown in Figure 12.
As shown in Figure 12, the GLONASS coordinate error series of SOD3 is as steady as that of GPS, while the coordinate error of WTZR and SPTU estimated with GLONASS observations is much more dispersed than other estimate modes. In addition, the magnitude of the error series on U components of three positioning modes at the SPTU station is larger than at the other stations.
The RMSE of N, E, and U components, together with the 3D RMSE for all the stations, are shown in Figure 13. The mean RMSE of N, E, and U components, together with the 3D RMSE for each network, are calculated and listed in Table 9.
Figure 13 and Table 9 illustrate the RMSE of coordinates estimated with PPP. The GLONASS estimated coordinates have comparable accuracy with GPS in the high latitude network. The accuracies on N and E components are 13.62% and 0.87% better than that of GPS, but the accuracies on U and 3D components are 2.83% and 1.37% worse than that of GPS. GPS+GLONASS presents the best coordinate estimates in the high latitude network. The percentages of improvement over GPS on N, E, and U components are 18.78%, 10.37% and 7.87%, respectively, and the 3D positioning accuracy is 9.35% better than that of GPS. GPS stand-alone mode presents the best coordinate estimates except for the E component in the middle latitude network. The coordinate accuracy on the E component of combined GPS+GLONASS constellations has an advantage of 2.99% over GPS. The accuracies of GLONASS on N, E, and U components are worse than that of GPS, at 19.83%, 21.77%, and 20.40%, respectively. The 3D positioning accuracy of GPS+GLONASS is 1.52% lower than that of GPS. GLONASS shows the worst coordinate estimates among the three positioning modes in the low latitude network. The 3D positioning accuracy is 7.58% lower than that of GPS; however, the 3D positioning accuracy improvement of GPS+GLONASS is 11.40% over GPS. The positioning performance of PPP with different modes in different latitudes is basically consistent with that of the DD network solutions.

4.4.2. Convergence Time

The convergence time performance of GPS, GLONASS, and GPS+GLONASS processing modes was studied. The criterion of convergence is achieving a positioning error of less than 1 decimeter on N, E, and U components. The mean convergence time for each station is shown in Figure 14. The mean convergence time for each network is listed in Table 10. The results clearly show that the convergence time of GLONASS PPP is distinctly longer than that of GPS, and the increased percentages are 51.90%, 45.28%, and 105.30% in the high, middle, and low latitude networks, respectively. Compared with GPS PPP, GPS+GLONASS processing reduces the convergence time, and the shortened percentages are 6.11%, 16.57%, and 14.60% in the high, middle, and low latitude networks, respectively. The convergence time gets longer as the latitude decreases for GPS, GLONASS, and GPS+GLONASS positioning modes, and the convergence time of GLONASS in the low latitude network is obviously longer, up to 49.83 minutes.

4.4.3. Tropospheric Estimates

The differences between the estimated ZTDs with PPP after convergence and the IGS products were calculated to obtain the time series and the RMSE of ZTDs. Figure 15 shows the ZTD error series of station SOD3, WTZR, and SPTU. The RMSE of all the stations is shown in Figure 16. The mean RMSE of ZTDs for each network and their comparison between different processing modes are shown in Table 11.
Figure 15 shows that the ZTD estimates are dispersed as the latitude decreases. From Figure 16 and Table 11, we can see that the ZTD estimates of GLONASS are less accurate than that of GPS in all three networks, which are 10.10%, 6.82%, and 14.08% lower in the high, middle, and low latitude networks, respectively. The addition of GLONASS will improve the accuracy of tropospheric estimates, and the accuracy improvements are 5.19%, 6.98%, and 7.79% in the high, middle, and low latitude networks, respectively. The accuracy of estimated ZTDs decreases as the latitude decreases for GPS, GLONASS, and GPS+GLONASS.

5. Conclusions

It has been more than 10 years since GLONASS restored its full constellation. A solid understanding of the positioning performance of GLONASS and its contribution to the multi-GNSS is important in muti-GNSS positioning applications. This paper presents the performance of GPS, GLONASS, and GPS+GLONASS with both DD network and PPP processing strategies in different latitude regions. According to the statistical analysis results of the current study, the following conclusions can be drawn:
  • The data integrity rate of GLONASS is lower than that of GPS;
  • Both GPS and GLONASS have the mean maximum number of visible satellites in high latitudes; however, the mean elevation angle of GLONASS is higher than that of GPS;
  • GLONASS has a comparable or even better positioning accuracy than GPS in high latitude regions, and the coordinates of GPS+GLONASS show the best accuracy;
  • GPS stand-alone mode gets the best positioning accuracy in middle latitude regions, and the additional GLONASS observations show no positive impact on GPS+GLONASS processing;
  • GLONASS shows the worst accuracy in low latitude regions, but the adding of GLONASS can improve the positioning accuracy of GPS+GLONASS processing mode when compared to GPS-only processing mode;
  • The addition of GLONASS will reduce the convergence time and improve the accuracy of ZTDs for PPP processing in high, medium, and low latitude regions.
Overall, for high-precision positioning users, GLONASS can be used as a stand-alone solution in high latitude regions. The inclusion of GLONASS as a combined multi-GNSS component in high and low latitude areas is advised. The addition of GLONASS observations is always recommended for PPP users of meteorology information.

Author Contributions

Conceptualization, Y.Z.; Data curation, Y.Z.; Investigation, Y.Z.; Software, F.Z.; Resources, G.N.; Validation, Y.Z. and F.Z.; Formal analysis, Y.Z. and C.Y.; Visualization, Y.Z.; Writing—original draft preparation, Y.Z.; Writing—review and editing, C.Y. and Y.Z.; Supervision, S.L.; Funding acquisition, C.Y. All authors have read and agreed to the published version of the manuscript.

Funding

This project is funded by the National Key Research and Development Program of China (No. 2020YFB0505802) and the Fundamental Research Funds for the Central Universities (2652017105).

Data Availability Statement

The GNSS data used in this paper are provided by CDDIS (https://cddis.nasa.gov/, accessed on 10 August 2021). The precise GNSS products are available from CODE (http://ftp.aiub.unibe.ch/CODE, accessed on 18 August 2021). The VMF1 troposphere mapping functions were obtained from VMF Data Server (http://0-doi-org.brum.beds.ac.uk/10.17616/R3RD2H, accessed on 20 August 2021). The ocean tide model was downloaded from the Ocean tide loading provider (http://holt.oso.chalmers.se/loading/index.html, accessed on 10 August 2021).

Acknowledgments

The authors thank the IGS for providing GNSS data and products.

Conflicts of Interest

The authors declare no conflict of interest.

References

  1. Hein, G.W. Status, perspectives and trends of satellite navigation. Satell. Navig. 2020, 1, 22. [Google Scholar] [CrossRef] [PubMed]
  2. Dodson, A.H.; Moore, T.; Baker, F.D.; Swann, J.W. Hybrid GPS+GLONASS. GPS Solut. 1999, 3, 32–41. [Google Scholar] [CrossRef]
  3. Stewart, M.P.; Tsakiri, M.; Wang, J.; Monico, J.F. The contribution of GLONASS measurements to regional and continental scale geodetic monitoring regimes. Earth Planets Space 2000, 52, 877–880. [Google Scholar] [CrossRef]
  4. Bruyninx, C. Comparing GPS-only with GPS + GLONASS positioning in a regional permanent GNSS network. GPS Solut. 2007, 11, 97–106. [Google Scholar] [CrossRef]
  5. Habrich, H. Evaluation of analysis options for GLONASS observations in regional GNSS networks. In Geodetic Reference Frames; Springer: Berlin/Heidelberg, Germany, 2009; pp. 121–129. [Google Scholar]
  6. Cai, C.; Gao, Y. Precise point positioning using combined GPS and GLONASS observations. Positioning 2007, 6, 13–22. [Google Scholar] [CrossRef]
  7. Alcay, S.; Inal, C.; Yigit, C.; Yetkin, M. Comparing GLONASS-only with GPS-only and hybrid positioning in various length of baselines. Acta Geod. Geophys. Hung. 2012, 47, 1–12. [Google Scholar] [CrossRef]
  8. Nardo, A.; Huisman, L.; Teunissen, P.J.G. GPS+GLONASS CORS Processing: The Asian-Pacific APREF Case//Earth on the Edge: Science for a Sustainable Planet; Springer: Berlin/Heidelberg, Germany, 2014; pp. 239–246. [Google Scholar]
  9. Zheng, Y.; Nie, G.; Fang, R.; Yin, Q.; Yi, W.; Liu, J. Investigation of GLONASS performance in differential positioning. Earth Sci. Inform. 2012, 5, 189–199. [Google Scholar] [CrossRef]
  10. Cai, C.; Gao, Y. Modeling and assessment of combined GPS/GLONASS precise point positioning. GPS Solut. 2013, 17, 223–236. [Google Scholar] [CrossRef]
  11. Yigit, C.O.; Gikas, V.; Alcay, S.; Ceylan, A. Performance evaluation of short to long term GPS, GLONASS and GPS/GLONASS post-processed PPP. Surv. Rev. 2014, 46, 155–166. [Google Scholar] [CrossRef]
  12. Choy, S.; Zhang, S.; Lahaye, F.; Héroux, P. A comparison between GPS-only and combined GPS+GLONASS Precise Point Positioning. J. Spat. Sci. 2013, 58, 169–190. [Google Scholar] [CrossRef]
  13. Mohammed, J.; Moore, T.; Hill, C.; Bingley, R.; Hansen, D. An assessment of static precise point positioning using GPS only, GLONASS only, and GPS plus GLONASS. Measurement 2016, 88, 121–130. [Google Scholar] [CrossRef]
  14. Malik, J.S. Performance analysis of static precise point positioning using open-source GAMP. Artif. Satell. J. Planet. Geod. 2020, 55, 41–60. [Google Scholar] [CrossRef]
  15. Hamed, M.; Abdallah, A.; Farah, A. Kinematic PPP using mixed GPS/GLONASS single-frequency observations. Artif. Satell. 2019, 54, 97–112. [Google Scholar] [CrossRef]
  16. Deliktas, H.C. Investigation on the Contribution of GLONASS Observations to GPS Precise Point Positioning (PPP). Ph.D. Dissertation, The Ohio State University, Columbus, OH, USA, 2016. [Google Scholar]
  17. Li, P.; Zhang, X. Integrating GPS and GLONASS to accelerate convergence and initialization times of precise point positioning. GPS Solut. 2014, 18, 461–471. [Google Scholar] [CrossRef]
  18. Li, X.; Ge, M.; Dai, X.; Ren, X.; Fritsche, M.; Wickert, J.; Schuh, H. Accuracy and reliability of multi-GNSS real-time precise positioning: GPS, GLONASS, BeiDou, and Galileo. J. Geod. 2015, 89, 607–635. [Google Scholar] [CrossRef]
  19. Abd Rabbou, M.; El-Rabbany, A. Performance analysis of precise point positioning using multi-constellation GNSS: GPS, GLONASS, Galileo and BeiDou. Surv. Rev. 2017, 49, 39–50. [Google Scholar] [CrossRef]
  20. Pan, L.; Zhang, X.; Li, X.; Li, X.; Lu, C.; Liu, J.; Wang, Q. Satellite availability and point positioning accuracy evaluation on a global scale for integration of GPS, GLONASS, BeiDou and Galileo. Adv. Space Res. 2019, 63, 2696–2710. [Google Scholar] [CrossRef]
  21. Estey, L.H.; Meertens, C.M. TEQC: The multi-purpose toolkit for GPS/GLONASS data. GPS Solut. 1999, 3, 42–49. [Google Scholar] [CrossRef]
  22. Dach, R.; Hugentobler, U.; Fridez, P.; Meindl, M. Bernese GPS Software Version 5.0; Astronomical Institute, University of Bern: Bern, Switzerland, 2007. [Google Scholar]
  23. Kouba, J. Implementation and testing of the gridded Vienna Mapping Function 1 (VMF1). J. Geod. 2008, 82, 193–205. [Google Scholar] [CrossRef]
  24. re3data.org: VMF Data Server; Editing Status 2020-12-14; re3data.org-Registry of Research Data Repositories. Available online: https://www.re3data.org/repository/r3d100012025 (accessed on 26 July 2021).
  25. Gu, S.; Zheng, F.; Gong, X.; Lou, Y.; Shi, C. Fusing: A Distributed Software Platform for Real-Time High Precision Multi-GNSS Service; IGS Workshop: Wuhan, China, 2018. [Google Scholar]
  26. Lagler, K.; Schindelegger, M.; Böhm, J.; Krásná, H.; Nilsson, T. GPT2: Empirical slant delay model for radio space geodetic techniques. Geophys. Res. Lett. 2013, 40, 1069–1073. [Google Scholar] [CrossRef] [Green Version]
  27. Dach, R.; Schmid, R.; Schmitz, M.; Thaller, D.; Schaer, S.; Lutz, S.; Steigenberger, P.; Wübbena, G.; Beutler, G. Improved antenna phase center models for GLONASS. GPS Solut. 2011, 15, 49–65. [Google Scholar] [CrossRef]
  28. Liwosz, T. Effect of the GLONASS-specific receiver antenna phase center corrections on the results of European regional GNSS network. Artif. Satell. 2013, 48, 191. [Google Scholar] [CrossRef]
  29. Wells, D.; Beck, N.; Kleusberg, A.; Krakiwsky, E.J.; Lachapelle, G.; Langley, R.B. Guide to GPS Positioning; Canadian GPS Assoc: Fredericton, NB, Canada, 1987. [Google Scholar]
  30. Noll, C.E. The crustal dynamics data information system: A resource to support scientific analysis using space geodesy. Adv. Space Res. 2010, 45, 1421–1440. [Google Scholar] [CrossRef]
  31. Villiger, R. (Ed.) International GNSS Service Technical Report 2018 (IGS Annual Report); IGS Central Bureau and University of Bern; Bern Open Publishing: Bern, Switzerland, 2019. [Google Scholar]
  32. Gong, X.; Gu, S.; Zheng, F.; Wu, Q.; Liu, S.; Lou, Y. Improving GPS and Galileo precise data processing based on calibration of signal distortion biases. Measurement 2021, 174, 108981. [Google Scholar] [CrossRef]
Figure 1. DD network processing scheme.
Remotesensing 14 04640 g001
Figure 2. The IGS tracking stations of the high (red triangle), middle (green triangle), and low latitude networks (blue triangle).
Remotesensing 14 04640 g002
Figure 3. The results of the data quality check.
Remotesensing 14 04640 g003
Figure 4. The average number of visible satellites of GPS, GLONASS, and GPS+GLONASS in the high (red), middle (green), and low (blue) latitude networks.
Remotesensing 14 04640 g004
Figure 5. The histogram of visible satellites in the high (red), middle (green), and low (blue) latitude networks. The position of the dashed line and the value   x - indicate the average number of visible satellites. The σ 2 represents the variance of the visible satellites’ distribution. Please note that the horizontal axis of GPS and GLONASS visible satellites differs from that of GPS+GLONASS.
Remotesensing 14 04640 g005
Figure 6. The histogram of elevation distribution of the high (red), middle (green), and low (blue) latitude networks, the position of the dashed line and the value   x - indicate the mean elevation.
Remotesensing 14 04640 g006
Figure 7. The PDOP of GPS, GLONASS, and GPS+GLONASS in the high (red), middle (green), and low (blue) latitude networks (The GLONASS PDOP for the low latitude network exceed the coordinate threshold, and the small picture in the upper right corner with the rose thread shows the full view of the PDOP).
Remotesensing 14 04640 g007
Figure 8. The coordinate error series of station SOD3, WTZR, and SPTU estimated with DD processing.
Remotesensing 14 04640 g008
Figure 9. The RMSE of coordinates estimated with DD processing.
Remotesensing 14 04640 g009
Figure 10. The ZTD error series of station SOD3, WTZR, and SPTU estimated with DD processing.
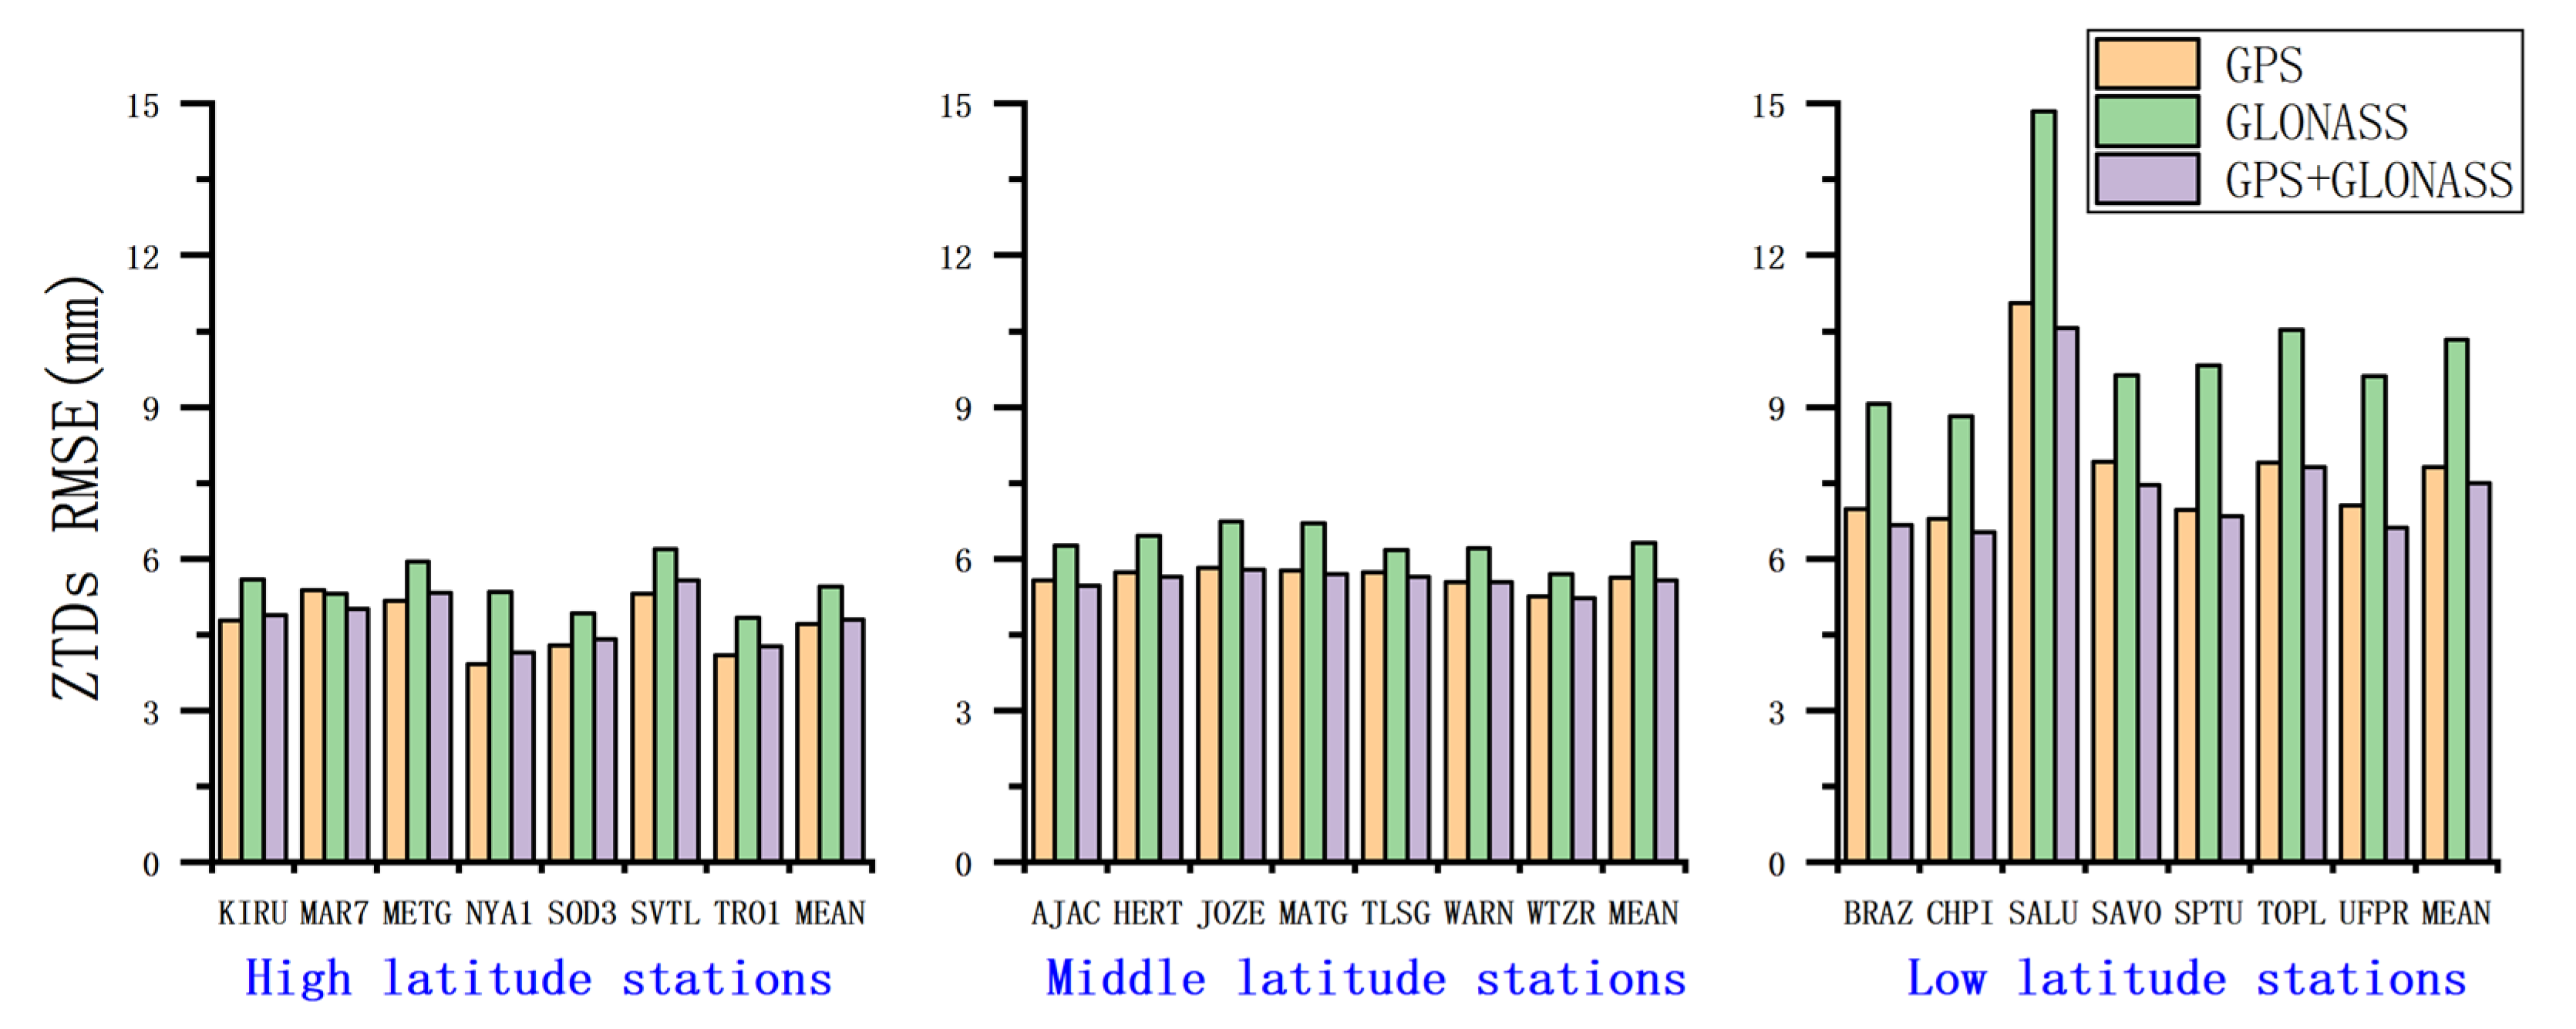
Remotesensing 14 04640 g010
Figure 11. The RMSE of ZTDs estimated with DD processing.
Remotesensing 14 04640 g011
Figure 12. The coordinate error series of station SOD3, WTZR, and SPTU estimated with PPP.
Remotesensing 14 04640 g012
Figure 13. The RMSE of coordinates of all the stations estimated with PPP.
Remotesensing 14 04640 g013
Figure 14. The convergence time of PPP.
Remotesensing 14 04640 g014
Figure 15. The ZTD error series of station SOD3, WTZR, and SPTU estimated with PPP.
Remotesensing 14 04640 g015
Figure 16. The RMSE of ZTDs estimated with PPP.
Remotesensing 14 04640 g016
Table 1. The processing strategies of PPP.
ItemProcessing Strategies
Signal selectionL1 and L2
Sampling rate30 s
Elevation mask
Precise productsCODE final precise products
Weight for observationsElevation-dependent weighting
Receiver clockEstimated as white noise
IonosphereIF combination
TroposphereGPT2, VMF1
Ocean tidal loadingFES2004
DCBCODE DCB monthly files
Antenna center offset and variationIGS14.atx
Processing modePPP static in 24 h window
StrategyForward extended Kalman filter
Table 2. The GNSS receivers and the antenna + radome types of the high latitude stations.
Station NameReceiver TypeAntenna + Radome Type
KIRUSEPT POLARX5SEPCHOKE_B3E6 SPKE
MAR7TRIMBLE ALLOYLEIAR25.R3 LEIT
METGSEPT POLARX5TRM59800.00 SCIS
NYA1TRIMBLE NETR8ASH701073.1 SNOW
SOD3JAVAD TRE_3 DELTAJAVRINGANT_DM SCIS
SVTLJAVAD TRE_3 DELTAJAVRINGANT_DM JVDM
TRO1TRIMBLE NETR9TRM59800.00 SCIS
Table 3. The GNSS receivers and the antenna + radome types of the middle latitude stations.
Station NameReceiver TypeAntenna + Radome Type
AJACSEPT POLARX5TRM115000.00 NONE
HERTLEICA GRX1200GGPROLEIAT504GG NONE
JOZESEPT POLARX5SEPCHOKE_B3E6 NONE
MATGLEICA GR10LEIAR25 NONE
TLSGSEPT POLARX5TRTRM59800.00 NONE
WARNJAVAD TRE_3 DELTALEIAR25.R4 LEIT
WTZRLEICA GR50LEIAR25.R3 LEIT
Table 4. The GNSS receivers and the antenna + radome types of the low latitude stations.
Station NameReceiver TypeAntenna + Radome Type
BRAZTRIMBLE NETR9TRM57971.00 NONE
CHPISEPT POLARX5TPSCR.G3 NONE
SALUTRIMBLE NETR9TRM115000.00 NONE
SAVOTRIMBLE NETR9TRM115000.00 NONE
SPTUTRIMBLE NETR9TRM57971.00 NONE
TOPLTRIMBLE NETR9TRM115000.00 NONE
UFPRTRIMBLE NETR9TRM115000.00 NONE
Table 5. The mean value of each data quality indicator in the three networks.
IndicatorDI (%)MP1 (m)MP2 (m)SN1 (dB)SN2 (dB)
Region GRGRGRGRGR
High latitude network94.3382.370.470.480.450.396.567.125.336.88
Middle latitude network96.1183.460.390.460.390.437.027.206.356.76
Low latitude network94.8181.330.720.530.480.446.726.594.926.32
Table 6. The mean RMSE of coordinates of each network estimated with DD processing and their comparison among different processing modes (where R/G indicates the accuracy comparison of GLONASS and GPS results, (G + R)/G indicates the accuracy comparison of GPS+GLONASS results and GPS estimates. The positive red and negative green values indicate the percentage increment and reduction of accuracy, respectively).
SystemG (mm)R (mm)G + R (mm)R/G (%)(G + R)/G (%)
Component
N2.992.582.27+13.79+24.29
E1.381.601.38−16.17+0.00
U9.879.249.41+6.35+4.66
3D10.409.739.77+6.50+6.05
N2.912.882.78+1.14+4.48
E1.902.472.12−30.17−11.77
U7.899.148.25−15.79−4.59
3D8.629.898.96−14.74−3.96
N2.603.182.57−22.13+1.37
E2.944.792.87−62.86+2.39
U7.7710.746.93−38.24+10.89
3D8.7112.187.92−39.93+9.00
Table 7. The ambiguity fixing rate of DD processing (G, R, and G + R in black body denote the data processing mode, respectively. No bold G, R, and G + R represent the ambiguity fixing rate of GPS+GLONASS processing mode, respectively).
SystemG (%)R (%)G + R
Region G (%)R (%)G + R (%)
High latitude network70.363.96962.866.5
Middle latitude network53.15651.554.853.0
Low latitude network74.726.474.633.957.5
Table 8. The mean RMSE of ZTDs estimated with DD processing for each network and their comparison between different processing modes (The positive red and negative green values indicate the percentage increment and reduction of accuracy, respectively).
SystemG (mm)R (mm)G + R (mm)R/G (%)G + R/G (%)
Region
High latitude network4.705.454.80−15.85−2.08
Middle latitude network5.636.325.57−12.26+1.06
Low latitude network7.8110.337.50−32.24+4.00
Table 9. The mean RMSE of coordinates for each network estimated with PPP and their comparison between different processing modes (The positive red and negative green values indicate the percentage increment and reduction of accuracy, respectively).
SystemG (mm)R (mm)G + R (mm)R/G (%)G + R/G (%)
Component
N2.662.302.16+13.62+18.78
E3.163.132.83+0.87+10.37
U6.676.866.15−2.83+7.87
3D7.928.037.18−1.37+9.35
N2.973.563.14−19.83−5.63
E2.643.212.56−21.77+2.99
U7.549.087.62−20.40−1.03
3D8.5610.398.69−21.43−1.52
N3.443.863.48−12.06−0.96
E3.914.093.14−4.54+19.73
U8.198.877.23−8.30+11.79
3D9.7810.528.66−7.58+11.40
Table 10. The mean convergence time of PPP for each network and their comparison between different processing modes (The red values indicate the percentage reduction of convergence time and the green values indicate the percentage increment of convergence time).
SystemG (min)R (min)G + R (min)R/G (%)G + R/G (%)
Region
High latitude network14.2621.6613.3951.906.11
Middle latitude network16.8124.4314.0345.2816.57
Low latitude network24.2749.8320.73105.3014.60
Table 11. The mean RMSE of ZTDs estimated with the PPP of each network and their comparison between different processing modes (The positive red and negative green values indicate the percentage increment and reduction of accuracy, respectively).
SystemG (mm)R (mm)G + R (mm)R/G (%)G + R/G (%)
Region
High latitude network4.845.334.59−10.10+5.19
Middle latitude network6.006.415.58−6.82+6.98
Low latitude network8.239.397.59−14.08+7.79
Publisher’s Note: MDPI stays neutral with regard to jurisdictional claims in published maps and institutional affiliations.

