Article

Regional Monitoring of Fall Armyworm (FAW) Using Early Warning Systems

1
Integrative Crop Ecophysiology Group, Plant Physiology Section, Faculty of Biology, University of Barcelona, 08028 Barcelona, Spain
2
AGROTECNIO (Center for Research in Agrotechnology), Av. Rovira Roure 191, 25198 Lleida, Spain
3
CIMMYT Western Africa Regional Office, Harare P.O. Box MP163, Zimbabwe
4
Lancaster Environment Centre, Lancaster University, Lancaster LA1 4YQ, UK
5
Department of Entomology & Biology, Penn State University, University Park, PA 16801, USA
6
Department of Agriculture and Biotechnology, Moi University, Eldoret 3900-30100, Kenya
7
Google, 1600 Amphitheatre Pkwy, Mountain View, CA 94043, USA
*
Author to whom correspondence should be addressed.
Remote Sens. 2022, 14(19), 5003; https://0-doi-org.brum.beds.ac.uk/10.3390/rs14195003
Submission received: 28 July 2022 / Revised: 26 September 2022 / Accepted: 30 September 2022 / Published: 8 October 2022

Abstract

:
The second United Nations Sustainable Development Goal (SDG2), zero hunger, aims to improve the productivity, food security, nutrition, and sustainability of small-scale farmers. The fall armyworm (FAW, Spodoptera frugiperda) has been devasting to smallholder farmer food security since it spread to sub-Saharan Africa in 2016, who have suffered massive crop losses, particularly maize, an important staple for basic sustenance. Since the FAW mainly devours green leaf biomass during the maize vegetative growth stage, the implementation of remote sensing technologies offers opportunities for monitoring the FAW. Here, we developed and tested a Sentinel 2 a+b satellite-based monitoring algorithm based on optimized first-derivative NDVI time series analysis using Google Earth Engine. For validation, we first employed the FAO Fall Armyworm Monitoring and Early Warning System (FAMEWS) mobile app data from Kenya, and then subsequently conducted field validation campaigns in Zimbabwe, Kenya, and Tanzania. Additionally, we directly observed loss of green biomass during maize vegetative growth stages caused by the FAW, confirming the observed signals of loss of the leaf area index (LAI) and the total green biomass (via the NDVI). Preliminary analyses suggested that satellite monitoring of small-scale farmer fields at the regional level may be possible with an NDVI first-derivative time series anomaly analysis using ESA Sentinel 2 a+b (R2 = 0.81). Commercial nanosatellite constellations, such as PlanetScope, were also explored, which may offer benefits from greater spatial resolution and return interval frequency. Due to other confounding factors, such as clouds, intercropping, weeds, abiotic stresses, or even other biotic pests (e.g., locusts), validation results were mixed. Still, maize biomass anomaly detection for monitoring the FAW using satellite data could help confirm the presence of the FAW with the help of expanded field-based monitoring through the FAO FAMEWS app.

Graphical Abstract

1. Introduction

The sustainable development goals (SDGs) developed by the UN are seventeen prioritized challenges regarding poverty, inequality, climate, environmental degradation, prosperity, peace, justice, and their interactions. SDG2 is “Zero Hunger”, which aims to end hunger globally, achieve food security, improve nutrition, and promote sustainable agriculture. SDG2 specifically prioritizes the support of subsistence and sustainable small-scale farmers with a focus on staple agro-food production [1]. Maize (Zea mays L.), after wheat and rice, is the third most important staple crop in the world, providing half of the daily food energy to Africa and America [2]. In Africa alone, more than 300 million people depend on maize as their main food crop and feed for livestock [3]. In Sub-Sahara Africa (SSA), there are 37 million ha of annually cultivated maize, with 95% of farms being less than 2 ha in size and belong to smallholder farmers [4]. Smallholder farmers grow their plots of maize using almost exclusively family labor, using mostly harvested seeds from previous seasons with few purchased inputs and their production is mostly for household consumption [5].
The fall armyworm (FAW), Spodoptera frugiperda, is native to the tropical and subtropical Americas, where it has been known for many decades as an economically detrimental pest of many crop species, especially maize. The FAW is a polyphagous lepidopteran pest widely considered to be one of the most damaging pests; it feeds on over 350 crops species to diverse families, including maize, rice, cabbage, soybean, tomato, cotton, etc. [6]. This pest has a strong preference for maize in the early vegetative stages when the plant presents tender green leaves [7]. Nevertheless, at the reproductive stage, the FAW tends to move to the cob, where it devastates yield quantity and quality [8]. This pest arrived in 2016 to Western Africa and spread quickly across Africa and has continued eastward through the Middle East by 2017, Asia by 2018–2019, and Australia by 2020 (Figure 1), and is expected to threaten Europe eventually [9,10]. The rapid spread of this species is related to its sporadic and long-distance migratory behavior, with the adult moths capable of flying over 100 km on a single night [11]. Some studies have indicated that the effect of FAW damage can cause USD 2.5-6.2 billon losses annually in yield maize across Africa [10,12]. In sub-Saharan Africa (SSA), this has been estimated to have increased by up to USD 13 billion per year after 2018 [13], thus threatening the livelihoods of millions of small farmers.
In America, FAW pest management using chemical pesticides and transgenic maize has succeeded in keeping FAW impacts under control [14,15]. However, for smallholder farmers in SSA affected by the FAW, efforts made in applying available insecticides have been deemed largely ineffective or not economically feasible [11,13]. For that reason, environmentally friendly and cost-effective strategies, such as integrated pest management (IPM) for FAW management, have been proposed to maintain productivity efficiently and sustainably according to the UN SDG2 guidelines [11]. There are different proposals on how to best manage biotic pests in accordance with different local cultural practices, such as high-quality seeds; optimizing the time of crop planting; rotating the target crop; or intercropping the main staples crop, e.g., maize or wheat mixed with another crop, such as beans, that repels the FAW (called push–pull), which moreover can increase the population of natural enemies such as predators and parasitoids. Besides these different IPM approaches, the application of sand/ash in the maize leaf funnels has also been shown to be a natural deterrent to the FAW when applied at specific larval growth stages [5,10,16].
As mentioned before, the FAW eats the tender leaves of maize during the vegetative stage. The newly hatched FAW larvae that feed on the young maize leaves do not directly cause yield losses because the plant is able to compensate for at least some loss of green biomass and a subsequent reduction in the total leaf area in terms of the leaf area index (LAI) of the crop [16,17]. However, if the older larvae attack the apical meristem or cob, the result is a dead heart, which means wilting and death of the unfurled leaves [10]. For that reason, repeated observations of the LAI and aboveground biomass during the early stages of maize may offer one possibility for the early warning and monitoring of FAW infestation. Here, remote sensing assessments of the LAI may serve to capture this effect at a large scale.
The LAI is a biophysical variable that has long been considered a key crop observation goal by remote sensing researchers working at different scales of observation [6], and there are a number of different technologies available for its measurement [18,19,20]. For instance, the European Space Agency (ESA) Sentinel-2 a+b satellites were launched relatively recently, coinciding with the invasion of the FAW in Africa, which provides unprecedented remote sensing global coverage at 10 m spatial resolution and 5 day repeat intervals [21]. The Sentinel-2 Toolbox Sentinel Application Platform (SNAP, https://step.esa.int/main/toolboxes/snap/, last accessed 25 June 2022) includes radiative transfer model based advanced algorithm calculations of the LAI, with control for calculations over specific geographic areas and time series ranges. In a similar fashion, the normalized difference vegetation index (NDVI), one of the most common remote sensing indexes, provides a simplified yet reliable estimate of green biomass [22,23,24]. The NDVI is derived from visible and near-infrared reflectance, which is closely related to vegetation presence or vigor, and can also be measured at the ground level with portable sensors [25]. Sentinel-2 a+b, as well as other satellites, provides spectral bands for the calculation of the NDVI, including PlanetScope microsatellite data, which offer a better 3 m spatial resolution and daily coverage of SSA [26]. Similarly, there are low-cost alternatives to the LAI and the NDVI from red–green–blue (RGB) visible spectrum indexes that can be calculated from commercial cameras in the field or on UAVs. In this case, the green area (GA) index represents the percentage of pixels ranging from yellow to bluish-green color, as calculated by the open-source software BreedPix and FIJI [27].
Several studies have been conducted using NDVI time series anomalies, including an assessment of the ecological response to global warming [28], phenological change [29], crop status ([30,31], land cover change [32], and early drought detection [23]. An NDVI time series may be affected by acquisition conditions, such as cloudy (or cloud shadow) vs. clear days. An NDVI time series curve for a crop season cycle should have an increasing slope and maximum NDVI values at peak crop growth and then decrease towards the end of the crop season, representing senescence. NDVI progression across a crop season is sensitive to increasing biomass in the first half of the season and then dominated by decreasing chlorophyll in the second half of the season [28]. For that reason, an NDVI time series relevant to FAW monitoring information should focus on crop development stages (both at the start and in the middle) and consider potential anomalies apart from the FAW. Two NDVI time series anomaly analyses are suggested: one to compare two different years and observe the differences and another to compare an average over a longer time period to one single year. In both of these cases, observed anomalies in growth and senescence or reductions in grain yield should also be considered against potential variations in climatic conditions season over season [33,34,35,36,37]. One other potential time series anomaly detection approach is to focus on rapid unusual changes, meaning to normalize the change rate of the NDVI curve through plotting the NDVI first derivative, which should help to remove the effects of climatic conditions, and other potential outside effects such as a lack of fertilizer or intercropping, which may vary between seasons [38,39,40,41,42].
The general aim of this study was to implement a cost-effective assessment for FAW monitoring and early warning system (FAMEWS) on sub-Saharan maize fields using different remote sensing technologies. We divided this work into two parts: (i) the development of a preliminary satellite image-based monitoring algorithm combining Google Earth Engine for Sentinel 2 a+b and validated by FAO FAMEWS mobile application data and (ii) a multi-scale field validation campaign of different time series anomaly change detection approaches, focusing on the first-derivative growth pattern analyses of the NDVI using Sentinel 2 a+b and PlanetScope image data during the maize vegetative growth stage, where FAW presence will result in a reduction in the LAI or total green biomass (NDVI) of the crop. During the field campaign and also in manual satellite image analyses, the data will also be further inspected in order to better decipher between potential confounding anomalies apart from the expected FAW impacts.

2. Materials and Methods
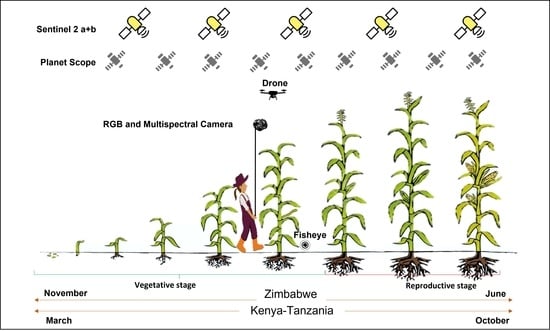
2.1. Study Sites

The measurements to monitor the FAW on maize fields were taken in three different countries: Zimbabwe, Tanzania, and Kenya (Figure 2), with efforts focused locally on Mashonaland and Masvingo (Zimbabwe), Arusha (Tanzania), and Western provinces (Kenya).
Firstly, we went to Zimbabwe (Figure 2a) from 30 March to 5 April of 2019, where we sampled a total of eight maize fields of different sizes in the two provinces. The maize growing season lasted from November to the end of June (Figure 3). All the fields were rainfed, and the average rainfall was 360 mm across the season.
Secondly, we went to Tanzania (Figure 2b) from 23 to 24 of May of 2019 and sampled twelve fields in the targeted province. The growing season was from March to October (Figure 3). All the fields were rainfed, cultivated during the unimodal season, and the average rainfall was 665 mm over the whole season.
Finally, we went to Kenya (Figure 2c) from 27 to 30 of May of 2019, where we sampled nineteen farms of different sizes in one province. The growing season lasted from March to October (Figure 3). All the fields were rainfed with 690 mm as the average rainfall across the season.
On the other hand, we classified the fields sampled according to the FAO FAMEWS protocols so that the data would be comparable. The data that we requested from the smallholder farmers or extension officers were the date of sowing; the stage of the crop at the same time samples were taken: vegetative, vegetative–reproductive (transition), or reproductive; farming systems: seasonal, rotation, or intercropping; types of the other crops if intercropped; and finally, any pest controls that the farmer used to control FAW: pesticide, IPM, or no treatments. Regarding levels of FAW infestation, we classified them into LOW, MEDIUM, and HIGH. This classification was based on choosing 50 plants from the middle of the field and counting how many of them were infested. We also classified the fields as monocropping and intercropping attending the type of crop. All the fields of maize that we selected were in the vegetative or vegetative–reproductive growth stages as the FAW impacts in the reproductive growth stage were less detectable using remote sensing. In addition, we collected data at each site using the FAMEWS app, which contributed to larger database efforts (https://www.fao.org/fall-armyworm/monitoring-tools/famews-mobile-app, last accessed 25 June 2022).
An important highlight could be that the most frequently high levels of FAW infestation occurred with monocropping and the most frequent low level of FAW infestation occurred when intercropping with common beans, which was also identified as part of the IPM strategy for the FAW [13]. In Zimbabwe, farmers had the option of using pesticides and their fields were mostly monocropping compared to the other two countries, where they controlled FAW using cultural controls with ash or handpicking, if any preventative measures were attempted.

2.2. Cloud-based Process Satellite Data: Sentinel 2 a+b

We worked with Google Earth Engine’s (GEE’s) application programming interface (API), which allows for the direct integration of Google-based server processing with satellite remote sensing data, such as NASA’s Landsat series and the ESA Copernicus EO program, but also includes extensive geographic, census, and climate data. Before the validation, through data captured during field campaigns conducted in 2019, we developed our theoretical framework into a fully functional code (https://code.earthengine.google.com/281c50b864af3836ca26345e09c4c248, last accessed 25 June 2022) in the GEE platform for extracting the NDVI and a time-lagged NDVI first derivative. This code was used to power image analyses from Sentinel 2 and study the impact and distribution of the FAW across Africa on a country-by-country basis. In the context of agriculture in Africa, cloud cover is an issue, but unique GEE algorithms allowed us to produce cloud-free image mosaics by combining multiple satellite image scenes using cloud masks applied at a pixel level. In collaboration with the United Nations Food and Agriculture Organization (FAO), we used the data from the FAMEWS mobile app (https://www.fao.org/fall-armyworm/monitoring-tools/famews-mobile-app, last accessed 25 June 2022), which we also helped to develop and refine, and was developed specifically for gathering data on the invasive pest FAW and assessing impacts on maize fields, and other crops, across the African continent (more specific details provided below in the farmer field sampling and questionnaire protocols) (Figure 3).
The left of Figure 4a is a graphical representation of the theoretical signal of the FAW in terms of vegetation change (Figure 4a); this is not the NDVI, but rather a derivative of the NDVI, (∆NDVI), where we anticipate opportunities to separate FAW impacts from a normal crop growth phenology. The rationale of the shape of this curve is that the FAW will decrease the crop leaf area during the vegetative growth stage, when it primarily eats the young leaves; however, the FAW will preferentially move to the cob once the crop enters the reproductive stage. In this moment, crop yield will be reduced but the crop leaf area may yet recover/regrow partially. The FAW has also been observed to infest a crop area and then quickly move on to another area, leaving the young crop, even still in a vegetative stage, to recover afterwards. Likewise, a similar recovery signal is observed in the case of a FAW infestation that is then treated afterwards. In Figure 4b, this part was based on the preliminary FAW data from known outbreak sites that were collected by the FAO FAMEWS app prior to our research initiation (https://www.fao.org/fall-armyworm/monitoring-tools/famews-mobile-app/, last accessed 25 June 2022).
At first, only a small amount of data was available for testing the capacities of the Google Earth Engine platform, resulting in the loss of >50% of the data available for looking at more detailed changes in crop vegetation growth dynamics. The combined Sentinel 2 a+b satellites, with a 5 day repeat interval once both satellites allowed for improved cloud-free mosaics every 10–15 days. Still, the data points provided by the early FAMEWS app FAW data extracted over one growing season was limited once filtered for cloud masking. Still, this was deemed to be minimally sufficient for the testing of the proof-of-concept for the two selected anomaly detection calculations. This derivative analysis approach may additionally prove useful as an approach for the detection of any crop phenology anomalies related to extreme weather events as suggested above, whereas the fusion of Sentinel 2 satellite data with weather anomalies may help to further improve the data analyses presented here.

2.3. Manually Processed Satellite Data: Sentinel 2 a+b and PlanetScope

Satellite image analysis was conducted manually, with data extractions and analysis corresponding to each maize field in vegetative stages from the different campaigns in Zimbabwe and Kenya. No cloud-free satellite images were available for the field campaign dates in Tanzania. For each country, the data were gathered during the respective maize field season. Sentinel-2 satellite data have 12 spectral bands: 443, 494, 560, 665, 704, 740, 781, 834, 944, 1375, 1612, and 2194 nm. The data were captured every 5 days at 10 m of resolution and the images were free to download. We used the Earth Explorer portal of the United States Geological Survey (USGS, https://earthexplorer.usgs.gov, last accessed 25 June 2022) to download them, and we applied a 50% cloud filter. For Zimbabwe, we downloaded seven images for each field between 1 February 2019 and 17 May 2019. Regarding Kenya, we downloaded five images for each field between 12 April 2019 and 6 July 2019. Table S1 shows the day of each image of Sentinel 2 a+b. We also used the commercial microsatellite PlanetScope with four bands (485, 545, 630, and 820nm) which offer daily images at 3 m resolution. We used the Planet Explorer (https://www.planet.com/explorer, last accessed 25 June 2022, requires access account) to download the images. For Zimbabwe, we downloaded 7 images for each field between 31 January 2019 and 17 May 2019. Regarding Kenya, we downloaded 8 images for each field between 11 April 2019 and 14 July 2019. Table S1 shows the day of each image of PlanetScope. We used the QGIS program (https://qgis.org, last accessed 25 June 2022) and we calculated the NDVI from the images of Sentinel-2 and PlanetScope.
For the NDVI [21], we calculated the following equation from Sentinel-2a+b bands:
NDVI = ( B 8 NIR : 834 nm B 8 RED : 665 nm ) ( B 8 NIR : 834 nm + B 8 RED : 665 nm )
For the NDVI, we calculated the following equation from PlanetScope bands [43]:
NDVI = ( B 4 NIR : 820 nm B 3 RED : 630 nm ) ( B 4 NIR : 820 nm + B 3 RED : 630 nm )
We used the program QGIS [44] to calculate the NDVI from the images of Sentinel-2 and PlanetScope. Once we had the NDVI for each day, we processed the time series curves, and we calculated the first derivative of the difference between each NDVI along the time series curve.

2.4. Unnamed Airborne Vehicle (UAV) Data Collection and Analysis

We managed to arrange for hiring locally licensed UAV pilots in two different countries as we were not approved with permits to fly UAVs in any of the three project countries. One was in Zimbabwe from 1 to 5 of April, and the second was in Tanzania from 23 to 24 of May. In both Zimbabwe and Tanzania, UAV data were collected 50 m above ground level (a.g.l.) using a DJI Phantom 4, with an RGB camera with a sensor of 1/2.3” CMOS (0.01 m/pixel). We carried out 6 flights in Zimbabwe and 12 flights in Tanzania. With the photographs taken with the UAV, we created orthomosaics for each field with the structure-from-motion Agisoft Metashape (https://www.agisoft.com, last accessed 25 June 2022). Once we had the orthomosaics, we used FIJI (https://imagej.net/software/fiji/, last accessed 25 June 2022) and the Mosaic tool (https://gitlab.com/sckefauver/MosaicTool, last accessed 25 June 2022) to cut the orthomosaics, where we obtained the area of interest. Then, we extracted the green area (GA) index values by applying the Breedpix algorithms incorporated into our free open-source software developed in previous research in collaboration with CIMMYT (https://github.com/sckefauver/CIMMYT, last accessed 25 June 2022), which can assess the total green biomass similar to the NDVI, but based on RGB images. In the hue–saturation–intensity (HSI) color space, the hue (H) component describes color chroma traversing the visible spectrum in the form of an angle between 0° and 360°. Thus, the green area (GA) index is the percentage of pixels in the image in the hue range from 60° to 180°, ranging from yellow to bluish green [45,46]. In some countries of Africa, all UAV flights were prohibited, such as in Kenya; thus, we used a QX1 RGB camera on a 5-meter-high telescoping pole and then used the MaizeScanner FIJI plugin, as described above, to calculate the GA index from these images for comparison purposes. The difference between the spatial resolution can be observed in Figure 5.

2.5. Multispectral Data Collection and Analysis

The multispectral field photos were taken in three different campaigns. First, in Zimbabwe, we collected multispectral data from 1 to 5 of April. Second, we collected multispectral data in Tanzania from 23 to 24 of May. Finally, we collected multispectral data in Kenya from 27 to 30 of May. For the multispectral data, we used an AIRINOV MultiSpec4-C multispectral camera with four bands (550, 660, 735, and 790 nm) on a 5-m pole. The images were acquired in continuous capture mode every 2 s, while crossing the fields in simulated UAV flight lines, so as to provide as close as full coverage of each field as possible in order to compare field averages for the NDVI across scales. In total, we took images in a total of 34 maize fields: 9 fields in Zimbabwe with an average of 150 images per field, 12 fields in Tanzania, with an average of 200 images per field, and 13 fields in Kenya with an average of 100 images per field. The number of images acquired changed depending on the size of the maize field. After the acquisition of the data, we customed an image processing code in FIJI to align the separate sensor images (550, 660, 735, and 790 nm) and to calculate the NDVI [47] following the equation below:
NDVI = ( B 4 NIR : 790 nm - B 3 RED : 735 nm ) ( B 4 NIR : 790 nm + B 3 RED : 735 nm )

2.6. Hemispherical (Fisheye) Lens Image Processing in CAN-EYE

For this technique, we took a digital image from under crops looking skywards using a hemispherical (fisheye) lens adapter that enables the collection of calibration/validation data if performed correctly using an adequately calibrated lens and complex calculations, as provided by the free software CAN-EYE (https://www6.paca.inrae.fr/can-eye, last accessed 25 June 2022) [18,48]. The CAN-EYE software provides an effective LAI, in which pixels are classified interactively, as well as easy processing and camera calibration protocols. We acquired these data across 39 fields, including maize farms from three different field campaigns in Zimbabwe, Tanzania, and Kenya. Hemispherical photographs were taken in jpeg format at the highest possible resolution (4632 × 3474 pixels) with a mobile camera Moto G (S5). We captured the three RGB photos in the middle of each field from below in the middle of four plants.

3. Results

3.1. Sentinel 2 a+b Time Series Analyses

Seasonal averages for known maize fields compared before and after the invasion of the FAW and the first-derivative negative incidences of the LAI/NDVI times series over the whole of the local maize season at each study location in Africa.
Figure 6 shows a comparison of the time series means of the NDVI values of December 2015, before the FAW, and the time series means of the NDVI values of December 2018 against the level of infestation with an R2 = 0.401. The values of the NDVI decrease as the level of infestation increases, following a logical negative correlation.
The resulting signal is a pulse of vegetation change that may be quantified in terms of depth and timing. In the graphic conceptualization of the FAW pulse signal, Sentinel 2 NDVI time change derivative series presented on the right side of Figure 4a shows the satellite image analysis results using the GEE API from the preliminary data point of FAW infestation during the 2016–2017 maize field season (Figure 4b) where the most data points remained after cloud mask filtering at the pixel level.
Figure 7 shows the results for the fall season of 2018 in Kenya using the FAMEWS app v1 data. In this case, the analysis of the first derivative of the NDVI time series of Sentinel-2 satellite image data shows an R2 of 0.81, with the infestation level of the FAW in each field exhibiting a markedly negative relationship. This was conducted with filtered data to include only vegetative state maize data for Kenya in these months. This suggests that using derivative NDVI time series analysis appears to be less sensitive to year over year factors, and thus better correlates with FAW severity, besides also potentially providing FAW infestation timing, which would be useful for developing an early warning system. No correlation was observed between the level of FAW infestation and NDVI observations.
Since the launch of Sentinel 2b, the repeat interval has been reduced by half, but a very high loss of data was still observed in relation to cloud cover over the three project study sites where satellite information was used, indicating the somewhat limited utility for satellite-based FAW monitoring at a large scale, except in largely cloud-free areas. Vegetation time series and anomaly change detection alone have not proved to be sufficiently reliable for uniquely identifying FAW; however, promising results were achieved from vegetation time series first-derivative analysis based on time step interval-based cloud-free mosaics. Subsequently, these analyses were expanded to include the whole of Africa using the same FAMEWS data for the same time, with poor reproducibility of results potentially related to environmental factors (data not shown).

3.2. Description of the Maize Fields That We Visited in Zimbabwe, Tanzania, and Kenya

For the in-situ validation of the satellite image anomaly detection results presented in Section 3.1, we visited 39 maize fields in the three different countries in total. Table S2 shows details of each field, including country, province, approximate sowing data, and crop stage as vegetative or vegetative–reproductive, and the approximate BBCH crop stage as well. Moreover, we described the farming system of each individual field, i.e., if there was rotation, seasonal crop, or intercropping. However, if the farming system was intercropping, the maize crop shared the field with other crops, including pumpkins, common beans, groundnuts, and sunflowers. We also included information on the level of the FAW infestation in each field, as estimated using the FAMEWS protocol for the field-level FAW infestation and how the smallholder farmers treated FAW, if any treatment was applied.
In Zimbabwe, most of the farmers used pesticides for control, and only one used ash as an alternative treatment. With respect to the field for Tanzania, only one farmer attempted to control the FAW using hand picking, but more detailed informationwas not available. In Kenya, the majority used ash to try to reduce the FAW infestation, and others did not use anything. Regarding the date of sowing, in Zimbabwe where the sowing months of maize were usually November–December, we can see that the sowing was late in January (Table S1), which could be because the year 2018 was relatively dry [49], which encouraged late sowing practices. On the other hand, in Tanzania and Kenya, almost all the maize fields were planted between March and April, with the exceptions of three fields at beginning of May. Given the present high level of FAW infestation, avoiding late planting is one of the IPM strategies, as some farmers attempted to avoid FAW infestation by adjusting their crop phenological cycles [11].

3.3. Comparison of the NDVI, GA Index, and LAI at Different Spatial Resolution

We conducted observations (NDVI, LAI, and GA index) at three different scales (PlanetScope, phenopole, and fisheye hemispherical lens taken from below the plant and looking upwards) from each country to field scales, all taken on the same day. Therefore, these data were collected in Kenya in the maize fields from 28 to 29 of May. The difference between the spatial resolution can be observed in Figure 5.
In Figure 8, the results show a comparison between the different indices taken with different sensors at different scales. In Figure 8a, we show the determination coefficient (R2) of the LAI taken from the fisheye in a mobile phone against the NDVI extracted from images from PlanetScope (nanosatellite) with an R2 = 0.737 (RSE: 0.05), the LAI against the NDVI extracted from images taken with a multispectral camera (at an altitude of 5 m) averaged over each field with an R2 = 0.617 (RSE: 0.05), and the LAI against the GA index extracted from the photo taken from an RGB camera (at an altitude of 5 m) with an R2 = 0.684 (RSE: 0.15). In Figure 8b, we can see the relationship between the GA (as we mentioned before) against the NDVI extracted from PlanetScope presents an R2 = 0.936 (RSE: 0.02) and the GA against the NDVI extracted from the multispectral camera presents an R2 = 0.708 (RSE: 0.05). Finally, the results presented in Figure 8c show the direct relation between the NDVI from the PlanetScope nanosatellite and NDVI values from the multispectral camera with an R2 = 0.713 (RSE: 0.05). R2 was higher than 60% between each category, despite differences in the observation level and image capture or averaging technique. Regarding the NDVI extracted from Sentinel 2 a+b, we could not compare these data easily to any other sources, as the day that we captured these field data was 28 May 2019, and there were no data from Sentinel 2 a+b on this specific day, whereas the closest possible (i.e., unclouded) day was 7 May 2019 and afterwards in July. Moreover, the GA that was taken from the UAV was not comparable either, as the UAV flights in Kenya were prohibited at the time of this field campaign.

3.4. Vegetation Growth Curves Based on Manually Processed Sentinel 2a+b and PlanetScope Image Data

Figure 9 shows the results of four different fields visited on 28 May 2019 in Kenya (first season of maize), showing the NDVI vegetation growth curve (continuous green line) and the first derivative of the NDVI curve first derivative (dashed light green line) along the season. With respect to the curves from Sentinel 2 shown in Figure 9, we can see that the curves do not present anomalies on the values of NDVI in the middle of the curve. These increase as the plants grow until the maize starts to dry (the color is not green anymore). The same happens for the first derivative of the NDVI curve.

4. Discussion

4.1. Sentinel 2 a+b Time Series Analyses

Improved data filtering can exclude other possible causes of sudden increases in NDVI/LAI values of maize crops. One study assessed the spatial distribution of the differences in the time lag between a dry year with negative precipitation and vegetation NDVI anomalies and a wet year with positive precipitation and vegetation NDVI anomalies in a drought-prone region in China [23]. In addition, in one study in a maize field in northeastern Indiana, by comparing NDVI values for individual image dates with the derived normal curve, the response of crop growth to environmental factors was quantified as NDVI residuals, and regression analysis revealed a significant relationship between the yield and NDVI residual during the pre-silking period, indicating that NDVI residuals reflect crop stress in the early growing period that impacts yield [50]. Furthermore, in a study in Zimbabwe, the development of the regional NDVI time series was composited for cultivated areas and adjusted temporally, according to the timing of the rainy season and this adjustment standardized the NDVI response vis-à-vis the expected phenological response of maize. As a consequence of that, a national time series index was developed and this national time series provided an effective summary of vegetation response in agricultural areas, allowing for the identification of NDVI green-up during grain filling [33].
All Sentinel 2 images for this period were used in pairs to create cloud cover reduced image composites. These was then compared with the previous composites in a time step of 11 days to calculate the NDVI change derivative. At the time of the first analyses, there was only one Sentinel 2 satellite sensor launched, and the code was prepared such that it would benefit from the launch of the Sentinel 2b sensor and be prepared for the analysis of new FAMEWS data starting in the summer of 2018. Meanwhile, the powerful computing capability of the GEE platform using greatly improved efficiency of dense image series analysis was in line with previous studies on crop and forest monitoring using GEE and satellite data [51,52,53]. A comparison between scalable techniques (Figure 4) (e.g., with nanosatellites, aircraft, and UAVs), all of which could provide higher spatial resolution coverage and higher frequency, which indicates better temporal coverage, is proposed for the supplemental or replacement acquisition of FAW monitoring data, as these techniques were not dependent on cloud cover [54,55,56]. These analyses which compare sensors at different scales could allow for temporal gap filling with real data and could improve the potential use of NDVI derivative anomaly detection, possibly related to the FAW. Furthermore, these techniques could help to confirm the qualitative observation of better performance in lowland areas where geographical variability is minimized.

4.2. Comparison of the NDVI, GA Index, and LAI at Different Spatial Resolutions

Once we had the preliminary data from GEE and some curves of the NDVI showed promise for FAW monitoring, we visited three different countries in Africa: Zimbabwe, Tanzania, and Kenya. In this part, we visited the small farmers’ fields and recorded the geographic coordinates of each one, because afterwards we needed to extract the related satellite information. At the same time, we used different sensors to measure the biomass in the maize fields. A close but not perfect relationship between LAI values and the spectral index NDVI is generally expected when compared for the same crop and across similar growing conditions. The slightly lower values of correlation with the field multispectral sensor were most apparent due to a lack of full-field coverage when deployed with a telescoping pole (FOV approx. 5m), but with limited coverage compared to data from a UAV, which provided more precise full coverage. We carried out this comparison to demonstrate the relationships between different technologies and sensors for validation because satellite data were often not available for our monitoring purposes due to cloud cover issues, especially when manually processing the satellite image data. The initial proposal was to use UAVs combined with satellites for data gap filling; however, in the countries in Africa that were included in this project, UAVs were either prohibited or highly limited, as we mentioned before. Moreover, gap-filling time series interpolation techniques would not work for using a first-derivative NDVI approach, but the scalability of the proof of concept for LAI assessments also needed some further investigation, even if the relationship under normal conditions is fairly well understood.
The parameters LAI, NDVI, and GA can be considered as similar total green biomass assessments, when measured in the vegetative growth stage for the same crop. These indices should be comparable enough to enable gap filling with real data in the case of cloud cover during the FAW critical monitoring periods There are many studies that compared the LAI using the LI-COR LAI-2000 meter (LI-COR, Inc., Lincoln, NE, USA), an approach similar to our fisheye technique, against NDVIs calculated from different satellites. Kovacs [57] showed that the NDVI calculated from a high-resolution IKONOS satellite (1x1 m the pixel) against the LAI taken from below the plant presents an R2 = 0.70. Moreover, a multiscale comparison between the LAI taken with a LI-COR LAI-2000 against the NDVI (Sentinel-2) showed an R2 = 0.77, and the same LAI against the NDVI from PlanetScope presented a correlation of 0.80. In addition, LAI compared to NDVI taken from the multispectral camera taken with a UAV showed an R2 = 0.67 [58]. Moreover, there are many studies in precision viticulture which compare NDVI at different scales evaluated by Matese [56], and they presented a correlation between the nanosatellite and the UAV (R2 = 0.70).
More advanced LAI assessment techniques with better calibration between the different approaches may provide improvements on the results presented above, even though we implemented a calibrated and standardized classic scientific approach using hemispherical lens photography. The LAI can be measured even by a smartphone using a variety of different apps and techniques, at specific angles (LAI above vs LAI below), or with hemispherical lens photography, as indicated here [20,48]. In fact, all of our LAI data were collected using the Android mobile app that we developed using ODK Collect for metadata recording, image capture, and geolocation, as well as data backup, all of which could allow for very low-cost citizen science-based data filling of LAI datasets for improving FAW monitoring in theory, incorporated as an optional module within the existing FAMEWS app, and potentially validated using the ESA Sentinel 2 SNAP Toolbox. This proof-of-concept scaling extension went beyond the scope of this project but may be pursued in future collaborative work.

4.3. Vegetation Growth Curves Based on Manually Processed Sentinel 2a+b and PlanetScope Image Data

This section focuses on the fields that we visited in the different target countries; we also estimated the FAW damage for the field as a categorical variable. We calculated the NDVI time series curves and first-derivative times-series curves using the data from Sentinel 2 and PlanetScope from the day that the maize was sowed until the reproductive stage was finished. In the case of negative values in the first derivative of the NDVI, something caused a marked and sudden reduction in the total green biomass (NDVI), whether by the FAW or some other biotic or abiotic factor.
The PlanetScope curves in Figure 9 presented possible FAW-related anomalies in the values of NDVI, where the first derivative of NDVI values is negative. After these values start to increase again, indicating that the crop recovered its growth again, and that something caused a marked and sudden reduction in the total green biomass (NDVI), probably the timing and impact of a FAW pest invasion, notably because field measurements and surveys were conducted during those same days. In fact, field data were taken on 28 May 2019, indicated by the vertical red line in Figure 9.
Supplemental Figures S1–S4 show the NDVI vegetation curve and NDVI first-derivative curve along the season of maize. Figure S1a–c shows values from the fields measured in Zimbabwe during the maize season. Figures S2–S4 show the fields measured in Kenya during the maize season.
They presented negative values on the NDVI first derivative calculated with PlanetScope data but could not confirm this pattern caused by the FAW, abiotic stress, or biotic stress. One of the preventative methods used by smallholder farmers was intercropping, using ground nuts or beans because they repelled and helped prevent FAW infestation [11,13]. On the other hand, repeating the same analysis for the 2020 crop season to test these concepts further for their potential for FAW monitoring was not possible due to the Locust (Schistocerca gregaria Forskål) invasion that year, which similarly attacked the plant through herbivory, often massively reducing the crop aboveground biomass and thus reducing both NDVI and LAI values [59,60,61].

5. Conclusions and Future

The first derivative of the Sentinel-2 a+b and PlanetScope NDVI time series showed the most promising results but only in select locations and is yet to be fully implemented with adequate spatial and false-positive anomaly filters. Again, the analyses presented here are best limited to vegetative growth stages with mostly maize as the main crop, though possible feasible with intercropping. Intercropping may be considered a source of variability, which will always be present for any type of image analysis. Cloud cover also reduced some of the useable data and is a major limitation using passive remote sensing approaches. One of the possible suggestions for future continuations of this work could be integration at different scales of remote sensing. For example, companies or governments could have regional control of the small farmer’s fields through monitoring with Sentinel 2 a+b and/or commercial nanosatellites with more detailed resolutions and shorter return intervals (depends on the type of satellite) to calculate the NDVI vegetation and derivative curves. Then, if the analysis showed that the NDVI was down in the middle of the season, they could travel to the field and double check using a mobile app, such as Nuru from PlantVillage [62,63] (see https://plantvillage.psu.edu/projects for more details, last accessed 25 June 2022) to recognize if the cause is the FAW or not, and verify that the dip in the NDVI growth curves was not caused by intercropping, weeds, or abiotic and other biotic factors (Figure 10).

Supplementary Materials

The following supporting information can be downloaded at: https://0-www-mdpi-com.brum.beds.ac.uk/article/10.3390/rs14195003/s1. Table S1. Days of the images from Sentinel 2 a+b and PlanetScope downloaded from USGS. Table S2. Relevant data taken from each field that we visited, using the FAMEWS app. Figure S1. (a–c) NDVI curves of vegetation from Zimbabwe (continue green line) and the first derivative of the NDVI curves (dashed light green line) were taken from Sentinel 2 a+b (left) and PlanetScope (right) along the first season of maize from January to the end of March and April. Figure S2. (a,b) NDVI curves of vegetation from Kenya (continue green line) and the first derivative of NDVI curves (dashed light green line) were taken from Sentinel 2 a+b (left) and PlanetScope (right) along the first season of maize from the end of April to the end of July. Figure S3. NDVI curves of vegetation from Kenya (continue green line) and the first derivative of NDVI curves (dashed light green line) were taken from Sentinel 2 a+b (left) and PlanetScope (right) along the first season of maize from the end of April to the end of July. Figure S4. NDVI curves of vegetation from Kenya (continue green line) and the first derivative of NDVI curves (dashed light green line) were taken from Sentinel 2 a+b (left) and PlanetScope (right) along the first season of maize from the end of April to the end of July.

Author Contributions

Conceptualization, M.L.B. and S.C.K.; methodology, M.L.B., S.C.K., J.C. (Jill Cairns), E.H., K.W., A.K., D.H., P.M. and J.C. (John Chelal); software N.C., S.C.K. and M.L.B.; validation, M.L.B. and S.C.K.; formal analysis, M.L.B. and S.C.K.; investigation, M.L.B. and S.C.K.; resources, M.L.B.; data curation, M.L.B. and S.C.K.; writing—original draft preparation, M.L.B. and S.C.K.; writing—review and editing, M.L.B., S.C.K. and J.L.A.; visualization, M.L.B. and S.C.K.; supervision, M.L.B. and S.C.K.; project administration, M.L.B. and S.C.K.; funding acquisition, S.C.K. All authors have read and agreed to the published version of the manuscript.

Funding

Funded by the Food and Agriculture of United Nations (FAO). S.C.K. is supported by the Ramon y Cajal RYC-2019-027818-I research fellowship from the Ministerio de Ciencia e Innovación, Spain. This research was also supported by the COST Action CA17134 SENSECO (Optical synergies for spatiotemporal sensing of scalable ecophysiological traits) funded by COST (European Cooperation in Science and Technology, www.cost.eu accessed on 29 April 2022).

Institutional Review Board Statement

Not applicable.

Informed Consent Statement

Not applicable.

Data Availability Statement

Not applicable.

Acknowledgments

Thanks to the CIMMYT from Zimbabwe, University of Moi from Kenya; the Nelson Mandela Institute from Arusha, Tanzania; Pennsylvania University from the U.S; and Lancaster University from the U.K.

Conflicts of Interest

The authors declare no conflict of interest. The funders had no role in the design of the study; in the collection, analyses, or interpretation of data; in the writing of the manuscript; or in the decision to publish the results.

References

  1. Brown, M.E. Metrics to accelerate private sector investment in sustainable development goal 2—Zero hunger. Sustainability 2021, 13, 5967. [Google Scholar] [CrossRef]
  2. Tanumihardjo, S.A.; McCulley, L.; Roh, R.; Lopez-Ridaura, S.; Palacios-Rojas, N.; Gunaratna, N.S. Maize agro-food systems to ensure food and nutrition security in reference to the Sustainable Development Goals. Glob. Food Secur. 2020, 25, 100327. [Google Scholar] [CrossRef]
  3. Prasanna, B.; Huesing, J.E.; Eddy, R.; Peschke, V.M. Fall Armyworm in Africa: A Guide for Integrated Pest Management, 1st ed.; CIMMYT: Mexico City, Mexico, 2018; pp. 45–62. [Google Scholar]
  4. FAOSTAT. The State of Food and Agriculture 2016 (SOFA): Climate Change, Agriculture and Food Security; FAO: Rome, Italy, 2016; ISBN 9789251062159. [Google Scholar]
  5. Hruska, A.J. Fall armyworm (Spodoptera frugiperda) management by smallholders. CAB Rev. Perspect. Agric. Vet. Sci. Nutr. Nat. Resour. 2019, 14, 1–11. [Google Scholar] [CrossRef] [Green Version]
  6. FAO. The Global Action for Fall Armyworm Control: Action Framework 2020–2022; FAO: Rome, Italy, 2020; ISBN 9789251326961. [Google Scholar]
  7. Balla, A.; Bhaskar, M.; Bagade, P.; Rawal, N. Yield losses in maize (Zea mays) due to fall armyworm infestation and potential IoT-based interventions for its control. J. Entomol. Zool. Stud. 2019, 7, 920–927. [Google Scholar]
  8. Williams, W.P.; Davis, F.M.; Buckley, P.M.; Hedin, P.A.; Baker, G.T.; Luthe, D.S. Factors Associated with Resistance to Fall Armyworm (Lepidoptera: Noctuidae) and Southwestern Corn Borer (Lepidoptera: Crambidae) in Corn at Different Vegetative Stages. J. Econ. Entomol. 1998, 91, 1471–1480. [Google Scholar] [CrossRef]
  9. Sisay, B.; Simiyu, J.; Mendesil, E.; Likhayo, P.; Ayalew, G.; Mohamed, S.; Subramanian, S.; Tefera, T. Fall armyworm, (spodoptera frugiperda) infestations in East Africa: Assessment of damage and parasitism. Insects 2019, 10, 195. [Google Scholar] [CrossRef] [PubMed] [Green Version]
  10. Day, R.; Abrahams, P.; Bateman, M.; Beale, T.; Clottey, V.; Cock, M.; Colmenarez, Y.; Corniani, N.; Early, R.; Godwin, J.; et al. Fall armyworm: Impacts and implications for Africa. Outlooks Pest Manag. 2017, 28, 196–201. [Google Scholar] [CrossRef] [Green Version]
  11. Gebreziher, H.G. Review on management methods of fall armyworm (Spodoptera frugiperda J.E. Smith) in Sub- Saharan Africa. Int. J. Entomol. Res. 2020, 5, 09–14. [Google Scholar]
  12. Hailu, G.; Niassy, S.; Zeyaur, K.R.; Ochatum, N.; Subramanian, S. Maize–legume intercropping and push–pull for management of fall armyworm, stemborers, and striga in Uganda. Agron. J. 2018, 110, 2513–2522. [Google Scholar] [CrossRef] [Green Version]
  13. Harrison, R.D.; Thierfelder, C.; Baudron, F.; Chinwada, P.; Midega, C.; Schaffner, U.; van den Berg, J. Agro-ecological options for fall armyworm (Spodoptera frugiperda J.E. Smith) management: Providing low-cost, smallholder friendly solutions to an invasive pest. J. Environ. Manag. 2019, 243, 318–330. [Google Scholar] [CrossRef]
  14. Abate, T.; van Huis, A.; Ampofo, K.O. Pest Management Strategies in Traditional Agriculture: An African Perspective. Annu. Rev. Entomol. 2000, 45, 631–659. [Google Scholar] [CrossRef] [PubMed]
  15. Wyckhuys, K.A.G.; O’Neil, R.J. Social and ecological facets of pest management in Honduran subsistence agriculture: Implications for IPM extension and natural resource management. Environ. Dev. Sustain. 2010, 12, 297–311. [Google Scholar] [CrossRef]
  16. Yigezu, G.; Wakgari, M. Local and indigenous knowledge of farmers management practice against fall armyworm (Spodoptera frugiperda) (J.E. Smith) (Lepidoptera: Noctuidae): A review. J. Entomol. Zool. Stud. 2020, 8, 765–770. [Google Scholar]
  17. Ayra-Pardo, C.; Huang, S.; Kan, Y.; Wright, D.J. Impact of invasive fall armyworm on plant and arthropod communities and implications for crop protection. Int. J. Pest Manag. 2021, 1–12. [Google Scholar] [CrossRef]
  18. Gross, H.R.; Young, J.R.; Wiseman, B.R. Relative Susceptibility of a Summer-Planted Dent and Tropical Flint Corn Variety to Whorl Stage Damage by the Fall Armyworm (Lepidoptera: Noctuidae). J. Econ. Entomol. 1982, 75, 1153–1156. [Google Scholar] [CrossRef]
  19. Jonckheere, I.; Fleck, S.; Nackaerts, K.; Muys, B.; Coppin, P.; Weiss, M.; Baret, F. Review of methods for in situ leaf area index determination Part I. Theories, sensors and hemispherical photography. Agric. For. Meteorol. 2004, 121, 19–35. [Google Scholar] [CrossRef]
  20. Van Gardingen, P.R.; Jackson, G.E.; Hernandez-Daumas, S.; Russell, G.; Sharp, L. Leaf area index estimates obtained for clumped canopies using hemispherical photography. Agric. For. Meteorol. 1999, 94, 243–257. [Google Scholar] [CrossRef]
  21. Garrigues, S.; Shabanov, N.V.; Swanson, K.; Morisette, J.T.; Baret, F.; Myneni, R.B. Intercomparison and sensitivity analysis of Leaf Area Index retrievals from LAI-2000, AccuPAR, and digital hemispherical photography over croplands. Agric. For. Meteorol. 2008, 148, 1193–1209. [Google Scholar] [CrossRef] [Green Version]
  22. Tucker, C.J. Red and photographic infrared linear combinations for monitoring vegetation. Remote Sens. Environ. 1979, 8, 127–150. [Google Scholar] [CrossRef] [Green Version]
  23. Van Hoek, M.; Jia, L.; Zhou, J.; Zheng, C.; Menenti, M. Early drought detection by spectral analysis of satellite time series of precipitation and Normalized Difference Vegetation Index (NDVI). Remote Sens. 2016, 8, 422. [Google Scholar] [CrossRef] [Green Version]
  24. Rouse, J.W.; Haas, R.H.; Schell, J.A.; Deering, D.W. Monitoring Vegetation Systems in the Great Plains with ERTS. In Proceedings of the Third ERTS Symposium, Washington, DC, USA, 10–14 December 1973; pp. 309–317. [Google Scholar]
  25. Thenkabail, P.S.; Smith, R.B.; De Pauw, E. Evaluation of Narrowband and Broadband Vegetation Indices for Determining Optimal Hyperspectral Wavebands for Agricultural Crop Characterization. Photogramm. Eng. Remote Sens. 2002, 68, 607–621. [Google Scholar]
  26. Casadesús, J.; Villegas, D. Conventional digital cameras as a tool for assessing leaf area index and biomass for cereal breeding. J. Integr. Plant Biol. 2014, 56, 7–14. [Google Scholar] [CrossRef] [PubMed]
  27. Segarra, J.; Buchaillot, M.L.; Araus, J.L.; Kefauver, S.C. Remote sensing for precision agriculture: Sentinel-2 improved features and applications. Agronomy 2020, 10, 641. [Google Scholar] [CrossRef]
  28. Cheng, Y.; Vrieling, A.; Fava, F.; Meroni, M.; Marshall, M.; Gachoki, S. Phenology of short vegetation cycles in a Kenyan rangeland from PlanetScope and Sentinel-2. Remote Sens. Environ. 2020, 248, 112004. [Google Scholar] [CrossRef]
  29. Pettorelli, N.; Vik, J.O.; Mysterud, A.; Gaillard, J.M.; Tucker, C.J.; Stenseth, N.C. Using the satellite-derived NDVI to assess ecological responses to environmental change. Trends Ecol. Evol. 2005, 20, 503–510. [Google Scholar] [CrossRef]
  30. White, M.A.; De Beurs, K.M.; Didan, K.; Inouye, D.W.; Richardson, A.D.; Jensen, O.P.; O’keefe, J.O.; Zhang, G.; Nemani, R.R.; Leeuwen, W.J.D.V.; et al. Intercomparison, interpretation, and assessment of spring phenology in North America estimated from remote sensing for 1982–2006. Glob. Chang. Biol. 2009, 15, 2335–2359. [Google Scholar] [CrossRef]
  31. Tottrup, C.; Rasmussen, M.S. Mapping long-term changes in savannah crop productivity in Senegal through trend analysis of time series of remote sensing data. Agric. Ecosyst. Environ. 2004, 103, 545–560. [Google Scholar] [CrossRef]
  32. Qader, S.H.; Dash, J.; Alegana, V.A.; Khwarahm, N.R.; Tatem, A.J.; Atkinson, P.M. The role of earth observation in achieving sustainable agricultural production in arid and semi-arid regions of the world. Remote Sens. 2021, 13, 3382. [Google Scholar] [CrossRef]
  33. Hüttich, C.; Herold, M.; Schmullius, C.; Egorov, V.; Bartalev, S.A. Indicators of Northern Eurasia’s land-cover change trends from SPOT-VEGETATION time-series analysis 1998–2005. Int. J. Remote Sens. 2007, 28, 4199–4206. [Google Scholar] [CrossRef]
  34. Funk, C.; Budde, M.E. Phenologically-tuned MODIS NDVI-based production anomaly estimates for Zimbabwe. Remote Sens. Environ. 2009, 113, 115–125. [Google Scholar] [CrossRef]
  35. Eerens, H.; Haesen, D.; Rembold, F.; Urbano, F.; Tote, C.; Bydekerke, L. Image time series processing for agriculture monitoring. Environ. Model. Softw. 2014, 53, 154–162. [Google Scholar] [CrossRef]
  36. Reinermann, S.; Gessner, U.; Asam, S.; Kuenzer, C.; Dech, S. The effect of droughts on vegetation condition in Germany: An analysis based on two decades of satellite earth observation time series and crop yield statistics. Remote Sens. 2019, 11, 1783. [Google Scholar] [CrossRef] [Green Version]
  37. Rembold, F.; Atzberger, C.; Savin, I.; Rojas, O. Using low resolution satellite imagery for yield prediction and yield anomaly detection. Remote Sens. 2013, 5, 1704–1733. [Google Scholar] [CrossRef] [Green Version]
  38. Serra, P.; Pons, X. Monitoring farmers’ decisions on Mediterranean irrigated crops using satellite image time series. Int. J. Remote Sens. 2008, 29, 2293–2316. [Google Scholar] [CrossRef]
  39. Meroni, M.; Atzberger, C.; Vancutsem, C.; Gobron, N.; Baret, F.; Lacaze, R.; Eerens, H.; Leo, O. Evaluation of agreement between space remote sensing SPOT-VEGETATION fAPAR Time Series. IEEE Trans. Geosci. Remote Sens. 2013, 51, 1951–1962. [Google Scholar] [CrossRef]
  40. Winkler, K.; Gessner, U.; Hochschild, V. Identifying droughts affecting agriculture in Africa based on remote sensing time series between 2000-2016: Rainfall anomalies and vegetation condition in the context of ENSO. Remote Sens. 2017, 9, 831. [Google Scholar] [CrossRef] [Green Version]
  41. Rembold, F.; Meroni, M.; Urbano, F.; Royer, A.; Atzberger, C.; Lemoine, G.; Eerens, H.; Haesen, D. Remote sensing time series analysis for crop monitoring with the SPIRITS software: New functionalities and use examples. Front. Environ. Sci. 2015, 3, 1–11. [Google Scholar] [CrossRef] [Green Version]
  42. Ramos, A.P.M.; Gomes, F.D.G.; Pinheiro, M.M.F.; Furuya, D.E.G.; Gonçalvez, W.N.; Marcato, J., Jr.; Michereff, M.F.F.; Blassioli-Moraes, M.C.; Borges, M.; Alaumann, R.A.; et al. Detecting the attack of the fall armyworm (Spodoptera frugiperda) in cotton plants with machine learning and spectral measurements. Precis. Agric. 2021, 23, 470–491. [Google Scholar] [CrossRef]
  43. Brown, M.E.; Mugo, S.; Petersen, S.; Klauser, D. Designing a Pest and Disease Outbreak Warning System for Farmers, Agronomists and Agricultural Input Distributors in East Africa. Insects 2022, 13, 232. [Google Scholar] [CrossRef]
  44. Pisman, T.I.; Erunova, M.G.; Botvich, I.Y.; Shevyrnogov, A.P. Spatial Distribution of NDVI Seeds of Cereal Crops with Different Levels of Weediness According to PlanetScope Satellite Data. J. Sib. Fed. Univ. Eng. Technol. 2020, 13, 578–585. [Google Scholar] [CrossRef]
  45. Moyroud, N.; Portet, F. Introduction to QGIS. In QGIS Generic Tools; Wiley: Hoboken, NJ, USA, 2018; pp. 1–17. [Google Scholar]
  46. Casadesus, J.; Kaya, Y.; Bort, J.; Nachit, M.M.; Araus, J.L.; Amor, S.; Ferrazzano, G.; Maalouf, F.; Maccaferri, M.; Martos, V.; et al. Using vegetation indices derived from conventional digital cameras as selection criteria for wheat breeding in water-limited environments. Ann. Appl. Biol. 2007, 150, 227–236. [Google Scholar] [CrossRef]
  47. Buchaillot, M.L.; Gracia-Romero, A.; Vergara-Diaz, O.; Zaman-Allah, M.A.; Tarekegne, A.; Cairns, J.E.; Prasanna, B.M.; Araus, J.L.; Kefauver, S.C. Evaluating maize genotype performance under low nitrogen conditions using RGB UAV phenotyping techniques. Sensors 2019, 19, 1815. [Google Scholar] [CrossRef] [PubMed] [Green Version]
  48. Cao, S.; Danielson, B.; Clare, S.; Koenig, S.; Campos-Vargas, C.; Sanchez-Azofeifa, A. Radiometric calibration assessments for UAS-borne multispectral cameras: Laboratory and field protocols. Int. Soc. J. Photogramm. Remote Sens. 2019, 149, 132–145. [Google Scholar] [CrossRef]
  49. Demarez, V.; Duthoit, S.; Baret, F.; Weiss, M. Dedieu Estimation of leaf area and clumping indexes of crops with hemispherical photographs. Agric. For. Meteorol. 2008, 148, 644–655. [Google Scholar] [CrossRef]
  50. Baudron, F.; Zaman-Allah, M.A.; Chaipa, I.; Chari, N.; Chinwada, P. Understanding the factors influencing fall armyworm (Spodoptera frugiperda J.E. Smith) damage in African smallholder maize fields and quantifying its impact on yield. A case study in Eastern Zimbabwe. Crop Prot. 2019, 120, 141–150. [Google Scholar] [CrossRef]
  51. Wang, R.; Cherkauer, K.; Bowling, L. Corn response to climate stress detected with satellite-based NDVI time series. Remote Sens. 2016, 8, 269. [Google Scholar] [CrossRef] [Green Version]
  52. Li, H.; Jia, M.; Zhang, R.; Ren, Y.; Wen, X. Incorporating the plant phenological trajectory into mangrove species mapping with dense time series Sentinel-2 imagery and the Google Earth Engine platform. Remote Sens. 2019, 11, 2479. [Google Scholar] [CrossRef] [Green Version]
  53. Mahdianpari, M.; Jafarzadeh, H.; Granger, J.E.; Mohammadimanesh, F.; Brisco, B.; Salehi, B.; Homayouni, S.; Weng, Q. A large-scale change monitoring of wetlands using time series Landsat imagery on Google Earth Engine: A case study in Newfoundland. GISci. Remote Sens. 2020, 57, 1102–1124. [Google Scholar] [CrossRef]
  54. Decuyper, M.; Chávez, R.O.; Lohbeck, M.; Lastra, J.A.; Tsendbazar, N.; Hackländer, J.; Herold, M.; Vågen, T.G. Continuous monitoring of forest change dynamics with satellite time series. Remote Sens. Environ. 2022, 269, 112829. [Google Scholar] [CrossRef]
  55. Nonni, F.; Malacarne, D.; Pappalardo, S.E. Sentinel-2 Data Analysis and Comparison with UAV Multispectral Images for Precision Viticulture Study areas. GI Forum 2018, 1, 105–116. [Google Scholar]
  56. Berra, E.F.; Gaulton, R.; Barr, S. Assessing spring phenology of a temperate woodland: A multiscale comparison of ground, unmanned aerial vehicle and Landsat satellite observations. Remote Sens. Environ. 2019, 223, 229–242. [Google Scholar] [CrossRef]
  57. Matese, A.; Toscano, P.; Di Gennaro, F.S.; Genesio, L.; Vaccari, F.P.; Primicerio, J.; Belli, C.; Zaldei, A.; Bianconi, R.; Gioli, B. Intercomparison of UAV, Aircraft and Satellite Remote Sensing Platforms for Precision Viticulture. Remote Sens. 2015, 7, 2971–2990. [Google Scholar] [CrossRef] [Green Version]
  58. Kovacs, J.M.; Flores-Verdugo, F.; Wang, J.; Aspden, L.P. Estimating leaf area index of a degraded mangrove forest using high spatial resolution satellite data. Aquat. Bot. 2004, 80, 13–22. [Google Scholar] [CrossRef]
  59. Ihuoma, S.O.; Madramootoo, C.A.; Kalacska, M. Integration of satellite imagery and in situ soil moisture data for estimating irrigation water requirements. Int. J. Appl. Earth Obs. Geoinf. 2021, 102, 102396. [Google Scholar] [CrossRef]
  60. Salih, A.A.M.; Baraibar, M.; Mwangi, K.K.; Artan, G. Climate change and locust outbreak in East Africa. Nat. Clim. Chang. 2020, 10, 584–585. [Google Scholar] [CrossRef]
  61. Meynard, C.N.; Lecoq, M.; Chapuis, M.P.; Piou, C. On the relative role of climate change and management in the current desert locust outbreak in East Africa. Glob. Chang. Biol. 2020, 26, 3753–3755. [Google Scholar] [CrossRef] [PubMed]
  62. Odhiambo, K.; Lewis, J.; Tefera, N.; Thomas, A.; Meroni, M.; Rembold, M. Impacts of COVID-19 and Desert Locusts on Smallholder Farmers Food Systems and Value Chains in Kenya; Publications Office of the EU: Luxembourg, 2021; ISBN 978-92-76-32073-9. [Google Scholar]
  63. Kehs, A.; Mccloskey, P.; Chelal, J.; Morr, D.; Amakove, S.; Mayieka, J.; Ntango, G.; Nyongesa, K.; Pamba, L.; Mugo, J.; et al. From village to globe: A dynamic real-time map of African fields through PlantVillage. Front. Sustain. Food Syst. 2019, 5, 514785. [Google Scholar] [CrossRef]
Figure 1. Geographic invasion/expansion of the fall armyworm (FAW), Spodoptera frugiperda, across the world (source from [9] adapted).
Remotesensing 14 05003 g001
Figure 2. (a) Map of Zimbabwe, in red provinces of Mashonaland Central and Masvingo; (b) map of Tanzania, in the red province of Arusha; (c) map of Kenya, in the red Western province. Asterisks mark the locations where we took the data.
Remotesensing 14 05003 g002
Figure 3. Workflow summary of the principal objectives and the two separate specific phases of the project with all the processes for each location and study phase.
Remotesensing 14 05003 g003
Figure 4. (a) Conceptual framework of the time series analyses that was expected through the four stages of maize response to the FAW. (1) The crop growth as normal, emergence, increased rate of growth until reaching a plateau at near full growth. (2) FAW infestation results in the loss of vegetative cover, marked as “negative growth.” (3) The negative values of the first derivative end with treatment or cob development (as the FAW will move to the cob during the maize reproductive phase). (4) The crop may recover and the FAW may attack again up until the maize reproductive phase-cob development, when subsequent FAW impacts will result in symptoms not observable by remote sensing techniques, being a somewhat hidden yield loss. (b) Exemplary actual Sentinel 2 NDVI time change first-derivative time series at a location of documented high FAW damage, according to FAMEWS. The satellite image analysis results using the GEE API from the preliminary data point of FAW infestation from the 2016–2017 maize field season where the most data points remained after cloud mask filtering at the pixel level.
Remotesensing 14 05003 g004
Figure 5. The different spatial resolutions that were used a long the article. (a) Calculated NDVI with Sentinel bands with a resolution of 10 m/pixel. (b) Calculated NDVI with PlanetScope bands with a resolution of 3 m/pixel. (c) Photo taken with a DJI Phantom 4 UAV at an altitude of 50 m and with a resolution of 0.01 m/pixel. (d) Photo taken with a multispectral camera at 5 m of altitude and with a resolution of 0.06 m/pixel. (e) Photo taken with a RGB camera at 5 m of altitude, and with a resolution of 0.009 m/pixel. (f) Photo taken with a mobile phone with a fisheye adapter from below, and with a resolution of 0.001 m/pixel.
Remotesensing 14 05003 g005
Figure 6. Difference between the NDVI average from December 2015 (farms without the FAW) and the NDVI average from December 2018 (farms with the FAW) against the level infestation of the FAW (0 to 100) in the maize field collected by the FAMEWS app.
Remotesensing 14 05003 g006
Figure 7. Relation between the minimum value from the entire growth season of the first-derivative NDVI time series against the level of infestation of the FAW (0-100) in the maize field collected by the FAMEWS app.
Remotesensing 14 05003 g007
Figure 8. Coefficient of determination (R2) of the different indices of aboveground biomass against each other, all taken on the same day (28 May 2019). (a) In the x axis, the LAI is taken with the fisheye (from below the plant) and the y axis shows the NDVI calculated from PlanetScope (nanosatellite), the NDVI calculated from the multispectral sensor (at 5 m), and the GA index extracted from the RGB camera (at 5 m). (b) The GA index from the camera compared against the two different NDVI sources: the multispectral sensor and the nanosatellite. (c) The comparison between the NDVI from the nanosatellite and the NDVI from the field multispectral camera. (* = Pearson correlation significant with p < 0.05).
Remotesensing 14 05003 g008
Figure 9. NDVI curves of vegetation from Kenya (continue green line) and the first derivative of NDVI curves (dashed light green line) were taken from Sentinel 2 a+b (left) and PlanetScope (right) along the first season of maize from the end of April to the end of July. The field presented three levels of infestations: LOW, MEDIUM, and HIGH. The vertical red dotted line is the day that we were in the field taking the data (28 May 2019). The x-axis (left) values between 0 and 0.8 belong to the NDVI index and x-axis (right) values between -0.2 and 0.8 belong to the NDVI first derivative. The Y axis belongs to the maize crop season from the sowing day to the harvest day.
Remotesensing 14 05003 g009
Figure 10. One tentative “solution” could be integrating at different scales of remote sensing.
Remotesensing 14 05003 g010
Publisher’s Note: MDPI stays neutral with regard to jurisdictional claims in published maps and institutional affiliations.

