Article

Remote Sensing for Biocultural Heritage Preservation in an African Semi-Arid Region: A Case Study of Indigenous Wells in Northern Kenya and Southern Ethiopia

1
British Institute in Eastern Africa, Nairobi P.O. Box 30710-00100 GPO, Kenya
2
Institute of Arab and Islamic Studies, University of Exeter, Exeter EX4 4ND, UK
3
McDonald Institute for Archaeological Research, University of Cambridge, Cambridge CB2 3ER, UK
4
Department of Archaeology & Heritage Management, University of Addis Ababa, Bole Sub-city, Woreda 05, 311, Addis Ababa 1014, Ethiopia
5
Tetra Tech ARD, USAID-LGA Ethiopia, Bole Sub-city, Woreda 05, 311, Addis Ababa 1014, Ethiopia
6
Department of Archaeology, University of Cambridge, Cambridge CB2 3DZ, UK
7
School of Geography, Archaeology & Environmental Studies, University of the Witwatersrand, 1 Jan Smuts Avenue, Braamfontein, Room 123B, Bernard Price Bldg, Johannesburg 2000, South Africa
*
Author to whom correspondence should be addressed.
Submission received: 1 November 2021 / Revised: 17 December 2021 / Accepted: 22 December 2021 / Published: 11 January 2022
(This article belongs to the Special Issue Remote Sensing for Archaeological Heritage Preservation)

Abstract

:
The region of Southern Ethiopia (Borana) and Northern Kenya (Marsabit) is characterised by erratic rainfall, limited surface water, aridity, and frequent droughts. An important adaptive response to these conditions, of uncertain antiquity, has been the hand-excavation of a sequence of deep wells at key locations often along seasonal riverbeds and valley bottoms where subterranean aquifers can be tapped. Sophisticated indigenous water management systems have developed to ensure equitable access to these critical water resources, and these are part of well-defined customary institutional leadership structures that govern the community giving rise to a distinctive form of biocultural heritage. These systems, and the wells themselves, are increasingly under threat, however, from climate change, demographic growth, and socio-economic development. To contribute to an assessment of the scale, distribution and intensity of these threats, this study aimed to evaluate the land-use land-cover (LULC) and precipitation changes in this semi-arid to arid landscape and their association with, and impact on, the preservation of traditional wells. Multitemporal Landsat 5, 7 and 8 satellite imagery covering the period 1990 to 2020, analysed at a temporal resolution of 10 years, was classified using supervised classification via the Random Forest machine learning method to extract the following classes: bare land, grassland, shrub land, open forest, closed forest, croplands, settlement and waterbodies. Change detection was then applied to identify and quantify changes through time and landscape degradation indices were generated using the Shannon Diversity Index fragmentation index within a 15 km buffer of each well cluster. The results indicated that land cover change was mostly driven by increasing anthropogenic changes with resultant reduction in natural land cover classes. Furthermore, increased fragmentation has occurred within most of the selected buffer distances of the well clusters. The main drivers of change that have directly or indirectly impacted land degradation and the preservation of indigenous water management systems were identified through an analysis of land cover changes in the last 30 years, supporting insights from previous focused group discussions with communities in Kenya and Ethiopia. Our approach showed that remote sensing methods can be used for the spatially explicit mapping of landscape structure around the wells, and ultimately towards assessment of the preservation status of the indigenous wells.

Graphical Abstract

1. Introduction

The use of remote sensing technologies for the detection of archaeological sites and monuments and other forms of tangible cultural heritage has increased significantly in recent decades, including on the African continent [1,2,3,4,5]. A common application has been the use of freely available satellite imagery, such as provided via the Google Earth platform, to locate previously undocumented sites in remote areas that have not been the focus of systematic pedestrian surveys [6,7,8]. The application of remote sensing technologies has also proved to be an effective means of monitoring the condition of archaeological sites and monuments [9,10,11,12,13,14]. The approach has proved especially useful for areas afflicted by civil war and other forms of conflict that limit the opportunities for physical visits [15,16,17], and allows the generation of ‘risk maps’ for particular areas that permit heritage managers to identify those individual sites and even entire heritage landscapes that might be at greater risk from damage or destruction and thus plan appropriate intervention and management strategies. Remote sensing is also increasingly used to map and monitor the environmental setting of heritage sites, and thereby assess the levels of risk arising from such factors as the indirect consequences of urban expansion, changing hydrological regimes, and sea level rise and associated coastal erosion [18,19,20,21,22].
In contrast, there has been less use of remote sensing technologies to map and monitor examples of extant ‘biocultural heritage’, except where such heritage is located within designated protected areas such as national parks and heritage landscapes and subject to formalised management regimes. Precisely because biocultural heritage remains in use by and under the control of descendants of its ancestral users and makers, changes to how such heritage is used and modifications to its environmental setting are inherent to everyday management.
Encompassing “indigenous and local community knowledge, innovations, and practices…developed within, and linked to, the social–ecological context” [23], biocultural heritage represents a fusion of both the ’natural’ and ’cultural’ components of human–environment interactions [24]. More specifically, the term is commonly used to refer to ”biological manifestations of culture, reflecting indirect or intentional effects, or domesticated landscapes, resulting from historical human niche construction” [25]. Examples of such distinctive niches co-created by the interaction of human and non-human agents include the grazing lawns generated by centuries of pastoralist settlement and mobility across eastern Africa’s savannah landscapes [26], and the African Dark Earths formed by routine discard of household waste around settlements in West African forests [27].
As these and other examples suggest, biocultural heritage is intimately connected with landscape practices. It can also play a crucial role in defining, and redefining community and in shaping transformability, while also serving as a well-spring for creativity, artistic expressions, and environmental understanding [28]. However, precisely because such heritage remains in use as a fundamental component of routine practice, it is always subject to change and modification—and indeed, heritage, whether tangible or intangible, is best understood as a dynamic entity modified to meet contemporary needs and values as society changes. As land use practices change, however, the contributions heritage entities provide toward sustaining biological and cultural diversity that help support socio-ecological resilience can diminish. Such changes are typically gradual and difficult to detect from one year to the next and may only be recognized too late for any effective intervention. In this regard, time-series remote sensing, which has the capacity to capture change at multiple temporal scales, especially when integrated with other sources of information, including oral histories and ethnographic observations, has the potential to play a critical role in identifying risks and even provide predictive modelling of future trends, allowing landscape managers to develop appropriate preservation and conservation strategies.
To illustrate these points, and especially the risks such changes can introduce to the long-term survival of the living traditions that help sustain such heritage as a living rather than as a relict or fossilised entity, and the role remote sensing mapping can play in identifying risks and potentially averting them, we present here an analysis of land use land cover change (LULC) in an area of Southern Ethiopia and Northern Kenya (Figure 1) characterised by erratic rainfall, limited surface water, aridity, and frequent droughts. An important adaptive response of uncertain antiquity to these conditions has been the hand-excavation of a sequence of deep wells by pastoralists at key locations often along seasonal riverbeds and valley bottoms where subterranean aquifers can be tapped, as discussed in the next section.

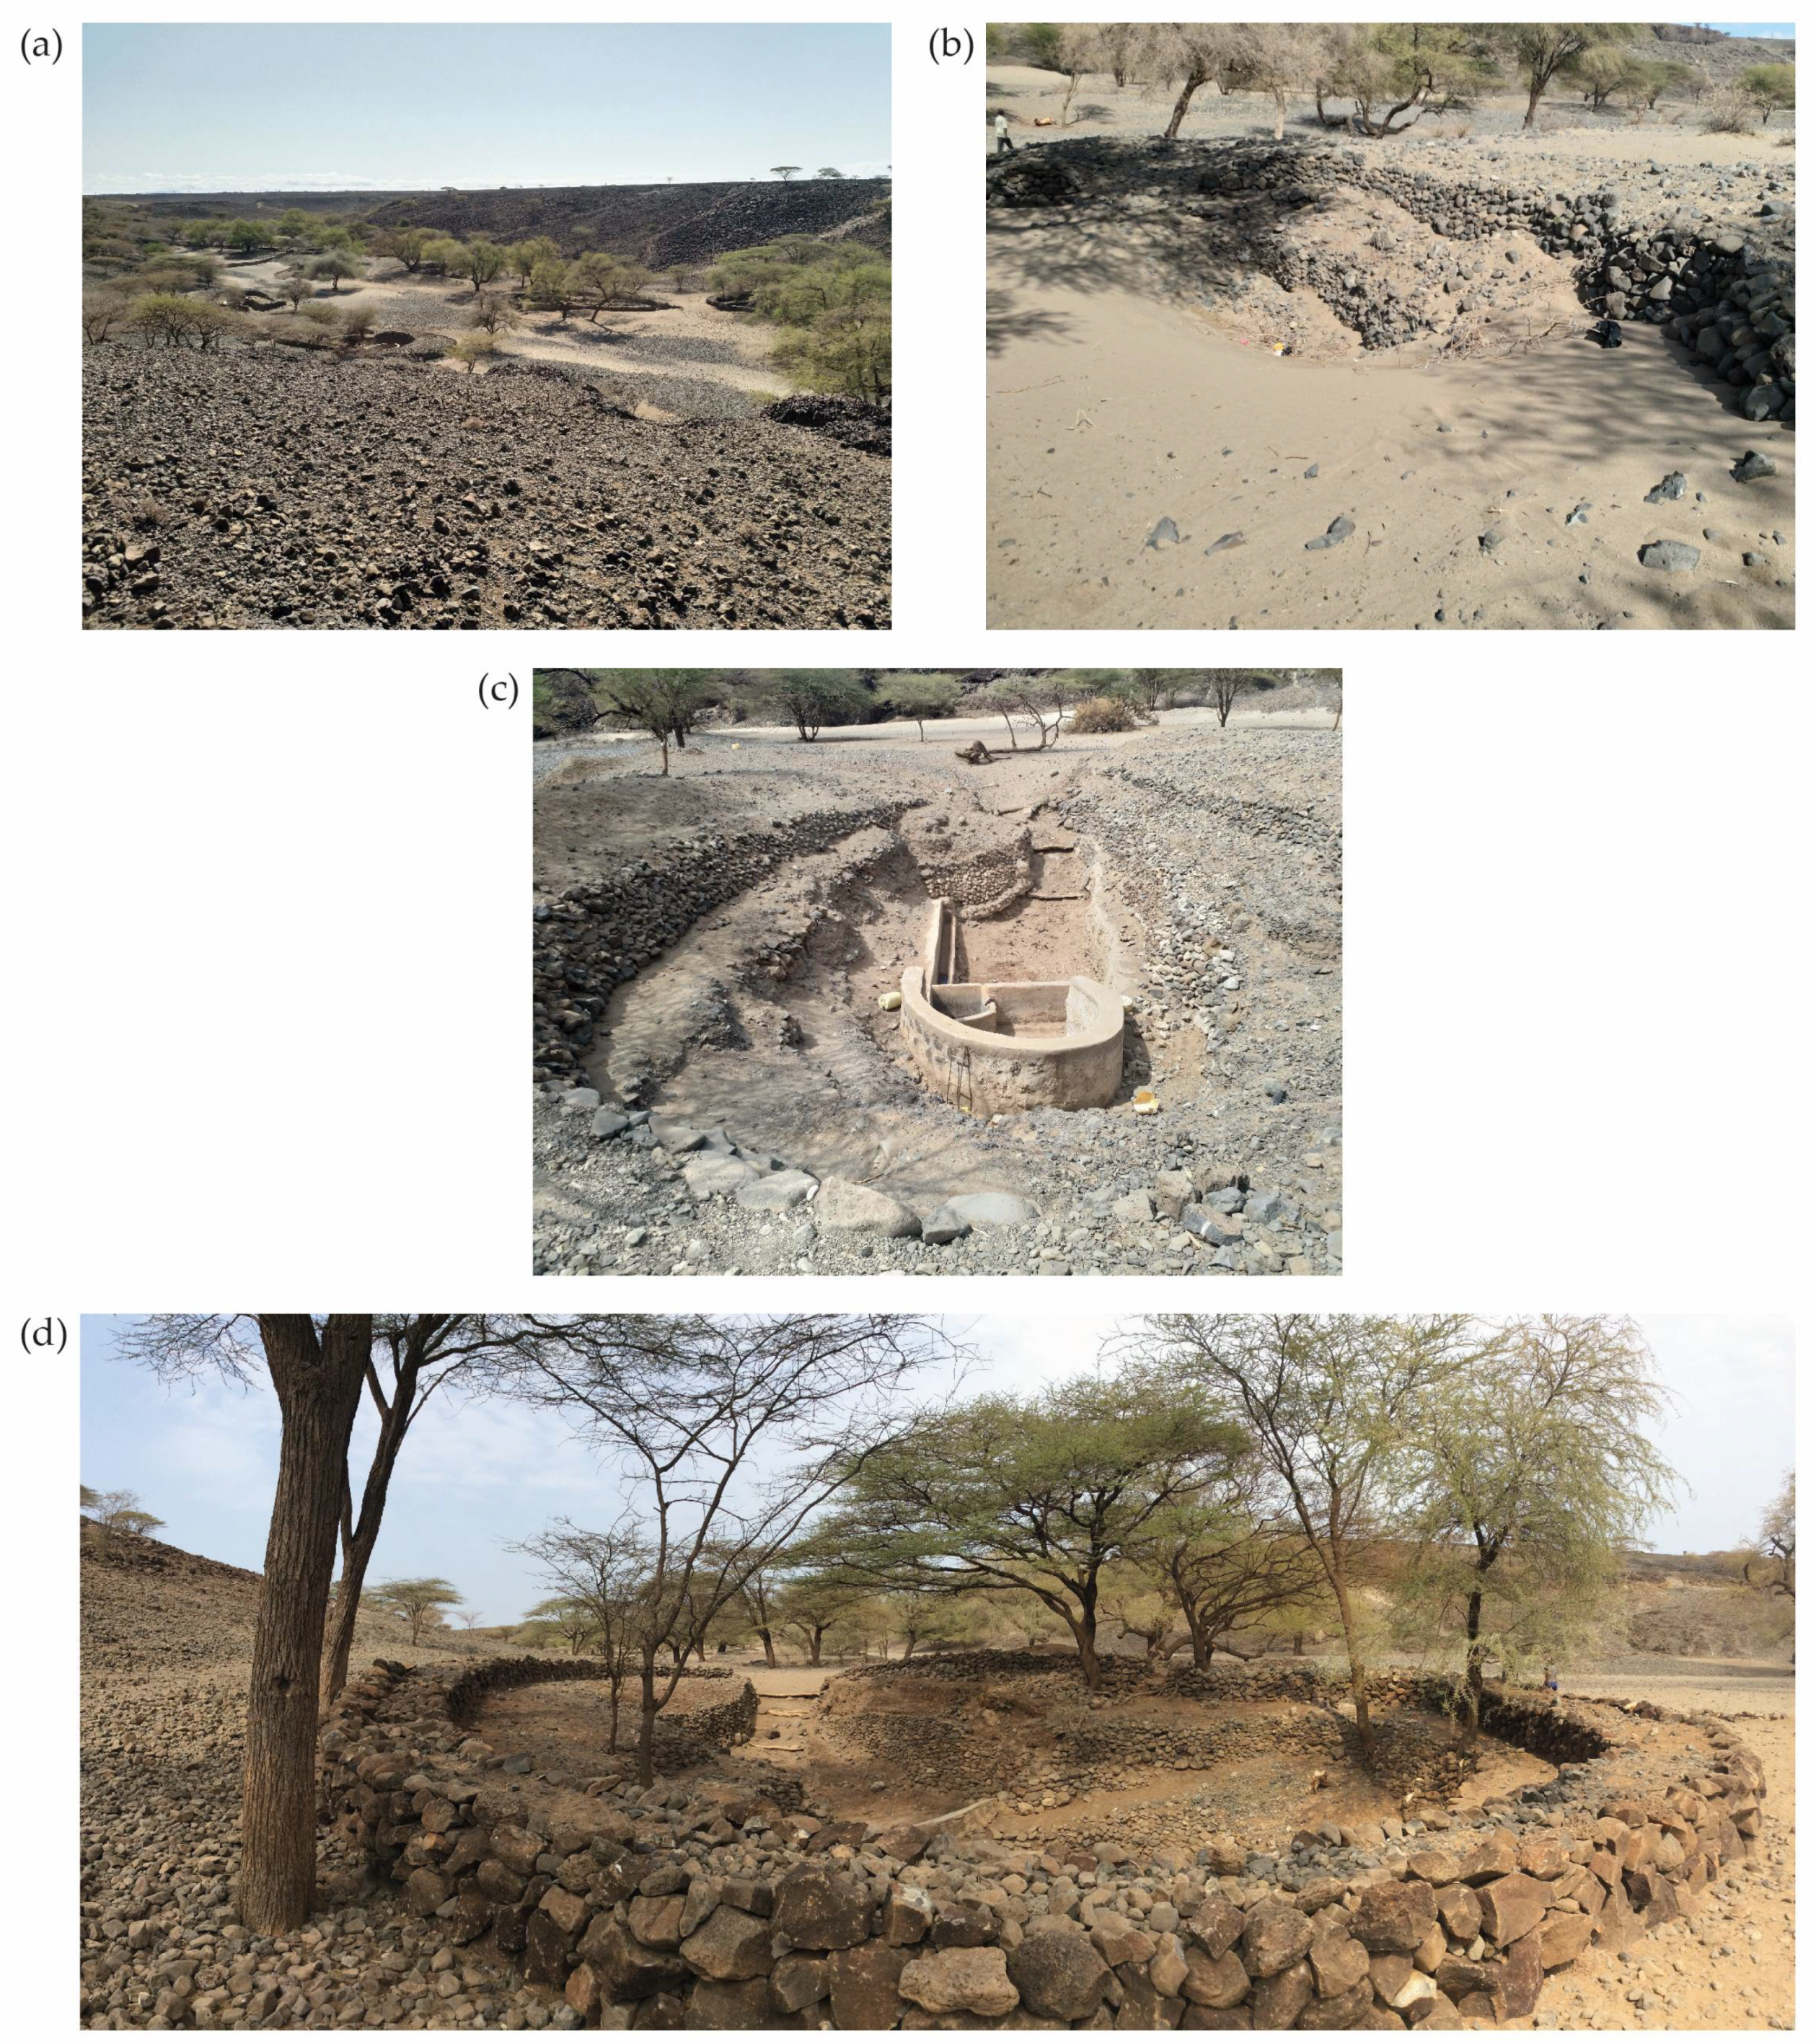
1.1. Traditional Wells in Southern Ethiopia and Northern Kenya

Sophisticated indigenous water management systems have developed in Southern Ethiopia and Northern Kenya to ensure equitable access to critical water resources. Access to these is governed by well-defined customary institutional leadership structures and have given rise to a distinctive form of biocultural heritage. By attributing socio-cultural and sacred values to water, pastoralists have managed to sustain pastoral production in this arid and semi-arid region for centuries. However, these systems, and the wells themselves, are increasingly under threat from climate change and socio-economic development. Increased access to the outside world, urbanisation, population pressure, and commercialisation of natural resources are said to have contributed to the weakening of customary systems including indigenous systems of water governance [29,30]. Conflict over access to water sources has been notable in some areas in recent decades [31], while state-level changes to regulatory frameworks, notably Kenya’s 2002 Water Act, despite opposite intentions, have also weakened water security for some pastoralist communities [32,33]. Importantly, the wells not only supply water to livestock and for human consumption, but also serve as a center for religious and ritual activities and social and political gatherings. As key nodes in highly mobile landscapes, wells also serve as foci for the reproduction of heritage values. To contribute to an assessment of the scale, distribution and intensity of these threats, this study aims to evaluate the land use land cover (LULC) and precipitation changes over the last thirty years in this semi-arid to arid landscape and their association with, and impact on, the preservation of traditional wells.
Well-digging has been attested among many pastoralist groups inhabiting areas of northern Kenya and southern Ethiopia. Examples include the so-called ‘singing wells’ of the Kenyan Gabra [34], and the tula wells constructed by Borana communities in southern Ethiopia (Figure 2). The precise origins and identity of the initial builders of the majority of the wells in the region, regardless of their specific forms, remain uncertain. In Marsabit County (Kenya), local oral traditions attribute the construction of the majority of wells, even extant ones, to ‘Wardai’, who are said to have occupied these areas prior to the arrival of the ancestors of the current inhabitants, who herded cattle, not camels, and who also erected the numerous stone cairns typically found in the vicinity of the wells, with notable clusters around Balesa, Kalacha, Koroni-Korole, Maikona and Molobot [35]. The name ‘Wardai’ may be a contraction of ‘Worra’ meaning people and ‘Daya’ probably the name of an ancestor [36]. Some reports suggest that the Wardai migrated south when they abandoned the area and may be the ancestors of Orma communities (or Warra Dāyā as they are also known) along the Tana River. This southward expansion is dated to the first part of the seventeenth century [37], although radiocarbon dates on human remains excavated from cairns around Kokurmatakore suggest an earlier date for their construction [35]. Borana Gutuu claim to have begun to displace Wardai Oromo from the mid-seventeenth century so as to take control of the key complex of Tulla Saglan (the nine well clusters) in the Dirre region south of the River Dawa, southern Ethiopia [38] vg, while Orma oral traditions assert that they are an offshoot of the Boran pastoralists and claim that their southward migration to their present location on the Tana River was due to famine rather than conflict with the Boran, arriving from the west via the Lorian Swamp at some indeterminate date [39]. Historical research in southern Ethiopia has also determined that the ancient tula well system there has been in operation for over five centuries and continues to serve as the main permanent water source for the Borana [29].
Indigenous hydrological knowledge informs the distribution of the wells, which are not random, and takes into account underground sources, movement of herds and disposal of livestock dung, sanitary conditions and the risk of flooding [40]. In terms of their form, tula wells are constructed using a unique technology, where the well is cut into limestone, and a narrow shaft is created. A staging area where water troughs are filled typically lies between 15 to 25 m below ground surface with the water table a further 10 to 15 m below this staging point. Livestock are brought down to the staging area via ramps of beaten earth where drinking troughs and basins are filled with water hauled up in buckets passed up from lower down via a chain of young men [40].
In Marsabit County, on the Kenyan side of the border, wells tend to be simpler, often comprising simply a shaft excavated to a depth of between 3 to 20 m through superficial deposits and underlying layers of calcrete to reach the water table, with mud-plastered or concrete water troughs and reservoirs arranged around the well opening, used for watering livestock. In some localities, the wells are deeper and have surrounding dry-stone walls and sloping walkways leading below ground leading to an open area with water troughs, so as to reduce the height from which water has to be drawn manually (Figure 3).
Despite these differences in form and mode of construction, in both localities, diverse customary rules both guide and govern routine maintenance of the different structural elements of the wells, the cleaning and repair of water troughs and the areas around the wells, and the priorities and sequence of access to the well water. Combined, these serve to ensure that all sections of the community have access to water through the sharing of responsibilities for managing and maintaining the resource. The wells thus simultaneously exemplify sophisticated indigenous engineering skills alongside an equitable system of water governance that in combination have ensured their sustainable use for centuries creating a unique form of living biocultural heritage.
Although historical and cultural values continue to be attached to the tula wells, and their practical utility as a source of water is still managed in a manner that ensures equitable access, most of the wells in the Borana region are no longer active and have been abandoned or fallen into disuse in recent decades. In the early 2000s, for example, out of 321 wells counted, only 25% were still in use and 75% were disused or under re-excavation [29,41]. Informants in the region cite natural and anthropogenic factors for the disuse of wells over time, including heavy rainfall, flooding, decline in the water table, disputes of ownership, and structural and labour difficulties in reinstating wells. Oral historians in the Borana region, for example, attribute well collapse to excessive rainfall, citing flooding between 1800–1808 and 1872–1880 (informants in Borana use eight-year blocks of time corresponding to the abba gada in power to order and identify the chronology of different key events in their history), and flooding between 1976–1984 that saw the collapse of the Dubluq well cluster [41]. Drought and other natural disasters have also contributed to the collapse of wells through their impacts on the livestock and human populations.
Tula and related pastoralist wells are not only water sources but also significant points in the wider meshwork of human habitation of these lands, and they can acquire symbolic importance through ritual performances, religious worship and political gatherings [40,42]. In southern Ethiopia, wells are also connected conceptually to sustaining human and livestock fertility, the continuity of lineages, and with peace [40]. As nodes within highly mobile landscapes and important components of indigenous systems of natural resources management subject to locally developed regulatory systems of governance, and imbued with historical and cultural values, these hand-dug wells form a key component of the region’s pastoralist biocultural heritage. In a mobile pastoralist context, such biocultural heritage is also in a constant state of re-constitution through practice at a combination of specific nodes and along particular paths within the landscape. It is at these nodes and along these paths that cultural valuation of the importance of this biocultural heritage is given tangible (e.g., monument building, route marking, place making, well construction) and/or intangible (e.g., through songs, myths, histories, dance) expression, with the latter often oriented to re-iterating a cultural geography of ‘being in the land’, i.e., of dignified belonging and the ontological security of shared identity. However, while the importance of biocultural heritage is increasingly recognised, and calls to embed biocultural heritage protection in landscape planning and conservation have intensified [43,44,45,46], there have been remarkably few efforts to use remote sensing technologies to either monitor the health of such systems, or to trace their transformation through time as a direct consequence of land use and land cover (LULC) changes. To demonstrate the potential of such approaches, this paper provides an assessment of the main directions of LULC change across southern Ethiopia and northern Kenya over the last forty years and the threats such changes now pose to the long-term conservation of indigenous wells and the heritage services they provide for the diverse pastoralist communities, notably Borana, Gabra, Rendille and Samburu, that have occupied this landscape for centuries.

1.2. Previous Land Use/Land Cover Change Studies of the Study Area

There have been relatively few previous LULC satellite imagery analyses of the Borana and Marsabit regions, and the area has not been covered as consistently as other parts of Ethiopia and Kenya, or as extensively as other areas of the globe. In the Borana region, the rangelands have been analysed mainly for the purpose of pastoralist land management and assessing changes in ecosystems. In Kenya, research on LULC has focused primarily on the Marsabit area, in the south of our study region, and as far as we are aware, there is no published previous LULC research related to the El Hadi and Balasa area in Kenya (see Figure 3 for locations). Previous LULC research in both areas relied mainly on Landsat imagery, although in some cases aerial photographs were also used. Virtually all previous studies have been concerned with how LULC has impacted local livelihood and settlement strategies, and how such changes relate to wider environmental management issues and responses to climate change. A single study, for an MSc dissertation, explores the potential use of remote sensing for heritage management [47].
Research by [48], for example, employed a combination of aerial photographs and Landsat imagery for the Borana region to assess land cover dynamics between 1967, 1987, and 2002. The authors found that there had been a significant decrease in grassland cover since the 1960s, coupled with a significant increase in cultivated, settlement, and bare land areas. This stimulated changes in land use patterns, with increased cultivation of land by local communities to generate additional income, and the rearing of more drought resistant livestock [48]. In another studyAbate and Angassa [49] demonstrated through analysis of Landsat imagery that the Borana rangelands in southern Ethiopia experienced extensive and escalating rates of LULC changes between 1987 and 2003, particularly in the increase in bush cover, settlement and cultivated land. They linked their findings with the views of Borana pastoralists who described the main elements of landscape change as attributable to climate related factors such as a rise in average daily temperature, recurrent drought, and increased rainfall variability. The most recent published LULC analysis of Landsat imagery covering the Borana region also echoed the findings of previous studies, whereby cultivated and built-up areas have increased, as well as bare lands, with most changes attributed to population increase, drought, inappropriate government policy, and mismanagement of the rangelands [41,50].
Previous LULC studies of the Marsabit region have focused principally on the forested volcanic area south of Marsabit townMaina and Imwati [51] used Landsat imagery to demonstrate the changes in LULC in this area and found that closed and open forest, grassland, and wetlands increased from 1990 to 2000 but had reduced greatly by 2010. Shrub land gradually increased between 1990 and 2010, while bare land decreased throughout all years. Anthropogenic and environmental causes were identified as the drivers of change, for changes to closed and open forest, firewood collection, logging, and livestock incursion were identified along with climate change and water abstraction [51]. Grassland was impacted by livestock grazing and dry periods, and loss of wetlands was attributed to drought and climate change. A similar study indicates that land-use patterns have been impacted by anthropogenic processes aimed at improving livelihoods [52]. Agriculture/settlement and grasslands extended to areas previously covered by open forest, particularly close to Marsabit town. The drivers for change mirror previous studies which cite illegal logging, livestock incursion, firewood collection and illegal settlements [52]. It is also argued by Hosonuma et al. [53] and Lindquist et al. [54] that deforestation on Mount Marsabit has been anthropogenically driven rather than the outcome of climate change or natural processes. In contrast to these large-scale studies, Kihonge’s study [47] was aimed at documenting sacred, natural sites such as sacred groves in the vicinity of Marsabit associated with Gabra communities, and to determine whether such locations were more or less prone to tree loss during periods of extended drought. The study demonstrated that sacred groves appear to suffer less tree loss than other wooded and forested areas and for this reason are important islands of biodiversity, underlining their significance as a key component of the locality’s biocultural heritage.

2. Material and Methods
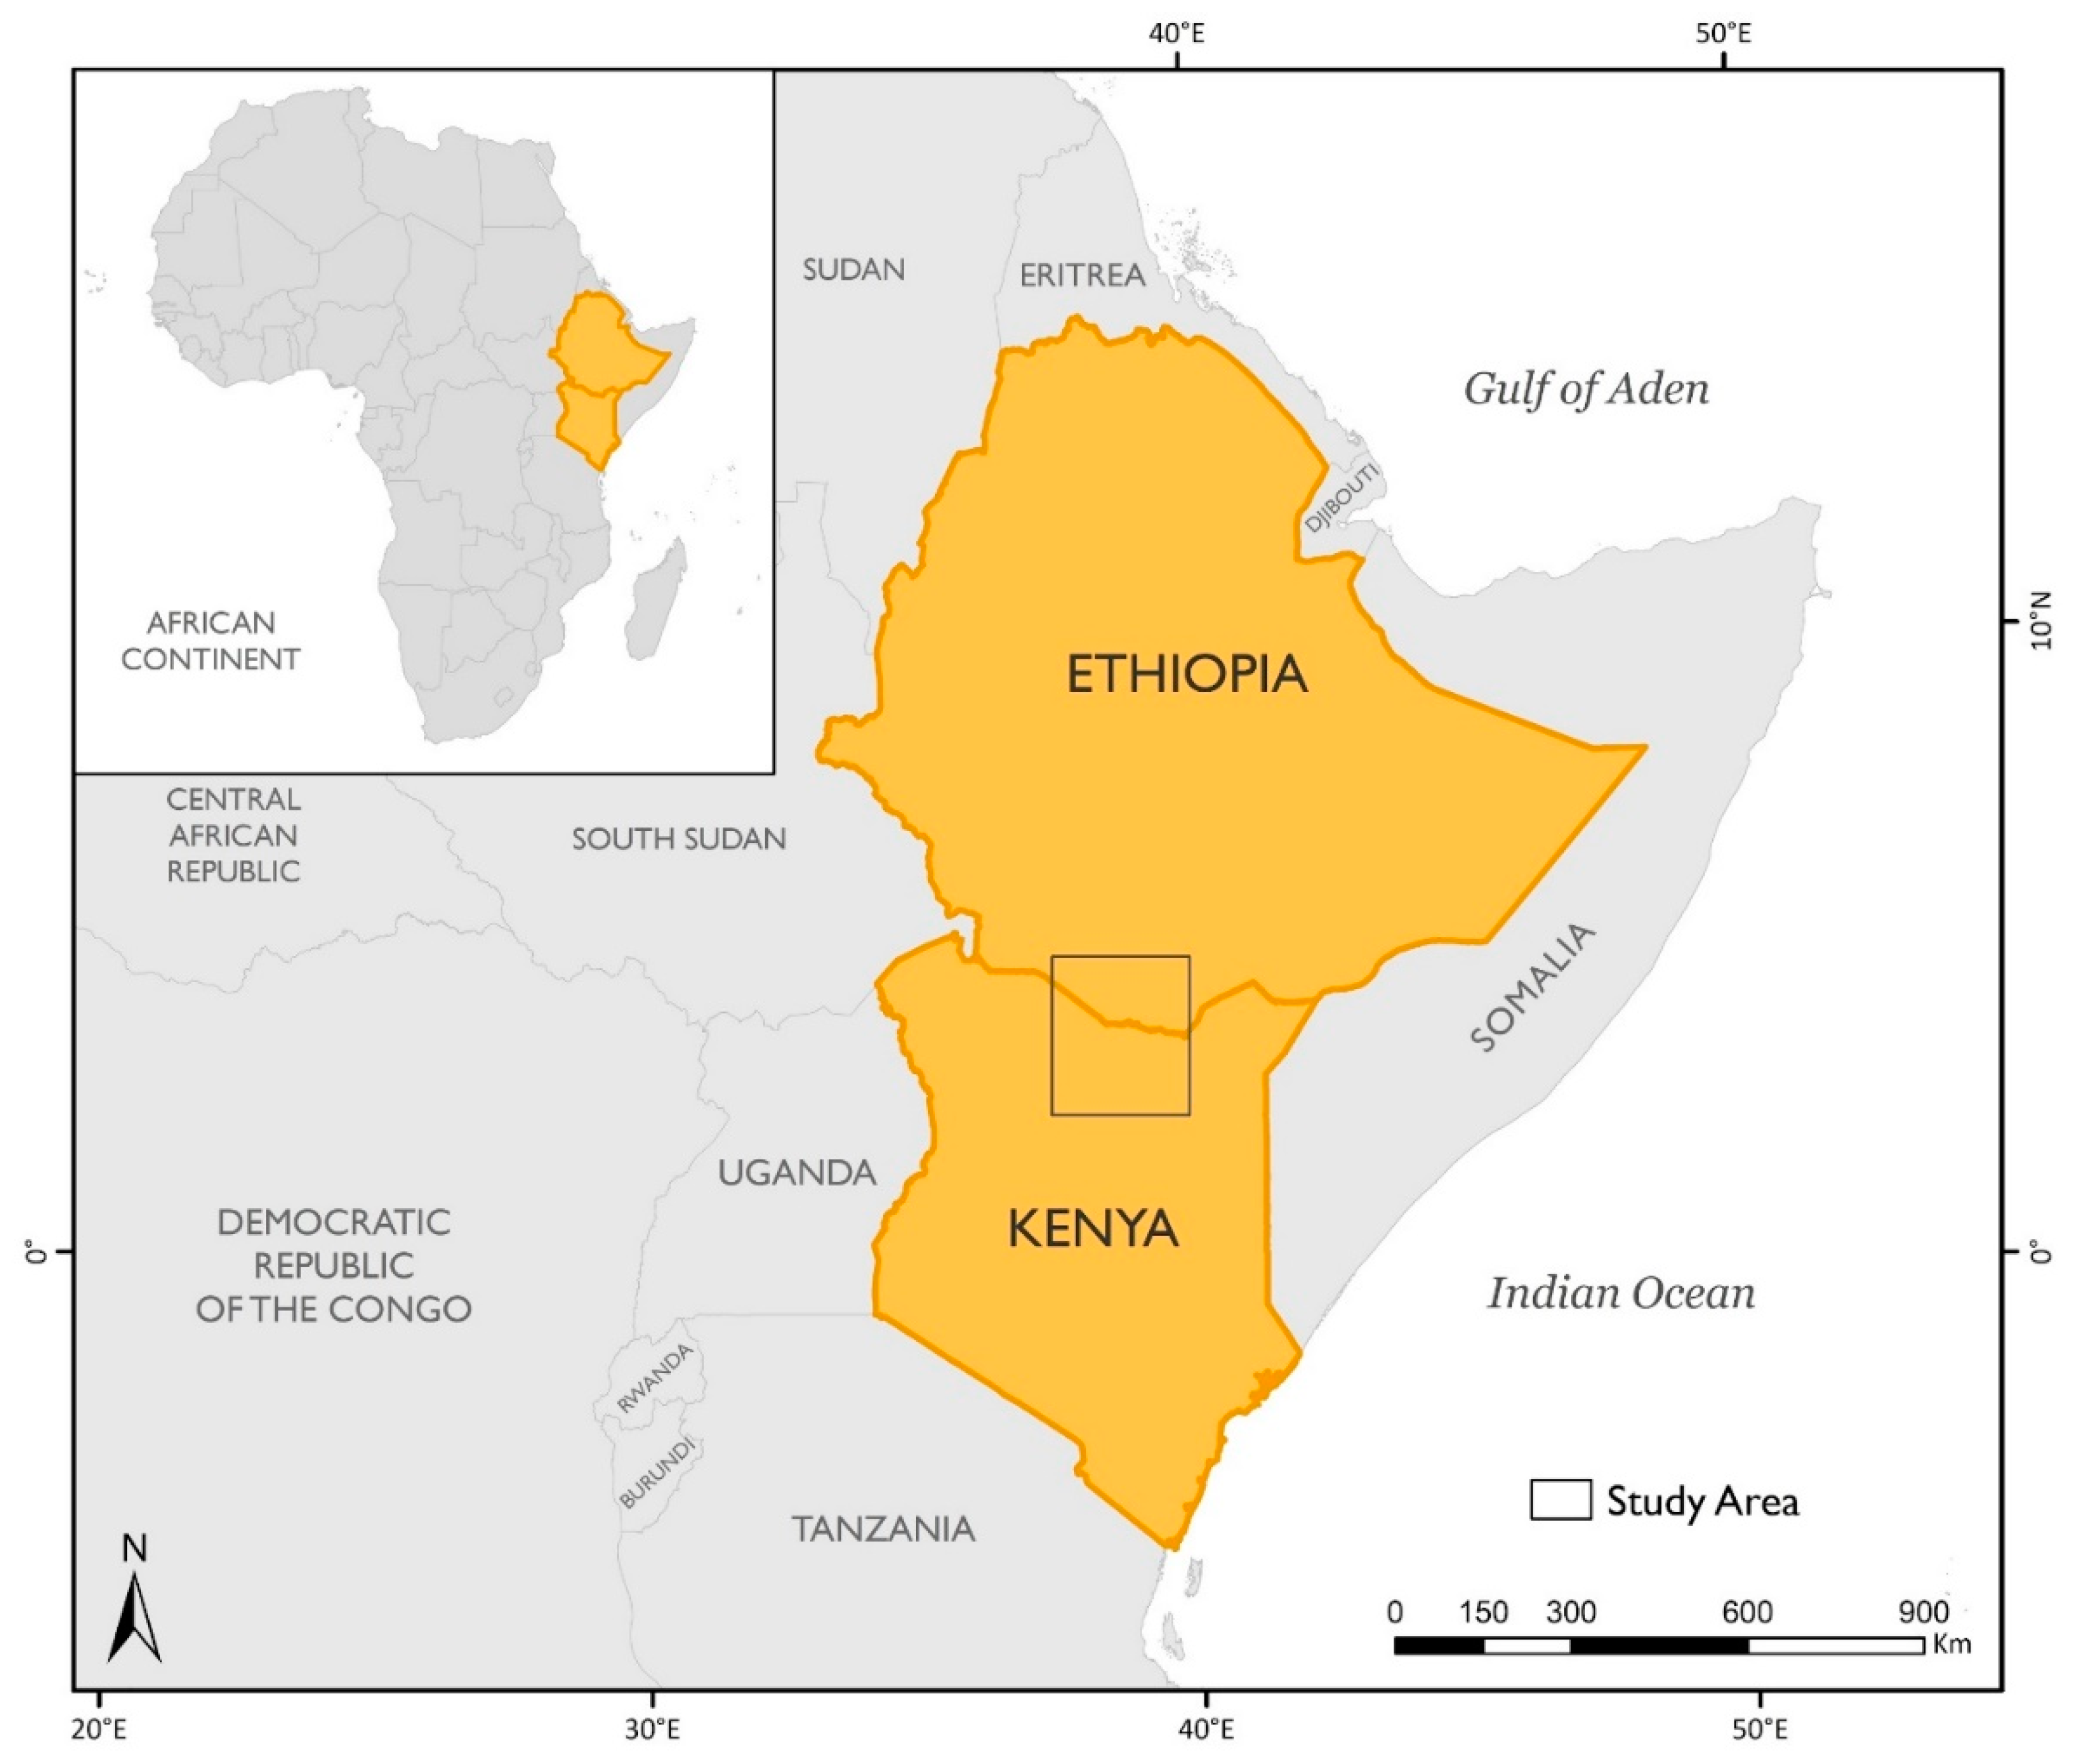
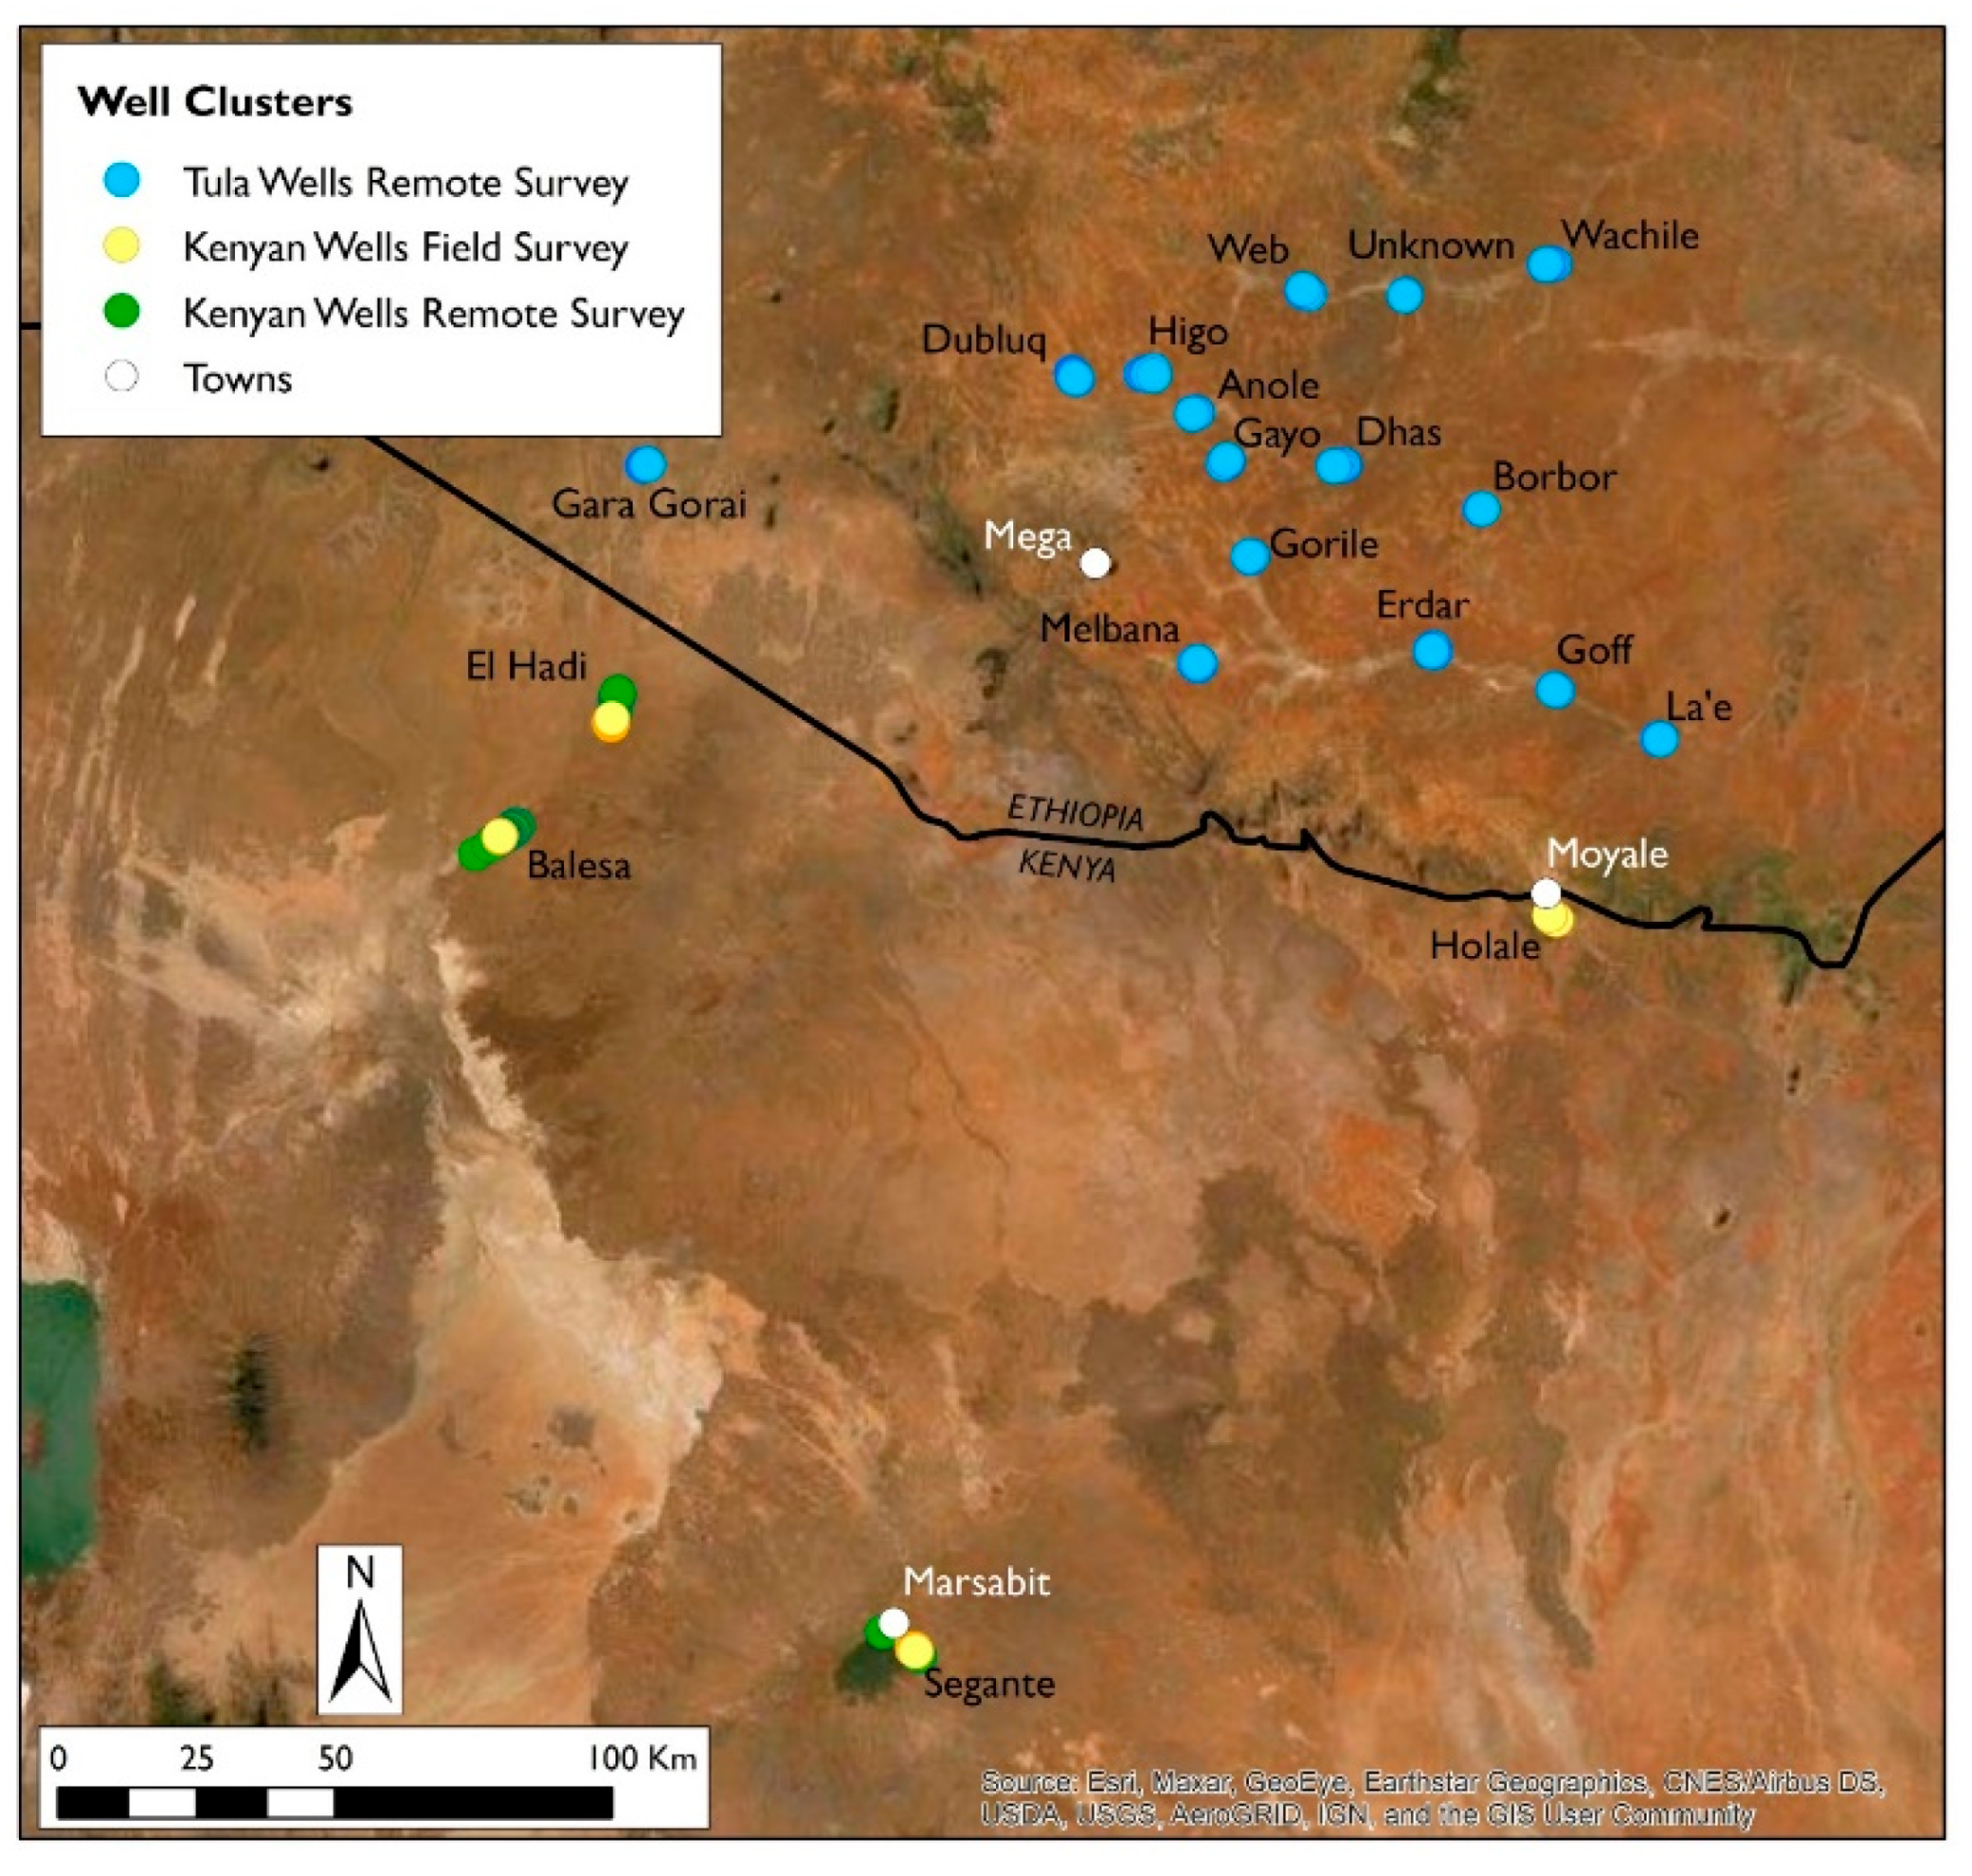
2.1. Study Area

The study area lies in Southern Ethiopia (Borana) and Northern Kenya (Marsabit), between latitudes 02°10′N and 04°40′N and longitudes 37°13′E and 39°31′E, covering an extent of ~77,000 km2 (Figure 4). The Borana region of southern Ethiopia is located in Oromia Regional State while the northern Kenya area is located within Marsabit County. Both are characterised as arid to semi-arid landscapes (ASALs), with land surface temperatures varying from 40 °C during daytime and 20 °C at night. Across the region, rainfall occurs in a bimodal pattern, with averages varying between 200 mm and 750 mm, with large coefficients of variation fluctuating from 44% to 65% [55,56] (Figure 5). The area is also prone to extreme climatic events, which in recent decades have included droughts in 1992/1993, 1996/1997, and 1999/2000 and significant flooding which last occurred in 1997/1998 [57,58]. The livelihoods of the populations in this study area are mainly reliant on livestock herding, with varying preferences for cattle, camel or small stock dependent on environmental and market conditions and cultural preferences [49] and hand-dug wells are a critical resource given the scarcity of surface water and low reliability of more recently excavated boreholes.

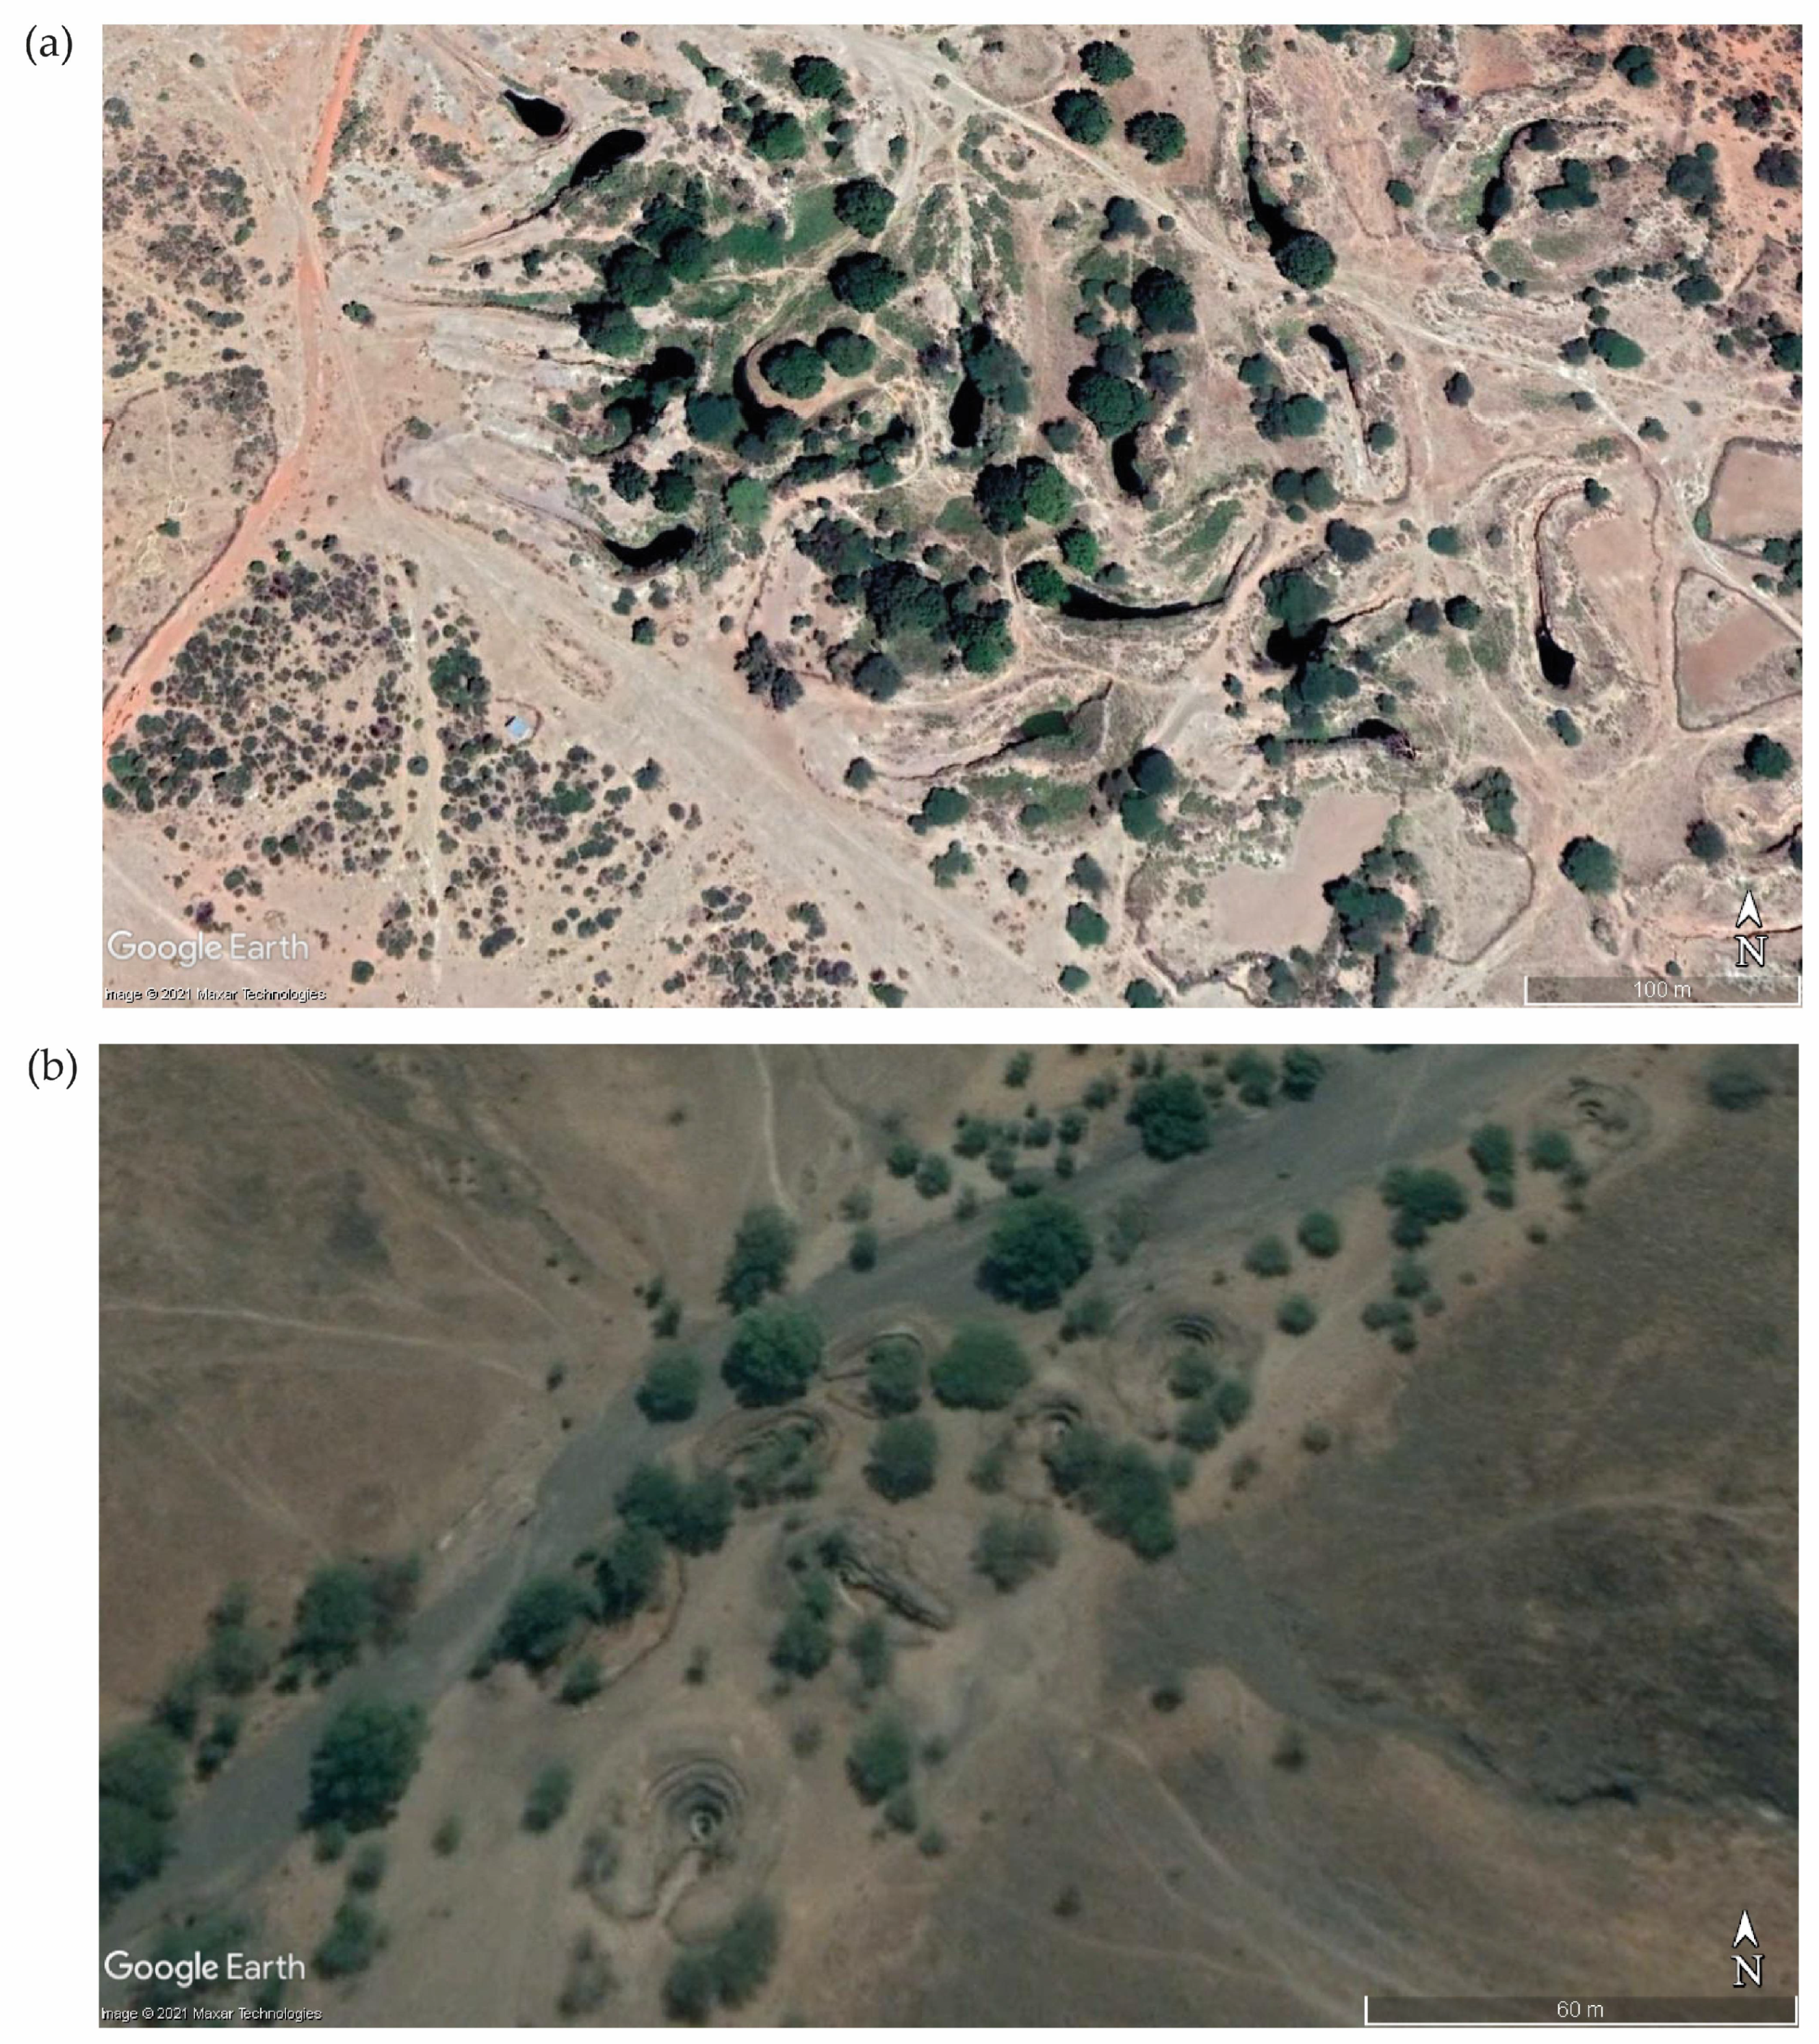
2.2. Mapping the Traditional Wells

The wells in Ethiopia (known as tula wells) were initially identified during fieldwork undertaken by Waktole Tiki [30,40,41]. Working from these published maps of their distribution, the image overlay function was used in Google Earth to approximate the wells’ positions, then manual identification of the wells was made using visual inspection. The wells in Kenya were initially located by field survey and georeferenced using differential GPS by a team from the British Institute in Eastern Africa led by Freda M’Mbogori in 2019. This survey was subsequently extended remotely, using the Google Earth Pro platform. Nineteen clusters of traditional wells were identified in the study area (four clusters with n = 235 wells in Marsabit region, and fifteen clusters with n = 327 wells in Borana region) (Figure 4) and digitised from high resolution imagery within the Google Earth Pro platform and ground survey verification exercises.

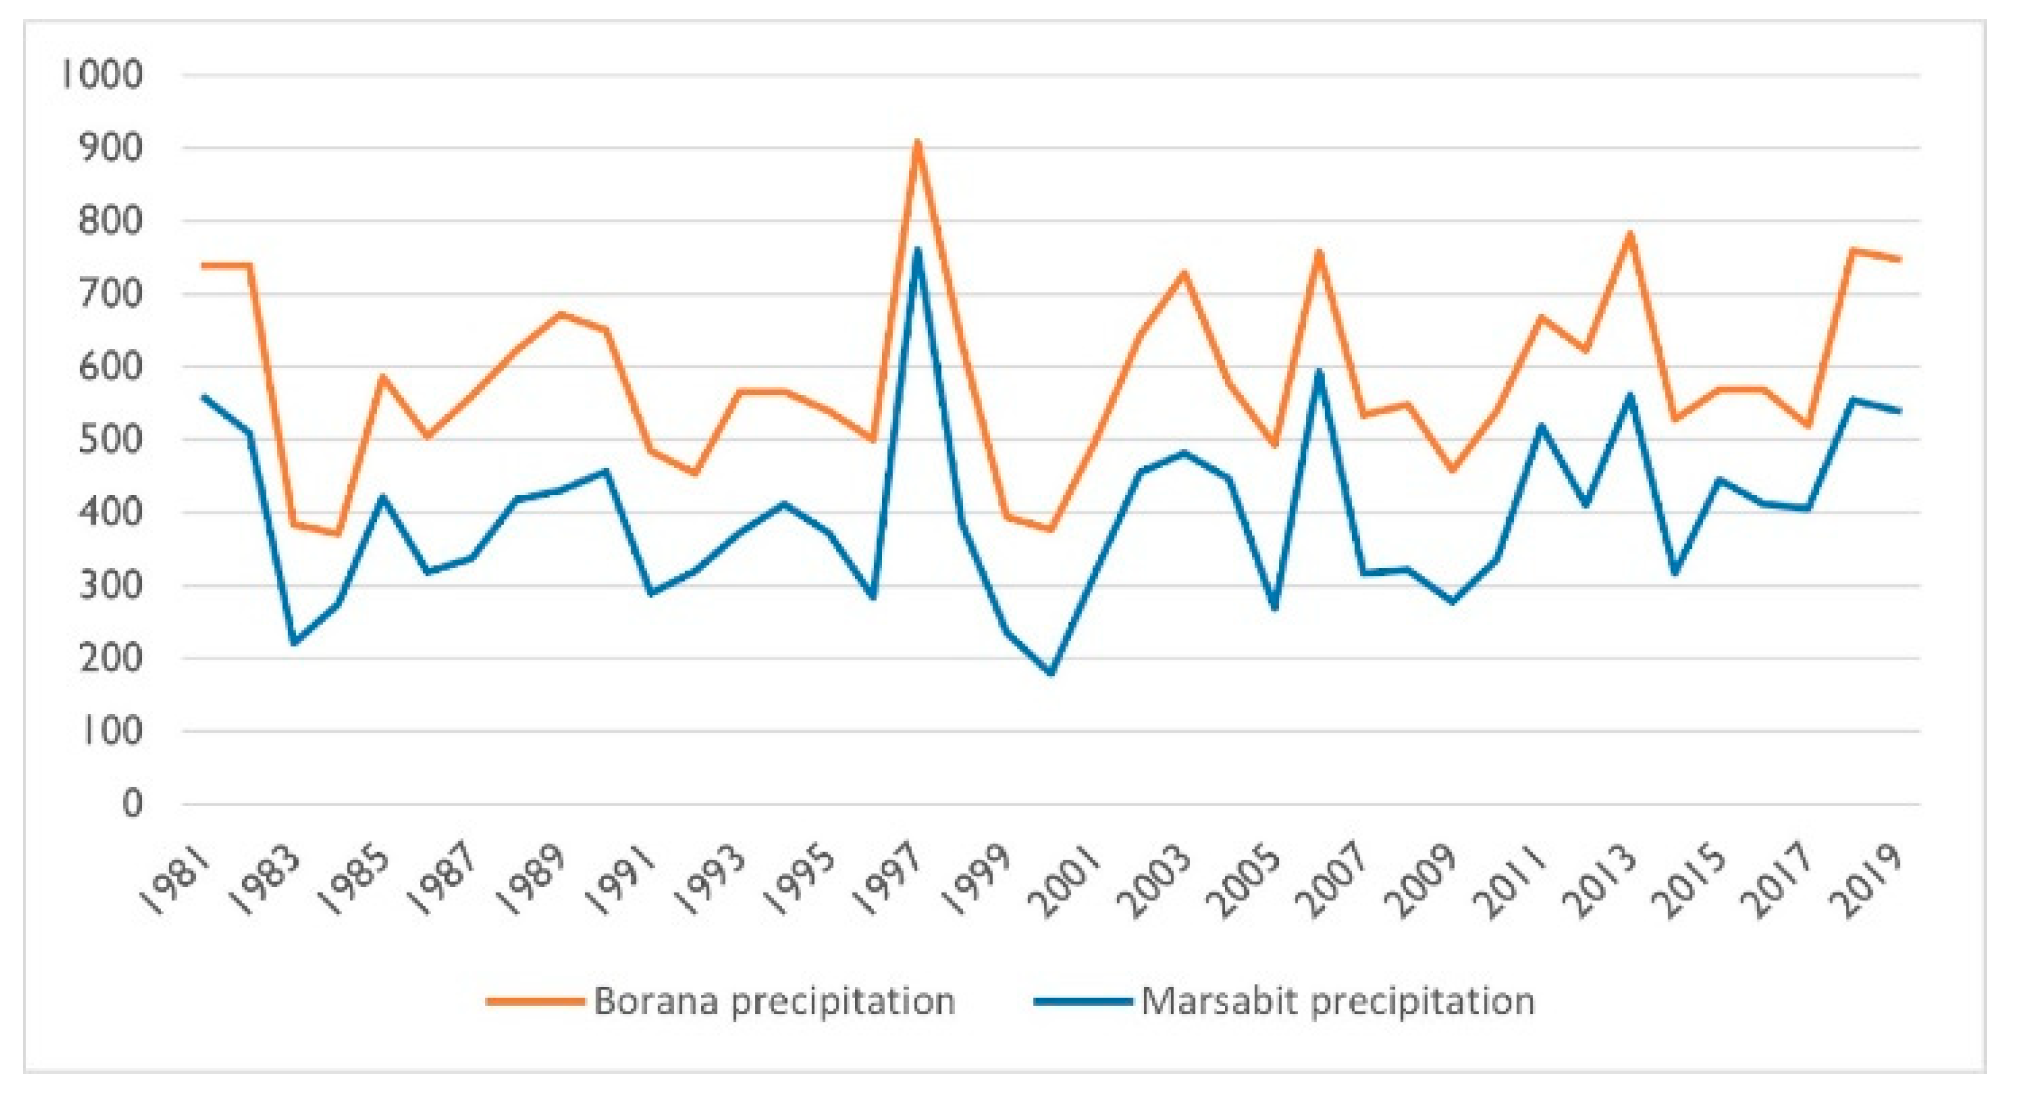
2.3. Earth Observation and Precipitation Data

Landsat 5 Thematic Mapper™, Landsat 7 Enhanced Thematic Mapper (ETM), and Landsat 8 Operational Land imager (OLI) surface reflectance images of the study area were evaluated and accessed from the Google Earth Engine (GEE) image library for selected years. All the Landsat products used in this study were Tier 1 surface reflectance (bottom-of–atmosphere) products which have been atmospherically corrected and suitable for time-series analysis because the data can be used without needing sensor-specific geometric or radiometric adjustments [59]. ‘Improvements to the geometric accuracy and interoperability of all Landsat products has been carried out by implementing the Sentinel 2 Global Reference Image (GRI), improved elevation dataset using NASADEM and other sources of Digital Elevation Model (DEM) for terrain correction, improvements to the precision correction process for Enhanced Thematic Mapper Plus (ETM+) and Thematic Map™ (TM) sensors’ [59]. The study years were selected based on precipitation variability, computed from the Climate Hazards Center Infrared Precipitation with Stations (CHIRPS) precipitation data set [60], whereby years with extreme events (years 2000 and 2010) were avoided (Figure 5). Hence, the years 1990, 2001, 2011 and 2020 were selected for the analysis. To remove cloud-contaminated pixels for each of the selected Landsat images, a cloud masking algorithm was utilised by using quality assessment (QA) bands To minimise seasonal variations, annual composites for each of the selected years were thereafter produced by taking the median value for each year by calculating the median of all cloud-free pixels for each target year. Furthermore, a normalised difference vegetation index (NDVI) was computed for each of the selected years by taking the median value for each year, and the greenest pixel generated from the computed NDVI values.

2.4. Reference Data Collection

Eight classes that were representative of the study area were derived from visual inspection of freely available high spatial resolution imagery on the Google Earth Pro platform (July 2021), utilising the time-lapse feature therein to access past imagery for the 1990, 2001 and 2011 epochs. The classes identified were: bare land, closed woody vegetation, open woody vegetation, grasslands, shrub lands, croplands, urban/settlement and waterbodies. The croplands class was split into ‘cropland-on’ and ‘cropland-off’ categories so as to map ‘in or out of the growing season’ crops, but were thereafter merged after classification into one ‘cropland’ class. We utilised a random sampling approach to collect the training signature reference data across the area of interest, whereby n = 30 polygons were collected for each training class in each year. A total of n = 240 polygons were therefore collected for each year, and hence n = 960 total polygons were selected as training samples. The reference training classes were spread randomly across the study area to enable the collection of robust and representative training and validation datasets. The collected reference data were distributed into two parts within the GEE script as a training set (70% = 672 polygons) and a validation set (30% = 288 polygons) following [61].

2.5. Random Forest Classification, Accuracy Assessment and Change Detection

Six Landsat spectral bands and an NDVI band from each of the four selected epochs were extracted to be used as covariates in the classification model together with the training and validation data. The Random Forest (RF) decision tree classifier [62] was performed to map and predict the eight classes in the GEE environment. RF is an efficient, flexible, and powerful non-parametric machine learning algorithm that is robust against overfitting and outliers and can handle thousands of input variables [62,63]. Furthermore, RF mainly requires setting of only two parameters (i.e., the Mtry and Ntree), making it a very straightforward classification algorithm to use. The Mtry are the randomly selected number of variables used to split each decision tree in the forest at every node, while the Ntree is the number of decision trees in the forest. In a classification application, each decision tree votes for a class membership, and the final outcome is determined by the maximum votes of the decision trees [62,64]. In our study, a default value of Ntree = 500 was used which has demonstrated its suitability for stabilising the internal classification error [64]. Additionally, the default Mtry value, which is the square root of the number of variables, was used. To produce final LULC layers across the study area from 1990–2020, the covariate bands together with the reference data and the RF algorithm were executed. Classification accuracy was thereafter assessed for all LULC maps using the validation dataset (30%). Classification confusion metrics (i.e., overall (OA), user’s (UA) and producer’s (PA) accuracies and kappa coefficient) were derived and utilised as criteria for map accuracy assessments. Afterwards, the (3 × 3) majority filter was applied to the classified maps to eliminate the effect of noise in the classifications. The majority filter is a spatial filter based on the majority rule, whereby a majority of cells must have the same value and be contiguous, and is applied inside a user-defined moving window for reducing noise effects in classified maps [65]. Subsequently, land cover changes in the area that occurred from 1990–2001, 2001–2011, and 2011–2020 were calculated using image differencing techniques [66]. All of the analysis was performed in the GEE platform, except for the change detection which was performed in the QGIS v 3.16 platform.

2.6. Deriving Time-Series Fragmentation Indices within Traditional Well Clusters

The Shannon Diversity Index (SHDI) fragmentation index was extracted from each of the classified land cover maps. SHDI measures the number of landscape elements, their proportional changes, and the abundance of landscape types [67] and was selected based on recommendations that simpler indices like the SHDI are preferable when detecting landscape diversity [68]. This fragmentation metric was derived to quantify changes in the landscape structure across the selected years. Landscape fragmentation metrics generally quantify spatial characteristics of the landscape at the patch level (spatial characteristics of individual patches), class level (clusters of similar types of patches e.g., forest, settlement), or landscape-level metrics (broader landscape heterogeneity metrics) [69]. The Landscape Ecology Statistics (LecoS) v 3.0.0 QGIS plugin which is based on the FRAGSTATS tool [67] was selected for this process since it calculates fragmentation metrics at the individual class (several patches of the same class) and landscape level [67]. A 15 km buffer zone around each well cluster was selected for the fragmentation analysis following Tiki et al. [40], given customary proscriptions on permanent settlement within this, and conventional designation of settlement zones known as laaf seeraa ardaa located approximately 2–4 h walk from the wells, i.e., c. 8–15 km.

3. Results

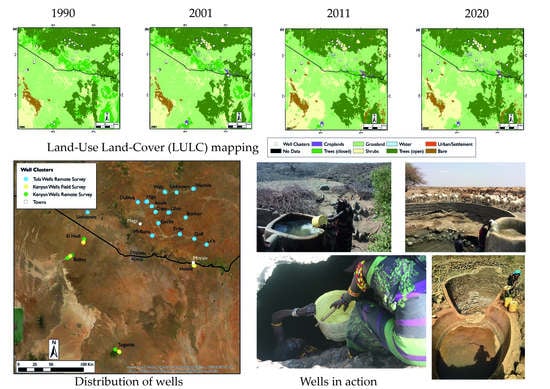
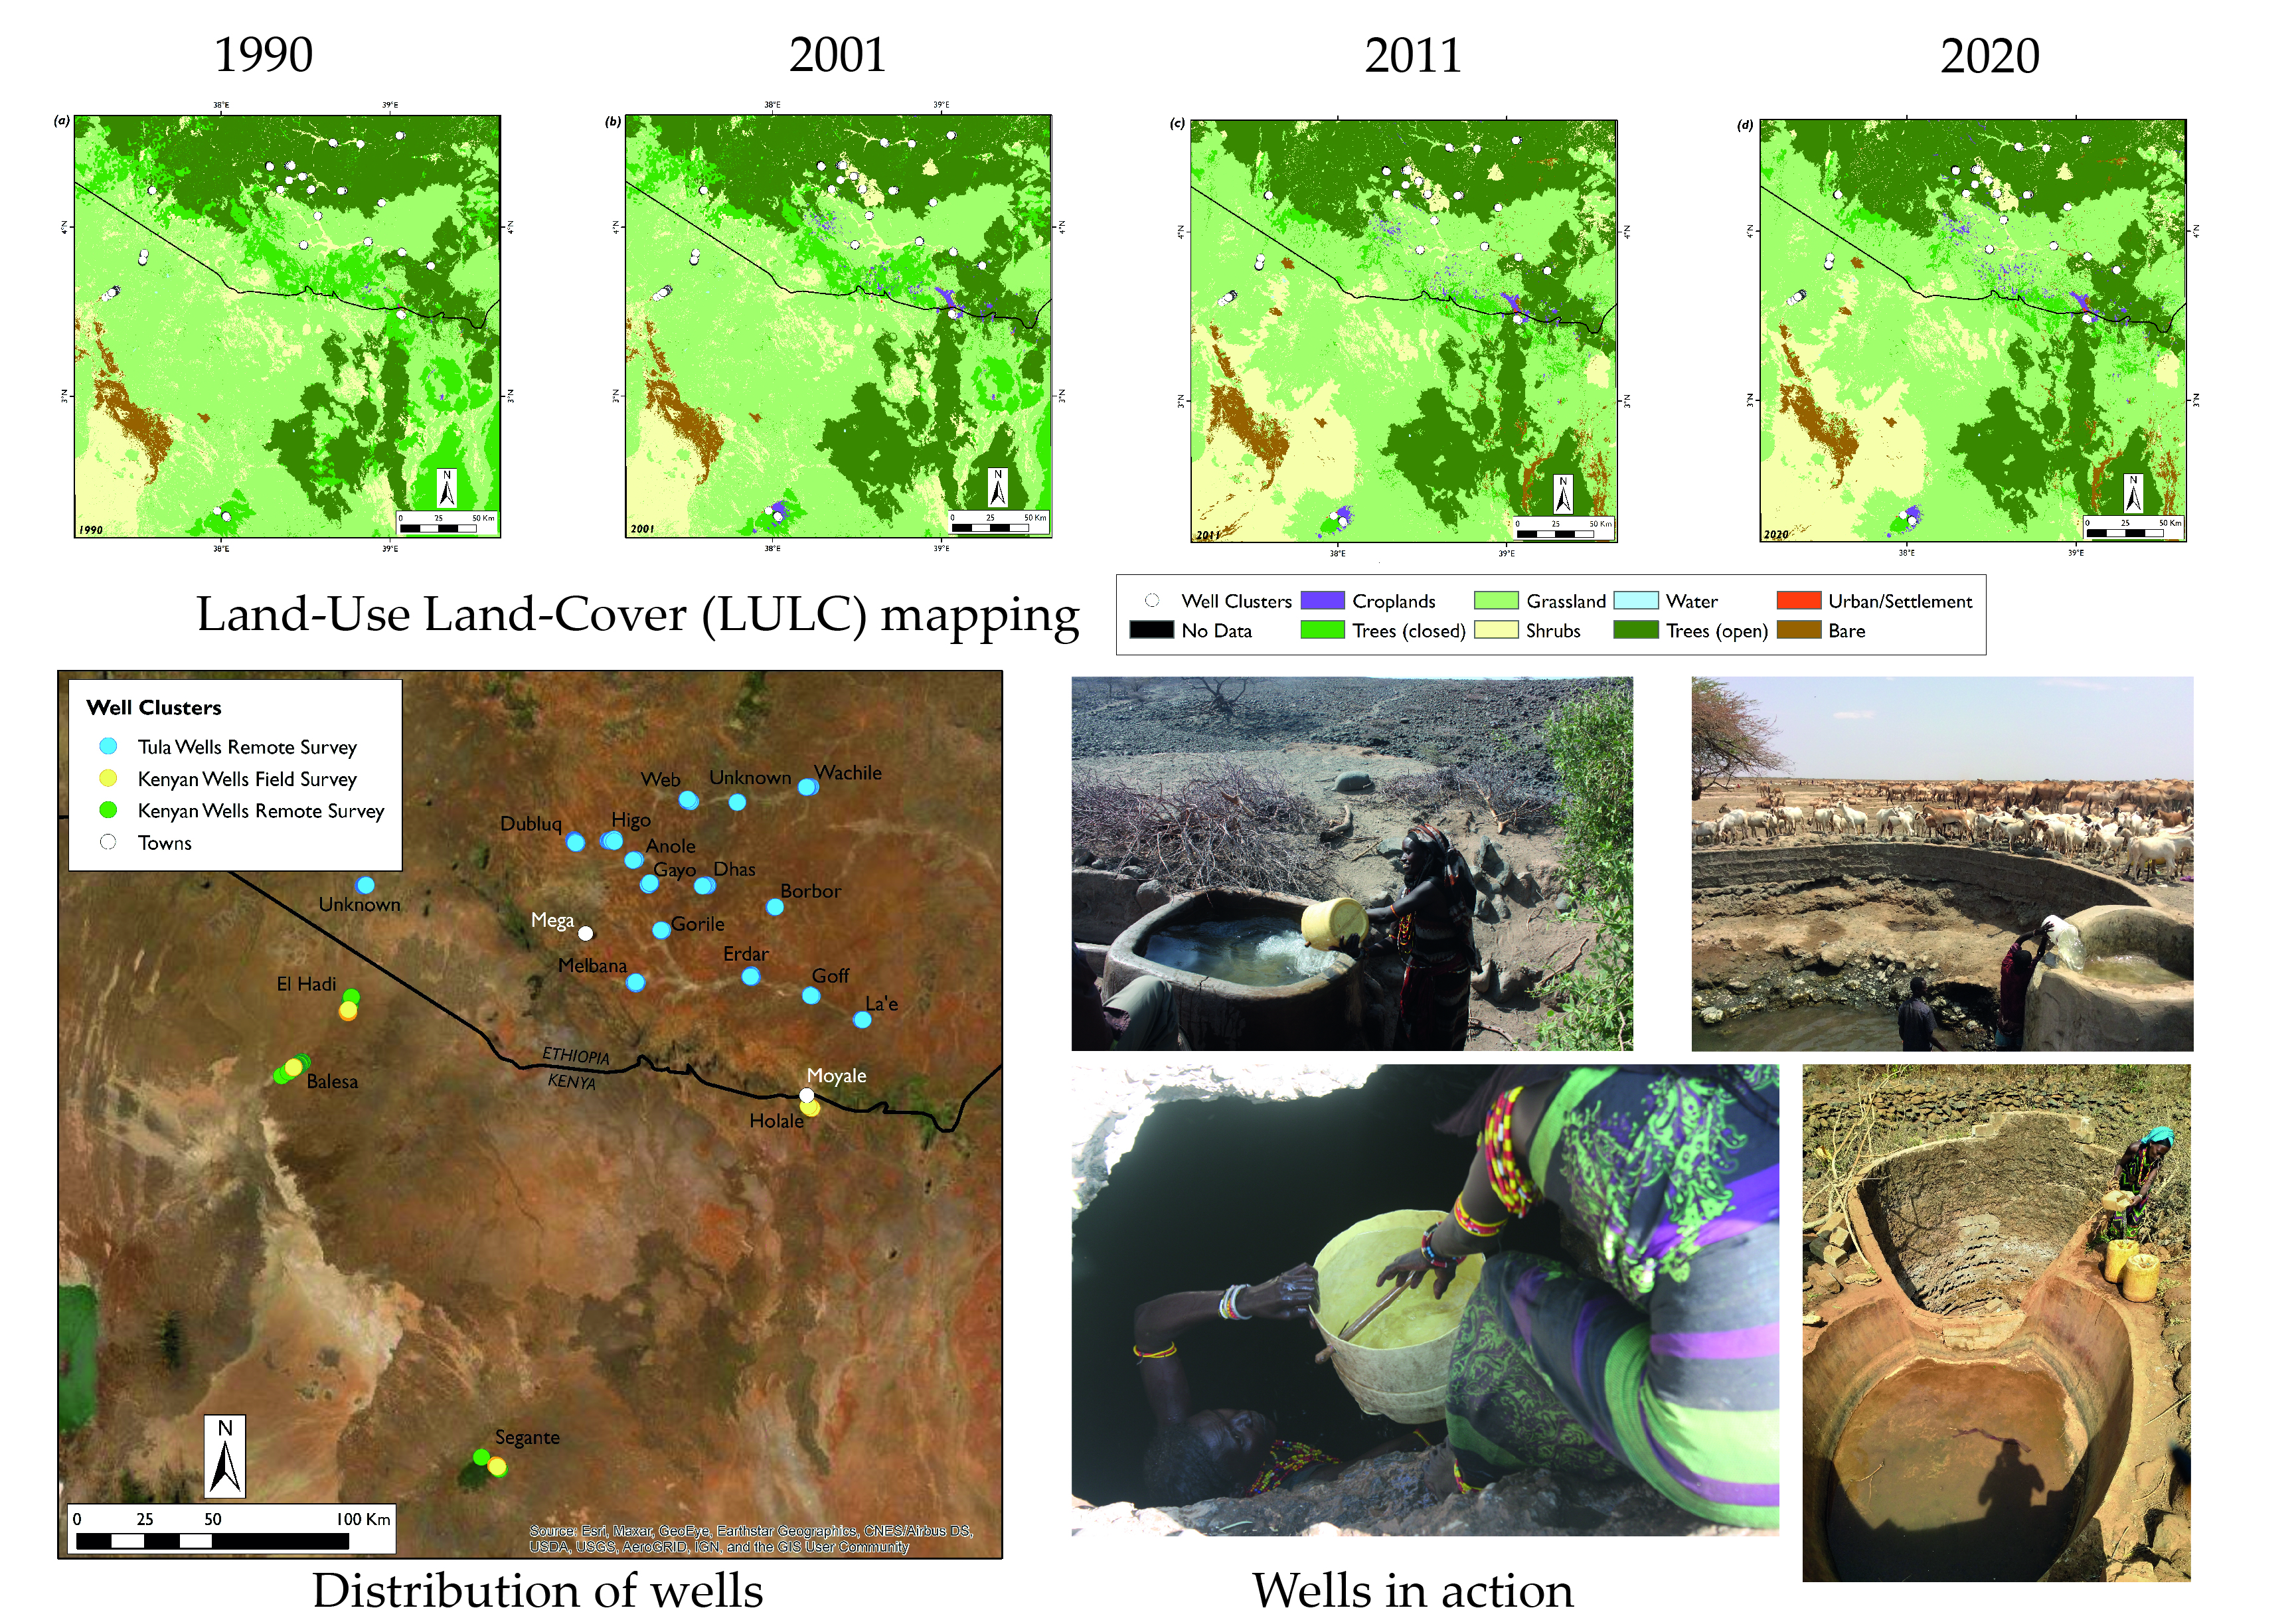
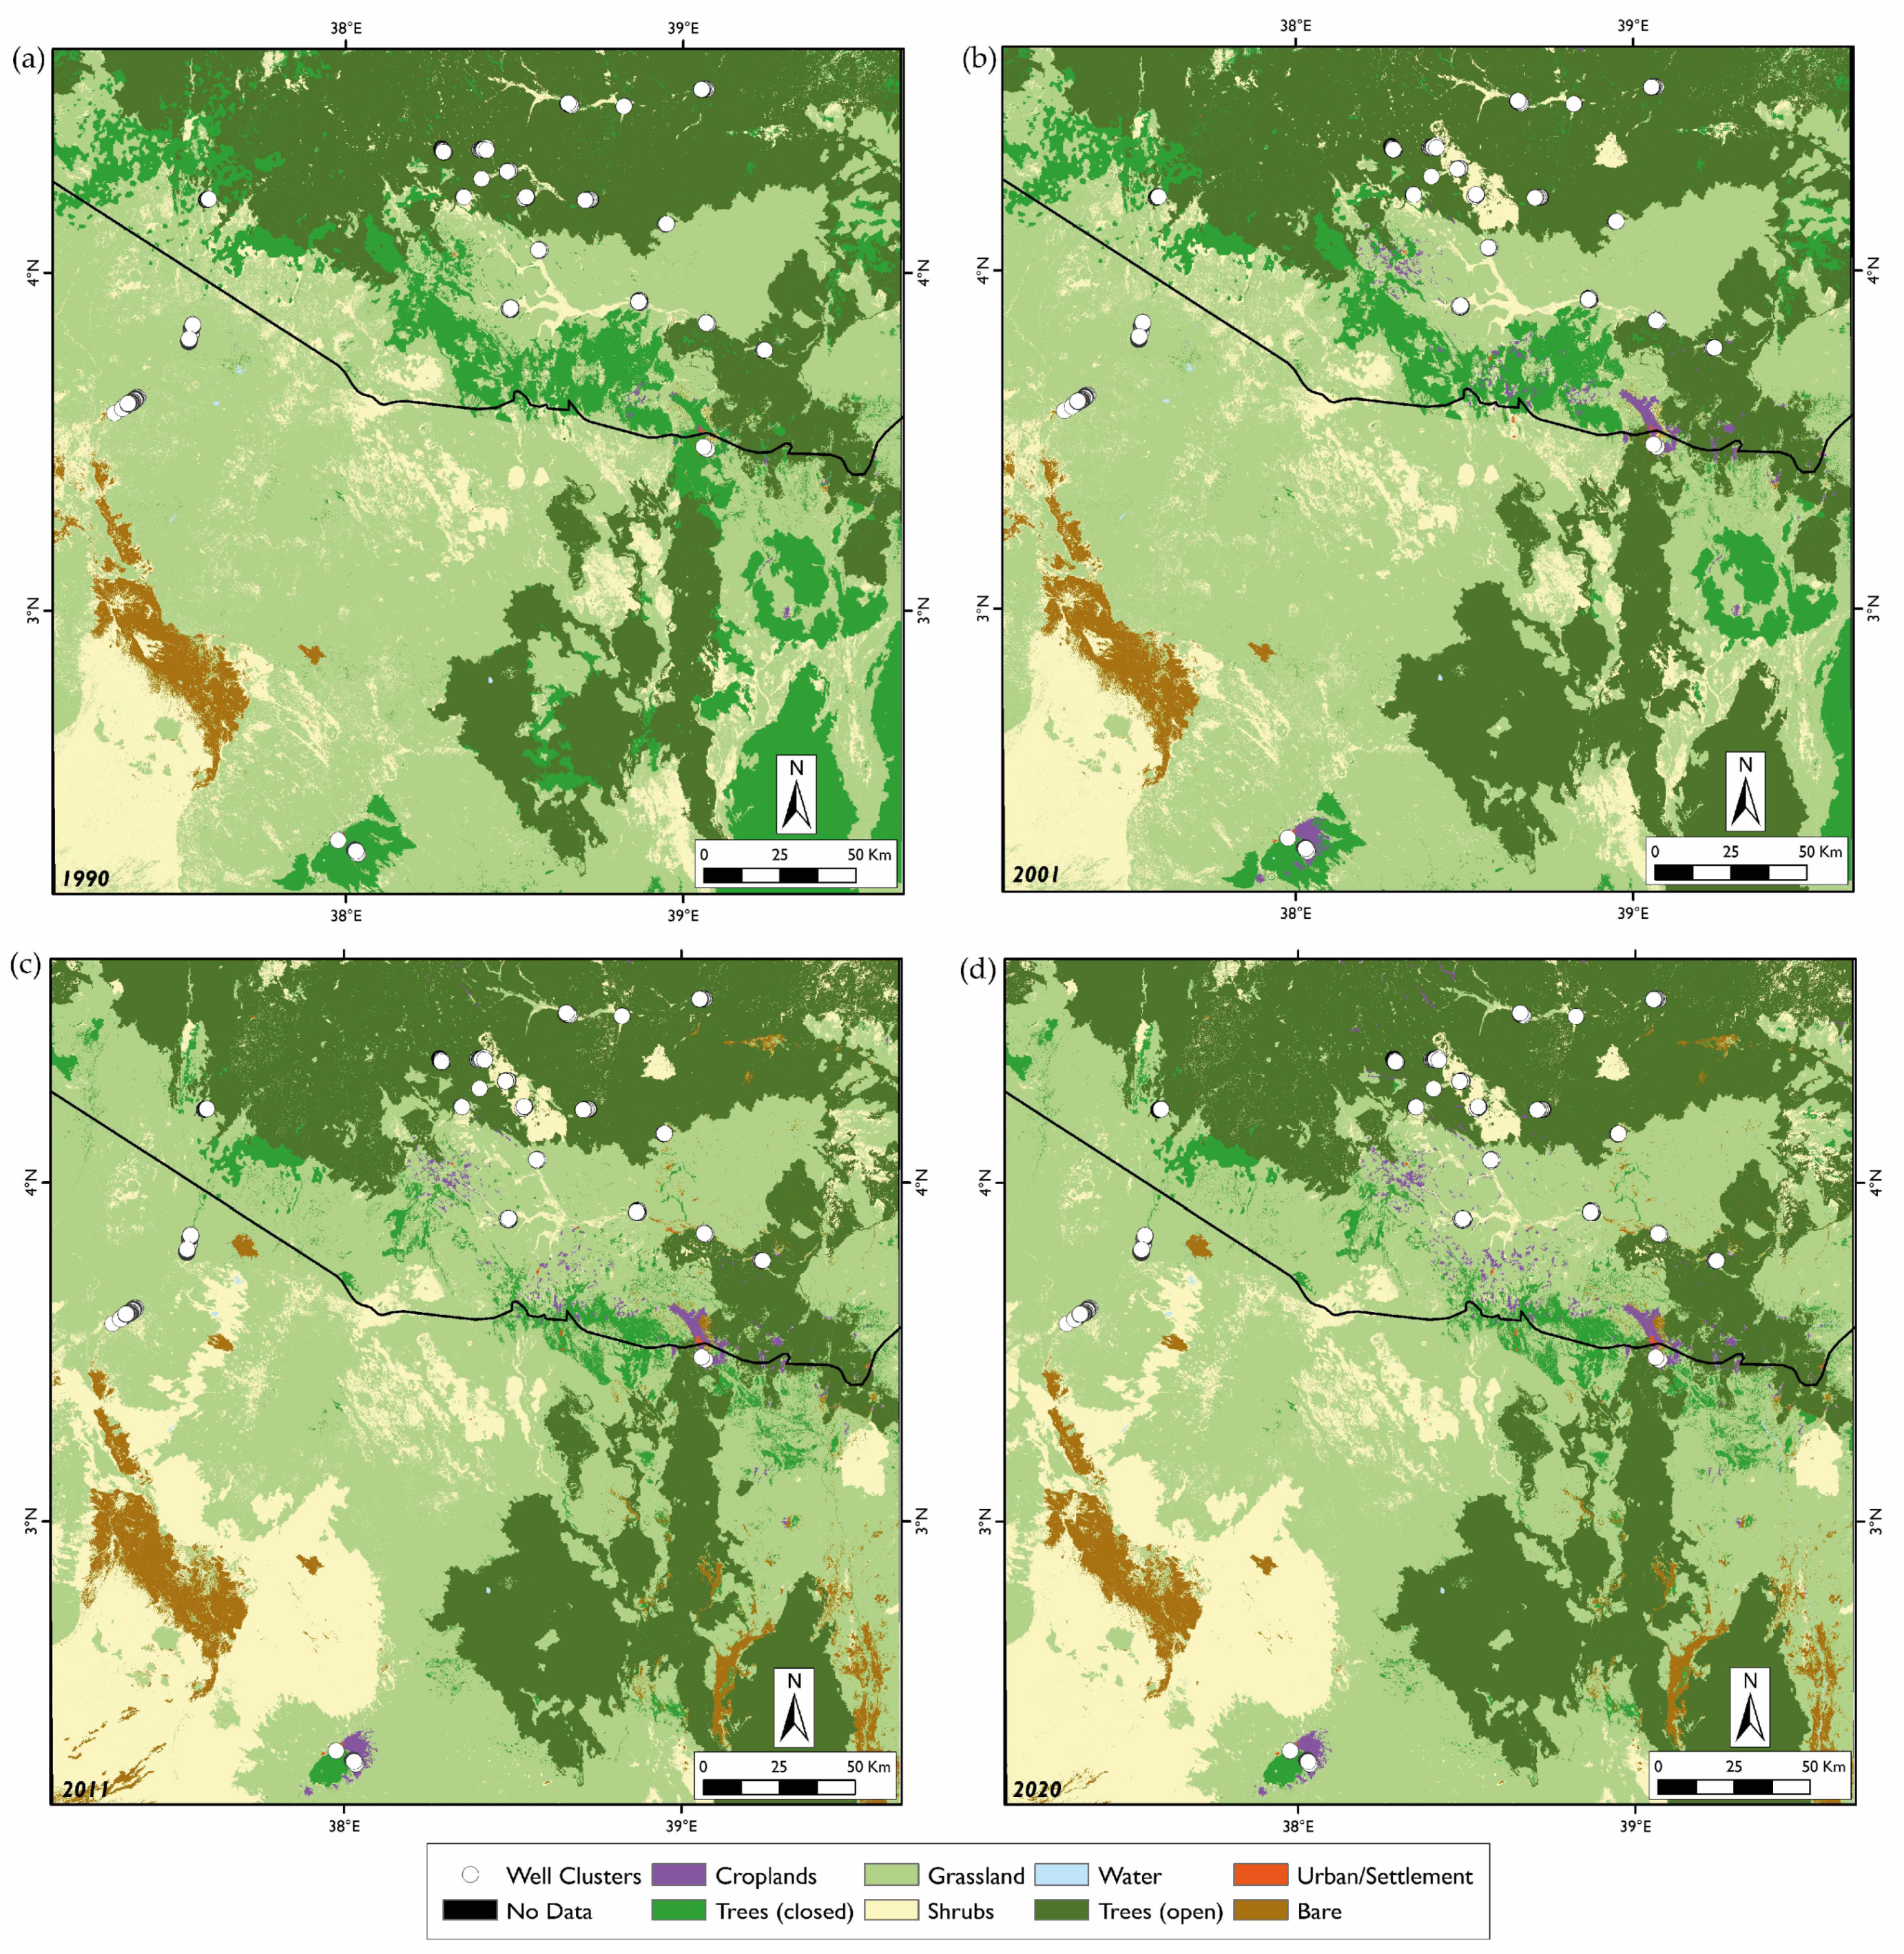
3.1. Time Series Land Use Land Cover Classification

Classified land cover maps comprising eight classes i.e., bare land, grassland, shrub land, open forest, closed forest, croplands, settlement, and water bodies were produced based on the random forest classification mapping model within the GEE platform for the years 1990, 2001, 2011 and 2020 (Figure 6). Table 1, Table 2, Table 3 and Table 4 provide the detailed classification accuracy assessments, i.e., observed versus predicted values, using the validation data for the selected years. The results indicate that the overall accuracies for the years 1990, 2001, 2011 and 2020 were 93.04%, 93.15%, 97.59%, and 96.37%, respectively. Water was most accurately predicted across the four epochs with average user and producer accuracies of 100%, while the cropland-on class was least accurately predicted with users’ accuracies as low as 40% and producers’ accuracies as low as 26%. These low accuracies in cropland-on prediction could be due to spectral variability and confusion with classes such as grassland, especially given the seasonal changes that occur in this class. However, the cropland-off class was well predicted with users’ and producers’ accuracies above 90% for all the years.

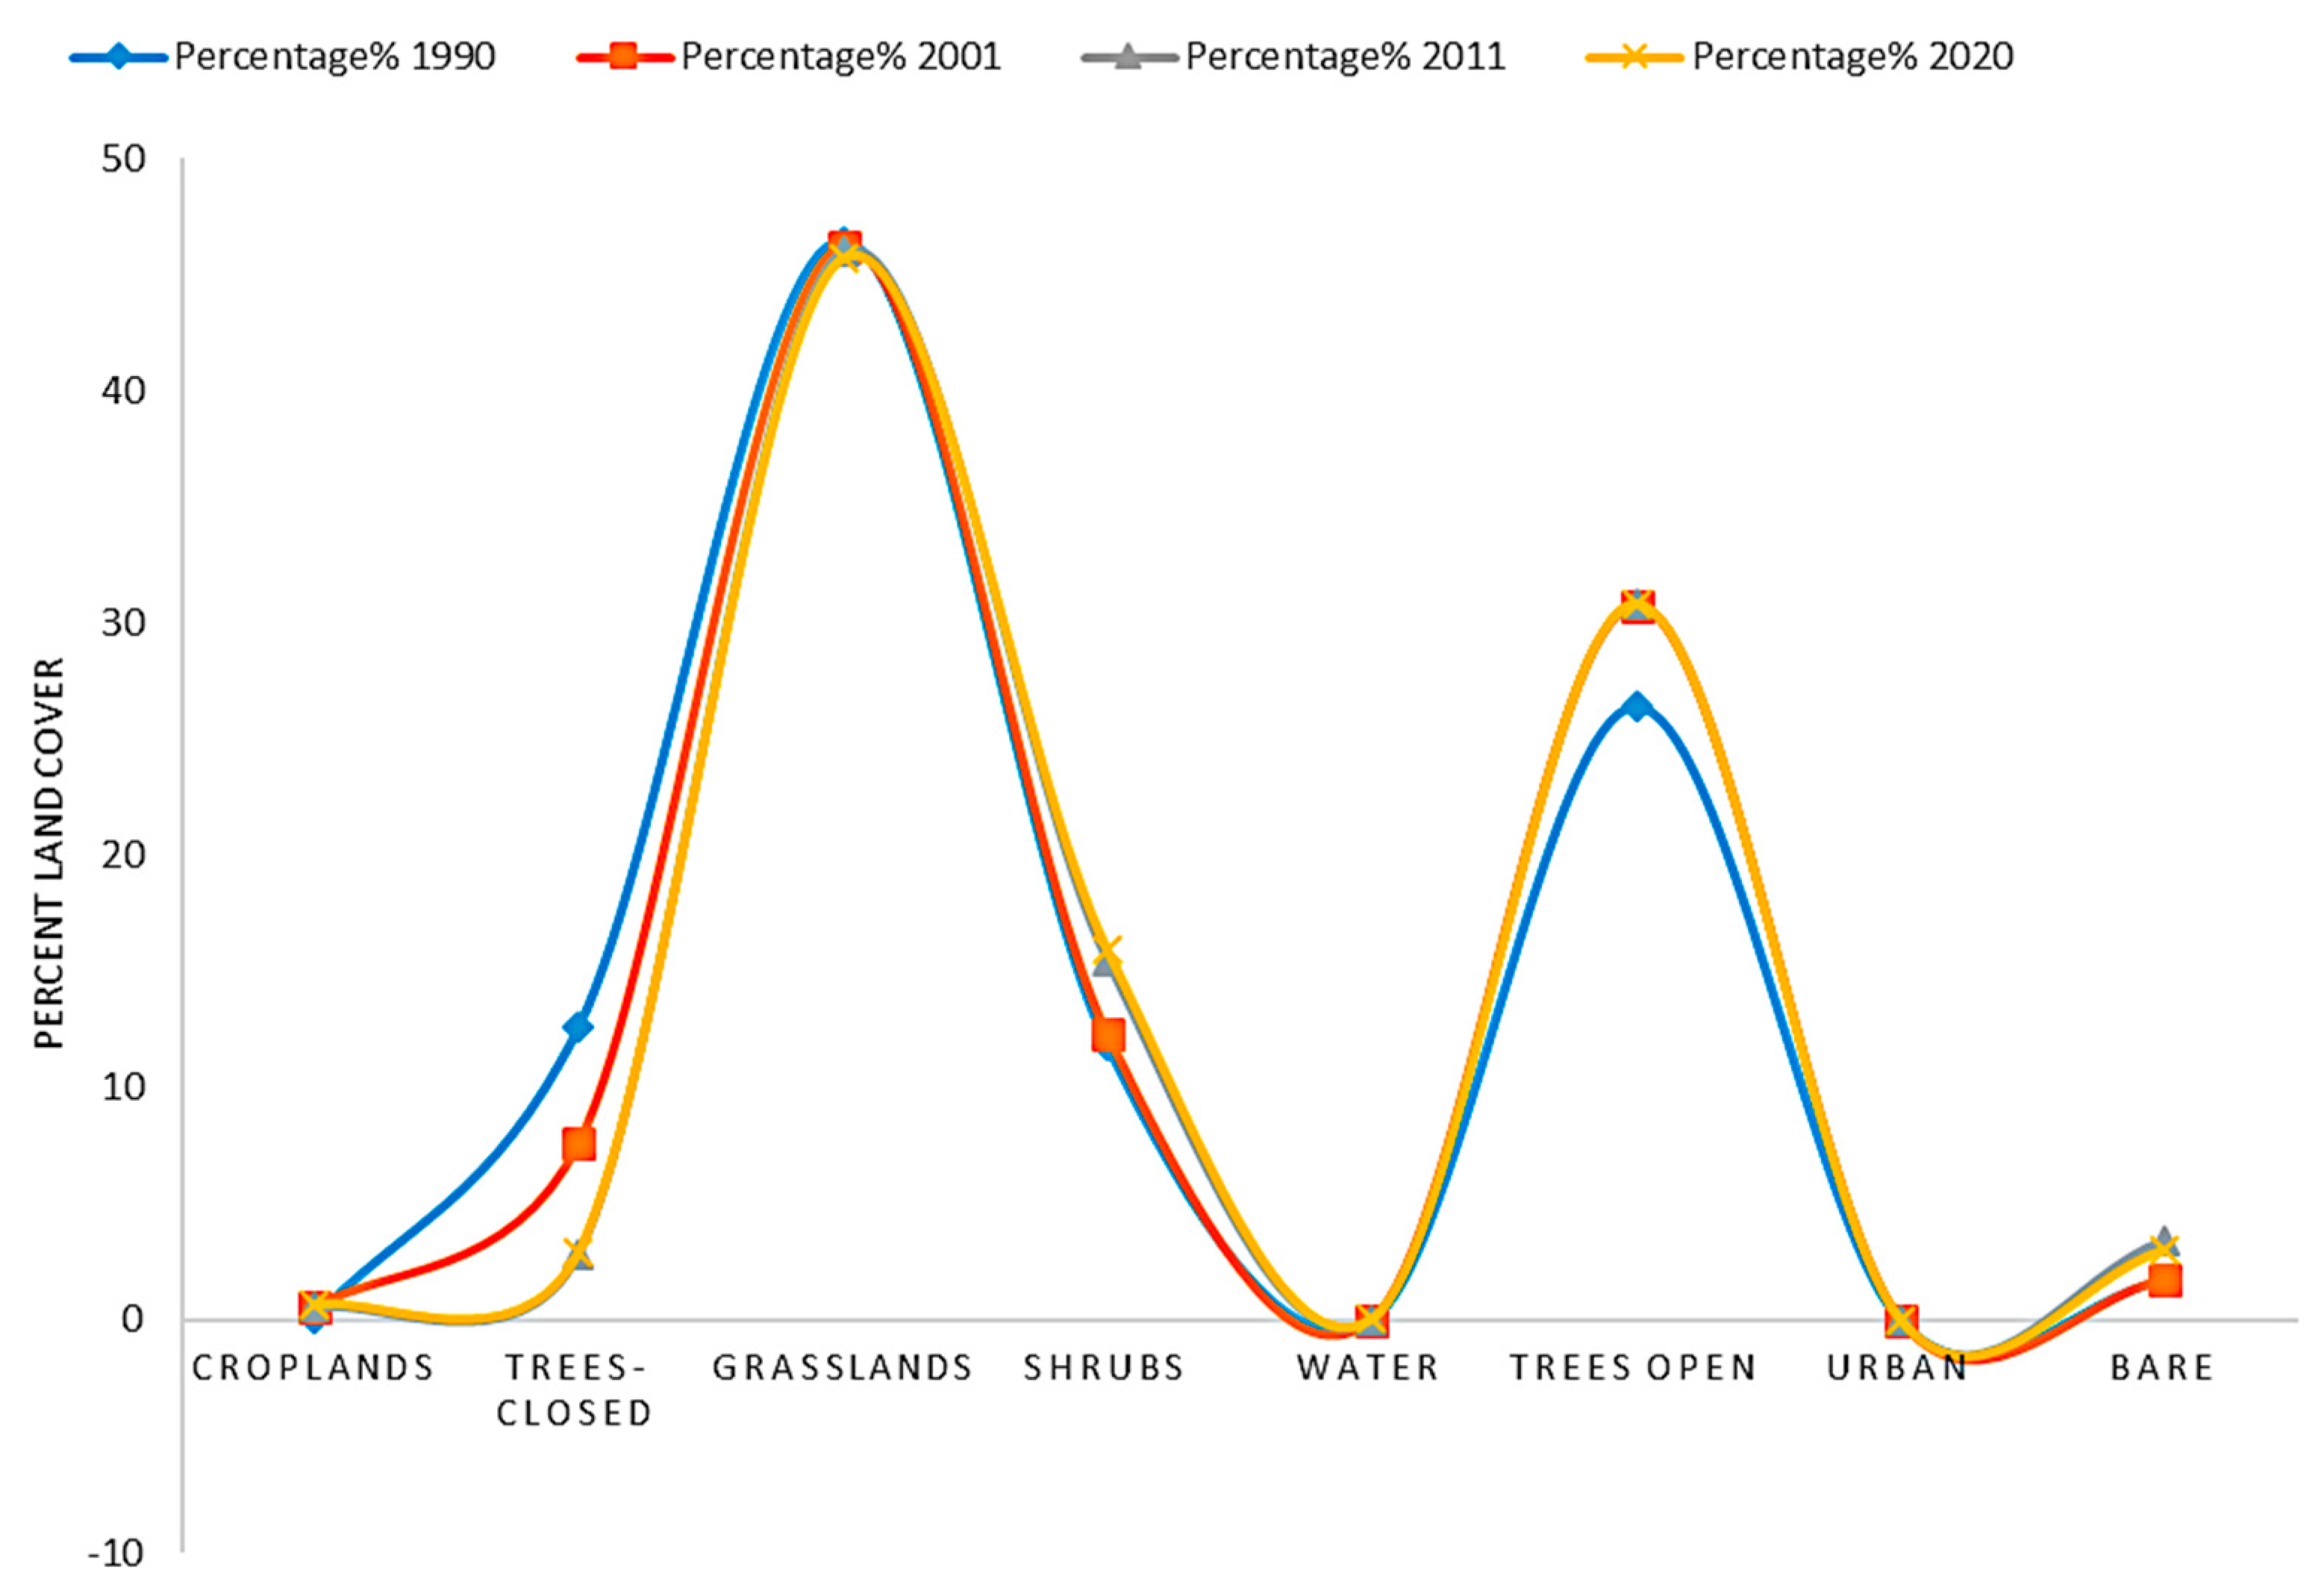
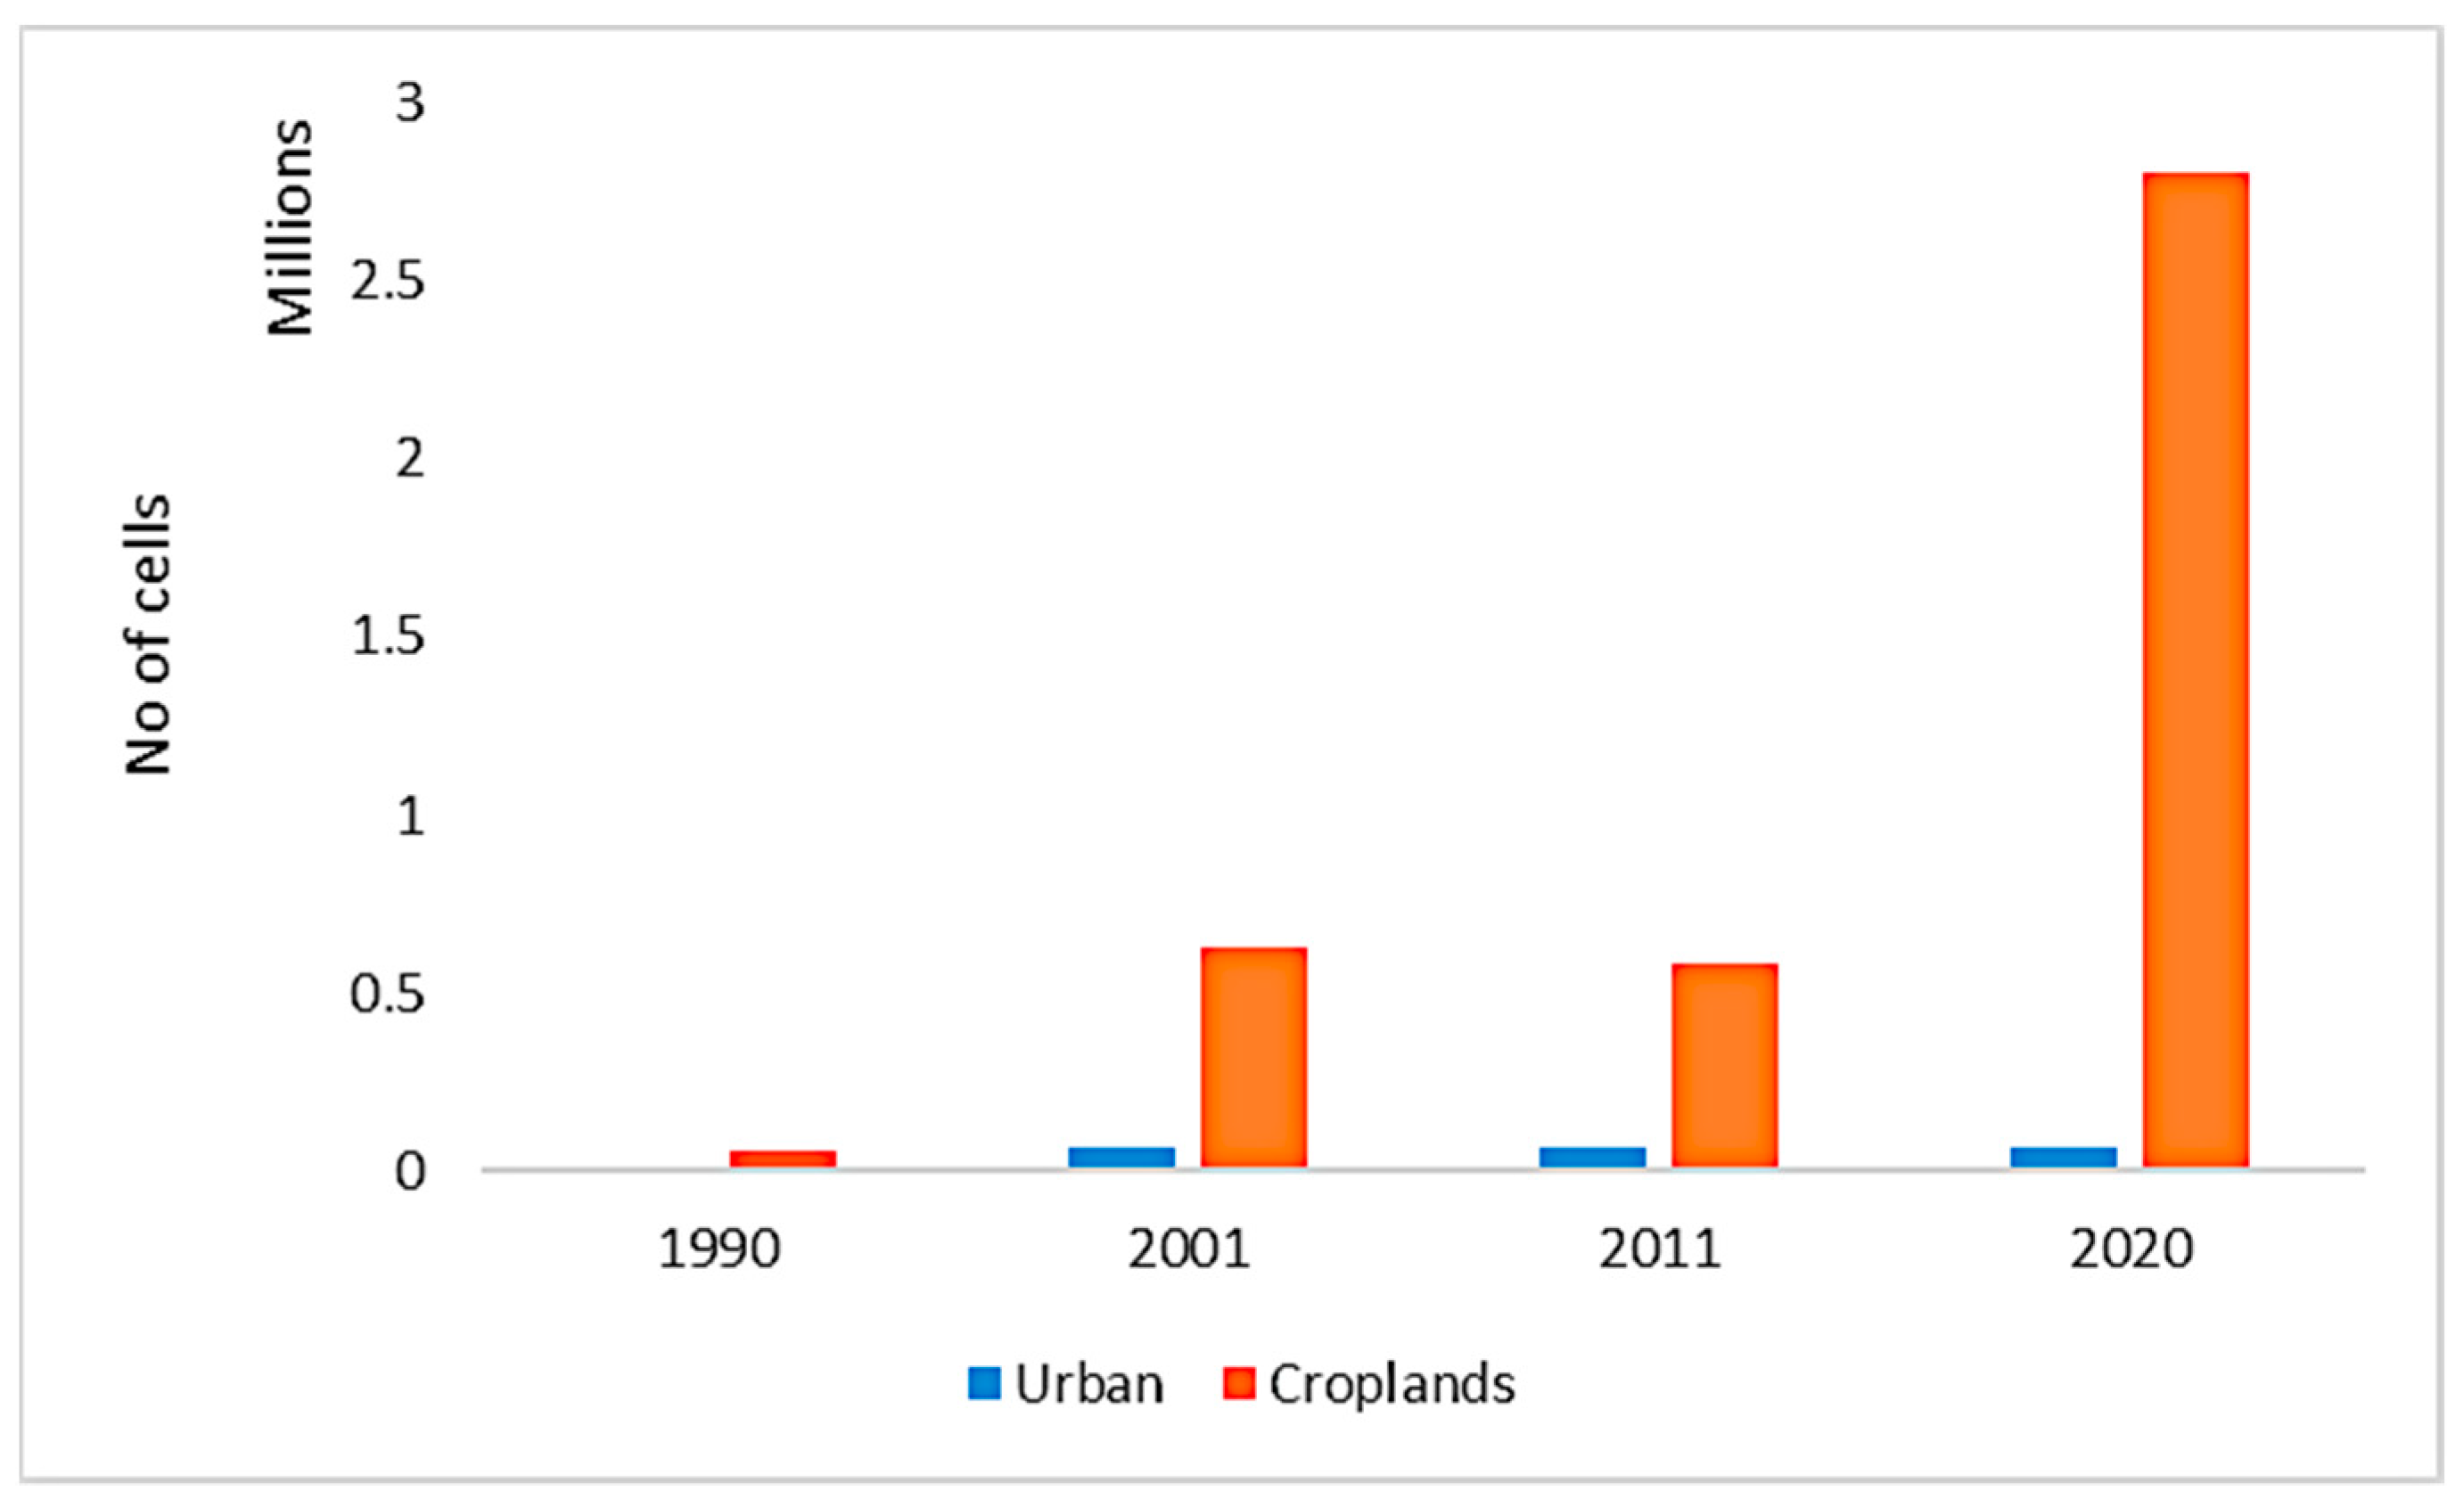
3.2. Land Cover Change Detection from 1990 to 2020

Changes in the land cover matrix for each epoch are shown in Figure 7 and Table 5. Figure 7displays the proportions of land covers in the study region between 1990 and 2020, while Table 5 indicates the area coverage in km squared for each land cover. Our study shows that grasslands dominated the land cover throughout the study period (46%) whereas open trees (~30%), shrubs (~13%) and closed trees (~7%) followed in magnitude. The results also show that the urban/settlement (<0.1%) and cropland (<1%) land covers were the lowest in the region throughout the study period. Table 5 demonstrates that the closed tree cover class underwent a steady decline from 1990 to 2011 (7780 km2), but the area covered increased slightly by 2020. Conversely, the open tree cover class increased gradually from 1990 to 2020 by 3507 km2, a fact that can be attributed partially to the decline in the closed tree cover. Moreover, the shrubs also gradually increased from 1990 to 2020 by 3244 km2 representing a 34% growth. Bare lands also gradually increased during the study period by 1020 km2. The area covered by water increased greatly from 14 km2 in 1990 to 42 km2 in 2020. This increase in surface water could be due to the unusually high rainfall experienced in the region in the year 2020. Among the human-transformed landscapes, i.e., croplands and urban/settlements, there was a gradual and expected increase in area of land covered, particularly the croplands class which experienced a 110% increase from 1990 to 2020. In general, the grasslands class maintained an almost constant area in the landscape, reducing only marginally by approximately 0.01% from 1990 to 2020.

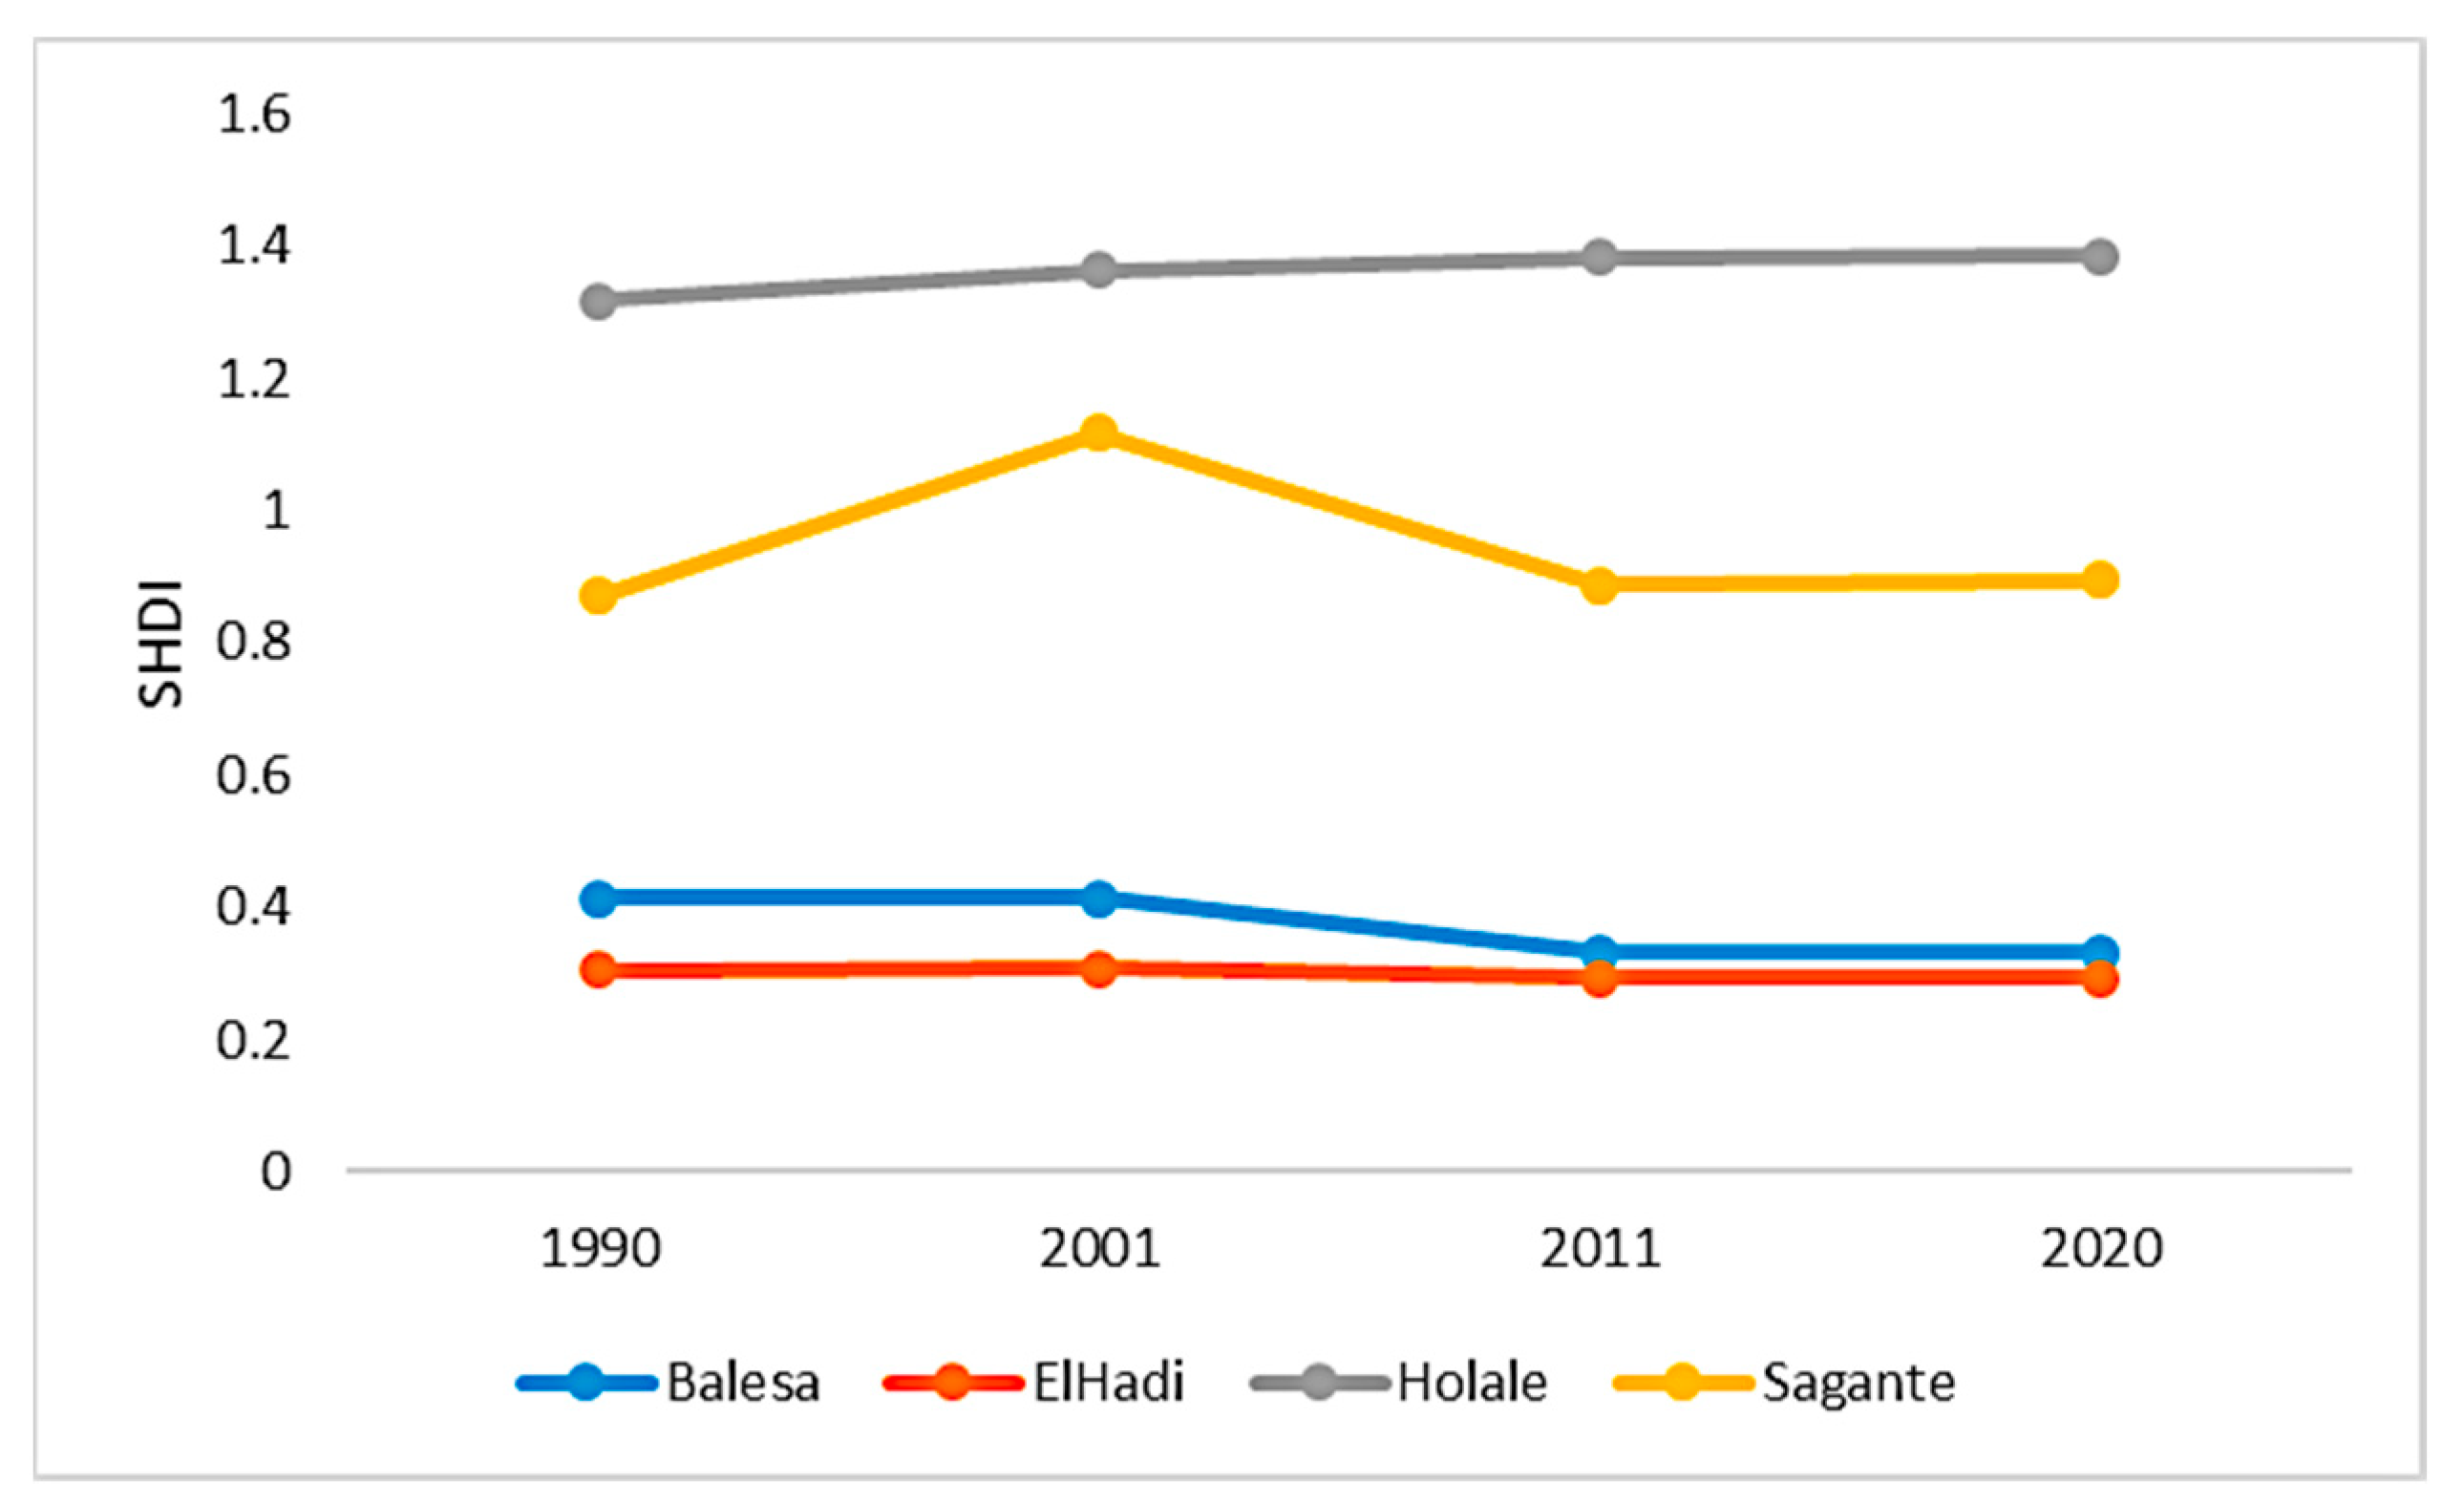
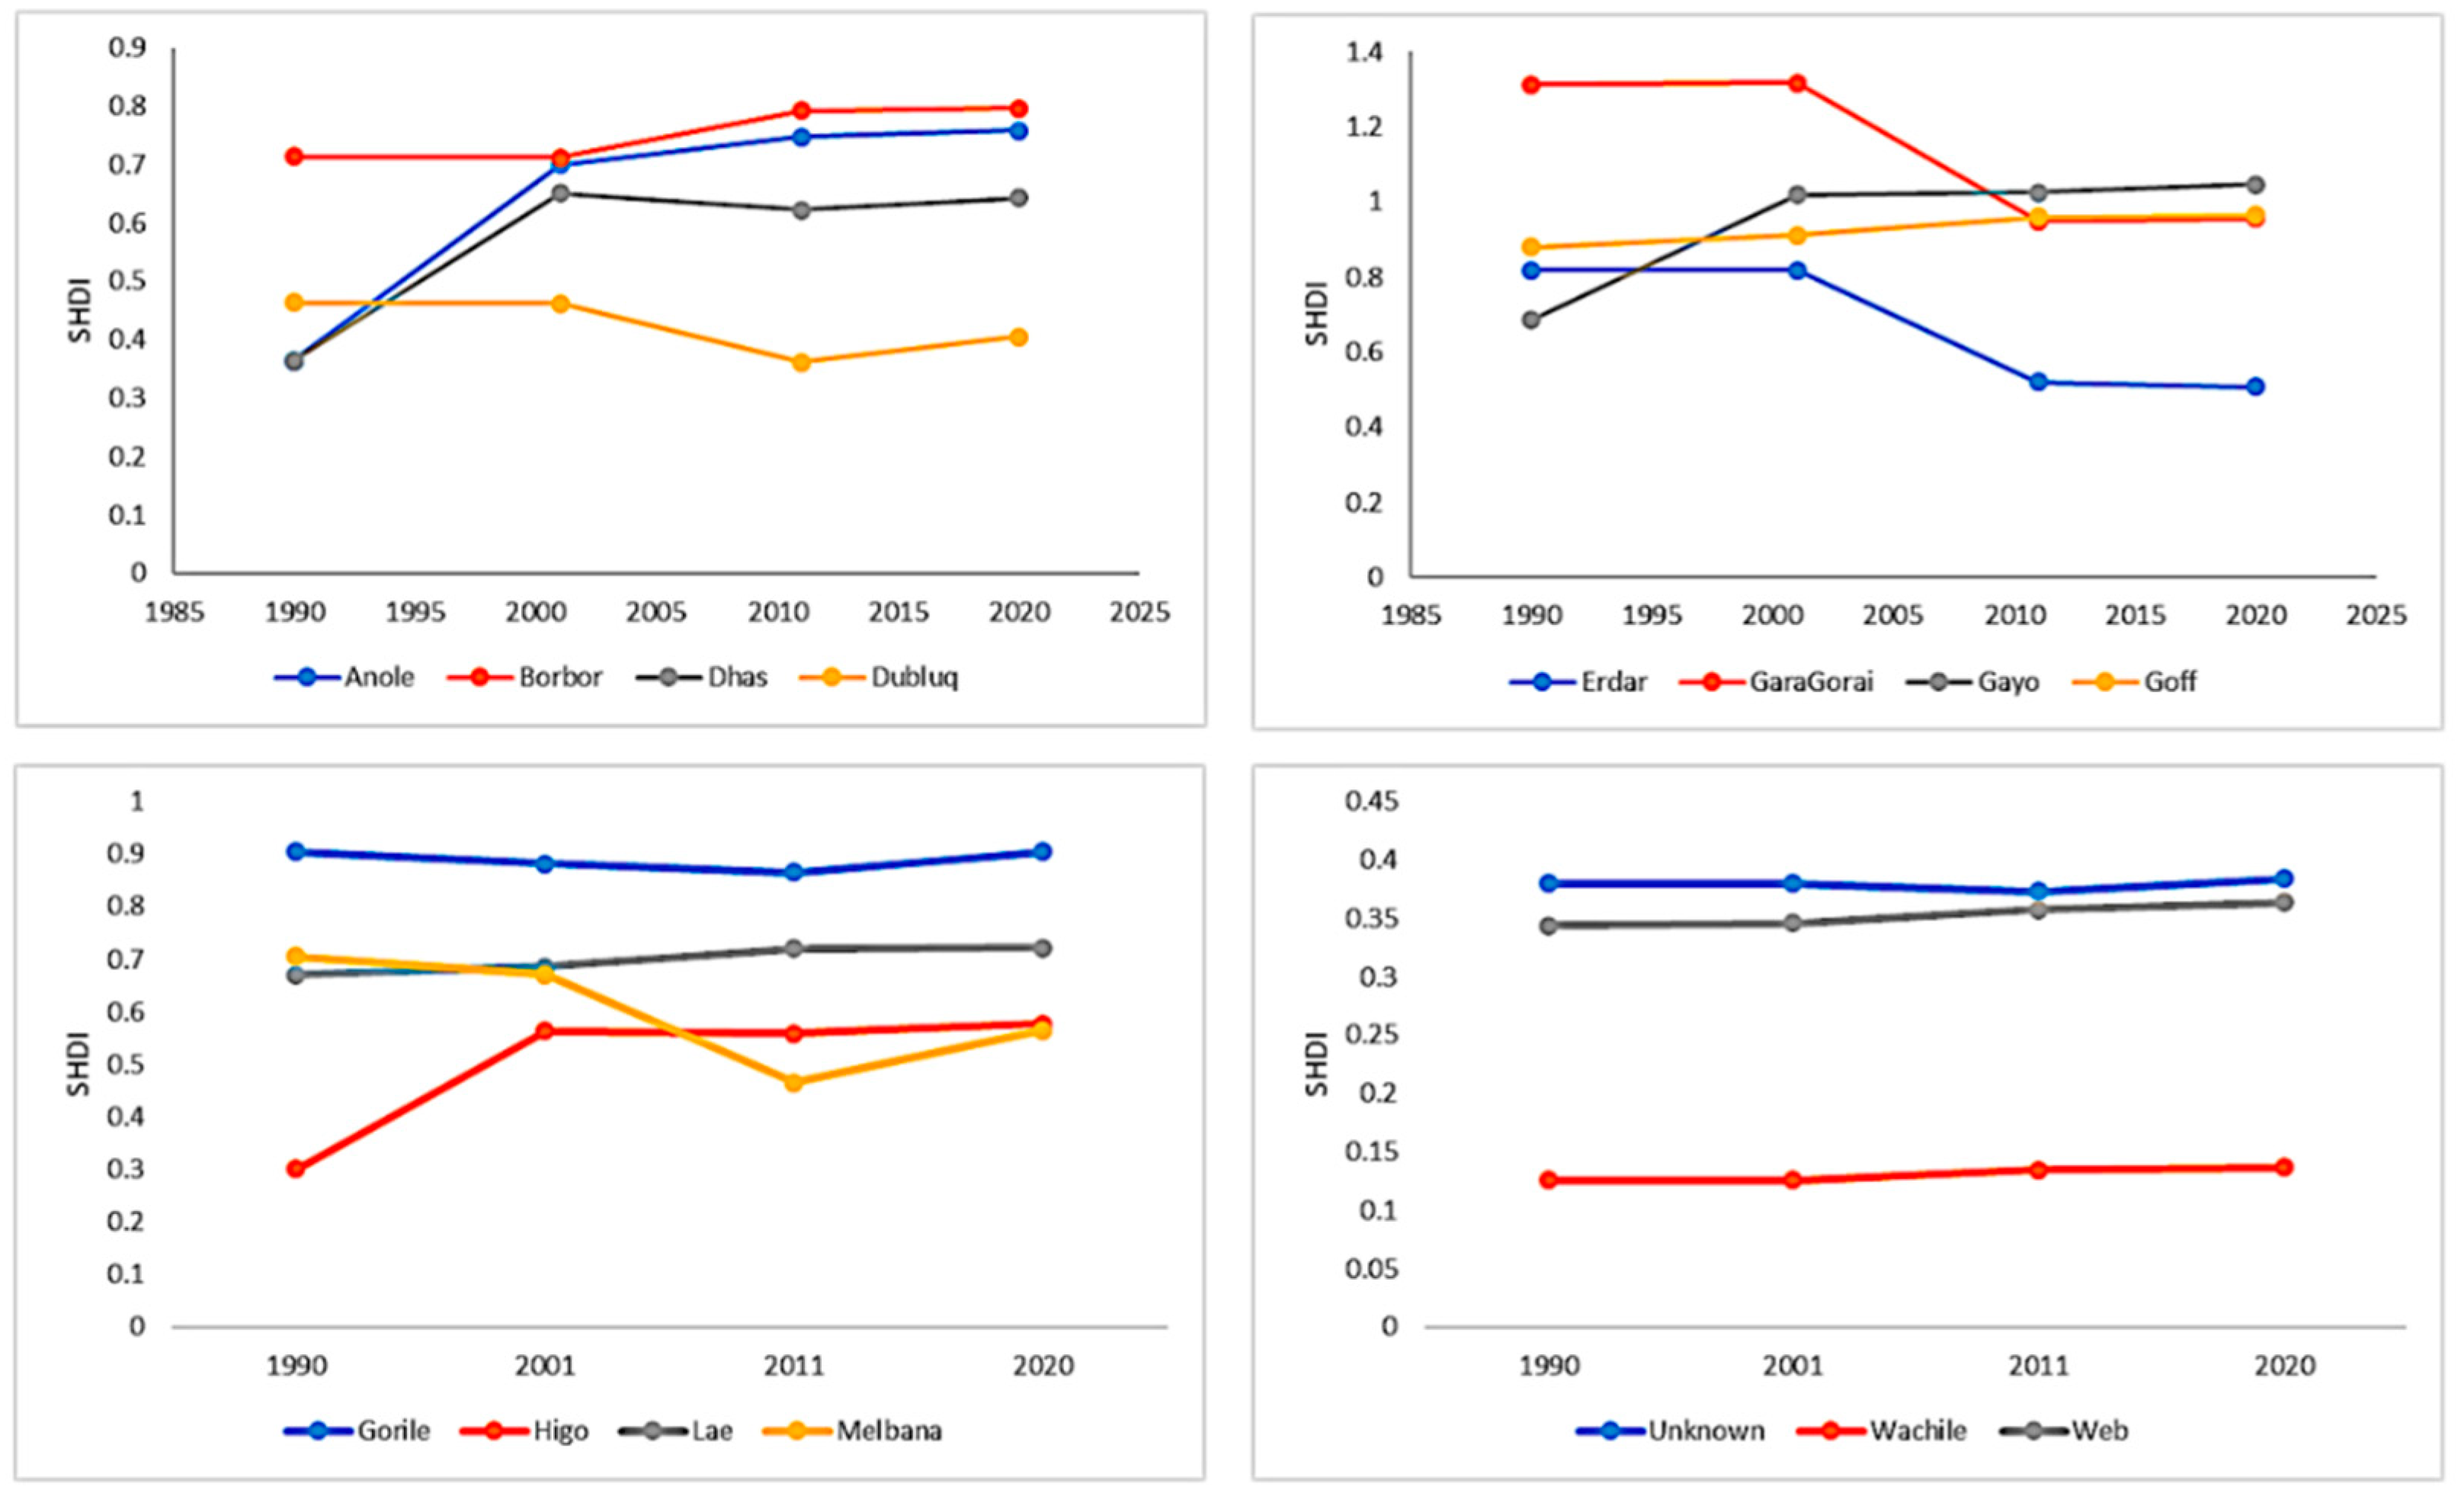
3.3. Time Series Fragmentation Analysis within the Well Clusters

3.3.1. Marsabit Wells

Results from the landscape-level fragmentation analysis within 15 km of the Marsabit wells clusters revealed that the Holale wells cluster had the highest fragmentation levels (mean SHDI = 1.36) while the El Hadi wells had the lowest levels (mean SHDI = 0.30). Importantly, there were slightly increasing fragmentation patterns among the Sagante Marsabit (2%) and Holale wells clusters (5%). On the other hand, the Balesa and El Hadi clusters demonstrated decreased fragmentation in their vicinity (−19% and −4% respectively) throughout the study period (Figure 8).

3.3.2. Tula Wells

Fragmentation analysis within 15 km of the tula wells clusters showed that the Gorai wells cluster had the highest SHDI values (mean = 1.13) while the Wachile wells cluster had the lowest SHDI values (mean = 0.13). Furthermore, SHDI values for five well clusters (viz. the Anole, Borbor, Dhas, Gayo and Higo well clusters), increased gradually during the study period of 1990–2020 (Figure 9). The highest increase in fragmentation occurred at the Anole well cluster (108%), followed by Higo (92%), Dhas (76%), Gayo (52%), Borbor (11%). Additionally, five well clusters demonstrated a slight increase in SHDI viz. Goff (9%), Wachile (8%), Lae (7%), Web (5%) and an Unknown cluster (1%). Conversely, four well clusters showed decreasing fragmentation over the years i.e., Erdar (−37%), Gorai (−27%), Melbana (−19%) and Dubluq (−12%). The Gorile well cluster did not display any change in SHDI throughout the study period.

4. Discussion

Mapping changes in LULC in the Marsabit and Borana regions in Northern Kenya/Southern Ethiopia study region is key to understanding the linkages between landscape characteristics and indigenous hand-dug wells in the region and is therefore fundamental in addressing issues related to these wells which are key resources for pastoral production, and have significant social, cultural, symbolic, and religious values for the indigenous populations inhabiting this semi-arid region. Here, we describe a time-series mapping exercise using 30 m Landsat satellite data from the USGS for four time epochs. We also report on time-series landscape-level fragmentation patterns represented by the Shannon Diversity Index (SHDI) within the well clusters in the study region. The semi-arid rangelands in this study area have undergone widespread LULC changes between 1990 and 2020. Within that time period, the area of closed trees reduced by (−76%) and grasslands by (−1.62%) while shrubs showed an increase of (+34%) and open trees by (+16%). Correspondingly, croplands increased by (+110%) within the same period and urban/settlement increased by (+203%). Similarly, the bare areas increased by (+74%). These results demonstrate a substantial expansion of anthropogenic landscapes i.e., urban/settlement and croplands while the ‘natural’ land cover classes have contracted. The reduction in ‘natural’ landscapes versus the increase in anthropogenic landscapes indicates that some level of landscape degradation, which we use here to indicate a deterioration in landscape ecosystem services directly due to the reduction in extent of key vegetation classes (grassland, woodland, forest) [70], is occurring in this region, which agrees with the findings of previous studies of LULC in the general area [49,52,53,54]. As outlined above, these all demonstrated that anthropogenic activities contributed largely to changes in ‘natural’ cover in these regions. Interestingly, in our study area, water bodies showed an increase in extent of (+186%) from 1990 to 2020. This can probably be explained by the increase in rainfall in the 2018–2020 period (mean = 546 mm) compared to the other epochs, i.e., the 2009–2011 period (mean = 377 mm), the 1999–2001 period (mean = 243 mm), and the 1988–1990 period (434 mm). Additionally, the reduction in grasslands cover in the region (Table 5) is in agreement with Haile et al. [48] who also show a reduction of grasslands in the Borana area between 1967 and 1987 and a corresponding increase in the woodland cover class, which could be equivalent to the open trees land cover class in this study. The reported ongoing reduction in grasslands cover could be deleterious for livestock wellbeing and subsequently to the human populations that rely on them as a major source of livelihood, given that grasslands are the main source of feed for the livestock in this region [48].
Examination of the time-series SHDI values around the well clusters demonstrated that the landscape structure has changed significantly around some clusters and less in others during the study period. Increasing SHDI around Anole, Higo, Dhas, Gayo, and Borbor indicate increased fragmentation in those well clusters. A detailed examination of the land cover classes within the 15 km buffer zone of Anole cluster, which has experienced increased fragmentation, shows that the croplands and urban/settlement classes expanded greatly during the 1990–2020-time period (Figure 10). This is in agreement with observations by Tiki et al [29]., who show that these humanly created land cover classes have continued to expand within this region. Discussions with key informants in Borana confirm the increased fragmentation of the rangeland, particularly increases in cropland, shrubs, and bare land.
Conversely, a detailed assessment of the land cover classes within the 15 km buffer zone of the Erdar well cluster, which experienced a decline in fragmentation, still indicates that croplands and more so the urban/settlement classes expanded greatly during the 1990–2020-time period (Figure 11).
The gradual increase in croplands within the well clusters in this region indicates an expansion of cultivation within this study area, which is a departure from the traditional livestock-keeping practices of the inhabitants of the area. It was found by Mgalula [71] that croplands were rapidly expanding in the Borana rangeland due to several potential drivers. Decrease in pasture, recurrent droughts, income diversification, and food insecurity were found to be the main reasons for the expansion of cultivated areas [71]. Extreme droughts during the early 1980s and 1990s resulted in massive losses of livestock herds which brought about diversification into cultivation activities in the area.
Moreover, the proliferation of urban/settlement areas within these well clusters as demonstrated by the fragmentation analysis in this study is in line with studies by Hazard et al. [72] who state that, over the last 20–30 years, there has been increased settlement close to water sources. This status has possibly been exacerbated by changes in water management due to introduction of alternative sources of water, climate change, and rapid development of urban areas, especially in the case of Marsabit and Moyale areas in the North Kenya region [73]. In the past, communal water management ensured that extraction of resources such as trees and sand around the wells were prohibited. Grazing of animals close to the wells was also restricted, and this ensured that the natural ecosystem around the wells was preserved [74]. Furthermore, the Kenya government and other institutions have encouraged a sedentary lifestyle amongst the region’s inhabitants by distribution of relief food and restocking of livestock after losses, resulting in expanded urban areas within the well zones. Thus, the 15 km buffer zones within the well clusters that were previously reserved for pasture use during excessive weather conditions are now perpetually occupied and several urban centres are found within 1 km of the wells [73]. An undesirable result of the expanding urbanisation within these well clusters is increased poverty and environmental degradation in areas such as Marsabit town [75]. In another study [29], Tiki and colleagues documented that settlements and urban centers in the Borana area have moved progressively to the well centers in the last couple of decades. This has affected the indigenous land use plan which reserves the rangelands within an 8 km radius of wells for livestock grazing during the dry season. It has further aggravated the fragmentation of the rangeland due to increased demand for natural resources such as trees for firewood and house construction, increased cropland, and other land use forms.
Rapid population growth, inequitable access, infrastructure and climate change are causes for water scarcity in many areas of Africa [76], and here we have demonstrated a way to monitor these issues in this region. There is a consensus that local level adaptation is needed to ensure access to water in the future and remote sensing offers a tool to guide this initiative. More broadly, as a first example of remote sensing analysis in the context of biocultural heritage preservation, an assessment of the role, potential and challenges of remote sensing needs to be made.
As discussed above, the concept of biocultural heritage aims to integrate and ana-lyse simultaneously the local and the global, the short- and long-term, the quantitative and qualitative, and the tangible and intangible to provide a richer understanding of land-scape features and cultural landscapes and plan for their sustainable management. [Lindhom and Ekblom [24], for example, conceive biocultural heritage as both a conceptual and methodological approach to landscape and research management. In their definition, biocultural heritage is constituted of five elements, three descriptive and two operational. Of interest to our approach are the terms used to describe and understand biocultural heritage, which consider heritage as memories, both tangible and intangible, associated with the environment—namely ecosystem-, landscape- and place-based memories. According to the authors, the concept of memory can be used to acknowledge that present landscapes carry the legacy of past practices. In fact, preservation without an integrated study of present and past landscapes would be incomplete and not sustainable, in particular in contested landscapes. Ecosystem memories can be defined as biophysical properties, non-human organisms, and agents affected by human intervention. Landscape memories are tangible or semi-intangible and represent materialized human practice and ways of organizing landscapes. Land use is an example of landscape memory generated and regenerated through routine, daily practice, but also always retaining traces of past practices around which changes in use tend to be accommodated. Hedgerows found in many western European landscapes are an obvious example of this—they fulfil contemporary functions but retain their own histories of management, replanting, and ‘natural’ ecological colonization. Place-based memories are the stories, place names and collective forms of practice associated with a landscape as captured in oral traditions, sayings, poetry, and other forms of oral expression.
Various methodological approaches and disciplines contribute to the documenta-tion of these landscape memories with palynology, for example, contributing to the reconstruction of ecosystem memories and archaeology to that of landscape memories, whilst place-based memories can be collected through ethnographic work. Remote sensing in this framework can contribute to the reconstruction of both ecosystem and landscape memories for the more recent past. Its spatial and temporal richness makes it most suited for medium-term landscape studies, via the well-established and commonly practiced technique of Land Use Land Cover classification and change detection. In contrast, ethnographic work provides depth and the opportunity to explore place memories at the local level.

5. Conclusions

The combination of the different conceptualisations and understandings of biocultural heritage proposed by Lindhom and Ekblom [24] via an integrated landscape analysis falls into the sphere of mixed approaches to the study of landscapes, also used by Wales et al. [14], with the aim of taking up the challenge of incorporating data on social variables with that from natural sciences, in particular in LULC mapping. As discussed here, evidence regarding temporal transformation of LULC change patterns and their key drivers within the study region are crucial for planning appropriate strategies for management and conservation of indigenous wells in the region and securing their value as nodes of biocultural significance and value. To address this, we combined time-series Landsat satellite data to quantify the spatio-temporal pattern of LULC changes and extracted fragmentation metrics within a 15 km buffer zone of the studied well clusters. Overall, the study demonstrates that derived fragmentation indices from remote sensing methods can be used successfully to capture growing landscape structure changes occurring within the vicinity of indigenous wells in this semi-arid to arid study region. These remote sensing methods together with other methods such as FGD and field verifications can therefore form the basis for linking landscape quality with biocultural heritage management and, ultimately, their preservation.
Integrating the remote sensing-based mapping that documents landscape memories and the community-based work that can provide insights into place-based memories is not without challenges, however. For example, it should not be taken simply as a way of finding an explanation for changes detected through on-the-ground interviews, nor as a way of overly generalising these changes at the scale of the remotely sensed imagery. It also needs to be acknowledged that the scale of operation of the two approaches is different, that perceptions of landscapes can contrast with patterns detected via spectra analysis, and likewise that the phenomena and memories being mapped are complex and not caused by any single or limited combination of causes and effects. Using both in combination nevertheless offers an opportunity to examine, via remote sensing, a larger landscape than the one documented by researchers and described by communities on the ground at a single location/village, thereby providing the opportunity to examine and assess variations of changes (or lack thereof) and their different drivers at multiple locations. This in turns allows for acknowledging different landscape and place-based memories and a more nuanced understanding of the impact of changes in the landscape and, as a consequence, preservation and conservation strategies.

Author Contributions

Conceptualisation, P.O., S.M., N.K. and P.J.L.; methodology, P.O., S.M. and N.K.; validation, P.O., S.M. and N.K.; software, P.O. and N.K., field investigations, F.N.M., W.T., A.B. and P.J.L., formal analysis, all authors; data curation, P.O., N.K. and F.N.M.; writing and editing, all authors; visualisation, N.K. and P.O.; project administration, F.N.M., S.M. and P.J.L.; funding acquisition, P.J.L. and F.N.M. All authors have read and agreed to the published version of the manuscript.

Funding

This research was supported by British Academy through its 2018 Sustainable Development Programme supported by the Global Challenges Research Fund, the Arcadia Foundation through their support of the Mapping Africa’s Endangered Archaeological Sites and Monuments Project, and McDonald Institute for Archaeological Research, University of Cambridge.

Institutional Review Board Statement

This research was carried out in accordance with the Declaration of Helsinki, and approved by the Ethics Committee of Strathmore University, ref: SU-IERC 1092/21.

Informed Consent Statement

Our informants were informed about the purpose of the study and how interview responses and survey data would be stored and used in a free, prior, and informed consent procedure. Informed consent was obtained from all persons interviewed as part of this study.

Data Availability Statement

Not applicable.

Acknowledgments

The field research on which this article is based was funded by the British Academy’s Sustainable Development Programme 2018, supported under the Global Challenges Research Fund—Well-Being: Indigenous Wells, Pastoralist Biocultural Heritage and Community Archaeology for Sustainable Development in Northern Kenya and Southern Ethiopia (Grant No. SDP2\100167), PI Freda M’Mbogori. The Mapping Africa’s Endangered Archaeological Sites and Monuments (MAEASaM) project (PI Paul Lane), funded by the Arcadia Foundation, a charitable fund of Lisbet Rausing and Peter Baldwin, is also gratefully acknowledged for supporting the remote sensing inputs. The McDonald Institute for Archaeological Research, University of Cambridge is gratefully acknowledged for a grant to PJL to cover the Open Access publication costs. Special thanks are also due to John Kanyingi at the British Institute in Eastern Africa for his assistance with mapping of different well clusters in Marsabit County, Kenya. Finally, special thanks are due to the various community stakeholder groups in southern Ethiopia and northern Kenya for sharing their knowledge and insights, and to the relevant national authorities for permission to undertake fieldwork.

Conflicts of Interest

The authors declare no conflict of interest.

References

  1. Reid, S.H. Satellite Remote Sensing of Archaeological Vegetation Signatures in Coastal West Africa. Afr. Archaeol. Rev. 2016, 33, 163–182. [Google Scholar] [CrossRef]
  2. Biagetti, S.; Merlo, S.; Adam, E.; Lobo, A.; Conesa, F.C.; Knight, J.; Bekrani, H.; Crema, E.R.; Alcaina-Mateos, J.; Madella, M. High and Medium Resolution Satellite Imagery to Evaluate Late Holocene Human–Environment Interactions in Arid Lands: A Case Study from the Central Sahara. Remote. Sens. 2017, 9, 351. [Google Scholar] [CrossRef] [Green Version]
  3. Nsanziyera, A.F.; Rhinane, H.; Oujaa, A.; Mubea, K. GIS and Remote-Sensing Application in Archaeological Site Mapping in the Awsard Area (Morocco). Geoscience 2018, 8, 207. [Google Scholar] [CrossRef] [Green Version]
  4. Thabeng, O.L.; Merlo, S.; Adam, E. High-resolution remote sensing and advanced classification techniques for the prospection of archaeological sites’ markers: The case of dung deposits in the Shashi-Limpopo Confluence area (southern Africa). J. Archaeol. Sci. 2019, 102, 48–60. [Google Scholar] [CrossRef]
  5. Davis, D.S.; Andriankaja, V.; Carnat, T.L.; Chrisostome, Z.M.; Colombe, C.; Fenomanana, F.; Hubertine, L.; Justome, R.; Lahiniriko, F.; Léonce, H.; et al. Satellite-based remote sensing rapidly reveals extensive record of Holocene coastal settlement on Madagascar. J. Archaeol. Sci. 2020, 115, 105097. [Google Scholar] [CrossRef]
  6. Ur, J. Google Earth and Archaeology. SAA Archaeol. Rec. 2006, 6, 35–38. [Google Scholar]
  7. Sadr, K.; Rodier, X. Google Earth, GIS and stone-walled structures in southern Gauteng, South Africa. J. Archaeol. Sci. 2012, 39, 1034–1042. [Google Scholar] [CrossRef]
  8. Luo, L.; Wang, X.; Guo, H.; Lasaponara, R.; Shi, P.; Bachagha, N.; Li, L.; Yao, Y.; Masini, N.; Chen, F.; et al. Google Earth as a Powerful Tool for Archaeological and Cultural Heritage Applications: A Review. Remote. Sens. 2018, 10, 1558. [Google Scholar] [CrossRef]
  9. Banerjee, R.; Srivastava, P.K. Reconstruction of contested landscape: Detecting land cover transformation hosting cultural heritage sites from Central India using remote sensing. Land Use Policy 2013, 34, 193–203. [Google Scholar] [CrossRef]
  10. Elfadaly, A.; Attia, W.; Qelichi, M.M.; Murgante, B.; Lasaponara, R. Management of Cultural Heritage Sites Using Remote Sensing Indices and Spatial Analysis Techniques. Surv. Geophys. 2018, 39, 1347–1377. [Google Scholar] [CrossRef]
  11. Bai, X.; Du, P.; Guo, S.; Zhang, P.; Lin, C.; Tang, P.; Zhang, C. Monitoring Land Cover Change and Disturbance of the Mount Wutai World Cultural Landscape Heritage Protected Area, Based on Remote Sensing Time-Series Images from 1987 to 2018. Remote. Sens. 2019, 11, 1332. [Google Scholar] [CrossRef] [Green Version]
  12. Khalaf, N.; Insoll, T. Monitoring Islamic Archaeological Landscapes in Ethiopia Using Open Source Satellite Imagery. J. Field Archaeol. 2019, 44, 401–419. [Google Scholar] [CrossRef]
  13. Moise, C.; Negula, I.D.; Mihalache, C.E.; Lazar, A.M.; Dedulescu, A.L.; Rustoiu, G.T.; Inel, I.C.; Badea, A. Remote Sensing for Cultural Heritage Assessment and Monitoring: The Case Study of Alba Iulia. Sustainability 2021, 13, 1406. [Google Scholar] [CrossRef]
  14. Wales, N.; Murphy, R.J.; Bruce, E. Understanding patterns of vegetation change at the Angkor World Heritage site by combining remote sensing results with local knowledge. Int. J. Remote. Sens. 2021, 42, 445–468. [Google Scholar] [CrossRef]
  15. Hammer, E.; Seifried, R.; Franklin, K.; Lauricella, A. Remote assessments of the archaeological heritage situation in Afghanistan. J. Cult. Heritage 2018, 33, 125–144. [Google Scholar] [CrossRef] [Green Version]
  16. Rayne, L.; Gatto, M.; Abdulaati, L.; Al-Haddad, M.; Sterry, M.; Sheldrick, N.; Mattingly, D. Detecting Change at Archaeological Sites in North Africa Using Open-Source Satellite Imagery. Remote. Sens. 2020, 12, 3694. [Google Scholar] [CrossRef]
  17. Karaucak, M.; Steiniger, D.; Boroffka, N. A remote sensing-based survey of archaeological/heritage sites near Kandahar, Afghanistan through publicly available satellite imagery. PLoS ONE 2021, 16, e0259228. [Google Scholar] [CrossRef] [PubMed]
  18. Agapiou, A.; Alexakis, D.D.; Lysandrou, V.; Sarris, A.; Cuca, B.; Themistocleous, K.; Hadjimitsis, D. Impact of urban sprawl to cultural heritage monuments: The case study of Paphos area in Cyprus. J. Cult. Heritage 2015, 16, 671–680. [Google Scholar] [CrossRef]
  19. Ezcurra, P.; Rivera-Collazo, I.C. An assessment of the impacts of climate change on Puerto Rico’s Cultural Heritage with a case study on sea-level rise. J. Cult. Heritage 2018, 32, 198–209. [Google Scholar] [CrossRef]
  20. Agapiou, A.; Alexakis, D.D.; Hadjimitsis, D.G. Potential of Virtual Earth Observation Constellations in Archaeological Research. Sensors 2019, 19, 4066. [Google Scholar] [CrossRef] [Green Version]
  21. Howey, M. Harnessing Remote Sensing Derived Sea Level Rise Models to Assess Cultural Heritage Vulnerability: A Case Study from the Northwest Atlantic Ocean. Sustainability 2020, 12, 9429. [Google Scholar] [CrossRef]
  22. Westley, K.; Andreou, G.; El Safadi, C.; Huigens, H.O.; Nikolaus, J.; Ortiz-Vazquez, R.; Ray, N.; Smith, A.; Tews, S.; Blue, L.; et al. Climate change and coastal archaeology in the Middle East and North Africa: Assessing past impacts and future threats. J. Isl. Coast. Archaeol. 2021, 1–33. [Google Scholar] [CrossRef]
  23. Gavin, M.C.; McCarter, J.; Mead, A.; Berkes, F.; Stepp, J.R.; Peterson, D.; Tang, R. Defining biocultural approaches to conservation. Trends Ecol. Evol. 2015, 30, 140–145. [Google Scholar] [CrossRef] [PubMed]
  24. Lindholm, K.-J.; Ekblom, A. A framework for exploring and managing biocultural heritage. Anthropocene 2019, 25, 100195. [Google Scholar] [CrossRef]
  25. Eriksson, O. What is biological cultural heritage and why should we care about it? An example from Swedish rural landscapes and forests. Nat. Conserv. 2018, 28, 1–32. [Google Scholar] [CrossRef]
  26. Vuorio, V.; Muchiru, A.; Reid, R.S.; Ogutu, J.O. How pastoralism changes savanna vegetation: Impact of old pastoral settlements on plant diversity and abundance in south-western Kenya. Biodivers. Conserv. 2014, 23, 3219–3240. [Google Scholar] [CrossRef]
  27. Fraser, J.; Leach, M.; Fairhead, J. Anthropogenic Dark Earths in the Landscapes of Upper Guinea, West Africa: Intentional or Inevitable? Ann. Assoc. Am. Geogr. 2014, 104, 1222–1238. [Google Scholar] [CrossRef] [Green Version]
  28. Ekblom, A.; Shoemaker, A.; Gillson, L.; Lane, P.; Lindholm, K.-J. Conservation through Biocultural Heritage—Examples from Sub-Saharan Africa. Land 2019, 8, 5. [Google Scholar] [CrossRef] [Green Version]
  29. Tiki, W.; Oba, G.; Tvedt, T. Human stewardship or ruining cultural landscapes of the ancient Tula wells, southern Ethiopia. Geogr. J. 2011, 177, 62–78. [Google Scholar] [CrossRef]
  30. Tiki, W.; Oba, G. Righting the Wrongs: Contesting Water Property Rights in Southern Ethiopia. Hum. Ecol. 2017, 45, 723–734. [Google Scholar] [CrossRef]
  31. Yerian, S.; Hennink, M.; Greene, L.E.; Kiptugen, D.; Buri, J.; Freeman, M.C. The Role of Women in Water Management and Conflict Resolution in Marsabit, Kenya. Environ. Manag. 2014, 54, 1320–1330. [Google Scholar] [CrossRef] [PubMed]
  32. Robinson, L.W.; Sinclair, J.A.; Spaling, H. Traditional pastoralist decision-making processes: Lessons for reforms to water resources management in Kenya. J. Environ. Plan. Manag. 2010, 53, 847–862. [Google Scholar] [CrossRef]
  33. King-Okumu, C.; Jillo, B.; Kinyanjui, J.; Jarso, I. Devolving water governance in the Kenyan Arid Lands: From top-down drought and flood emergency response to locally driven water resource development planning. Int. J. Water Resour. Dev. 2018, 34, 675–697. [Google Scholar] [CrossRef]
  34. Stiles, D. The Gabbra: Traditional Social Factors in Aspects of Land-Use Management. Nomadic Peoples 1992, 30, 41–52. [Google Scholar]
  35. Stiles, D.; Munro-Hay, S.C. Stone cairn burials at Kokurmatakore, northern Kenya. Azania:Journ. British Inst. E. Afr. 1981, 16, 151–166. [Google Scholar] [CrossRef]
  36. Tablino, P. Gabra: Camel Nomads of Northern Kenya; Kolbe Press: Limuru, Kenya, 1999. [Google Scholar]
  37. Sobania, N.W. The Historical Tradition of the Peoples of the Eastern Lake Turkana Basin c. 1840–1925. Ph.D. Thesis, School of Oriental and African Studies (SOAS), University of London, London, UK, 1980. [Google Scholar]
  38. Kassam, A.; Bashuna, A.B. Marginalisation of the Waata Oromo Hunter–Gatherers of Kenya: Insider and Outsider Perspectives. Africa 2004, 74, 194–216. [Google Scholar] [CrossRef]
  39. Turton, E.R. Bantu, Galla and Somali migrations in the Horn of africa: A reassessment of the Juba/Tana area. J. Afr. Hist. 1975, 16, 519–537. [Google Scholar] [CrossRef]
  40. Tiki, W.; Oba, G.; Tvedt, T. An indigenous time-related framework for reconstructing the impact of disasters on ancient water systems in southern Ethiopia, 1560–1950. J. Hist. Geogr. 2013, 41, 33–43. [Google Scholar] [CrossRef]
  41. Tiki, W. The Dynamics of the Ancient Tula Wells Cultural Landscape: Environmental and Social History, ca. 1560 to the Present. Ph.D. Thesis, Norwegian University of Life Sciences, Ås, Norway, 2010. Available online: https://nmbu.brage.unit.no/nmbu-xmlui/handle/11250/2431962 (accessed on 20 August 2021).
  42. Hazard, B.; Adongo, C. “Green Grabbing,” Pastoralism and Environmental Dynamics in Northern Kenya. An As-sessment of Conservation Models and Practices in Marsabit County. East Afr. Revie 2015, 50, 40–62. [Google Scholar] [CrossRef]
  43. Hill, R.; Cullen-Unsworth, L.C.; Talbot, L.D.; McIntyre-Tamwoy, S. Empowering Indigenous peoples’ biocultural diversity through World Heritage cultural landscapes: A case study from the Australian humid tropical forests. Int. J. Heritage Stud. 2011, 17, 571–591. [Google Scholar] [CrossRef] [Green Version]
  44. Cevasco, R.; Moreno, D.; Hearn, R. Biodiversification as an historical process: An appeal for the application of historical ecology to bio-cultural diversity research. Biodivers. Conserv. 2015, 24, 3167–3183. [Google Scholar] [CrossRef]
  45. Rotherham, I. Bio-cultural heritage and biodiversity: Emerging paradigms in conservation and planning. Biodivers. Conserv. 2015, 24, 3405–3429. [Google Scholar] [CrossRef] [Green Version]
  46. Cormack, Z. The promotion of pastoralist heritage and alternative ‘visions’ for the future of Northern Kenya. J. East. Afr. Stud. 2016, 10, 548–567. [Google Scholar] [CrossRef]
  47. Kihonge, E.W. Assessing Contribution of Sacred Natural Sites to Climate Change Effects on Dryland Ecosystem Case Study: The Gabbra Community Marsabit County, Nairobi. Ph.D. Thesis, University of Nairobi, Nairobi, Kenya, 2017. [Google Scholar]
  48. Haile, G.; Assen, M.; Ebro, A. Land Use/Cover Dynamics and Its Implications since the 1960s in the Borana Rangelands of Southern Ethiopia. Livest. Res. Rural Dev. 2010, 22, 132. [Google Scholar]
  49. Abate, T.; Angassa, A. Conversion of savanna rangelands to bush dominated landscape in Borana, Southern Ethiopia. Ecol. Process. 2016, 5, 1–18. [Google Scholar] [CrossRef] [Green Version]
  50. Habtamu, T.; Casper, I.M.; Joel, O.B.; Abubeker, H.; Ayana, A.; Yared, M. Evaluation of land use land cover changes using remote sensing Landsat images and pastoralists perceptions on range cover changes in Borana rangelands, Southern Ethiopia. Int. J. Biodivers. Conserv. 2018, 10, 1–11. [Google Scholar] [CrossRef] [Green Version]
  51. Maina, P.M.; Inwati, A.T. Use of Geoinformation Technology in Assessing Nexus between Ecosystem Changes and Wildlife Distribution: A Case Study of Mt. Marsabit Forest. Int. J. Sci. Res. 2015, 4, 718–724. [Google Scholar]
  52. Muhati, G.L.; Olago, D.; Olaka, L. Land use and land cover changes in a sub-humid Montane forest in an arid setting: A case study of the Marsabit forest reserve in northern Kenya. Glob. Ecol. Conserv. 2018, 16, e00512. [Google Scholar] [CrossRef]
  53. Hosonuma, N.; Herold, M.; De Sy, V.; De Fries, R.S.; Brockhaus, M.; Verchot, L.; Angelsen, A.; Romijn, E. An assessment of deforestation and forest degradation drivers in developing countries. Environ. Res. Lett. 2012, 7, 044009. [Google Scholar] [CrossRef]
  54. Lindquist, E.J.; D’annunzio, R.; Gerrand, A.; Macdicken, K.; Achard, F.; Beuchle, R.; Brink, A.; Eva, H.D.; Mayaux, P.; San-Miguel-Ayanz, J.; et al. Global Forest Land-Use Change 1990–2005; Forestry Paper 169; FAO: Rome, Italy, 2012. [Google Scholar]
  55. Ayugi, B.; Wen, W.; Chepkemoi, D. Analysis of Spatial and Temporal Patterns of Rainfall Variations over Kenya. Environmen. Earth Sci. 2016, 6, 69–83. [Google Scholar]
  56. Luseno, W.K.; McPeak, J.G.; Barrett, C.; Little, P.D.; Gebru, G. Assessing the Value of Climate Forecast Information for Pastoralists: Evidence from Southern Ethiopia and Northern Kenya. World Dev. 2003, 31, 1477–1494. [Google Scholar] [CrossRef] [Green Version]
  57. Little, P.D.; Smith, K.; Cellarius, B.A.; Coppock, D.L.; Barrett, C. Avoiding Disaster: Diversification and Risk Management among East African Herders. Dev. Chang. 2001, 32, 401–433. [Google Scholar] [CrossRef]
  58. McPeak, J.G.; Barrett, C.B. Differential Risk Exposure and Stochastic Poverty Traps Among East African Pastoralists. Am. J. Agric. Econ. 2001, 83, 674–679. [Google Scholar] [CrossRef]
  59. Rengarajan, R.; Choate, M.; Storey, J.; Franks, S.; Micijevic, E. Landsat Collection-2 geometric calibration updates. In Earth Observing Systems XXV; International Society for Optics and Photonics: Washington, DC, USA, 2020; Volume 11501, p. 115010N. [Google Scholar]
  60. Funk, C.; Peterson, P.; Landsfeld, M.; Pedreros, D.; Verdin, J.; Shukla, S.; Husak, G.; Rowland, J.; Harrison, L.; Hoell, A.; et al. The climate hazards infrared precipitation with stations—A new environmental record for monitoring extremes. Sci. Data 2015, 2, 150066. [Google Scholar] [CrossRef] [Green Version]
  61. Adelabu, S.; Mutanga, O.; Adam, E. Testing the reliability and stability of the internal accuracy assessment of random forest for classifying tree defoliation levels using different validation methods. Geocarto Int. 2015, 30, 810–821. [Google Scholar] [CrossRef]
  62. Breiman, L. Random Forests. Mach. Learn. 2001, 45, 5–32. [Google Scholar] [CrossRef] [Green Version]
  63. Horning, N. Random Forests: An Algorithm for Image Classification and Generation of Continuous Fields Data Sets. International Conference on Geoinformatics for Spatial Infrastructure Development in Earth and Allied Sciences. 2010. Available online: http://wgrass.media.osaka-cu.ac.jp/gisideas10/papers/04aa1f4a8beb619e7fe711c29b7b.pdf (accessed on 12 August 2021).
  64. Belgiu, M.; Drăguţ, L. Random forest in remote sensing: A review of applications and future directions. ISPRS J. Photogramm. Remote Sens. 2016, 114, 24–31. [Google Scholar] [CrossRef]
  65. Nex, F.; Delucchi, L.; Gianelle, D.; Neteler, M.; Remondino, F.; Dalponte, M. Land Cover Classification and Monitoring: The STEM Open Source Solution. Eur. J. Remote. Sens. 2015, 48, 811–831. [Google Scholar] [CrossRef]
  66. Hassan, Z.; Shabbir, R.; Ahmad, S.S.; Malik, A.H.; Aziz, N.; Butt, A.; Erum, S. Dynamics of land use and land cover change (LULCC) using geospatial techniques: A case study of Islamabad Pakistan. SpringerPlus 2016, 5, 1–11. [Google Scholar] [CrossRef] [PubMed] [Green Version]
  67. Wiley StatsRef: Statistics Reference Online; Wiley: Hoboken, NJ, USA, 2014.
  68. Morris, E.K.; Caruso, T.; Buscot, F.; Fischer, M.; Hancock, C.; Maier, T.S.; Meiners, T.; Müller, C.; Obermaier, E.; Prati, D.; et al. Choosing and using diversity indices: Insights for ecological applications from the German Biodiversity Exploratories. Ecol. Evol. 2014, 4, 3514–3524. [Google Scholar] [CrossRef] [Green Version]
  69. McGarigal, K.S.; Cushman, S.; Neel, M.; Ene, E. FRAGSTATS: Spatial Pattern Analysis Program for Categorical Maps. 2002. Available online: https://www.ipcc.ch/site/assets/uploads/sites/4/2019/11/07_Chapter-4.pdf (accessed on 15 December 2021).
  70. Olsson, L.; Barbosa, H.; Bhadwal, S.; Cowie, A.; Delusca, K.; Flores-Renteria, D.; Hermans, K.; Jobbagy, E.; Kurz, W.; Li, D.; et al. 2019: Land Degradation. In Climate Change and Land: An IPCC Special Report on Climate Change, Desertification, Land Degradation, Sustainable Land Management, Food Security, and Greenhouse Gas Fluxes in Terrestrial Ecosystems; Shukla, P.R., Skea, J., Buendia, E.C., Masson-Delmotte, V., Pörtner, H.-O., Roberts, D.C., Zhai, P., Slade, R., Connors, S., van Diemen, R., et al., Eds.; in press; Available online: https://www.ipcc.ch/site/assets/uploads/sites/4/2019/11/07_Chapter-4.pdf (accessed on 15 December 2021).
  71. Mgalula, M.E. Assessing Trends in Land Use Change in the Borana Rangeland Ethiopia as One Cause of Greenhouse Gas Emissions and Carbon Sequestration Variations. Ph.D. Thesis, University of Kassel, Kassel, Germany, 2016. [Google Scholar]
  72. Hazard, B.; Adongo, C.; Adano, W.; Ledant, M. Comprehensive Study of Pastoral Livelihoods, WASH and Natural Resource Managment in Northern Marsabit; IFRA: Nairobi, Kenya, 2012. [Google Scholar] [CrossRef]
  73. M’Mbogori, F.; Kinyua, M.; Gufu, A.; Lane, P.J. Changes to Water Management and Declining Pastoral Economic Resilience in Northern Kenya: The Example of Gabra Wells. WIREs Water 2022, in press.
  74. Robinson, L.W. Participatory Development and the Capacity of Gabra Pastoralist Communities to Influence Resilience; Manitoba University: Winnipeg, MB, Canada, 2009. [Google Scholar]
  75. Witsenburg, K.M.; Roba, A.W. Surviving Pastoral Decline: Pastoral Sedentarisation, Natural Resource Management and Livelihood Diversification in Marsabit District, Northern Kenya Deel. Ph.D. Thesis, Amsterdam Institute for Social Science Research (AISSR), Amsterdam, The Netherlands, 2004. [Google Scholar]
  76. Filho, W.L.; Totin, E.; Franke, J.A.; Andrew, S.M.; Abubakar, I.R.; Azadi, H.; Nunn, P.D.; Ouweneel, B.; Williams, P.A.; Simpson, N.P. Understanding responses to climate-related water scarcity in Africa. Sci. Total. Environ. 2021, 806, 150420. [Google Scholar] [CrossRef] [PubMed]
Figure 1. Location of the study area in Southern Ethiopia (Borana) and Northern Kenya (Marsabit).
Remotesensing 14 00314 g001
Figure 2. Google Earth imagery of Ethiopian and Kenyan well clusters (a) Dubluq tula well cluster 15 December 2020, (b) El Hadi well cluster 5 July 2013.
Remotesensing 14 00314 g002
Figure 3. Landscape setting and examples of operational and disused Gabra wells at El Hadi, N. Kenya. (a) Landscape setting of the wells, (b) Collapsed well, (c) Operational well, (d) Enclosed well. Photos: Paul Lane & Freda M’Mbogori, 2019.
Remotesensing 14 00314 g003
Figure 4. Distribution of well clusters in the area of interest.
Remotesensing 14 00314 g004
Figure 5. Average annual precipitation for the years 1990–2020 in the Marsabit region (blue) and in the Borana region (orange) (Source: CHIRPS dataset (Funk et al., 2015)).
Remotesensing 14 00314 g005
Figure 6. Classified land cover maps for: (a) 1990, (b) 2001, (c) 2011 and (d) 2020.
Remotesensing 14 00314 g006
Figure 7. LULC change magnitudes shown as a percentage from 1990 to 2020 for the Northern Kenya/Southern Ethiopia study region.
Remotesensing 14 00314 g007
Figure 8. Mean SHDI within a 15 km buffer zone of Marsabit wells clusters in the Northern Kenya/Southern Ethiopia study region. The y-axis indicates the SHDI values while the x-axis indicates the year.
Remotesensing 14 00314 g008
Figure 9. Mean SHDI within a 15 km buffer zone of the tula wells clusters in the Northern Kenya/Southern Ethiopia study region. The y-axis indicates the SHDI values while the x-axis indicates the year. The figures have been separated into four frames for ease of visibility.
Remotesensing 14 00314 g009
Figure 10. Number of cells for the urban/settlement and croplands land cover classes within the Anole wells cluster shows increasing areal coverage through the years.
Remotesensing 14 00314 g010
Figure 11. Number of cells for the urban/settlement and croplands land cover classes within the Erdar wells cluster shows increasing areal cover through the years.
Remotesensing 14 00314 g011
Table 1. Confusion classification matrix for the landscape classes in the Northern Kenya/Southern Ethiopia study region mapped using the Landsat 5 TM composite images for 1990, and using random forest as a classifier.
BareBuilt UpCrop-offCrop-onGrassShrubsClosed TreesWaterOpen TreesTotalUA%
Bare2036000000002036100
Built Up261489000000075065.20
Crop-off00501021000052295.98
Crop-on000360360002141786.33
Grass001088114490093165087.82
Shrubs42301401504010030101839.39
Closed trees000117009556052972598.26
Water00000004350435100
Open trees010051531703525357598.60
Total272049962356316714049573444363120,128
PA%74.859880.4263.9486.7199.2699.8297.9797.08
OA%93.04%
Kappa88.06%
Table 2. Confusion classification matrix for the landscape classes in the Northern Kenya/Southern Ethiopia study region mapped using the Landsat 7 ETM+ composite images for 2001, and using random forest as a classifier.
BareBuilt UpCrop-offCrop-onGrassShrubsClosed TreesWaterOpen TreesTotalUA%
Bare13,27518000000013,29399.86
Built Up63613499000000199467.65
Crop-off045150327450000162092.78
Crop-on00453067206301550161.08
Grass000273414048605393286.83
Shrubs12700011671551032104168.68
Closed trees0000003330017334799.49
Water00000001380138100
Open trees0002515524202215234994.3
Total14,0381412155738536627673972138228428,215
PA%94.5695.5496.5379.4893.2393.2283.8410096.98
OA%93.15%
Kappa89.59%
Table 3. Confusion classification matrix for the landscape classes in the Northern Kenya/Southern Ethiopia study region mapped using the Landsat 7 ETM+ composite images for 2011, and using random forest as a classifier.
BareBuilt UpCrop-offCrop-onGrassShrubsClosed TreesWaterOpen TreesTotalUA%
Bare72,038450001800072,10199.91
Built Up10212470000000134992.44
Crop-off02715449900011160096.50
Crop-on00044469014603269164.25
Grass000109210,00809003511,22589.16
Shrubs30306115288906151256.25
Closed trees0001890034680102375992.26
Water0000180025680258699.30
Open trees000025307203263339096.25
Total72,17013221544174010,24433637852568350497,213
PA%99.8294.3310025.5297.785.7191.6210093.12
OA%97.59%
Kappa92.89%
Table 4. Confusion classification matrix for the landscape classes in the Northern Kenya/Southern Ethiopia study region mapped using the Landsat 8 OLI composite images for 2020, and using random forest as a classifier.
BareBuilt UpCrop-offCrop-onGrassShrubsClosed TreesWaterOpen TreesTotalUA%
Bare1591000000001591100
Built Up0152100460000156797.06
Crop-off00703000007395.89
Crop-on0005126551203512839.84
Grass0015013,458091211413,60898.9
Shrubs0210102271501807950529.7
Closed trees0000008370095846598.88
Water0000180034230344199.48
Open trees0130651153515602578296287.04
Total159115558512913,89024085653435290132,340
PA%10097.8182.3539.5396.8962.597.7299.6588.87
OA%96.37%
Kappa91.89%
Table 5. Land cover distribution in km2 for the years 1990 to 2020 for the Northern Kenya/Southern Ethiopia study region.
LULCArea (km2)-1990Area (km2)-2001Area (km2)-2011Area (km2)-2020
Croplands47.47426.67419.56524.43
Trees-closed10,043.0260632262.532350.89
Grasslands36,913.7136,704.1336,555.6536,312.4
Shrubs9420.629769.412,324.1512,664.61
Water14.8914.714.0342.69
Trees-open20,981.3524,434.1224,505.4724,488.01
Urban9.3515.6120.328.41
Bare1372.821375.952701.92393.21
Publisher’s Note: MDPI stays neutral with regard to jurisdictional claims in published maps and institutional affiliations.

