

MSCNet: A Multilevel Stacked Context Network for Oriented Object Detection in Optical Remote Sensing Images

Abstract
:1. Introduction
- 1
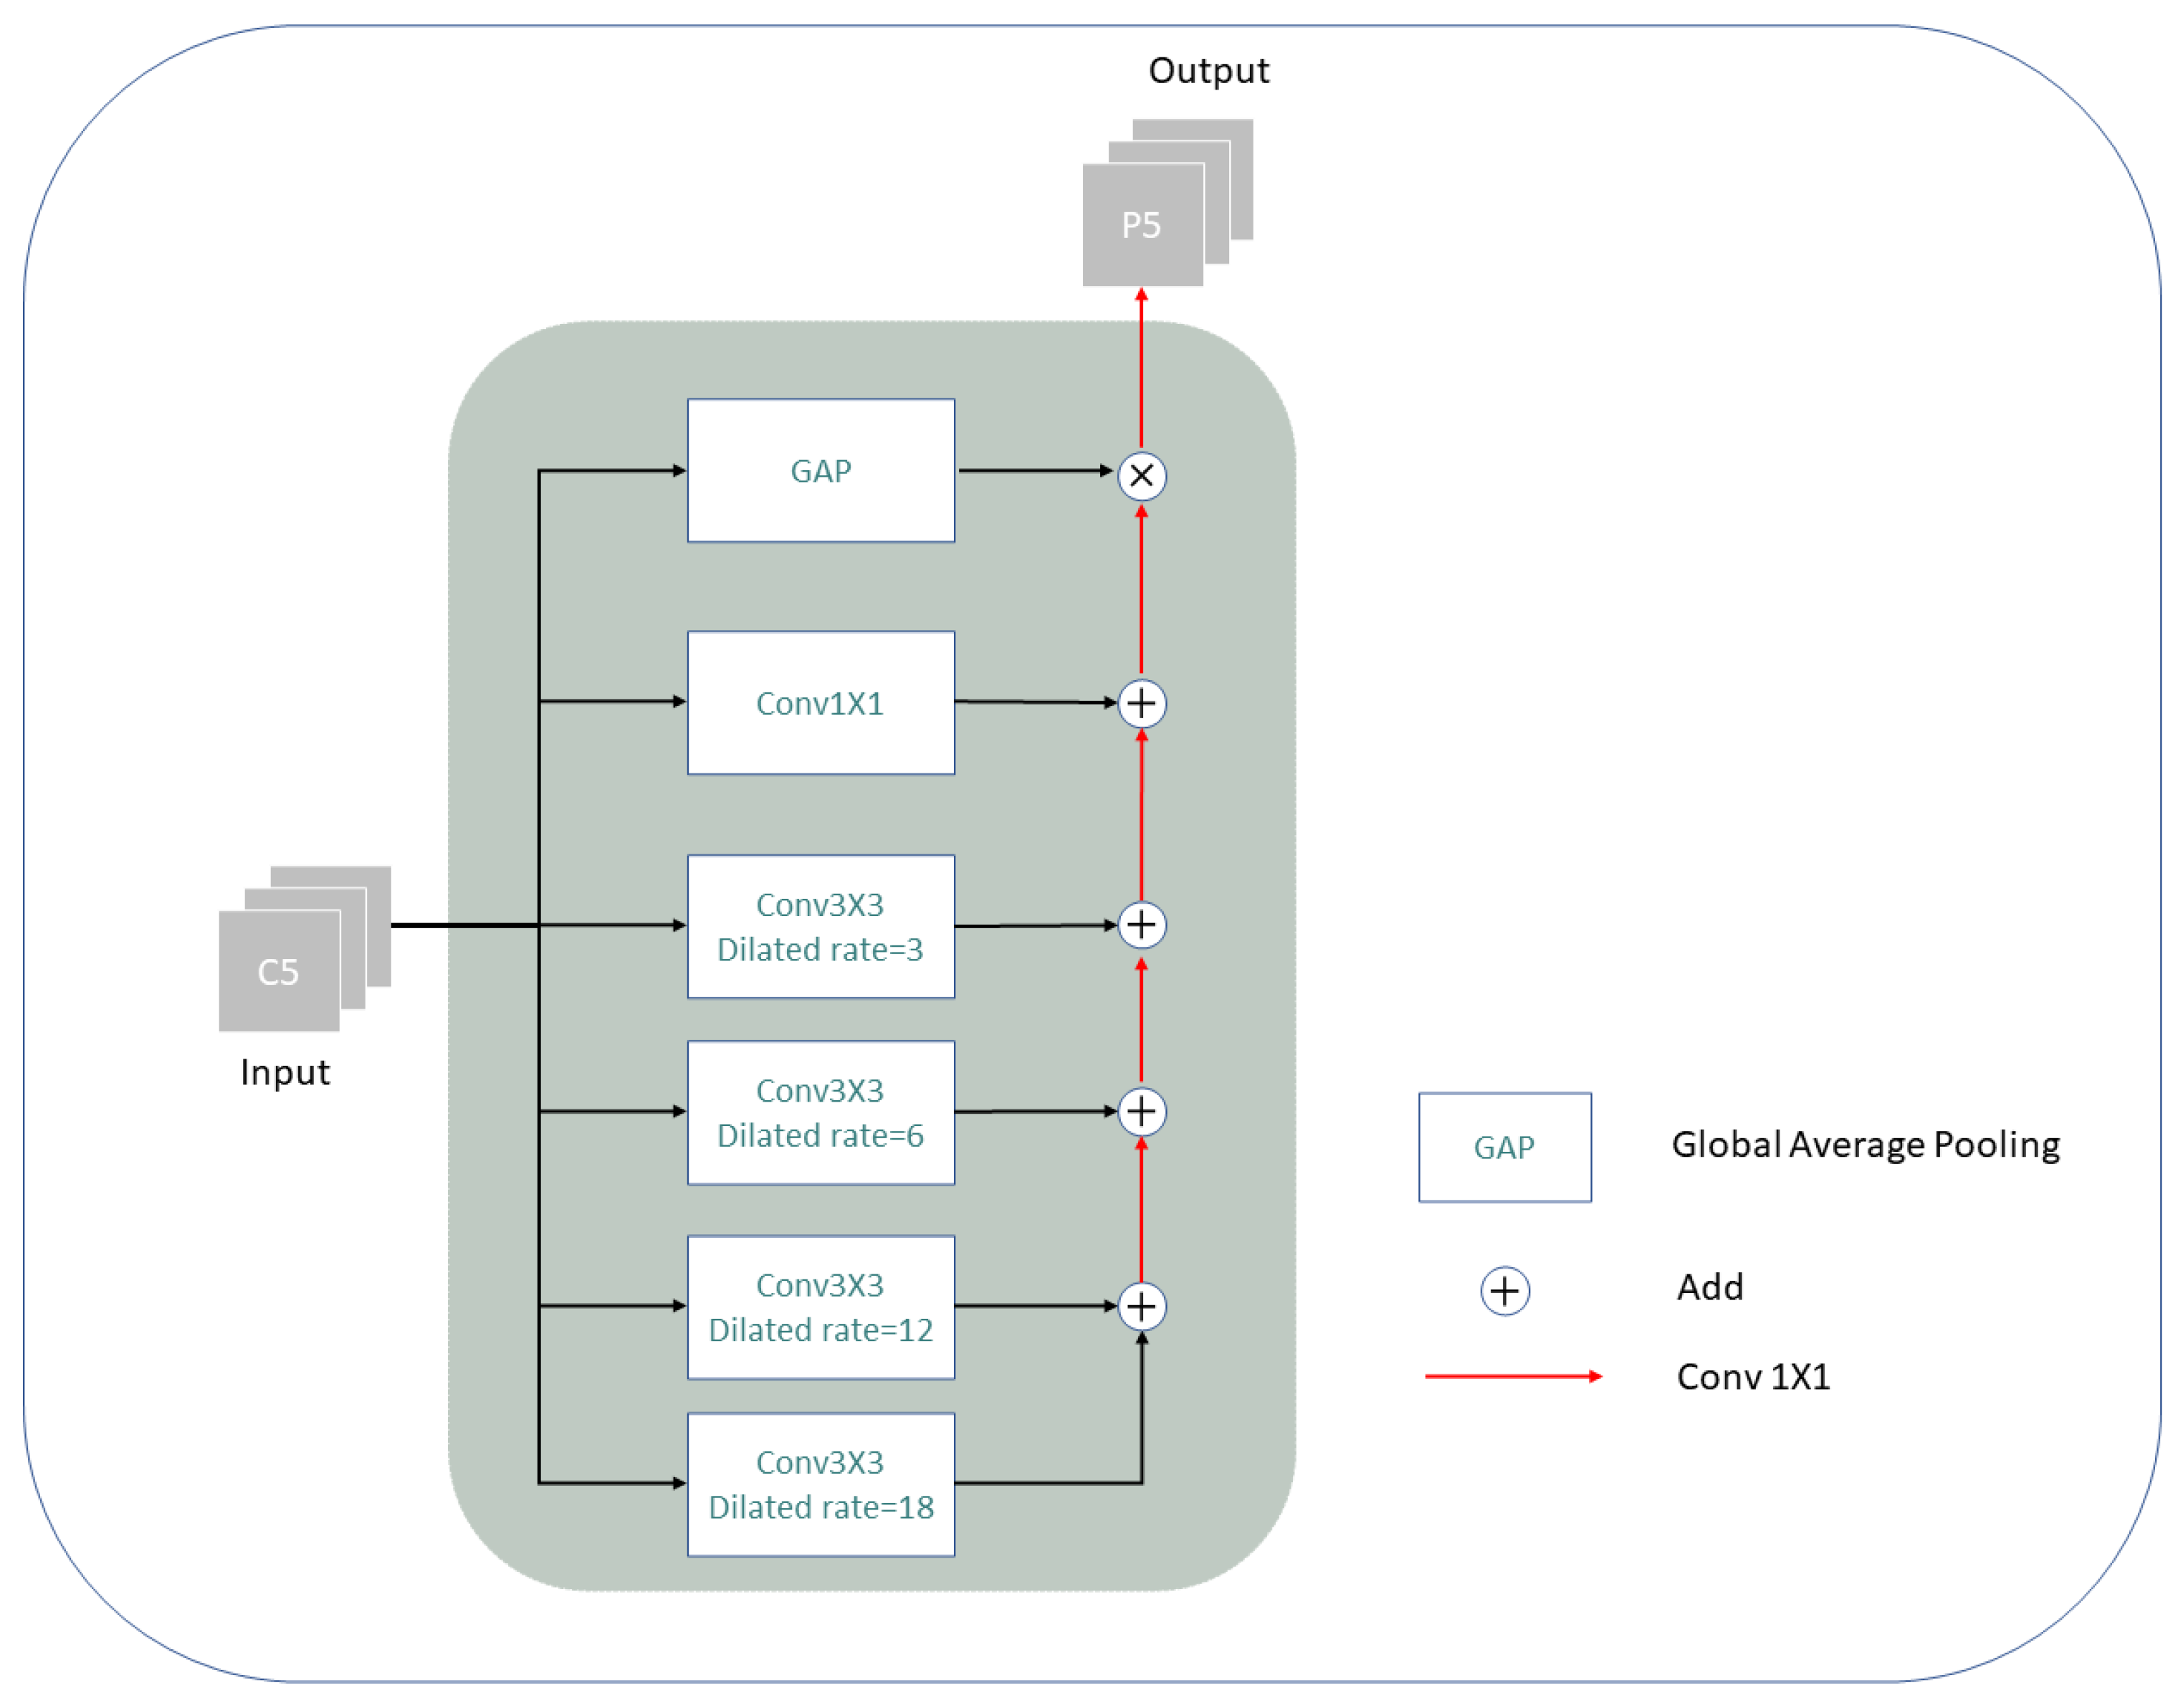
- An effective multilevel stacked semantic acquisition and enhancement module is proposed to enhance the representation of the FPN on remote sensing images.
- 2
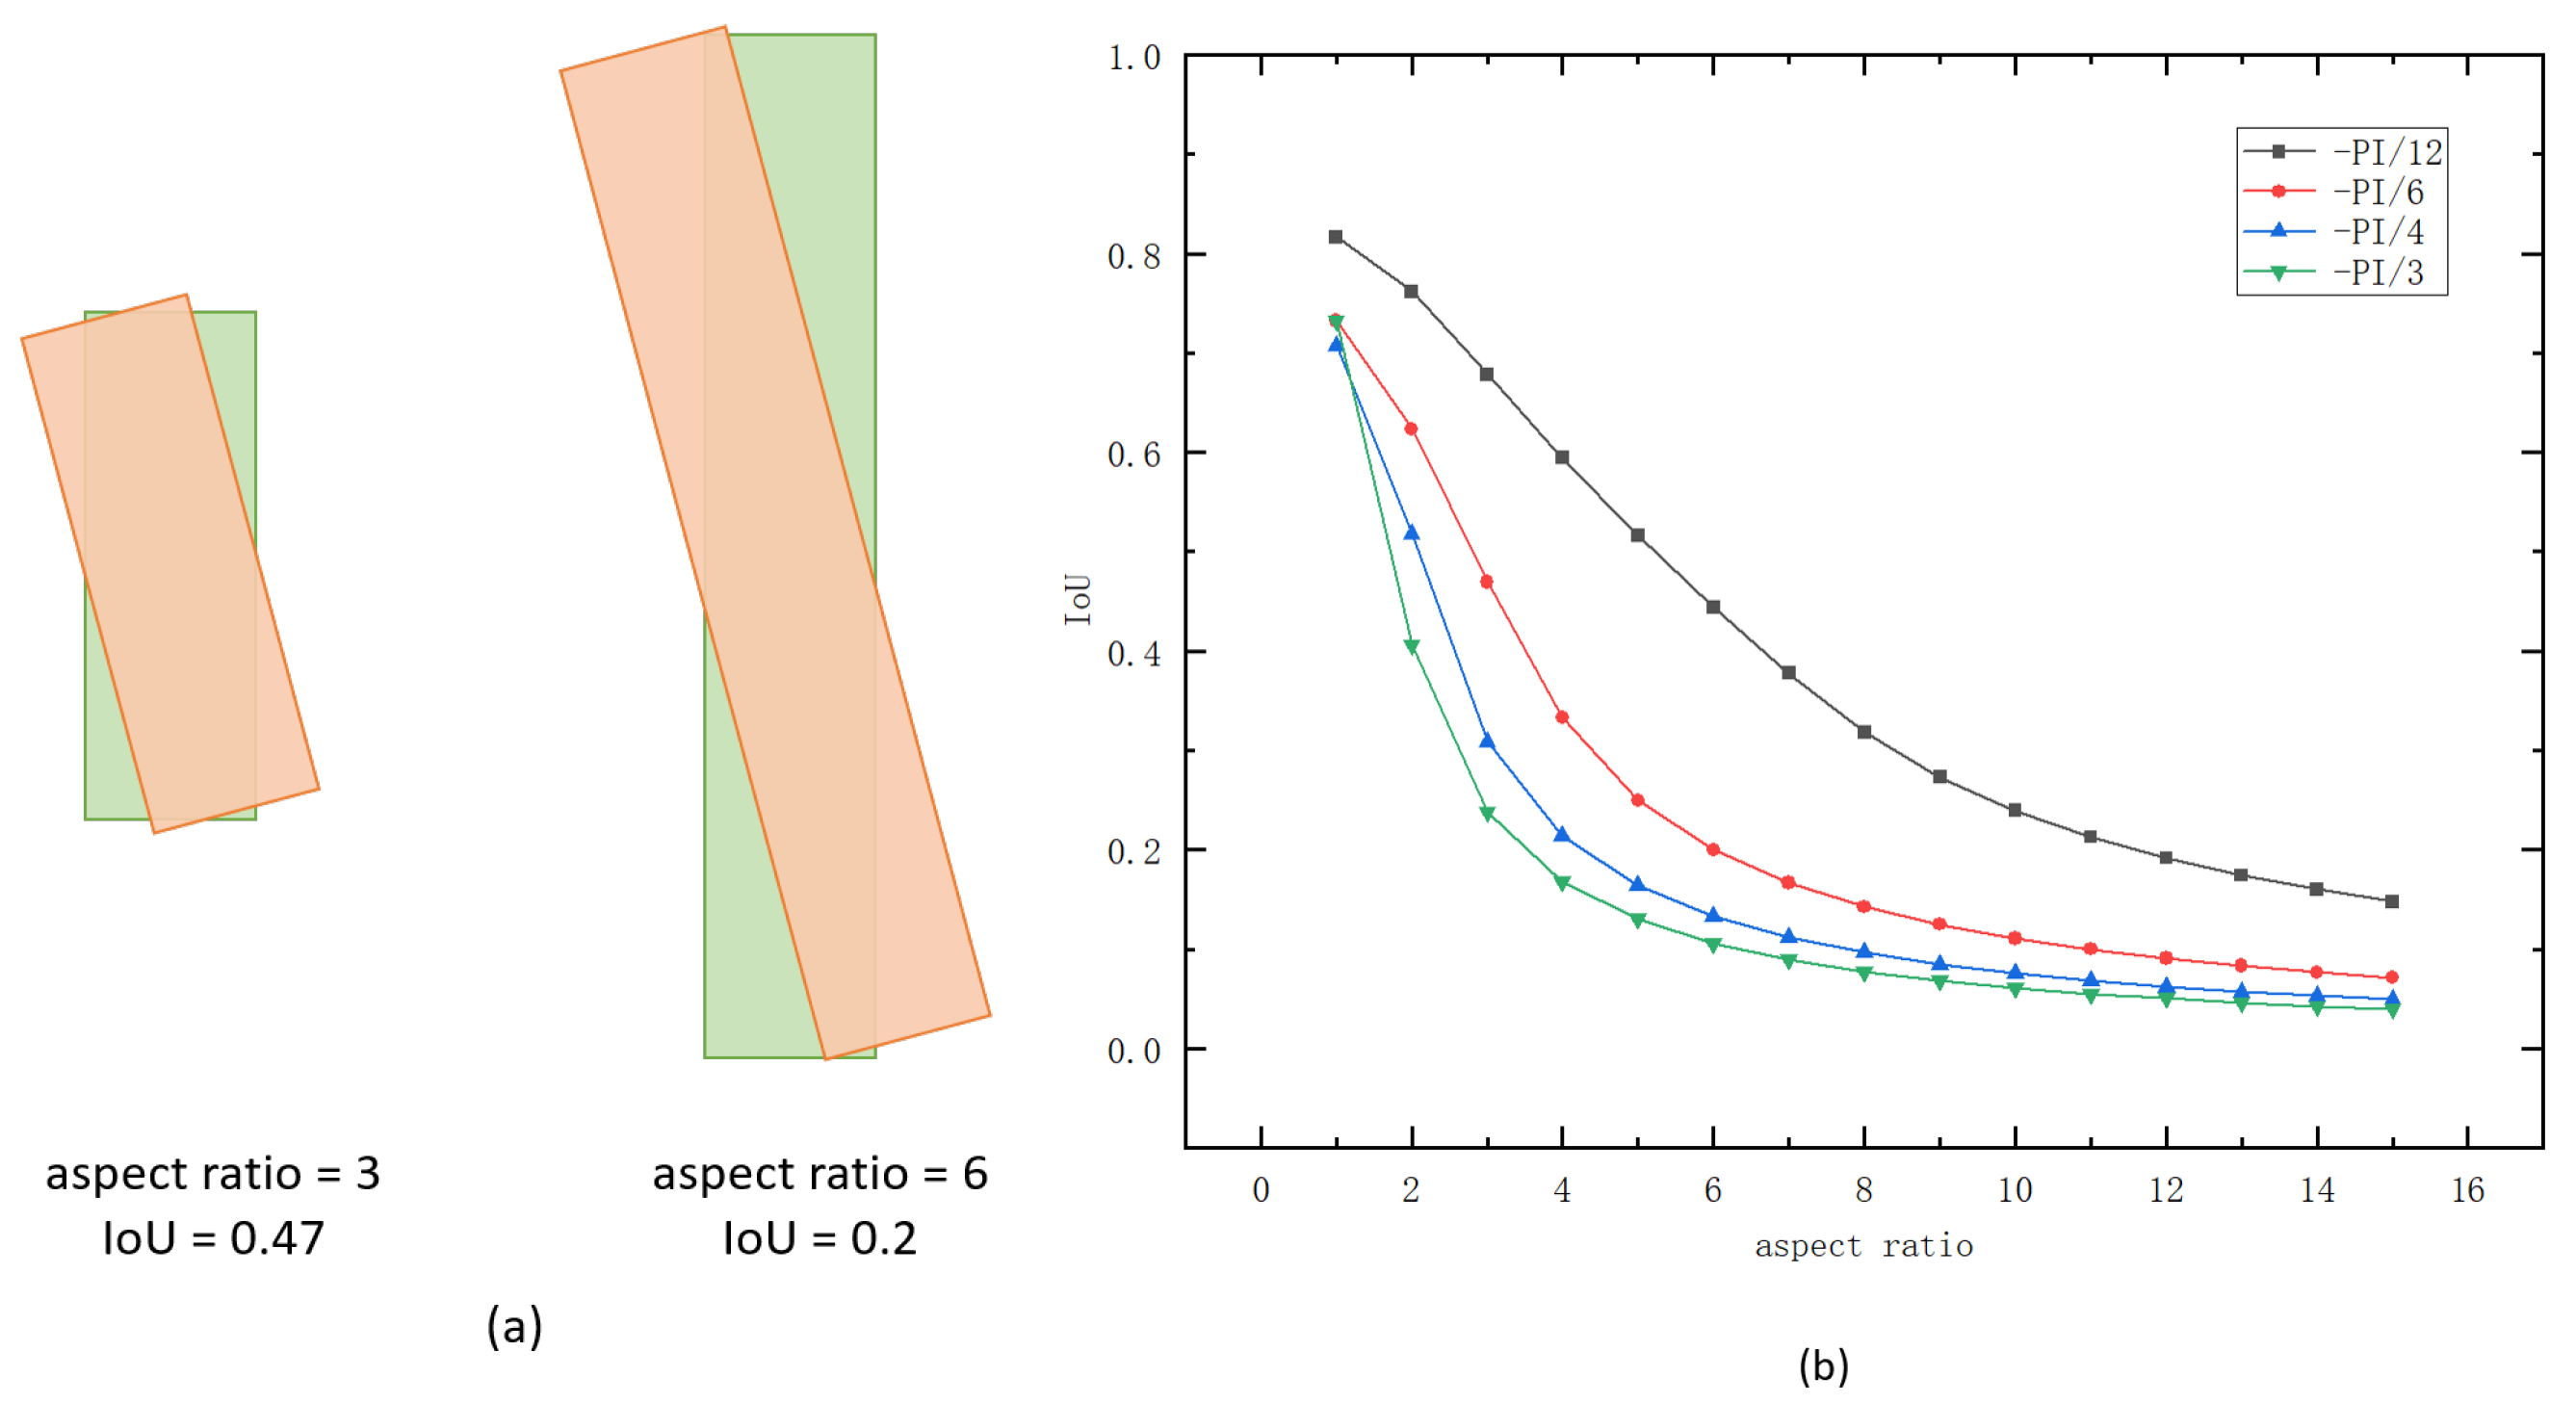
- The Gaussian Wasserstein distance loss is used to alleviate the criticality problems caused by the traditional oriented bounding box representation.
- 3
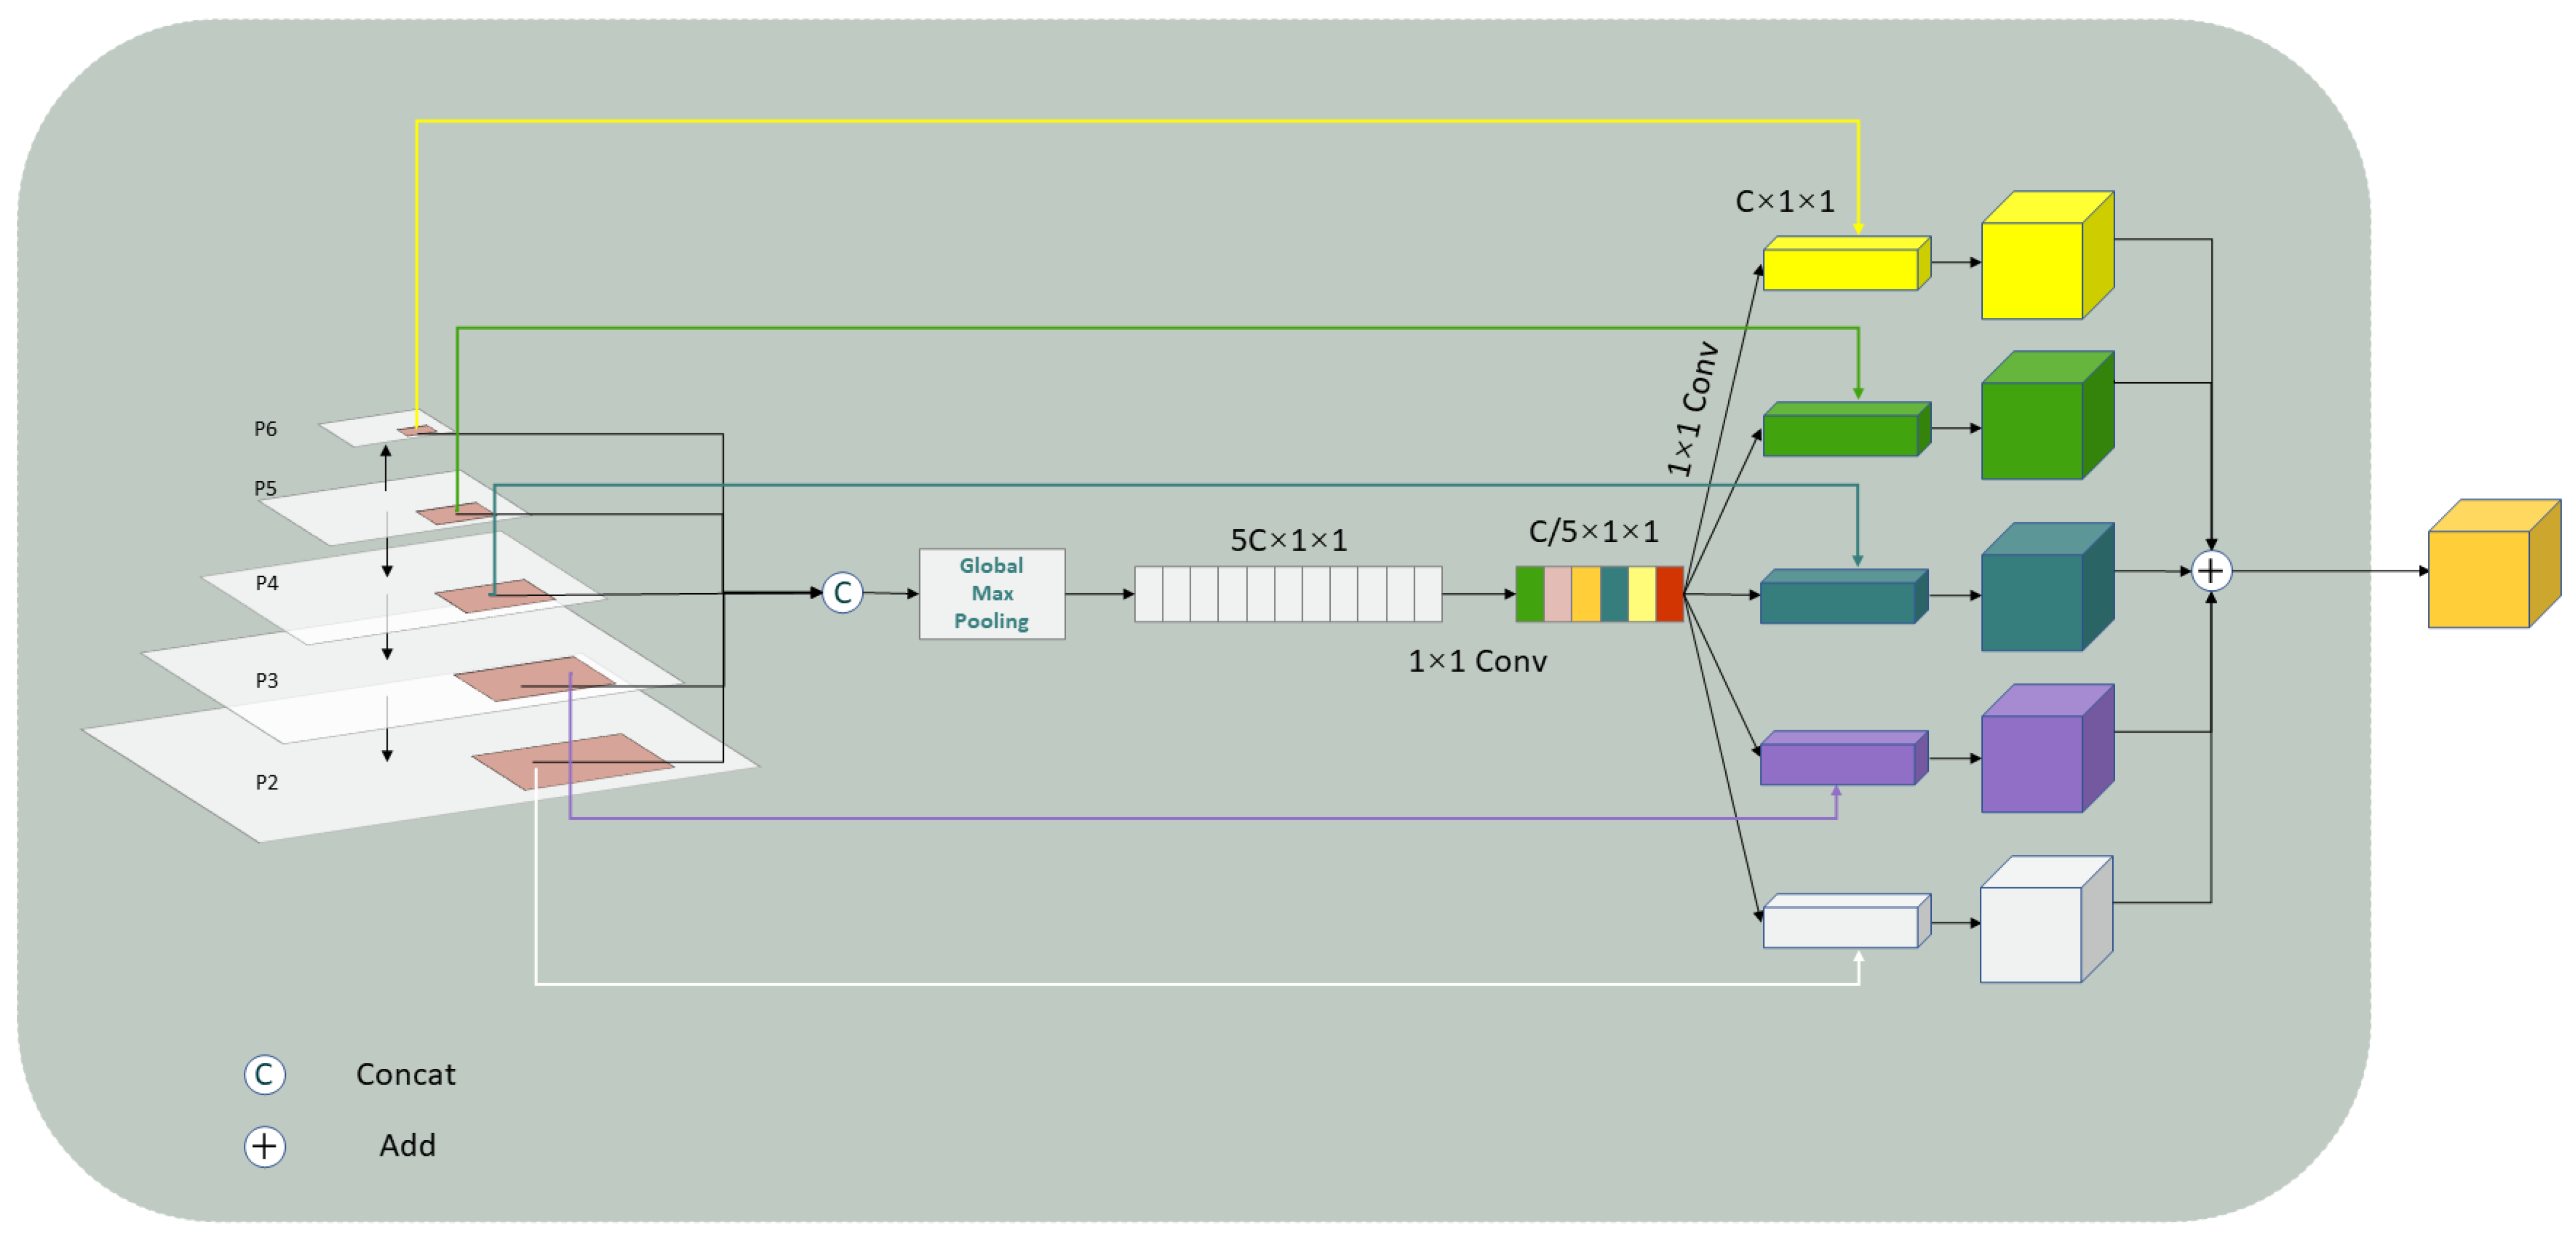
- An improved RoI allocation strategy is used to enhance FPN multilevel information aggregation, which improves the detection performance of multiscale targets by using a multichannel weighted fusion structure instead of a single layer allocation strategy.
2. Related Work
2.1. Anchor-Based Object Detectors
2.2. Anchor-Free Object Detectors
2.3. Arbitrarily Oriented Object Detectors
3. Methods
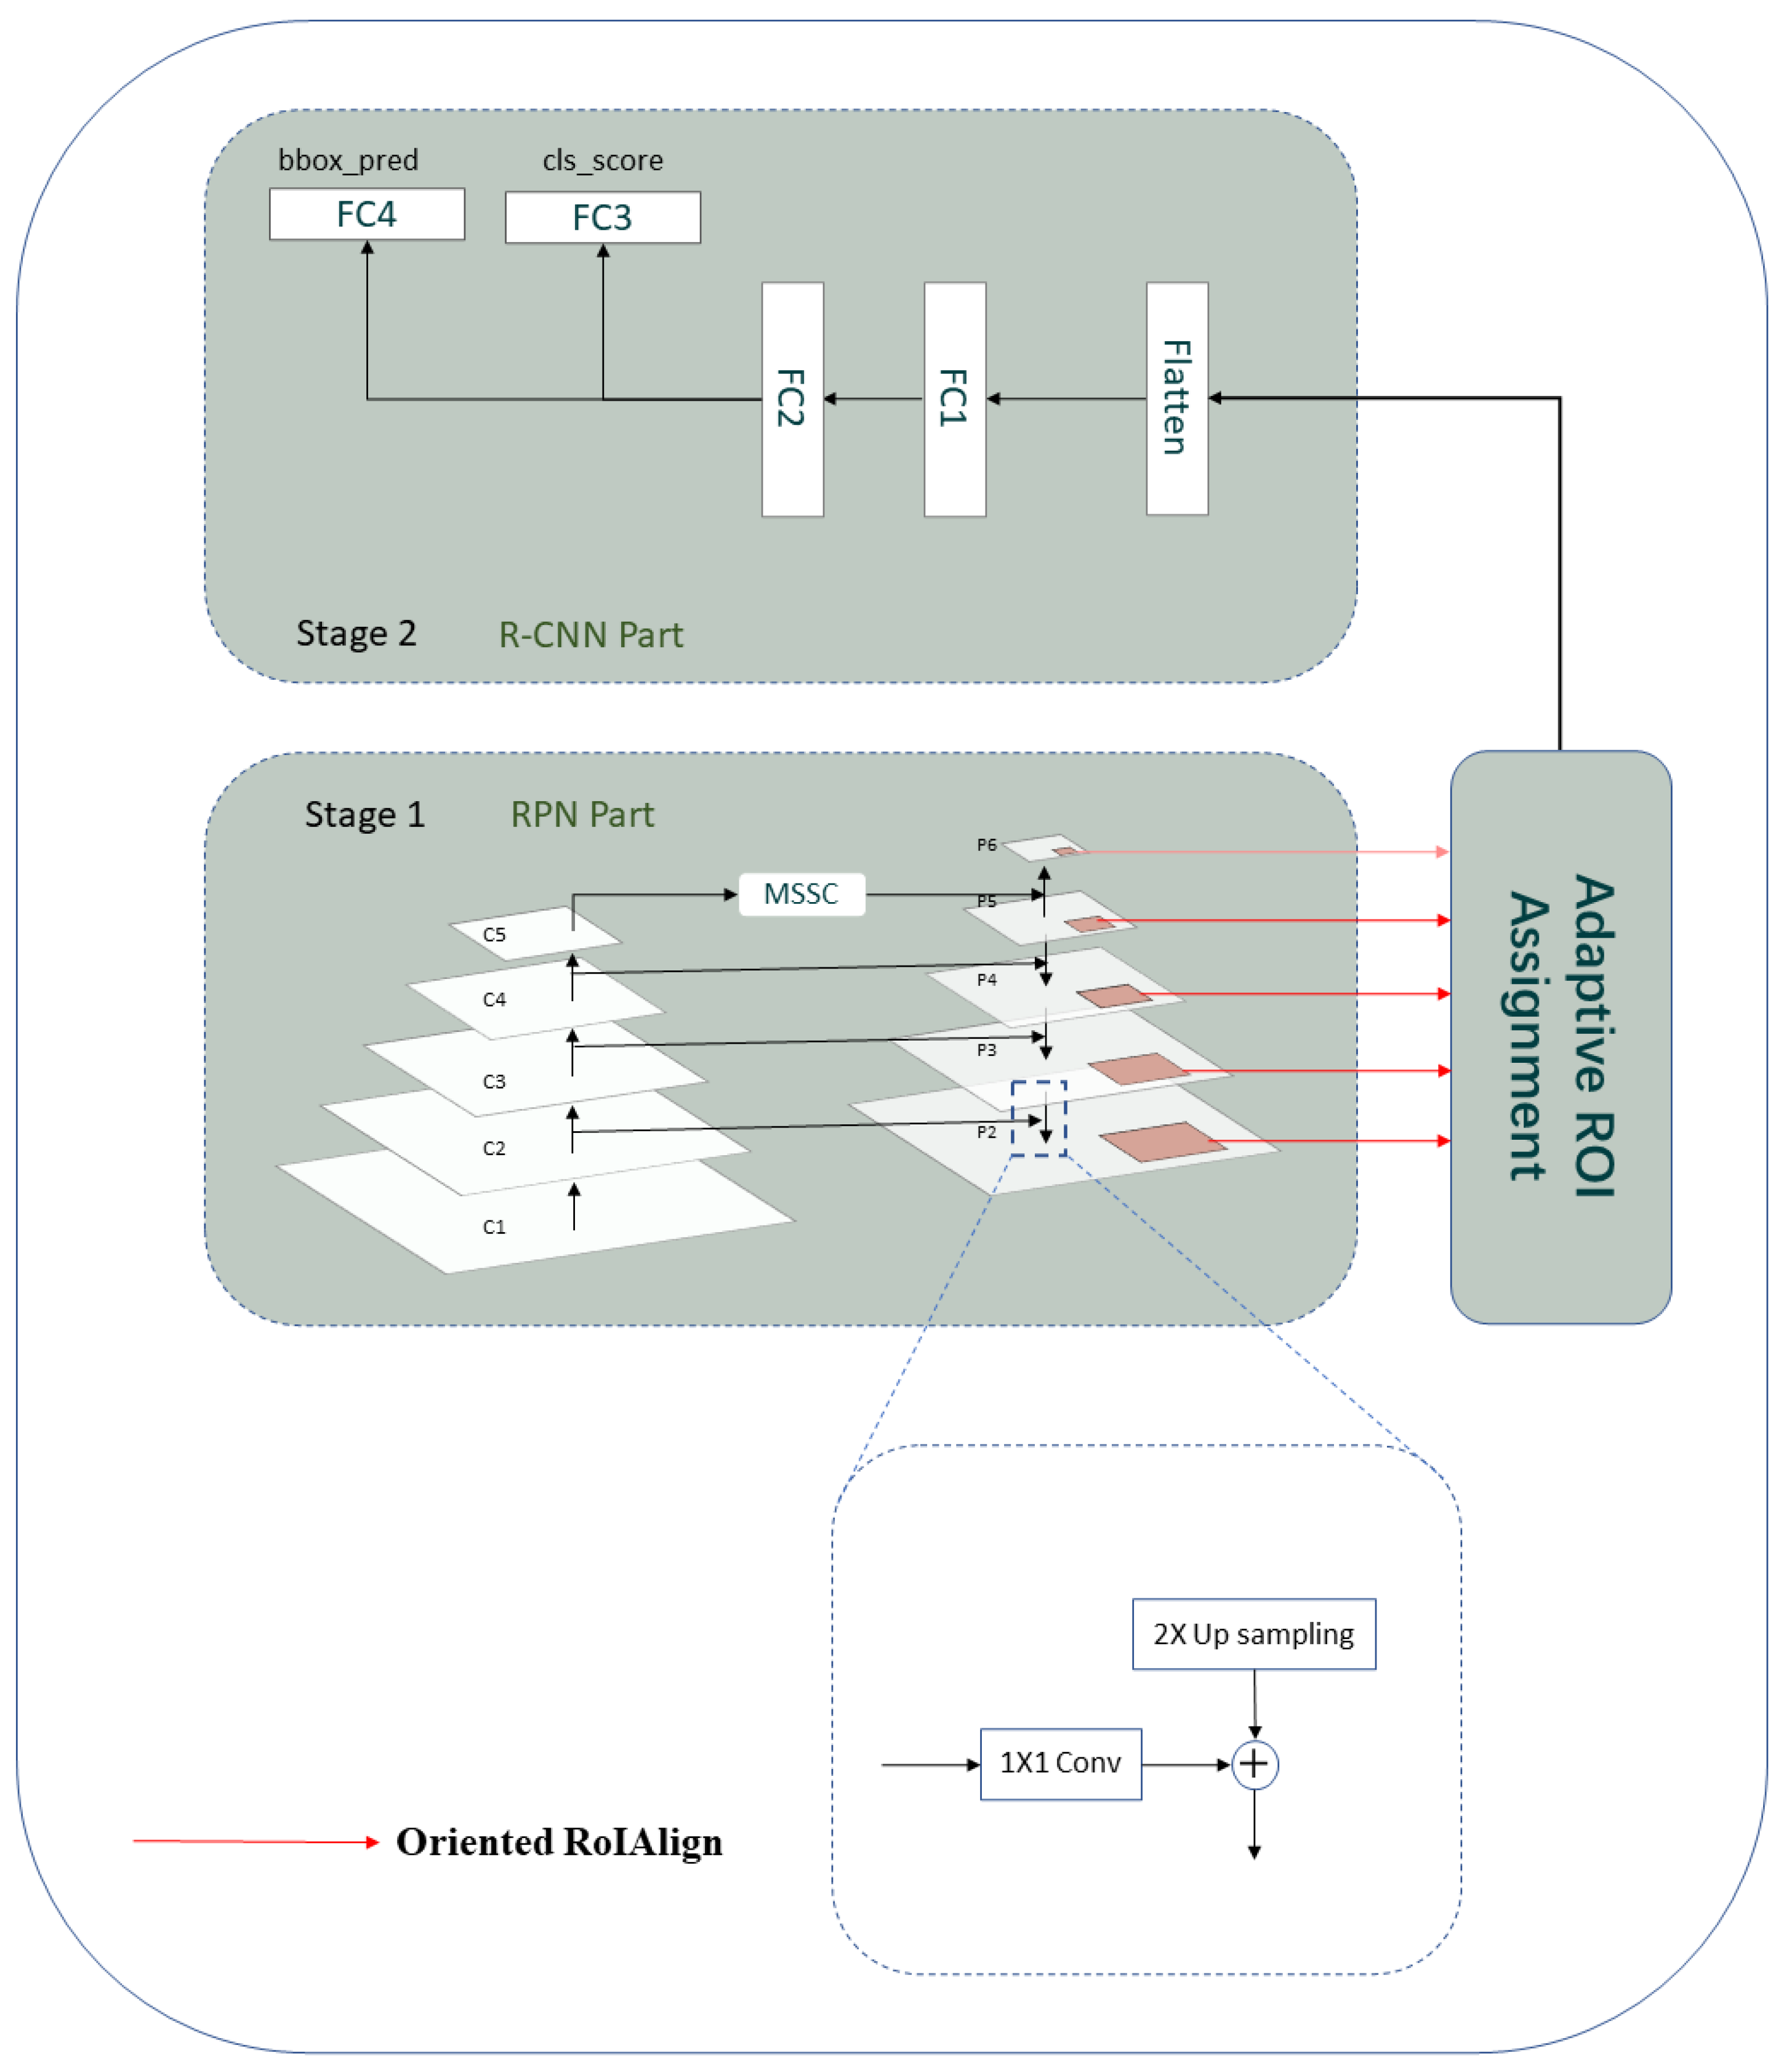
3.1. Overview
3.2. MSSC Module
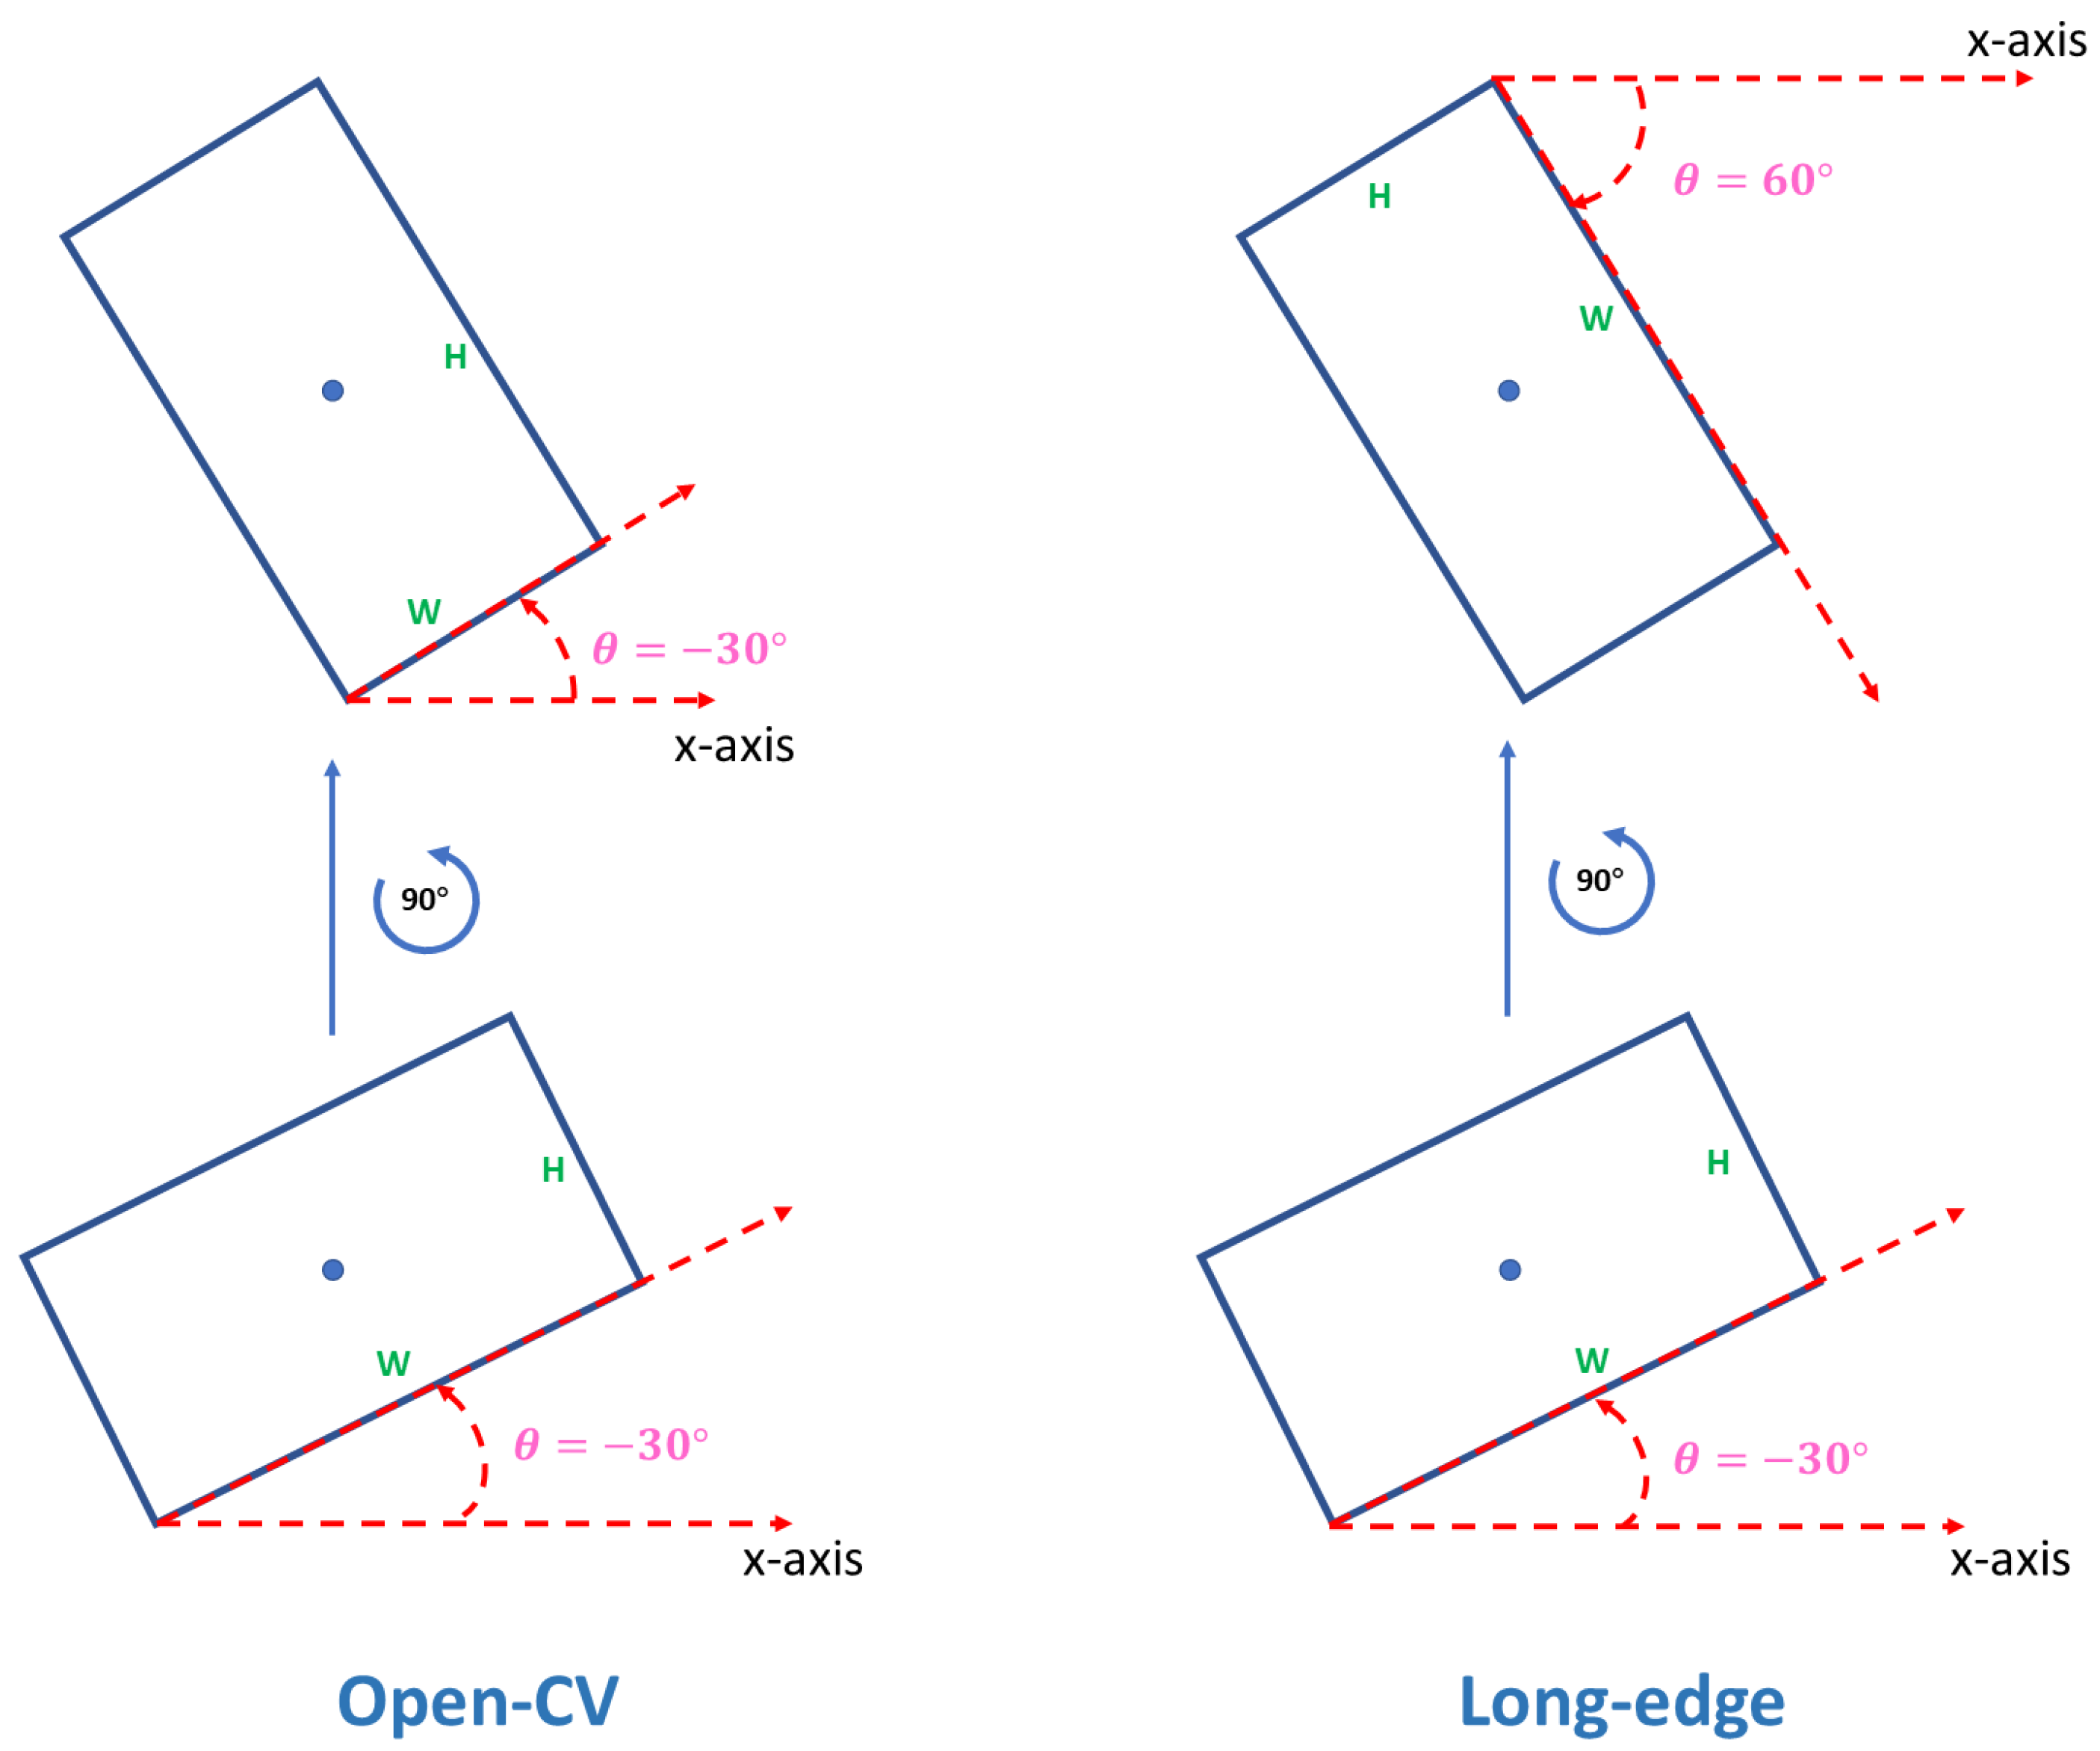
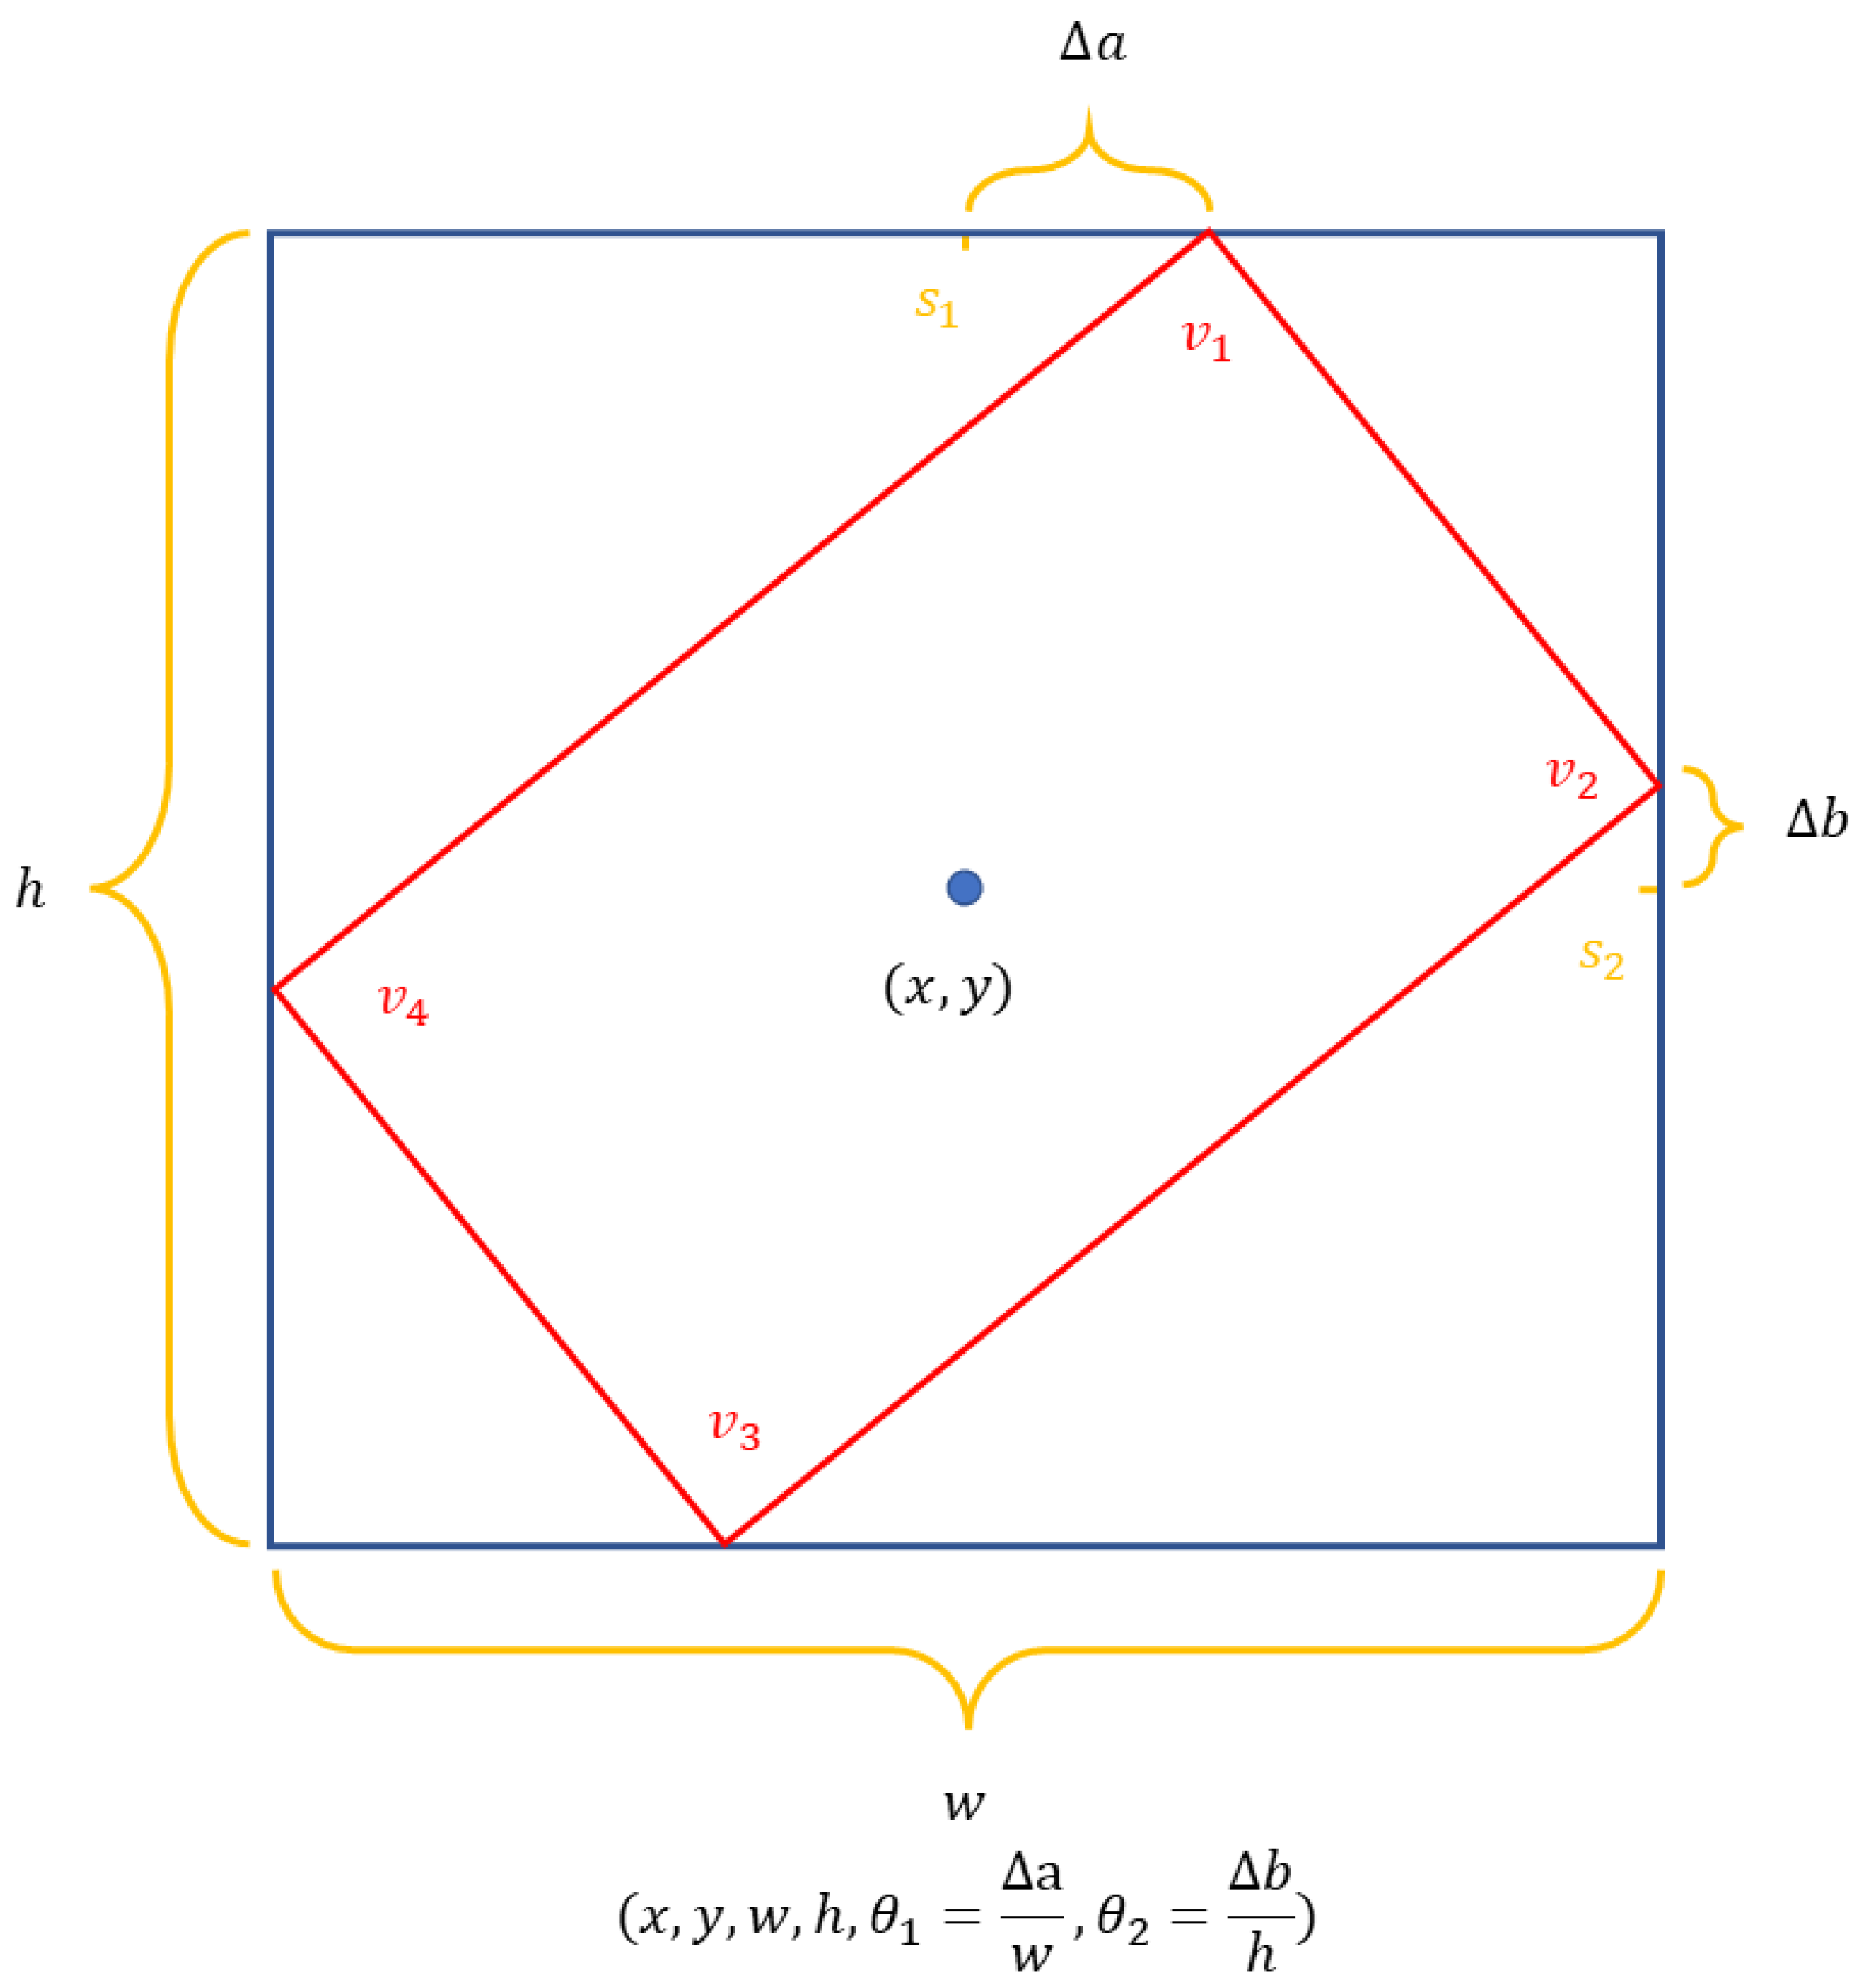
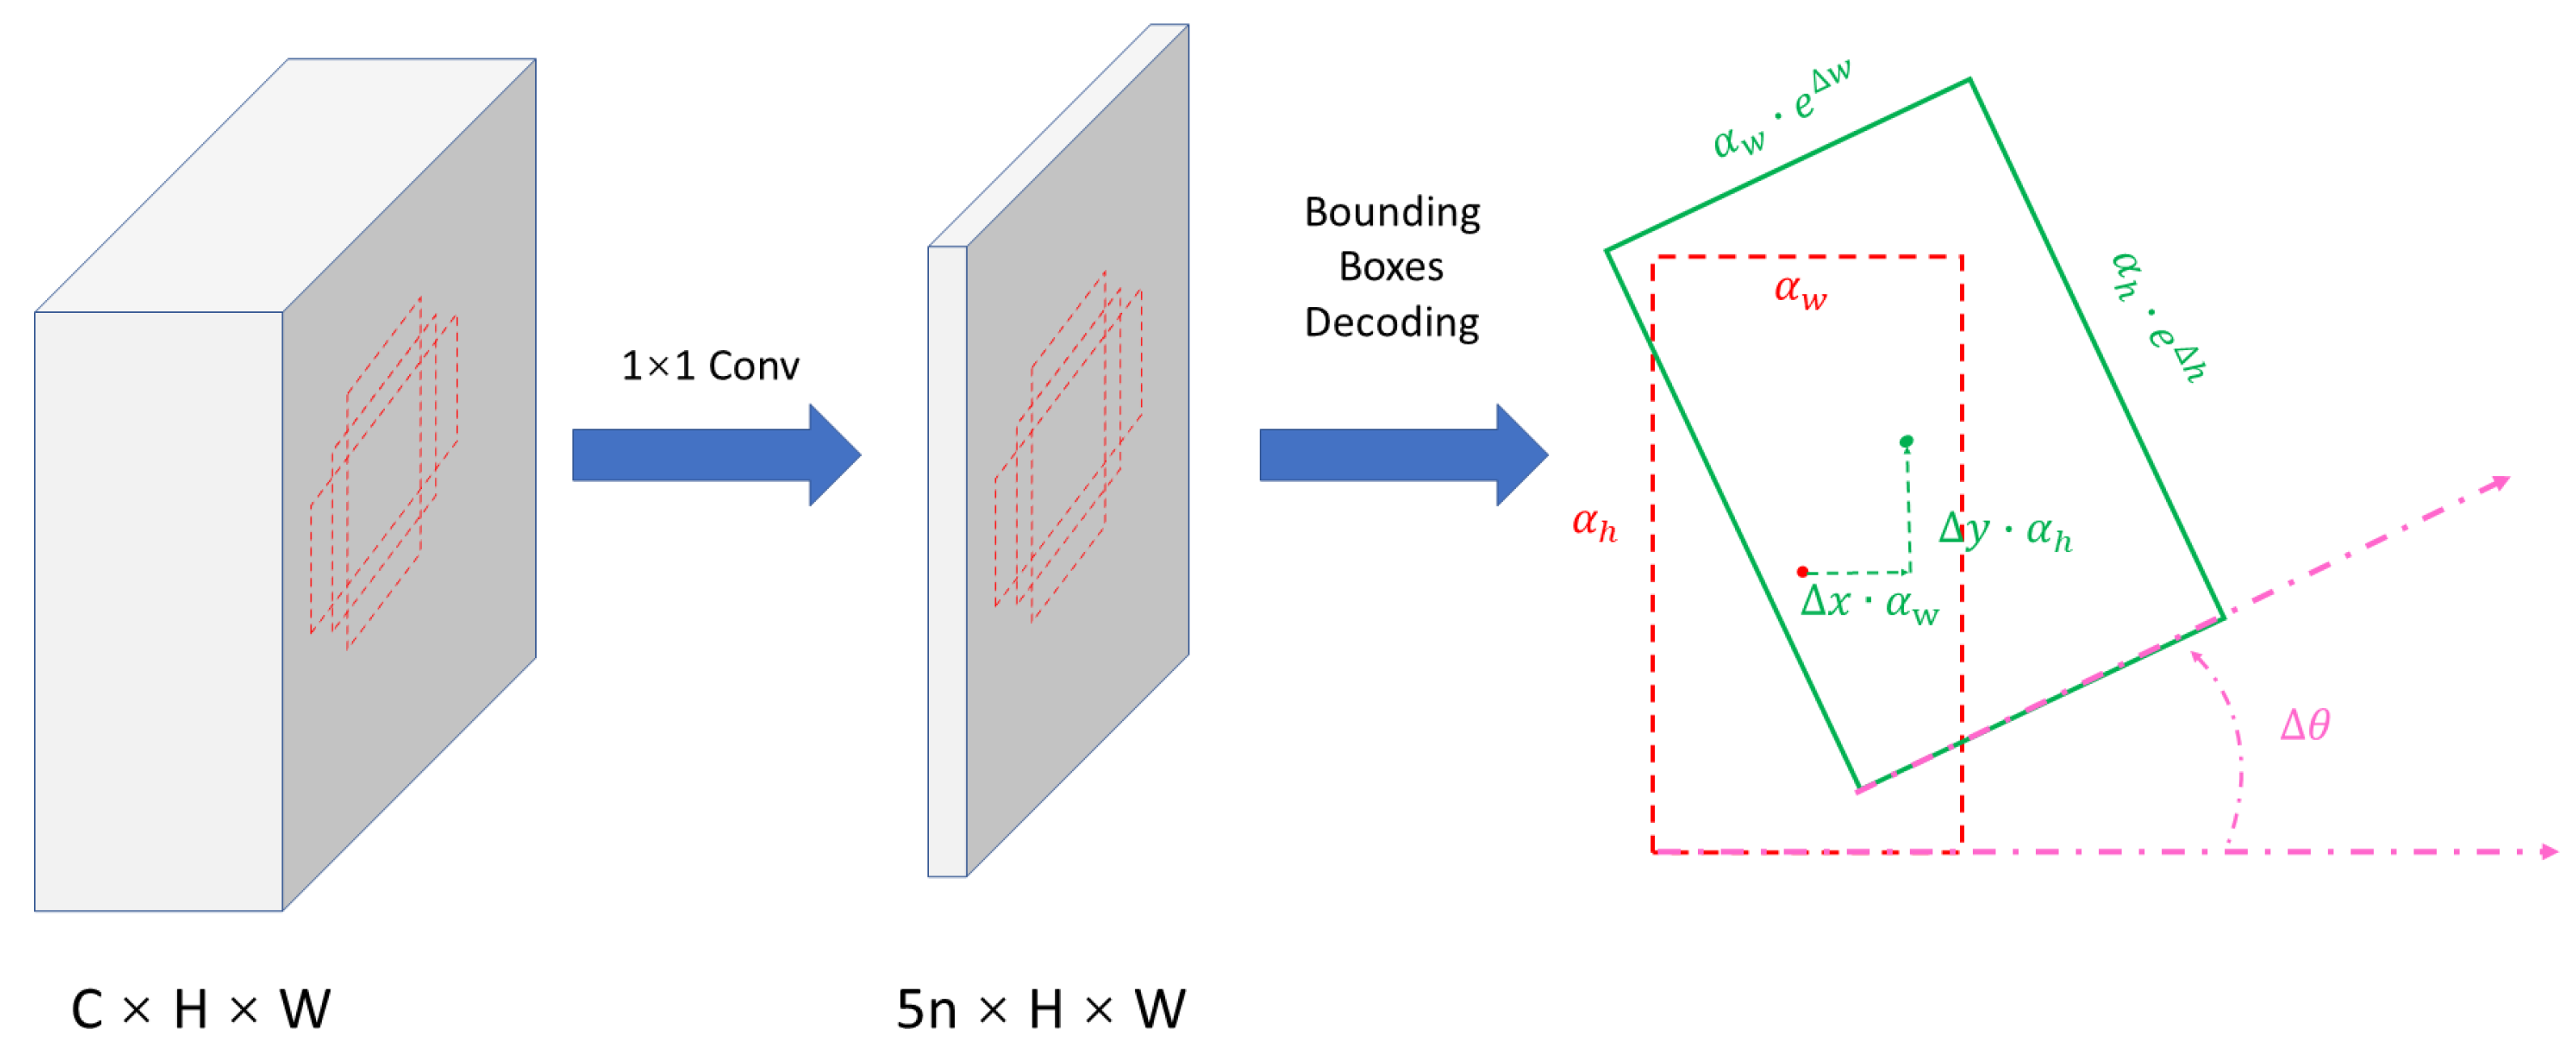
3.3. RPN Head with Oriented Bounding Box
3.3.1. RPN Loss Function
3.4. R-CNN Head
3.4.1. Oriented RoIAlign
3.4.2. Adaptive RoI Assignment
4. Experiments
4.1. Datasets and Evaluation Metrics
4.2. Parameter Detail
4.3. Main Results
4.4. Ablation Study
4.4.1. Baseline Setup
4.4.2. Effect on Each Module
5. Conclusions
Author Contributions
Funding
Data Availability Statement
Acknowledgments
Conflicts of Interest
Abbreviations
| ARA | Adaptive RoI Assignment |
| FPN | Feature Pyramid Network |
| GWD | Gaussian Wasserstein Distance |
| IoU | Intersection over Union |
| mAP | mean Average Precision |
| MSCNet | Multilevel Stacked Context Network |
| MSSC | Multilevel Stacked Semantic Capture |
| NMS | Non-Maximum Suppression |
| RoI | Region of Interest |
| RPN | Region Proposal Network |
| SGD | Stochastic Gradient Descent |
References
- Ren, S.; He, K.; Girshick, R.; Sun, J. Faster r-cnn: Towards real-time object detection with region proposal networks. arXiv 2015, arXiv:1506.01497. [Google Scholar] [CrossRef] [PubMed] [Green Version]
- Li, K.; Cheng, G.; Bu, S.; You, X. Rotation-insensitive and context-augmented object detection in remote sensing images. IEEE Trans. Geosci. Remote Sens. 2017, 56, 2337–2348. [Google Scholar] [CrossRef]
- Liu, W.; Ma, L.; Wang, J. Detection of multiclass objects in optical remote sensing images. IEEE Geosci. Remote Sens. Lett. 2018, 16, 791–795. [Google Scholar] [CrossRef]
- Lin, T.Y.; Dollár, P.; Girshick, R.; He, K.; Hariharan, B.; Belongie, S. Feature pyramid networks for object detection. In Proceedings of the IEEE Conference on Computer Vision and Pattern Recognition, Honolulu, HI, USA, 21–26 July 2017; pp. 2117–2125. [Google Scholar]
- Liu, L.; Pan, Z.; Lei, B. Learning a rotation invariant detector with rotatable bounding box. arXiv 2017, arXiv:1711.09405. [Google Scholar]
- Zhang, G.; Lu, S.; Zhang, W. CAD-Net: A context-aware detection network for objects in remote sensing imagery. IEEE Trans. Geosci. Remote Sens. 2019, 57, 10015–10024. [Google Scholar] [CrossRef] [Green Version]
- Girshick, R.; Donahue, J.; Darrell, T.; Malik, J. Rich feature hierarchies for accurate object detection and semantic segmentation. In Proceedings of the IEEE Conference on Computer Vision and Pattern Recognition, Columbus, OH, USA, 23–28 June 2014; pp. 580–587. [Google Scholar]
- Girshick, R. Fast r-cnn. In Proceedings of the IEEE International Conference on Computer Vision, Santiago, Chile, 7–13 December 2015; pp. 1440–1448. [Google Scholar]
- Liu, W.; Anguelov, D.; Erhan, D.; Szegedy, C.; Reed, S.; Fu, C.Y.; Berg, A.C. Ssd: Single shot multibox detector. In Proceedings of the European Conference on Computer Vision, Amesterdam, The Netherlands, 8 October 2016; Springer: Cham, Switzerland, 2016; pp. 21–37. [Google Scholar]
- Lin, T.Y.; Goyal, P.; Girshick, R.; He, K.; Dollár, P. Focal loss for dense object detection. In Proceedings of the IEEE International Conference on Computer Vision, Venice, Italy, 22–29 October 2017; pp. 2980–2988. [Google Scholar]
- Lin, G.; Milan, A.; Shen, C.; Reid, I. Refinenet: Multi-path refinement networks for high-resolution semantic segmentation. In Proceedings of the IEEE Conference on Computer Vision and Pattern Recognition, Honolulu, HI, USA, 21–26 July 2017; pp. 1925–1934. [Google Scholar]
- Redmon, J.; Farhadi, A. YOLO9000: Better, faster, stronger. In Proceedings of the IEEE Conference on Computer Vision and Pattern Recognition, Honolulu, HI, USA, 21–26 July 2017; pp. 7263–7271. [Google Scholar]
- Redmon, J.; Farhadi, A. Yolov3: An incremental improvement. arXiv 2018, arXiv:1804.02767. [Google Scholar]
- Bochkovskiy, A.; Wang, C.Y.; Liao, H.Y.M. Yolov4: Optimal speed and accuracy of object detection. arXiv 2020, arXiv:2004.10934. [Google Scholar]
- Law, H.; Deng, J. Cornernet: Detecting objects as paired keypoints. In Proceedings of the European Conference on Computer Vision (ECCV), Munich, Germany, 8–14 September 2018; pp. 734–750. [Google Scholar]
- Zhou, X.; Zhuo, J.; Krahenbuhl, P. Bottom-up object detection by grouping extreme and center points. In Proceedings of the IEEE/CVF Conference on Computer Vision and Pattern Recognition, Long Beach, CA, USA, 15–20 June 2019; pp. 850–859. [Google Scholar]
- Tian, Z.; Shen, C.; Chen, H.; He, T. Fcos: Fully convolutional one-stage object detection. In Proceedings of the IEEE/CVF International Conference on Computer Vision, Seoul, Korea, 27 October–2 November 2019; pp. 9627–9636. [Google Scholar]
- Long, J.; Shelhamer, E.; Darrell, T. Fully convolutional networks for semantic segmentation. In Proceedings of the IEEE Conference on Computer Vision and Pattern Recognition, Boston, MA, USA, 7–12 June 2015; pp. 3431–3440. [Google Scholar]
- Duan, K.; Bai, S.; Xie, L.; Qi, H.; Huang, Q.; Tian, Q. Centernet: Keypoint triplets for object detection. In Proceedings of the IEEE/CVF International Conference on Computer Vision, Seoul, Korea, 27 October–2 November 2019; pp. 6569–6578. [Google Scholar]
- Yang, X.; Yang, J.; Yan, J.; Zhang, Y.; Zhang, T.; Guo, Z.; Sun, X.; Fu, K. Scrdet: Towards more robust detection for small, cluttered and rotated objects. In Proceedings of the IEEE/CVF International Conference on Computer Vision, Seoul, Korea, 27 October–2 November 2019; pp. 8232–8241. [Google Scholar]
- Yang, X.; Liu, Q.; Yan, J.; Li, A.; Zhang, Z.; Yu, G. R3det: Refined single-stage detector with feature refinement for rotating object. arXiv 2019, arXiv:1908.05612. [Google Scholar] [CrossRef]
- Xu, Y.; Fu, M.; Wang, Q.; Wang, Y.; Chen, K.; Xia, G.S.; Bai, X. Gliding vertex on the horizontal bounding box for multi-oriented object detection. IEEE Trans. Pattern Anal. Mach. Intell. 2020, 43, 1452–1459. [Google Scholar] [CrossRef] [Green Version]
- Xie, X.; Cheng, G.; Wang, J.; Yao, X.; Han, J. Oriented r-cnn for object detection. In Proceedings of the IEEE/CVF International Conference on Computer Vision, Montreal, BC, Canada, 11–17 October 2021; pp. 3520–3529. [Google Scholar]
- Yang, X.; Yan, J. Arbitrary-oriented object detection with circular smooth label. In Proceedings of the sEuropean Conference on Computer Vision, Online, 28 August 2020; Springer: Cham, Switzerland, 2020; pp. 677–694. [Google Scholar]
- Yu, J.; Jiang, Y.; Wang, Z.; Cao, Z.; Huang, T. Unitbox: An advanced object detection network. In Proceedings of the 24th ACM International Conference on Multimedia, Amsterdam, The Netherlands, 15–19 October 2016; pp. 516–520. [Google Scholar]
- Yang, X.; Yan, J.; Ming, Q.; Wang, W.; Zhang, X.; Tian, Q. Rethinking rotated object detection with gaussian wasserstein distance loss. In Proceedings of the International Conference on Machine Learning, Online, 18–24 July 2021; pp. 11830–11841. [Google Scholar]
- Ding, J.; Xue, N.; Long, Y.; Xia, G.S.; Lu, Q. Learning roi transformer for oriented object detection in aerial images. In Proceedings of the IEEE/CVF Conference on Computer Vision and Pattern Recognition, Long Beach, CA, USA, 15–20 June 2019; pp. 2849–2858. [Google Scholar]
- Xia, G.S.; Bai, X.; Ding, J.; Zhu, Z.; Belongie, S.; Luo, J.; Datcu, M.; Pelillo, M.; Zhang, L. DOTA: A large-scale dataset for object detection in aerial images. In Proceedings of the IEEE Conference on Computer Vision and Pattern Recognition, Salt Lake City, UT, USA, 18–23 June 2018; pp. 3974–3983. [Google Scholar]
- Liu, Z.; Yuan, L.; Weng, L.; Yang, Y. A high resolution optical satellite image dataset for ship recognition and some new baselines. In International conference on pattern recognition applications and methods. SciTePress 2017, 2, 324–331. [Google Scholar]
- Everingham, M.; Van Gool, L.; Williams, C.K.; Winn, J.; Zisserman, A. The pascal visual object classes (voc) challenge. Int. J. Comput. Vis. 2010, 88, 303–338. [Google Scholar] [CrossRef] [Green Version]
- Chen, K.; Wang, J.; Pang, J.; Cao, Y.; Xiong, Y.; Li, X.; Sun, S.; Feng, W.; Liu, Z.; Xu, J.; et al. MMDetection: Open mmlab detection toolbox and benchmark. arXiv 2019, arXiv:1906.07155. [Google Scholar]
- Deng, J. A large-scale hierarchical image database. In Proceedings of the IEEE Computer Vision and Pattern Recognition, Miami, FL, USA, 20–25 June 2009. [Google Scholar]
- Chen, Z.; Chen, K.; Lin, W.; See, J.; Yu, H.; Ke, Y.; Yang, C. Piou loss: Towards accurate oriented object detection in complex environments. In Proceedings of the European Conference on Computer Vision, Online, 28 August 2020; Springer: Cham, Switzerland, 2020; pp. 195–211. [Google Scholar]
- Ming, Q.; Zhou, Z.; Miao, L.; Zhang, H.; Li, L. Dynamic anchor learning for arbitrary-oriented object detection. arXiv 2020, arXiv:2012.04150. [Google Scholar] [CrossRef]
- Qian, W.; Yang, X.; Peng, S.; Guo, Y.; Yan, J. Learning modulated loss for rotated object detection. arXiv 2019, arXiv:1911.08299. [Google Scholar] [CrossRef]
- Zhou, L.; Wei, H.; Li, H.; Zhao, W.; Zhang, Y. Objects detection for remote sensing images based on polar coordinates. arXiv 2020, arXiv:2001.02988. [Google Scholar]
- Pan, X.; Ren, Y.; Sheng, K.; Dong, W.; Yuan, H.; Guo, X.; Ma, C.; Xu, C. Dynamic refinement network for oriented and densely packed object detection. In Proceedings of the IEEE/CVF Conference on Computer Vision and Pattern Recognition, Seattle, WA, USA, 13–19 June 2020; pp. 11207–11216. [Google Scholar]
- Ming, Q.; Miao, L.; Zhou, Z.; Dong, Y. CFC-Net: A critical feature capturing network for arbitrary-oriented object detection in remote-sensing images. IEEE Trans. Geosci. Remote Sens. 2021, 61, 1–4. [Google Scholar] [CrossRef]
- Han, J.; Ding, J.; Li, J.; Xia, G.S. Align deep features for oriented object detection. IEEE Trans. Geosci. Remote Sens. 2021, 60, 1–11. [Google Scholar] [CrossRef]
- Wang, J.; Yang, W.; Li, H.C.; Zhang, H.; Xia, G.S. Learning center probability map for detecting objects in aerial images. IEEE Trans. Geosci. Remote Sens. 2020, 59, 4307–4323. [Google Scholar] [CrossRef]
- Li, C.; Xu, C.; Cui, Z.; Wang, D.; Zhang, T.; Yang, J. Feature-attentioned object detection in remote sensing imagery. In Proceedings of the 2019 IEEE International Conference on Image Processing (ICIP), Taipei, China, 22–25 September 2019; pp. 3886–3890. [Google Scholar]
- Wang, J.; Ding, J.; Guo, H.; Cheng, W.; Pan, T.; Yang, W. Mask OBB: A semantic attention-based mask oriented bounding box representation for multi-category object detection in aerial images. Remote Sens. 2019, 11, 2930. [Google Scholar] [CrossRef] [Green Version]
- Jiang, Y.; Zhu, X.; Wang, X.; Yang, S.; Li, W.; Wang, H.; Fu, P.; Luo, Z. R2CNN: Rotational region CNN for orientation robust scene text detection. arXiv 2017, arXiv:1706.09579. [Google Scholar]
- Ma, J.; Shao, W.; Ye, H.; Wang, L.; Wang, H.; Zheng, Y.; Xue, X. Arbitrary-oriented scene text detection via rotation proposals. IEEE Trans. Multimed. 2018, 20, 3111–3122. [Google Scholar] [CrossRef]
- Yang, X.; Hou, L.; Zhou, Y.; Wang, W.; Yan, J. Dense label encoding for boundary discontinuity free rotation detection. In Proceedings of the IEEE/CVF Conference on Computer Vision and Pattern Recognition, Nashville, TN, USA, 20–25 June 2021; pp. 15819–15829. [Google Scholar]


| Method | Backbone | Input_size | PL | BD | BR | GTF | SV | LV | SH | TC | BC | ST | SBF | RA | HA | SP | HC | mAP | |
|---|---|---|---|---|---|---|---|---|---|---|---|---|---|---|---|---|---|---|---|
| One-stage | PIoU [33] | DLA-34 | 80.90 | 69.70 | 24.10 | 60.20 | 38.30 | 64.40 | 64.80 | 90.90 | 77.20 | 70.40 | 46.50 | 37.10 | 57.10 | 61.90 | 64.00 | 60.5 | |
| RetinaNet | R-50-FPN | 88.67 | 77.62 | 41.81 | 58.17 | 74.58 | 71.64 | 79.11 | 90.29 | 82.18 | 74.32 | 54.75 | 60.60 | 62.57 | 69.67 | 60.64 | 68.43 | ||
| DAL [34] | R-50-FPN | 88.68 | 76.55 | 45.08 | 66.80 | 67.00 | 76.76 | 79.74 | 90.84 | 79.54 | 78.45 | 57.71 | 62.27 | 69.05 | 73.14 | 60.11 | 71.44 | ||
| RSDet [35] | R-101-FPN | 89.80 | 82.90 | 48.60 | 65.20 | 69.50 | 70.10 | 70.20 | 90.50 | 85.60 | 83.40 | 62.50 | 63.90 | 65.60 | 67.20 | 68.00 | 72.2 | ||
| P-RSDet [36] | R-101 | 88.58 | 77.83 | 50.44 | 69.29 | 71.10 | 75.79 | 78.66 | 90.88 | 80.10 | 81.71 | 57.92 | 63.03 | 66.30 | 69.77 | 63.13 | 72.3 | ||
| DRN [37] | H-104 | 89.71 | 82.34 | 47.22 | 64.10 | 76.22 | 74.43 | 85.84 | 90.57 | 86.18 | 84.89 | 57.65 | 61.93 | 69.30 | 69.63 | 58.48 | 73.23 | ||
| CFC-Net [38] | R-101 | 89.08 | 80.41 | 52.41 | 70.02 | 76.28 | 78.11 | 87.21 | 90.89 | 84.47 | 85.64 | 60.51 | 61.52 | 67.82 | 68.02 | 50.09 | 73.5 | ||
| R3Det | R-101-FPN | 88.76 | 83.09 | 50.91 | 67.27 | 76.23 | 80.39 | 86.72 | 90.78 | 84.68 | 83.24 | 61.98 | 61.35 | 66.91 | 70.63 | 53.94 | 73.79 | ||
| [39] | R-50-FPN | 89.11 | 82.84 | 48.37 | 71.11 | 78.11 | 78.39 | 87.25 | 90.83 | 84.90 | 85.64 | 60.36 | 62.60 | 65.26 | 69.13 | 57.94 | 74.12 | ||
| Two-stage | Faster R-CNN | R-50-FPN | 88.44 | 73.06 | 44.86 | 59.09 | 73.25 | 71.49 | 77.11 | 90.84 | 78.94 | 83.90 | 48.59 | 62.95 | 62.18 | 64.91 | 56.18 | 69.05 | |
| RoI Transformer | R-101-FPN | 88.64 | 78.52 | 43.44 | 75.92 | 68.81 | 73.68 | 83.59 | 90.74 | 77.27 | 81.46 | 58.39 | 53.54 | 62.83 | 58.93 | 47.67 | 69.56 | ||
| CAD-Net | R-101-FPN | 87.80 | 82.40 | 49.40 | 73.50 | 71.10 | 63.50 | 76.60 | 90.90 | 79.20 | 73.30 | 48.40 | 60.90 | 62.00 | 67.00 | 62.20 | 69.9 | ||
| CenterMap-Net [40] | R-50-FPN | 88.88 | 81.24 | 53.15 | 60.65 | 78.62 | 66.55 | 78.10 | 88.83 | 77.80 | 83.61 | 49.36 | 66.19 | 72.10 | 72.36 | 58.70 | 71.74 | ||
| SCRDet | R-101-FPN | 89.98 | 80.65 | 52.09 | 68.36 | 68.36 | 60.32 | 72.41 | 90.85 | 87.94 | 86.86 | 65.02 | 66.68 | 66.25 | 68.24 | 65.21 | 72.61 | ||
| FAOD [41] | R-101-FPN | 90.21 | 79.58 | 45.49 | 76.41 | 73.18 | 68.27 | 79.56 | 90.83 | 83.40 | 84.68 | 53.40 | 65.42 | 74.17 | 69.69 | 64.86 | 73.28 | ||
| Mask OBB [42] | R-50-FPN | 89.61 | 85.09 | 51.85 | 72.90 | 75.28 | 73.23 | 85.57 | 90.37 | 82.08 | 85.05 | 55.73 | 68.39 | 71.61 | 69.87 | 66.33 | 74.86 | ||
| Gliding Vertex | R-101-FPN | 89.64 | 85.00 | 52.26 | 77.34 | 73.01 | 73.14 | 86.82 | 90.74 | 79.02 | 86.81 | 59.55 | 70.91 | 72.94 | 70.86 | 57.32 | 75.02 | ||
| baseline | R-50-FPN | 89.95 | 76.80 | 50.44 | 70.84 | 66.94 | 84.40 | 88.74 | 90.80 | 69.87 | 87.44 | 77.42 | 67.98 | 74.89 | 62.27 | 48.01 | 73.79 | ||
| MSCNet(ours) | R-50-FPN | 89.81 | 79.92 | 48.62 | 74.18 | 68.44 | 84.28 | 88.4 | 90.79 | 72.49 | 87.54 | 75.44 | 69.43 | 75.31 | 60.07 | 62.85 | 75.17 |
| Model | Backbone | Input_Size | |
|---|---|---|---|
| R2CNN [43] | ResNet101 | 73.07 | |
| RRPN [44] | ResNet101 | 79.08 | |
| RoI-Transformer | ResNet101 | 86.2 | |
| Gliding Vertex | ResNet101 | 88.2 | |
| DAL | ResNet101 | 88.95 | |
| R3Det | ResNet101 | 89.26 | |
| DCL [45] | ResNet101 | 89.46 | |
| CSL | ResNet50 | 89.62 | |
| GWD | ResNet101 | 89.85 | |
| Oriented R-CNN | ResNet101 | 90.5 | |
| baseline | ResNet50 | 89.96 | |
| MSCNet(ours) | ResNet50 | 90.65 |
| Modules | mAP | AP50 | ||
|---|---|---|---|---|
| MSSC | GWD | ARA | DOTA | HRSC |
| 73.79 | 89.96 | |||
| ✓ | 74.27 | 90.36 | ||
| ✓ | 74.22 | 90.21 | ||
| ✓ | 74.81 | 90.18 | ||
| ✓ | ✓ | 75.12 | 90.38 | |
| ✓ | ✓ | 74.4 | 90.38 | |
| ✓ | ✓ | 74.94 | 90.47 | |
| ✓ | ✓ | ✓ | 75.17 | 90.65 |
| Input Shape | Backbone | Flops | FPS | |
|---|---|---|---|---|
| baseline | ResNet50 | 211.3 GFLOPs | 23 img/s | |
| MSSCNet | ResNet50 | 503.6 GFLOPs | 10.6 img/s |
Publisher’s Note: MDPI stays neutral with regard to jurisdictional claims in published maps and institutional affiliations. |
© 2022 by the authors. Licensee MDPI, Basel, Switzerland. This article is an open access article distributed under the terms and conditions of the Creative Commons Attribution (CC BY) license (https://creativecommons.org/licenses/by/4.0/).
Share and Cite
Zhang, R.; Zhang, X.; Zheng, Y.; Wang, D.; Hua, L. MSCNet: A Multilevel Stacked Context Network for Oriented Object Detection in Optical Remote Sensing Images. Remote Sens. 2022, 14, 5066. https://0-doi-org.brum.beds.ac.uk/10.3390/rs14205066
Zhang R, Zhang X, Zheng Y, Wang D, Hua L. MSCNet: A Multilevel Stacked Context Network for Oriented Object Detection in Optical Remote Sensing Images. Remote Sensing. 2022; 14(20):5066. https://0-doi-org.brum.beds.ac.uk/10.3390/rs14205066
Chicago/Turabian StyleZhang, Rui, Xinxin Zhang, Yuchao Zheng, Dahan Wang, and Lizhong Hua. 2022. "MSCNet: A Multilevel Stacked Context Network for Oriented Object Detection in Optical Remote Sensing Images" Remote Sensing 14, no. 20: 5066. https://0-doi-org.brum.beds.ac.uk/10.3390/rs14205066