Article

Digital Data and Semantic Simulation—The Survey of the Ruins of the Convent of the Paolotti (12th Century A.D.)

by
Sara Gonizzi Barsanti
1,*,
Santiago Lillo Giner
1,2 and
Adriana Rossi
1
1
Department of Engineering, Università degli Studi della Campania Luigi Vanvitelli, 81100 Caserta, Italy
2
Department of Architecture, Universitat Politècnica de València, 46022 València, Spain
*
Author to whom correspondence should be addressed.
Remote Sens. 2022, 14(20), 5152; https://0-doi-org.brum.beds.ac.uk/10.3390/rs14205152
Submission received: 2 September 2022 / Revised: 28 September 2022 / Accepted: 11 October 2022 / Published: 15 October 2022
(This article belongs to the Special Issue New Perspectives on 3D Point Cloud)

Abstract

:
In the presence of architecturally significant ruins, restoring and disseminating the idea of a testimony that has survived the destructive work of time is a cultural and social necessity that the use of advanced methods and tools allows to communicate in a timely and comprehensive manner. The integration of 3D surveying techniques and digital information production and management processes (graphic and alphanumeric, i.e., geometric information) makes it possible to put in place multifaceted and effective strategies. The article aims at describing the process of data acquisition (using applied photogrammetry) of the remains of a medieval cloister located on the outskirts of ancient Oppido Mamertina (RC, Italy). The use of the acquired point cloud, cleaned and optimised, made it possible to extract suitable orthophotos from which to derive the matrix profiles of the vaulted roof system. The information organisation of the model, which can be queried on time despite the generic level of detail, leads us to meditate on the change taking place in the field of documentation for urban environmental design and maintenance.

Graphical Abstract

1. Introduction

Developing content to define and communicate meanings and values that connect past and present is a key objective of safeguard policies: the community only protects what it values and to the extent of the value it attributes to it [1]. It is not surprising, therefore, that in compliance with the international definition of “Heritage” [2], the Region of Calabria has set up a 2014–2020 “Rural Development Plan”. In application of this plan, local actions in agricultural areas were approved. Among the improving “Investments” are the emergencies near the city of Oppido in the province of the Calabrian capital, dioceses since 1044. Along the GAl BATIR “path” are the ruins of the Convent of the Paolotti [3] (p. 16). The residence of the Minim friars (belonging to the order of St. Francis of Paola, hence the toponym of the religious complex dating back to the Middle Ages), is today limited to the remains of the cloistered area delimited by the layout of the colonnade, a cistern for collecting rainwater (two metres wide and three metres deep), an ossuary and individual burials, perhaps intended to house the bodies of the feudal nobles (https://issuu.ccf. om/galbatir/docs/06oppidomamertina (accessed on 25 September 2022).
Noting the difficulty of accessing the architectural emergencies, which are very deteriorated and overgrown by spontaneous vegetation, the article describes, using photogrammetric techniques, the acquisition of the situation, i.e., the scenario for the 3D reconstructions, commissioned by the local superintendency for promotional purposes (cfr. Decreto del Presidente del Consiglio dei Ministri 2 dicembre 2019, n. 169).
Preliminary to the processing, the mathematical representation of millions of known image coordinates (xyz) with respect to a single reference system and provided with intelligible information, including colour intensity and light reflectance are taken into consideration. The cleaned 3D point cloud [4] (pp. 12–13) defines an accurate and precise but discontinuous model. Knowing the characteristics of the instruments and the error coefficient of the methods [5], the acquired coordinate points can be considered objective. Subjective, on the other hand, albeit within the limits of a methodologically founded procedure, is the transcription of the so-called “unstructured” model into a continuous geometric configuration, and therefore manageable by a computer [6] (pp. 63–65). On an applicative level, the acquisition of point clouds is not only used to obtain reliable measurements, chromatists, and topologies. Recent studies are experimenting with how they can be used directly in immersive environments to generate user-centred products for multimodal purposes, thus avoiding the time-consuming and cumbersome work involved in modelling and rendering geometric shapes based on the detected point clouds. 3D point clouds are used for creating sections and analysing the decay of structures [7]. Automated or semi-automated image segmentation approaches are being experimented with for the construction of open-source framework [8] and the design of intelligent environments and deep automation ([9] p. 20), [10,11]. Compared to these researches, our work flanks the traditional applications of the latest generation, however, taking care to include the case study as an opportunity to deepen considerations on the evolution taking place in the specific discipline of architectural survey and environmental representation. Using a stereoscopic reading of the data, we investigate the configuration of a hypothetically reconstructed space. The realised virtual visualisation considers the recommendations contained in the “London Charter” [12], discussed at the International Forum of Virtual Archaeology (2011) and formalised in the Charter of Sevilla” [13]. Therefore, sources are stated, the problem is explicitly formulated, and then the most appropriate criteria are chosen to explore, describe, explain, correlate, and test the case study [14]. Emphasis was placed on reading the point clouds that identify the layout of the cloistered portico. The polygonal 3D point cloud, the most suitable for recording the irregularities of the architectural remains [15], was imported into dedicated software for the recognition of typological characters. By means of an indirect method [16] (p. 80), object-based objects suitable for numerical simulations were constructed around the fabrication entities (walls, pillars, floors, etc. stored in the system’s instructions) [17]. The level of detail set, although “generic” within the meaning of the regulations in force in Italy (https://www.ingenio-web.it/18667-sistema-dei-lod-italiano-uni-11337-4-2017 (accessed on 10 October 2022), can be updated by those using the same program. The setting derived from the semantic organisation of the components makes it possible to discuss the potential developing of the model managed and projected towards a scenario derived from centralised data sharing (Common Data Environment). The latest advances in the field of digital imaging and the development of stitching software have proven to be an indispensable tool for documenting archaeological findings. The article, initially focused on describing the process used to obtain the very high-resolution photo models, has in fact made it possible to obtain controlled combinations of point clouds, acquisition outputs capable of allowing analysis at various levels. The translation of signifiers and meanings into informative digital components requires an understanding of the semantic structure at the survey stage. To this end, the giga pixels acquired by merging several images of the same detail (profiles, pillars, and the beginning of the curvature of the arches) composed of billions of pixels, showed the smallest clues for reasoning about the arrangement of the ashlars, i.e., the pieces that make up the structure of arches and vaults. For operational purposes, a conscious knowledge of the techniques that were only standardised many years after the construction of the cloister of Oppido is required. The study of arches and vaults becomes topical again for those involved in drawing surveys or the census of archaeological findings. The arches and vaults guarantee the continuity of static and linguistic constructive homogeneity. The objectives of the study are focused on obtaining a detailed and faithful photographic documentation that allowed for their cataloguing and study, to deduce the process of their construction and verify the rigorousness of their traces. In addition to the technical aspects, the data made it possible to historically contextualise the work and provide some information on the creation of data sheets attached to the model.

2. The Ancient Site of Oppido Mamertina

The ancient city of Oppido Mamertina is located on the slopes of the Aspromonte (Figure 1), immersed in a wood of luxuriant centuries-old olive trees. About 35% of the territory of Oppido has been declared of significant environmental interest and included within the perimeter of the Aspromonte National Park.
The origins of Oppido are linked to the ancient Mamerto and to the people of the Mamertines, who bore this name because they were inspired by the god of war Mars: a people of mercenaries, dedicated to war, coming from Campania, and enlisted by the tyrant Agatocle of Syracuse (3rd century BC). Some of them settled in the Calabrian and Messina area. In the third century BC they reached Mella, today an archaeological area near Oppido, and the town was abandoned and repopulated in Roman times. In this period the city took the name of Oppidum, of which there remain today notable testimonies. However, the territory of Oppido appears to have been inhabited already during the era of Greek colonization (7th century BC) [18]. The archaeological site of Mella is one of the great attractions of the territory of Oppido: numerous excavation campaigns, which have also involved some US universities, have in fact brought to light finds from different eras and are of great archaeological interest [19]. The finds allowed scholars to verify the presence of paved streets more than seven metres wide, along which large civil buildings lined up in a fully urbanized cultural context. The numerous coins that emerged, belonging to the mints or authorities of Rome, Metaponto, Valentia, Locri Epizefiri, Region, Catania, Syracuse, and of Carthaginians in Italy, Bretii and Mamertini, testify to the great commercial traffic that affected the territory and the Greek cities of Southern Italy.
The ancient Oppido, the probable heir of the mythical Mamerto, stood on a hill of the so-called Melle plateau, in an area straddling the Tricuccio and Cumi rivers and was rebuilt around 1044 [20].
The city was in an inaccessible site and surrounded by robust walls with an Aragonese-style castle, which had subsequent additions and modifications in the Angevin or even Norman–Swabian period. It was also a diocese centre since 1044. Despite its steep position, it was attacked several times over the centuries, first by Ruggero the Norman in 1059, by the brothers Marino and Raimondo Correale between 1459 and 1464, and by Tommaso Barrese, one of the fiercest lieutenants of the Aragonese. Around 1138, Queen Massimilla, sister of Ruggero II, lived there. The great earthquake of 1783 destroyed Oppido. The deaths then ascertained were 1198 out of 2408, and, as it was no longer possible to rebuild the city on the same site, given that much of it had collapsed into the river below, the Tuba district was chosen as the new home of the Oppidesi. Of the ancient urban layout there are still part of the surrounding walls, the gates, the castle, the Cathedral, the cloister of the Minims, and scattered houses. The information relating to the cloister which has been surveyed and rebuilt is almost nil.

3. Materials and Methods

The work proposed refers to the survey with photogrammetry of the medieval cloister of the ancient Oppido, the extrapolation of profiles and the calculation of proportions for the geometrical 3D reconstruction of the structure surveyed. The final step of the process, still ongoing, was the set-up of an HBIM to collect all the data to provide the superintendence of a complete database.

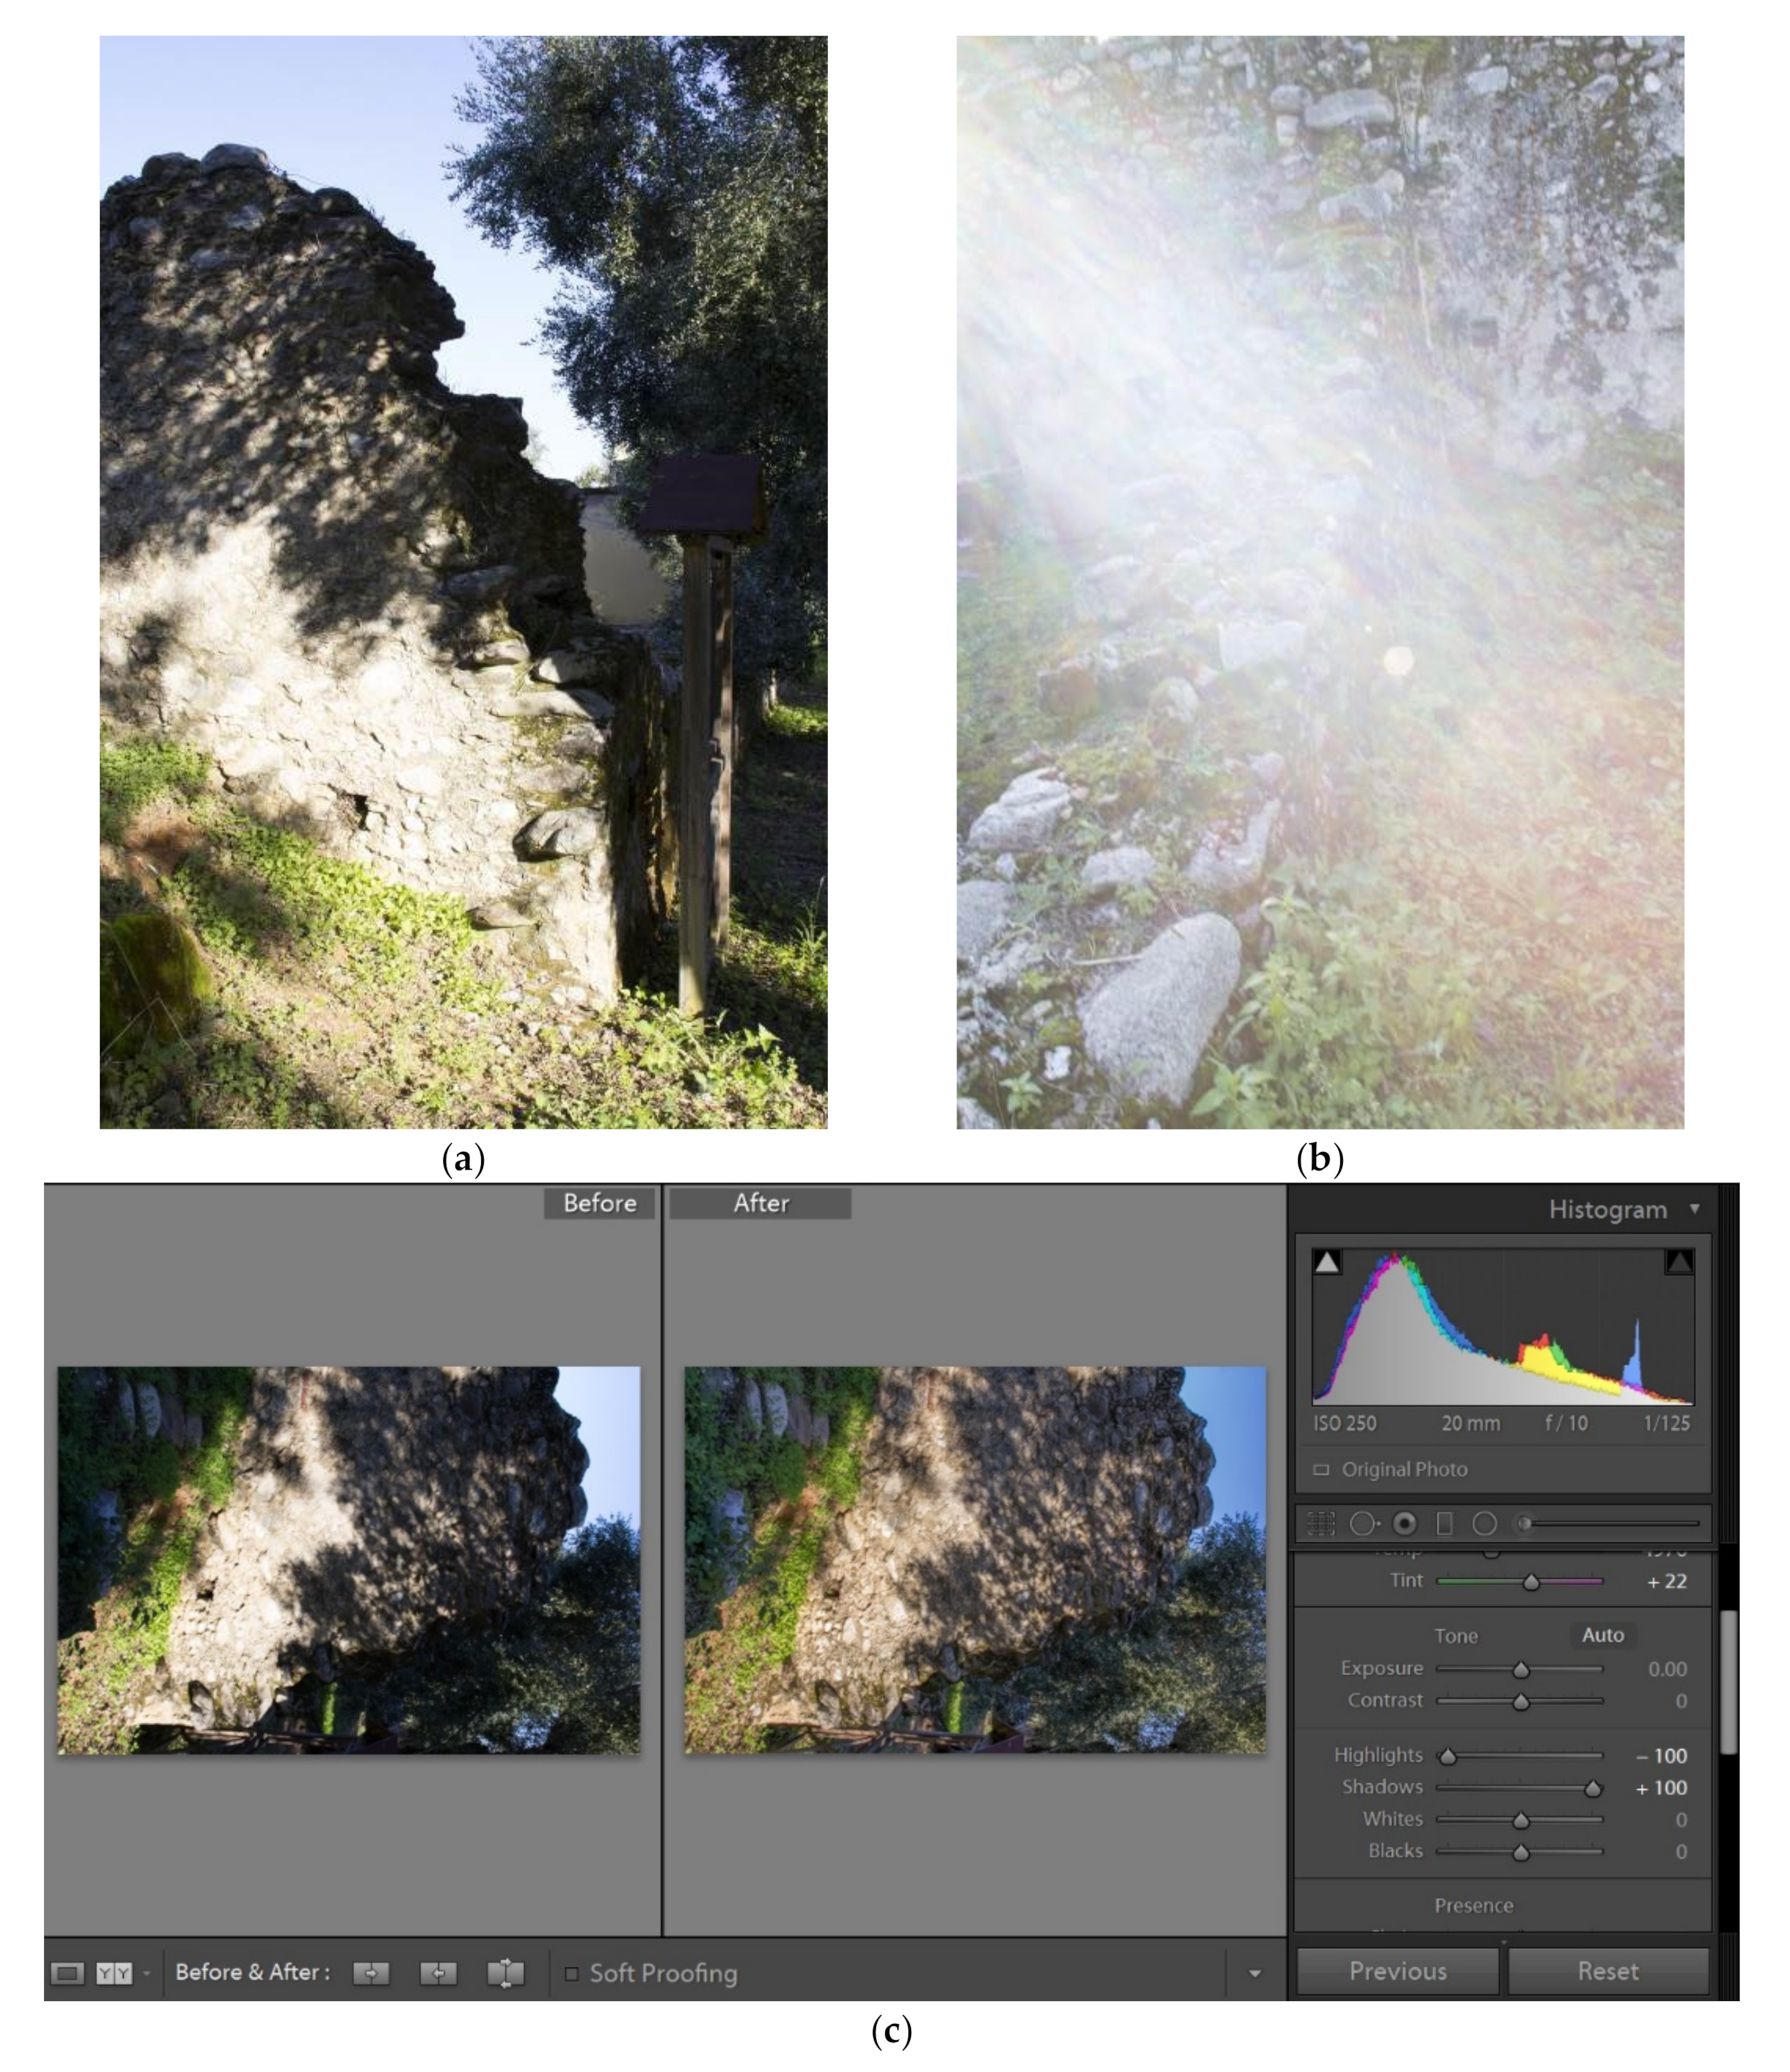
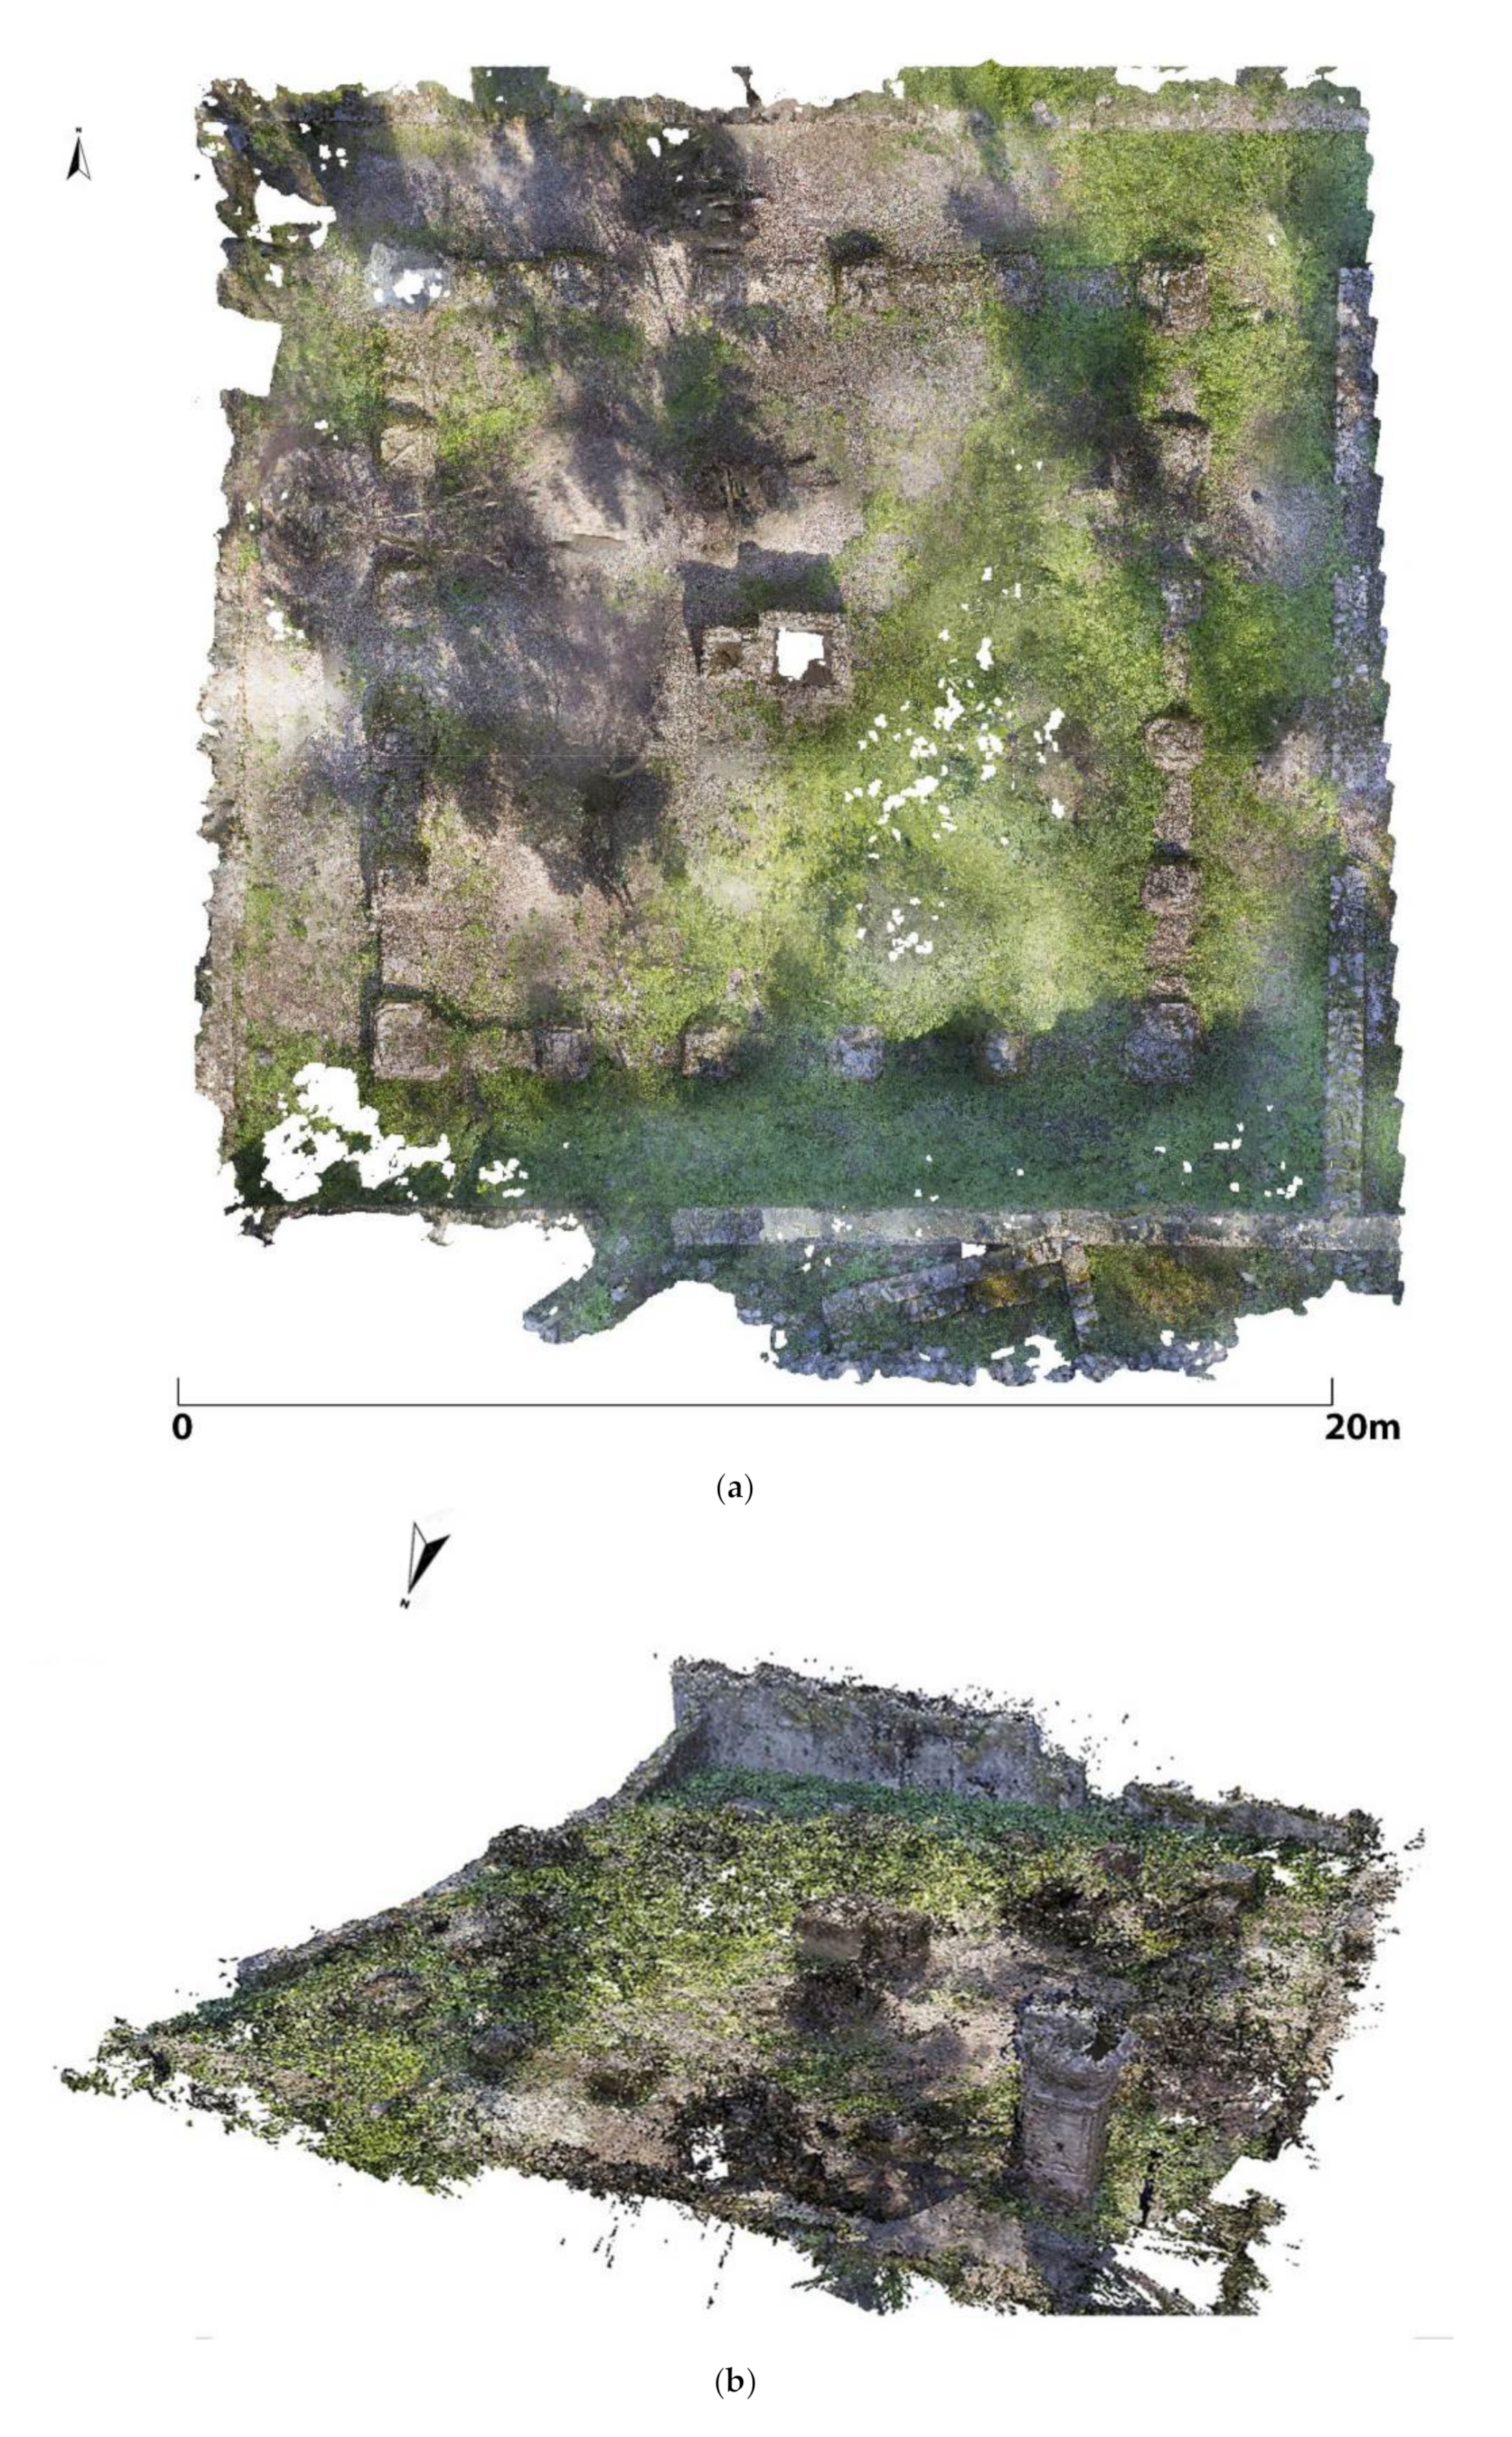
3.1. Photogrammetric Survey

For the 3D survey of the remains of the archaeological area, it was decided to opt for photogrammetry as it is more agile given the conditions of the archaeological park at the time of the survey; the presence of large olive trees and the need to climb the walls forced the choice on a much more portable and adaptable 3D survey technique. Furthermore, as a matter of site documentation, the superintendency requested the radiometric data in addition to the geometric one.
The camera used for the survey was a Canon APS-C 60D with a 20 mm fixed lens. Given the weather and lighting conditions, it was decided to set the ISO at 150 and the aperture at 10. At the end of the two days of shooting, it was still possible to acquire the entire cloister with nearly 800 images acquired. The overlap among the images was kept between 60% and 80% because of the natural conditions of the site with the trees that covered part of the structures. The shooting was performed starting from the outside of the site and then covering the internal part of the cloister moving around the structure in the internal area and the shooting distance from the structures was a mean among different measurements, in specific from 0.5 m to 2 m, due to the presence of the obstacles that influenced the shootings. The lighting conditions have created a whole series of problems regarding the correctness of the images. The site is in fact located within a park planted with centuries-old olive trees which, together with the sunny day, have created many shadows on the walls to be surveyed (Figure 2a). Another problem that was faced concerned some shots that were unfortunately against the sun (Figure 2b), and which were then redone several times until the best shooting position and condition were found. The processing of the images required a great deal of effort to be able to fix the photos due to the aforementioned problems. The first step was related to the arrangement of RAW files in Lightroom to limit overexposure and too dark or too light points due to alternating shadows/lights. The black and the white areas in the pictures were corrected acting on the “shadow” and the “light” slide in Lightroom. Changing the value of each parameter it was possible to make the details in the pictures more visible. As an example, placing the shadows slide to zero and the light slide to 100 it was possible to enlighten the dark images. On the contrary, using 100 for the shadows and zero for the light, and playing slightly also with the exposure, it was possible to darken the white images (Figure 2c).
Furthermore, since the olive trees were planted at the vaults above the ruins, it was necessary to move branches or adapt the shot so that they covered the structures as little as possible (Figure 3a,b). In this way, even if the presence of the trees made it difficult to set up a precise photogrammetric block and influenced the shooting distance that changed a lot during the campaign, it was possible to produce a 3D point cloud as accurate as the final goal of the project required.
The point cloud creation process was developed with Agisoft Metashape software while maintaining the alignment and dense cloud creation software parameters, high. The final precision counts a GSD of 0.5 mm that was calculated using the mean shooting distance, and the scaling of the cloud was done with Polyworks software, aligning the photogrammetric point cloud with the DTM from a flight with a drone equipped with a Lidar YellowScan (YS) Vx15 Series used as reference. This instrument has a precision of 1 cm and an accuracy of 5 cm and the accuracy of the DTM after the post processing was 3 cm. The authors used the DTM but did not acquire the data nor post processed it. The information reported in this paper were given by the company which did the survey. They did not use validation points or markers and we did not have the possibility to use markers on the field because the superintendency refused to allow us the put the markers directly on the structures. The final standard deviation calculated after the alignment of the two point clouds was 1 cm. Few in situ measurements were done in order to double-check the scaling of the 3D point cloud; one on the pillar, one on the wall, and a couple between two basis of the pillars of the cloister. Considering the human error in taking the measurements, both on site and on the models, the differences were less than 2 cm and considered suitable and acceptable for the purpose of the work. The value was considered acceptable considering the size of the site, the fact that the photogrammetric survey only covered a small part of the site acquired through Lidar and above all the different accuracy of the data used, as well as the ultimate purpose for which it was produced, namely site documentation and building reconstruction. It must be emphasized that there are no in-depth bibliographic data concerning the investigated area and therefore the photogrammetric and Lidar surveys were the first accurate data that the superintendency was able to obtain. The point cloud was exported to *obj and used both for documentation, and for the creation of the mesh and the subsequent orthophotos, useful for the extraction of profiles, and as a basis for the 3D reconstruction of the complex (Figure 4a–d).

3.2. Data Analysis

The usefulness of working with 3D point clouds obtained from reality-based survey techniques lies in the possibility of relying on accurate and precise measurements. The requests formulated by the local superintendency aimed at the strict observance of the state of the art of the site, oriented towards the realisation of a model preferably linked to an information system, and a possible 3D reconstruction that could be used for the tourist–cultural enhancement of the site through Augmented Reality applications. In fact, the archaeological remains are in a little-known area, far from famous sites and requiring a complicated route to reach. The possibility of sharing information about the site linked to a 3D model explaining its structure is therefore essential to promote knowledge of the area.
The choice of photogrammetry as the best surveying technique was made due to the following facts: (i) the layout of the remains in the archaeological site, with olive trees and narrow spaces made it difficult to use a scanner; (ii) the terrain that in certain areas is not flat and, in few areas, also steep; (iii) the importance of the texture in the final model was underlined in the requests of the superintendence; and (iv) photogrammetry is better also for cost efficiency.
It was also decided to use the 3D point cloud as basis for the 3D reconstruction to avoid the approximation derived from the meshing algorithms.
Triangular meshes are defined by a series of triangles which barycentre describes a linear surface representation.
The reconstruction of surfaces from oriented point cloud is rather difficult. The point sampling is often non-uniform and the positions and normal are generally noisy due to sampling inaccuracy or scan misregistration. Starting from these assumptions, the meshing part of the process supposes the topology of the unknown surface, fitting accurately the noisy data and filling holes reasonably. This usually produces an arbitrary surface that may present topological errors and sharp features. Simplifying, considering a set of points that are assumed to belong to a surface, the process tries to approximately reconstruct this surface. As said in [21] (p. 3), “a surface reconstruction procedure cannot guarantee the recovering of (the surface) exactly, since we have information about (it) only through a finite set of sample points. Sometime additional information of the surface (e.g., break lines) can be available and, in general, as the sampling density increases, the output result is more likely topologically correct and converges to the original surface. Usually if the input data does not satisfy certain properties required by the algorithm (like good distribution and density, little noise), the reconstruction program produces incorrect or maybe impossible results”.
Undoubtedly, to represent the cloistered space correctly and accurately constitutes the ambition of every surveyor, an ambition that the photogrammetric survey allows to fulfil by providing with sub millimetric precision the true shape of the area together with photorealism of the state of the art. The efforts made in the massive acquisition of data, however, risk being consultable by a restricted circle of specialists. On the other hand, a dynamic and overlapping organisation of data and acquired knowledge, managed, and controlled by semantic processing algorithms can lead to the production of documents and ontological structures (distinct and correlated) suitable for all levels of study and interest, which can be organised for multimodal purposes and with transmedia technologies. The semantic subdivision of the model in its main structural part in the BIM software is a main part of the work during a 3D reconstruction of ancient buildings, especially the ones which are heavy damaged and of which less parts are visible. In this way it is also possible to subdivide and organize the archive of informative and geometric data inside the HBIM container. In this case it is defined as the semantization of components. Structured memories make it possible to enhance the dissemination–communicative and cognitive value of the investigated complex, making the work of multidisciplinary interest. This choice is intended to show the need for a philological reconstruction to be the source of shared and interoperable workflows.
The photogrammetric model avoids errors and problems of adequate accuracy [22,23,24,25] and the 3D point cloud, purified of the parts not compliant with the structures (e.g., trees, persons, etc.) makes it possible to read the pitch of the colonnade, the dimensions of the pillar bases and thus the width of the cloistered periplus, appreciated in relation to the curtains of the perimeter walls. Furthermore, the study of the orthophotos, if carried out in bi-univocal correspondence with the zenith view, offers clues for the reconstruction of the hypothetical original appearance of the roof on which the perfectly levelled screed formed the base for the floor of the upper level [26] (pp. 55–68). One can distinguish at the bottom of the south orthophoto, two arches with a visibly irregular profile and different dimensions, both in length (arch span) and height (arch arrow) (Figure 5).
Compared to the zenith view of the photogrammetric model (Figure 4a), the first appears to be the trace on the vertical plane of the roof covering the cloistral corridor orthogonally: a barrel vault, one supposes, being the “simplest” to build with juxtaposed stone blocks to unload the weight on the perimeter wall (70 cm) and, on the opposite side, on the external pillars (average size about 130 × 130 cm). The choice is supported by numerous examples from the Romanesque period that testify to the recovery of the Roman building tradition: in this era, the wooden ceilings caused by fires and destruction were replaced with stone vaults.
The second arch, on the other hand, deflected from the orthogonal (east) corridor, can be traced back to the trace-matrix of the lunette set on the arched passage after the first span following the angular one. The static pattern of the pendentives of the vault covering the cloistered ambulatories varied according to the latter, i.e., the maximum height to be covered [27,28,29,30].
A supposed correspondence of the arches in the passage of each span, limits the construction alternatives of the “nails” (the portion of the vault between the diagonals of the polygon and the vault front) between them; in fact, among the possible connections, the solution offered by an ideal straight cylinder that transversally intersects the longitudinal barrel vault appears to be the most immediate of the composite vaults.
In this case, the shapes recorded on the orthophoto and on the 3D point cloud would be the matrices of an ideally “ribbed” (A rib vault or ribbed vault is an architectural feature for covering a wide space composed of a framework of crossed or diagonal arched ribs. Variations were used in Roman architecture, Byzantine architecture, Islamic architecture, Romanesque architecture, and especially Gothic architecture vault). As such, the span of the arches recorded with the 3D survey and analysed in the profile also identify the maximum height of the centre of the vault, which in the ideal model is considered constant. However, other hypotheses cannot be ruled out, i.e., a greater height in the centre of the span than the impost arch [31]. Although the Egyptians knew the elliptical arch and used circular arches in later epochs to distribute loads [32], (pp. 25–52), the art of constructing precise radial joints was an invention that marked the slow progress of stereometric technology [33]. A fact that also marks the structural rationality of the corner pillar to the north, the only one left standing up to the height of the arch impost; clearly visible are the invitations to the arrangement of the ashlars of the passageway arches; the stone blocks remain stable and in position if the weight being transferred from one to the other makes the succession resistant to compression.
Arches and vaults, semi-elliptical or semi-ovals, are by election curved structures with lowered or raised profiles. They are irregular in Romanesque architecture and not only because of faults in their construction but very often by design they are incomplete, presenting angular points of parts to be connected at the piers. The surfaces of the bays rendered exactly in the rectangular shape and not square impose impost profiles on the long side with an arrow less than half the span, having assumed the vault to be composed as a cross vault for the reasons explained in the analysis. The profile of the lowered arch can ideally be elliptical or oval in the impossibility of recognising the nature of the profile of the lowered arch by sight or by rigorous procedure, as Pascal’s 1640 theorem states [30] (p. 461). We therefore relied on the traces of the arches polished with detailed attention on the 3D point cloud that allowed us to accurately check the graphic model at the horizontal recurrences of ashlars and bricks.
The fact remains that the only complete profiles, recorded and therefore analysable in their curvature, are very irregular. A fact that is not surprising, just as it is not surprising that the spans are anything but modular following the unequal pitch of the pillars. They are curved lines derived during construction rather than full radius or polycentric arches. The consequences include roof surfaces that are anything but geometric vaults derived from the ideal intersection of transverse longitudinal cylinders.
The custom of using bare materials or roughly shaped stone blocks on site, together with the need to join walls in harmony with the nature of the site, finds the most suitable technical support in the art of stereometry [34] (p. 336). Therefore, it is the forma mentis of the masters of masonry work that provides further indications. It is a practice, most often handed down orally and enriched by direct observation of classical texts, examined more frequently than one was inclined to believe in the past. One of the most frequently used procedures was “quadrature”, a system explicitly certified in 15th-century drawings; operations of tilting and rotating the points into which the surfaces to be covered, or the mirrors of the towers, were broken down, which made it possible to calculate the progressive reduction of the horizontal sections [35].
A fact that also marks the structural rationality of the north-west corner pillar, the only one left standing up to the height of the springer of the arch. The pilot hole to the arrangement of the ashlars of the passage arches, demonstrates—for the stretch still observable—that the stone blocks remain stable and in position, if their weight in transferring from one to the other has them undergo to mutual compression (the common tangents at the points of variation of the curvature make the succession resistant to compression) [35,36,37,38,39,40,41,42]. The homologous correspondences between the orthophotos (vertical and horizontal) therefore guided the identification of the measurements necessary to resolve, with the aid of mathematical multiples and submultiples, the geometric rationality of the system that by “anastylosis”, one seeks to reconstruct. However, the need to deal with the attribution of the construction characteristics of a work of historical value [43], directs the documentation of the analyses therefore to the multidimensional control of the mechanisms of participatory cooperation. In keeping pace with contemporary needs, it is a matter of placing the investigation within a cultural system that discusses the management of the data collected and according to uniform criteria and standardised principles [44]; in other words, addressing the difficulties generated by the need to reconcile contrasting aspects such as standardised seriality and, on the other hand, the singularity of unique solutions such as those of historical artefacts in general—Romanesque in this particular case. It becomes a priority in this perspective to organise a global model managed within an assisted modelling software oriented as much to the representation of physical characteristics as to the semantic information of the components. The method Building Information Modelling (BIM) seems the most suitable to correlate historical, material, metric, structural, etc. data for the purpose of a complete documentation; it will be necessary to manage archive documents reports, photos, drawings, diachronically updated surveys. The massive accumulation of data gives way to the production of a flexible digitizable heritage, therefore, being able to explore the idea of a scientific “geography of knowledge” [45] articulated around the interdependence of space–time form of component objects. The extraction of components—whether by the direct or indirect method changes little—requires the contextual association of families of technologically determined types stored in dedicated system instructions.
The geometric complexity involved in the correct stereometric projection of the ashlars, and the various architectural surfaces led to the use of the indirect method to respond to the need to proceed to the creation of a “federated” model. The combined use of CAD programmes and BIM functionality addressed the geometric detail required to transcribe the parametric form into a component–object appropriate to the initial conditions [46]. The “locus” of points described must be verified with the locus of mathematical points, a question certainly not an end as [47] explained. The informative management of the historical building required shaping a regular form of the roofing components: a problem, first, of solid geometry that the photo model was able to validate in the results of the surveyed parts.
Since, however, this is a construction from the first millennium, there are no archives suitable for a digital description. It is, however, possible to proceed correctly by linking the geometric detail with informative data sheets (Level of Information Needed). Placing the punctual survey of the existing at the origin of the workflow at each stage of reconstruction, it will be possible to evaluate the gap between the real form and the normalised form to manage the information [48]. The resulting system centred on the semantic structuring of ontological data is aimed at creating a cultural vision [49] a territory of common goods capable of developing mechanisms to produce intelligible data. This explains the choice of placing before the organisation of the design workflow on the existing, a polygonal model, the most suitable for describing the peculiarities of the place in such a way as to make the data considered objective, measured in the comparison, comparable at every stage of the design cooperation. As of today, the level of detail chosen for the presented model is labelled as “generic” according to the UNI standard (https://0-www-bsigroup-com.brum.beds.ac.uk/en-GB/iso-19650-BIM/ accessed on 22 September 2022). However, the approach given to the simulation does not preclude a discussion of the results achieved within the not only national research landscape, characterised in relation to previous studies and current working hypotheses.

4. Results

The 3D survey of ancient Oppido Mamertina was commissioned to achieve the virtual use of the site by the public and to document its state of the art. During the work, it was decided to turn towards the definition of a repository that would allow the data collected to be stored and subsequently consulted. A repository would also allow it to be implemented over time and thus record the diachronic mutations of the site, that is, by its very nature, the result of the destructive work of time, the stratifications of evolutionary phases, degradation, maintenance restorations, and architectural modifications over the centuries. As is often the case, also for the cloister of the Friars Minor of the Order of St. Francis of Paola, the related information is multiple and differently articulated. Collected with different objectives, the fragmentation of information is an ever-present problem when it comes to documenting the inherited heritage. The risk of losing information is real. Here is where three-dimensional modelling, already widely used in the field of Cultural Heritage as a support to knowledge, conservation, valorisation, and restoration, gives way to the construction of an information model in which the archive of data and documents is visualised directly on the construction of a digital twin consistent with the objectives set.
The execution of the work required considerable effort, especially regarding the data acquisition and post-processing phases, during which dedicated software were used to manage the cleaned and reduced point clouds (Figure 6a,b) to be used in the reconstruction of a model that for the organisational structure and the type of self-employed can be classified as an informative HBIM for historic buildings.
The archaeological remains were too few and deteriorated to isolate a complete portion cloud to the restitution of a digital twin. Archaeological remains were however sufficient to use the points acquired as reliable lines to hypothesise on methodologically founded data, the configurations suitable for the morphological restitution of volumes. In this way, the use of 3D point clouds from reality-based surveys, becomes a precise and accurate data on which to build the vaulted corridor to have a symbolic–generic digital model necessary to respond to the client’s demand.
Bearing in mind the objective commissioned by the superintendency, to date directed towards promotional content applications, the work stages are listed below (Figure 7):
-
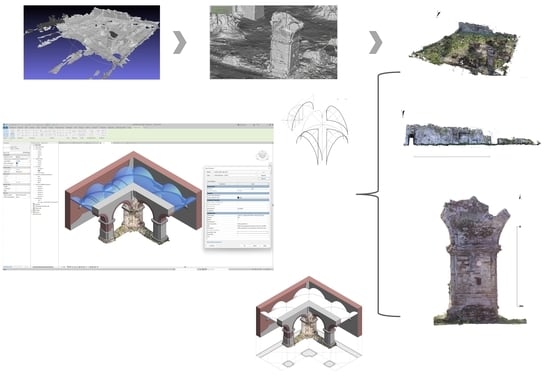
The “unstructured” model was transcribed into polygonal mesh. Starting from a dense point cloud of more than 106 million points, a mesh of 50 million polygons was created. This was then again cleaned, for the creation of orthophotos and a textured model to be given to the superintendency.
-
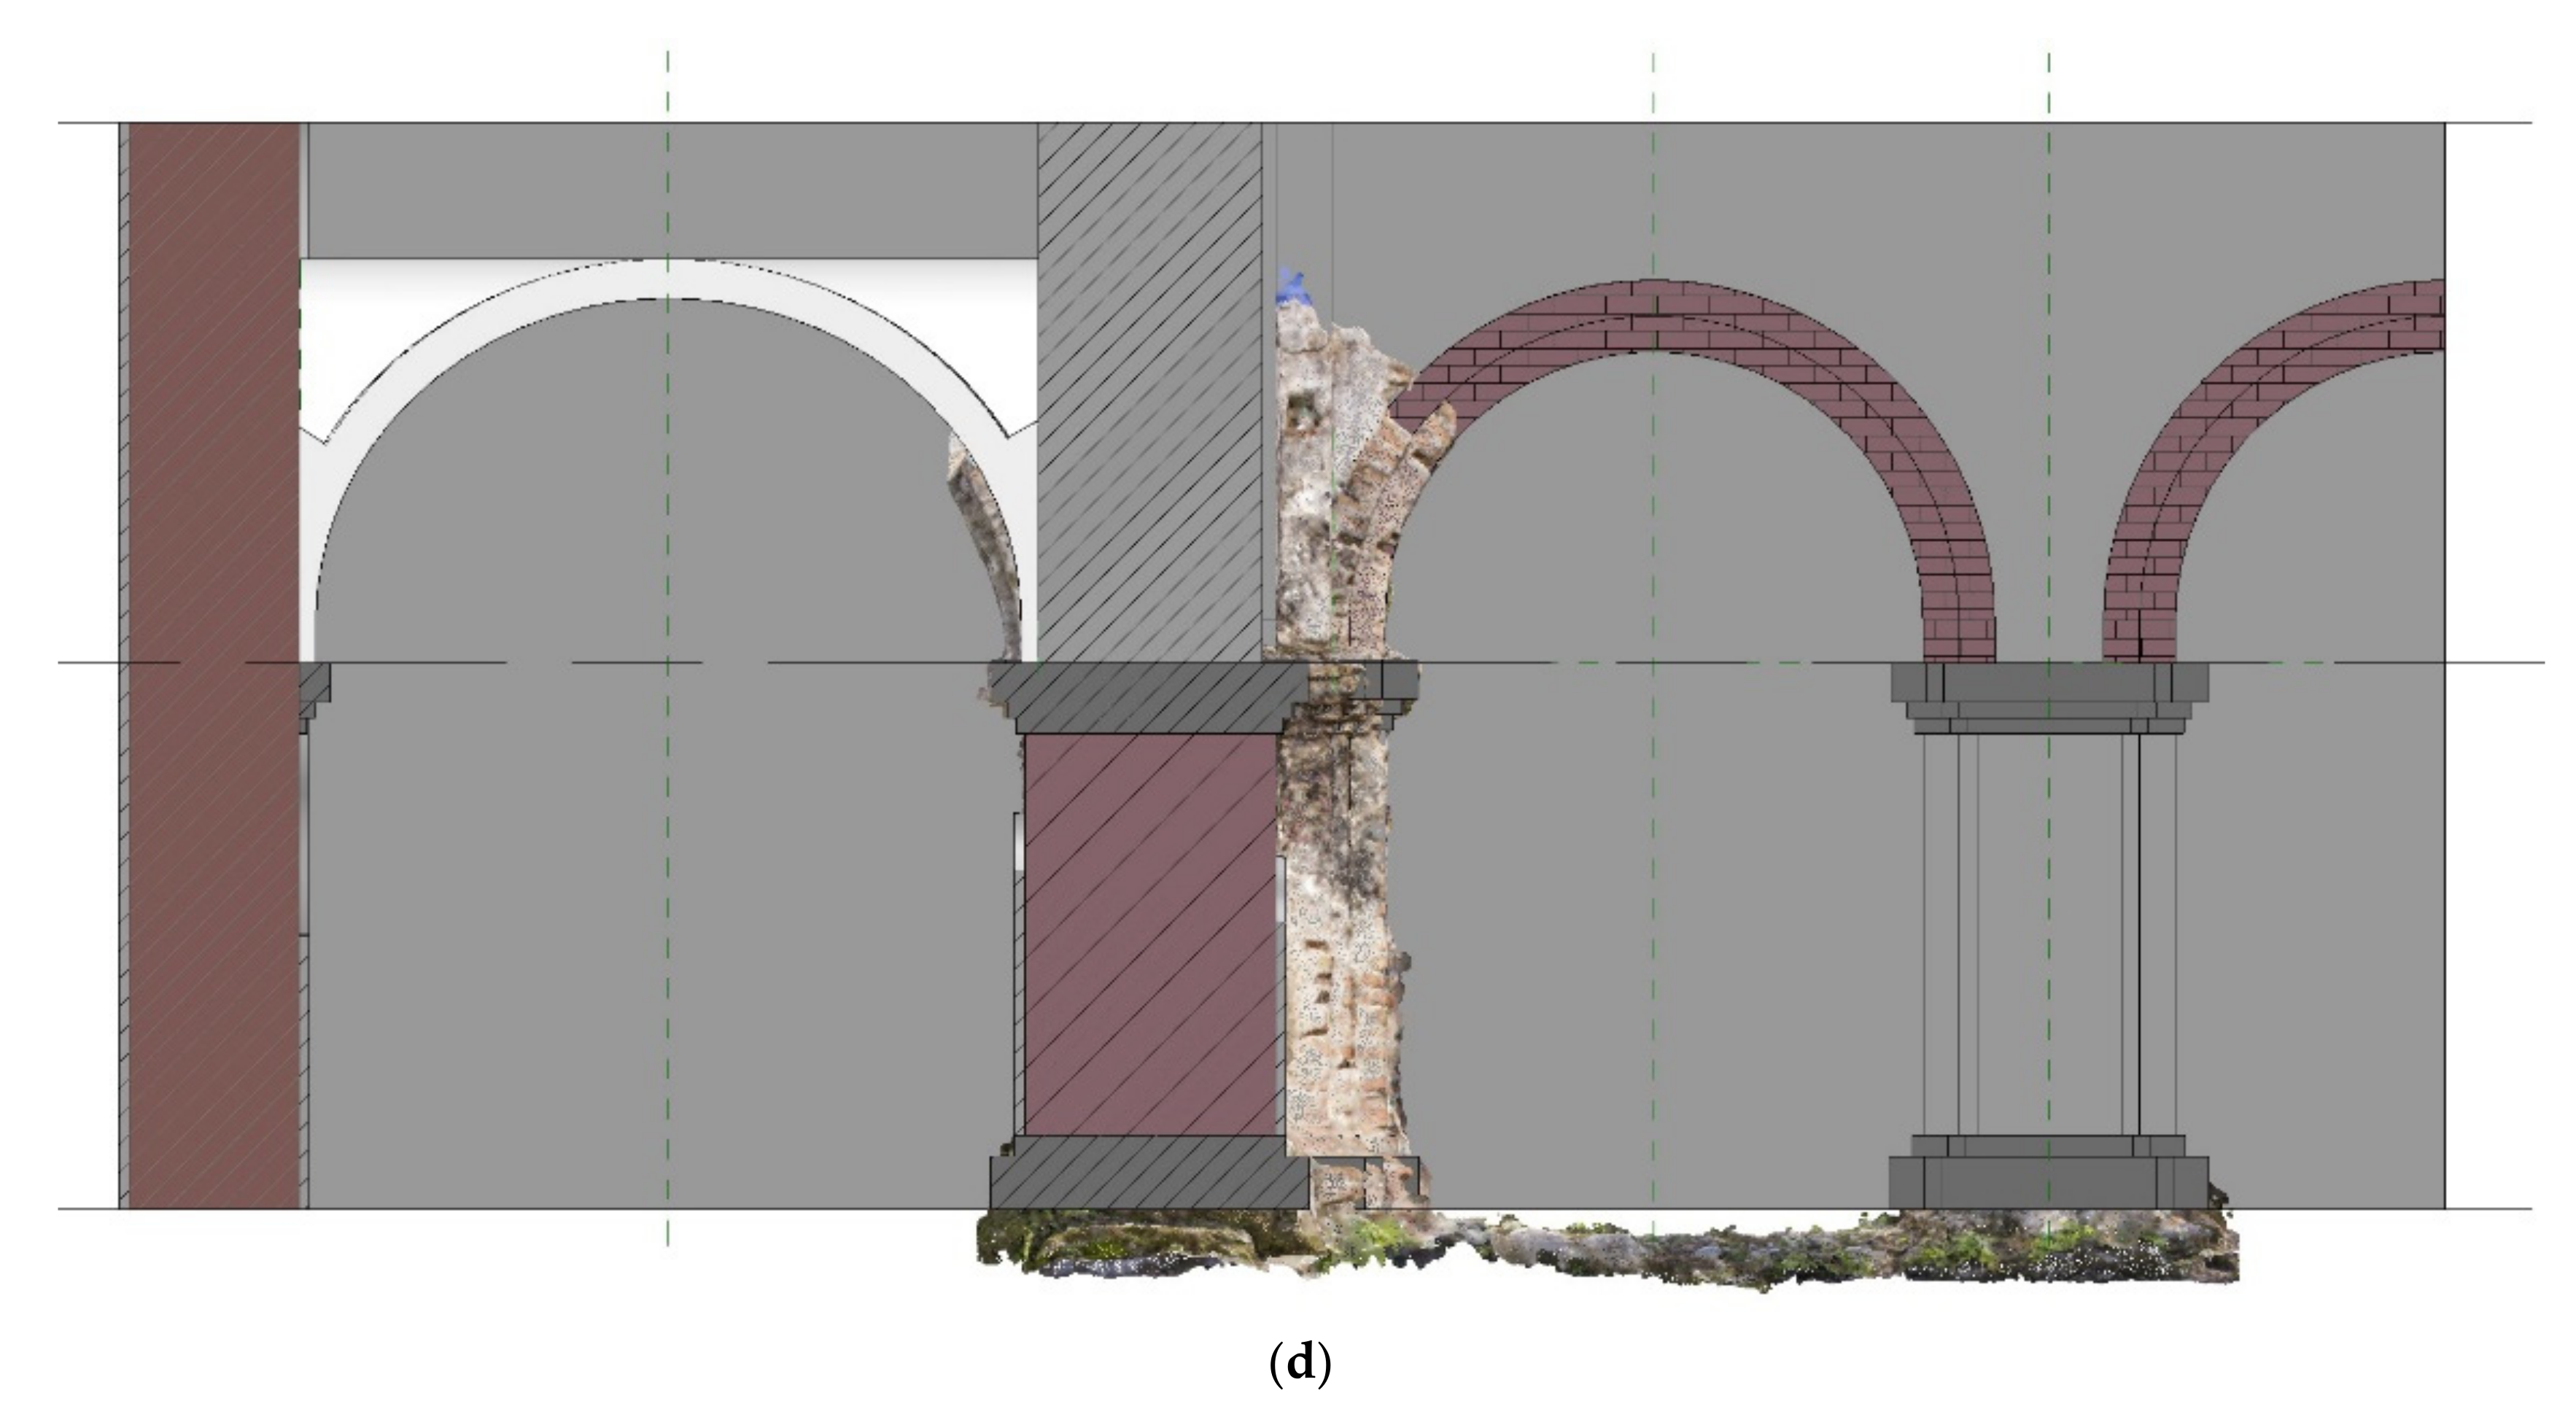
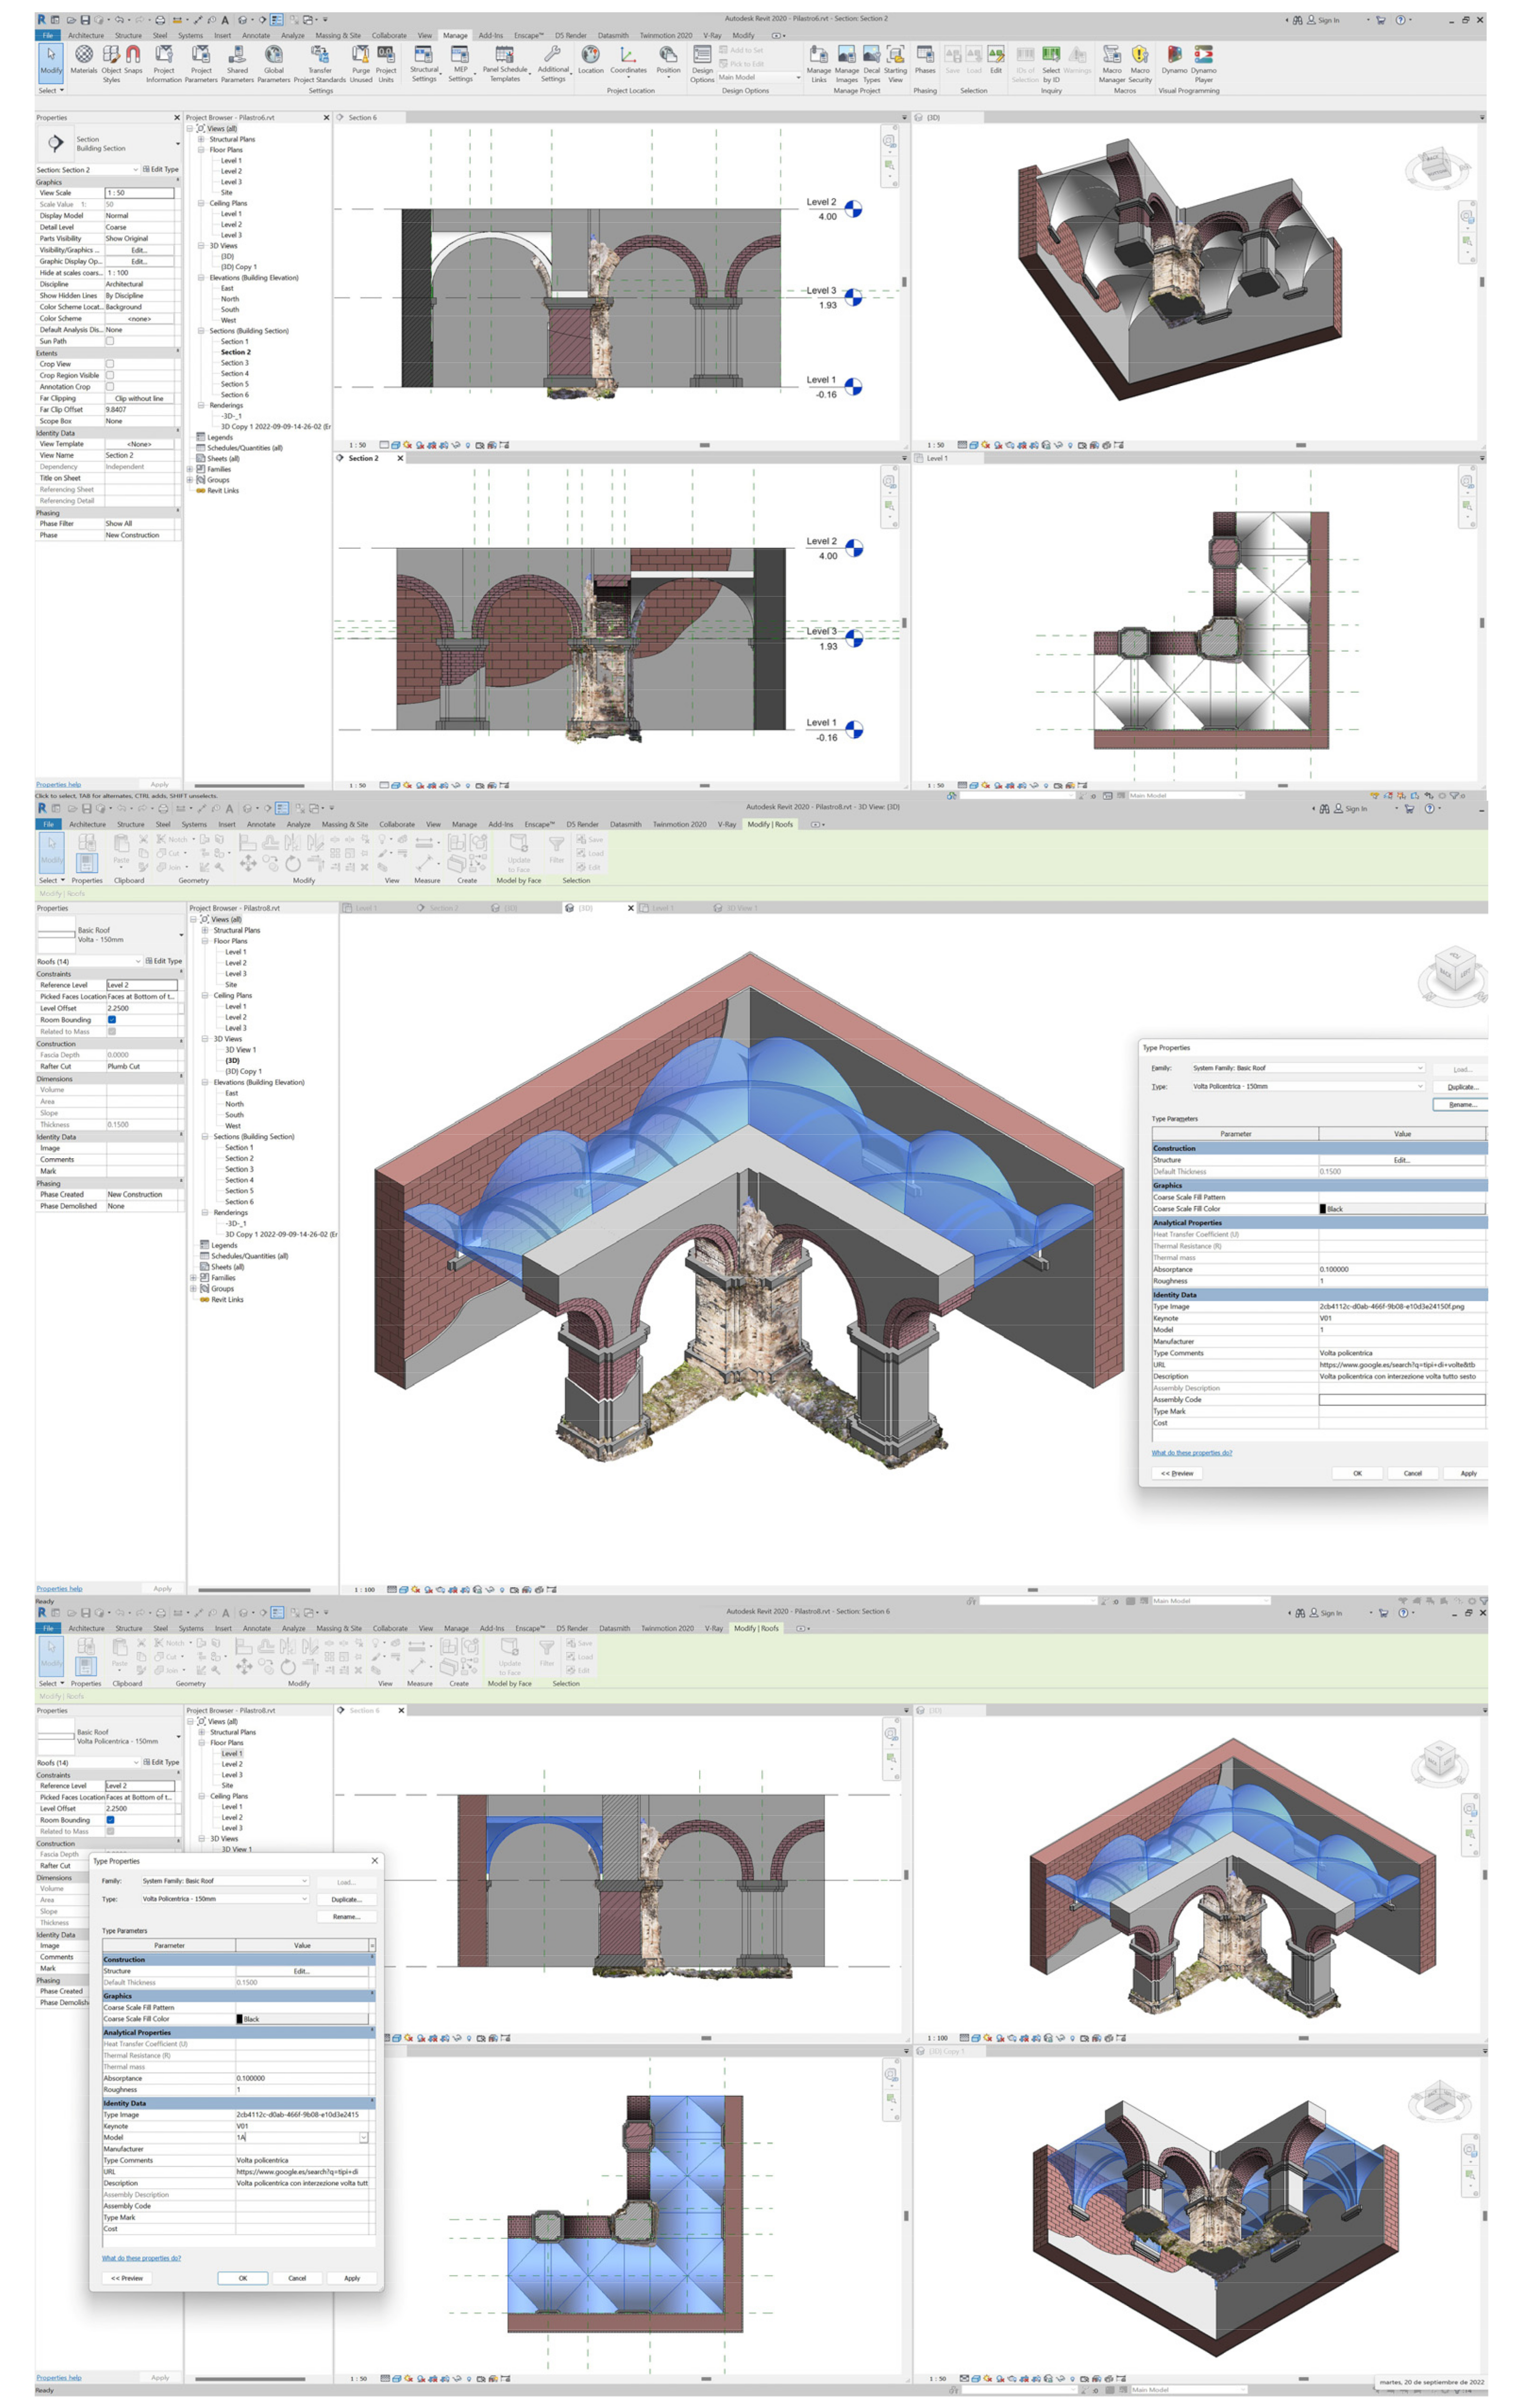
The 3D point cloud (Figure 7) was imported in e57 format into the Autodesk Revit 2020 software, dedicated to the informative modelling of artefacts. Using an indirect method, the typological characteristics were then recognised. Therefore, geometric configurations with clear semantic meaning were interpreted around the main fabrication entities, i.e., the modelling “families” predefined in the application used: walls, pillars, floors, etc., i.e., system structural types. To obtain the vaults, Autodesk Revit’s “Masses in situ” command was of fundamental importance. Through a process of “trial and error”, based on the dimensions of the arches obtained in the previous phase, the remains of the bays in the perimeter walls of the cloister and the distance between these and the pillars deduced from the orthophotos of the plan, it was possible to reproduce both the vaults located in the corner of the corridor and those located in front of each of the arches of the gallery. Hence, porticoes composed of concentrically duplicated semicircular arches that start at an offset of approximately 16 cm from the capitals of the pillars were obtained (Figure 8). It was thus possible to reconfigure the roof in this part of the cloister.
-
The level of detail (LoD) compatible with the objective set (LoD generic in the sense of the standards [UNI: 11337-4 2017]) was then established. The application used requires, in fact, with the morphological identification of the component, the contextual definition of the information that the photogrammetric acquisitions allow to provide with precision and accuracy (thickness length, width, volume, material stratigraphy).
-
Once the level of detail had been established, the problem to be faced was how to transcribe the irregular shapes of the point cloud into normalised configurations. Numerous problems were encountered to reconcile the singularity of each element detected with the standardisation necessary for the digital manipulation of the components.
-
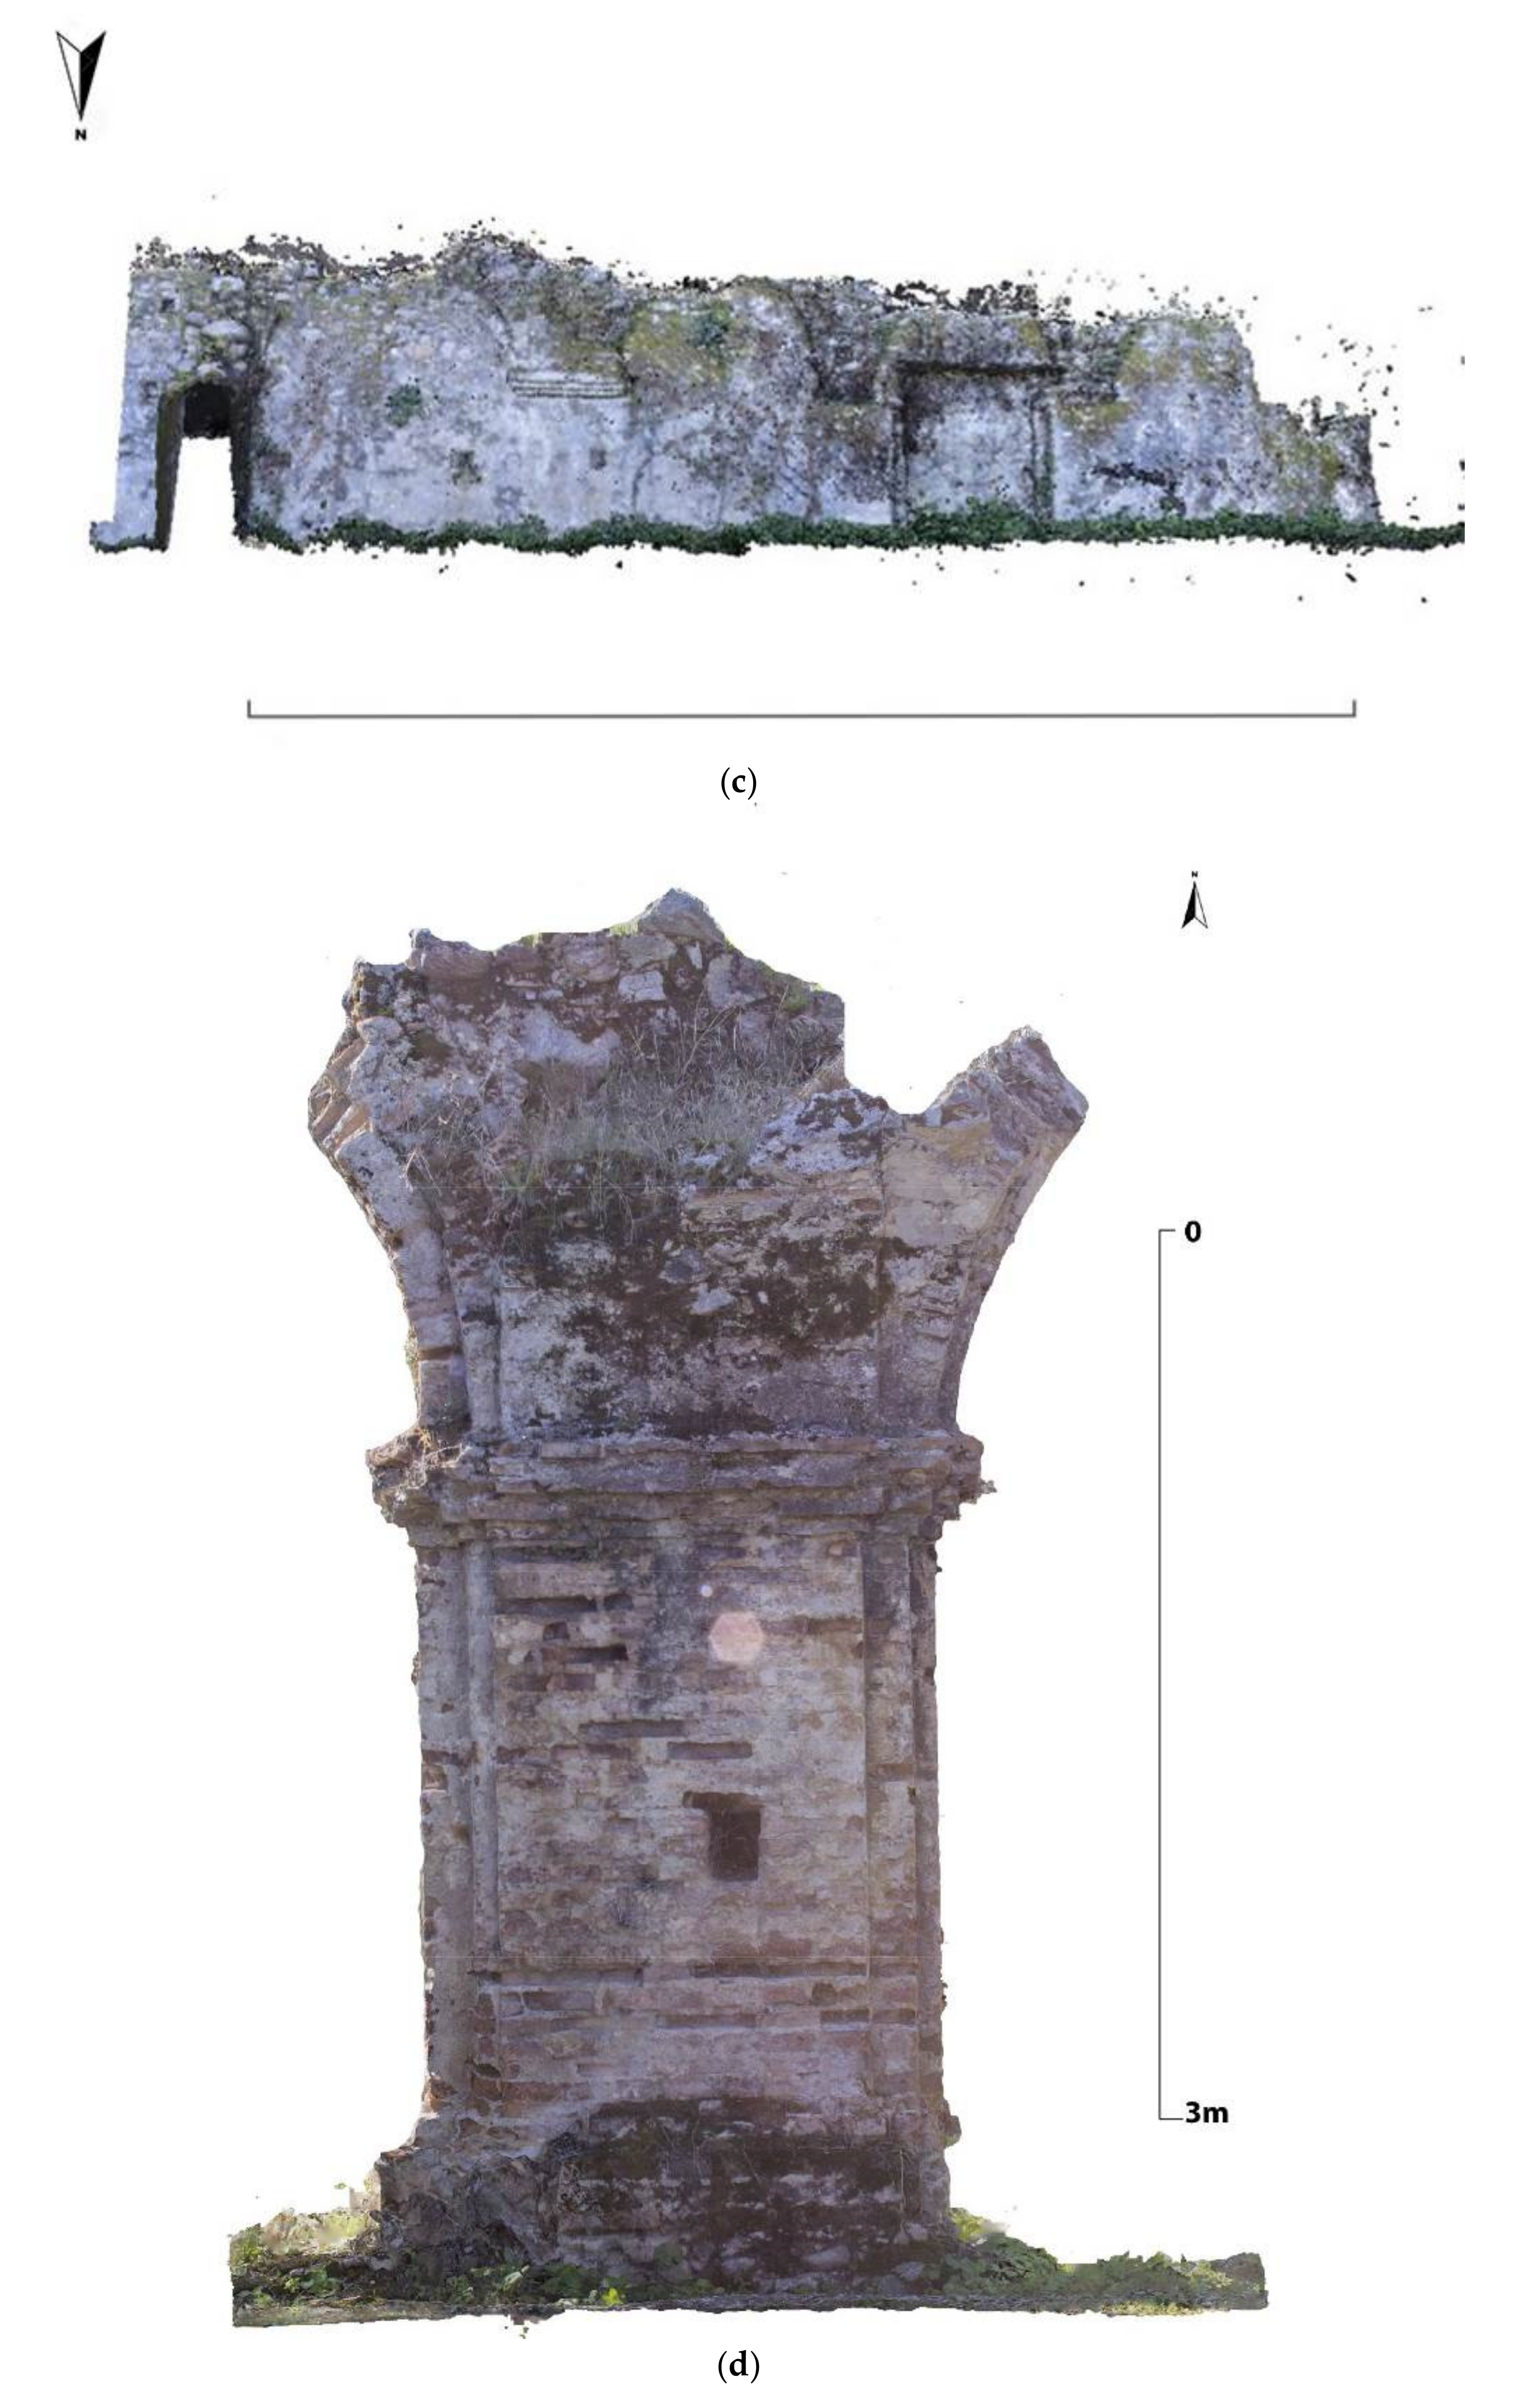
Having set the point cloud as the origin of the workflow to make it possible to compare with mathematical certainty the discrepancy between the real model and the simplified one constructed, it was proceeded to digitally construct the component-objects according to the chosen level of detail (LoD) and therefore relative to both the geometric detail (LOG) and the appropriate informative detail (LoI). For this purpose, the analyses discussed in the previous Section 3.2 were useful: from the scaled profiles visible in the orthophotos (South) the measurements of the spans and arrows of the arch were obtained, and therefore the inclinations and angles useful for restoring the genesis of the cross vault considered the most suitable.
Figure 7. The flowchart of the work.
Remotesensing 14 05152 g007
Figure 8. The highly accurate definition of the information allowed using the photogrammetric acquisitions: the theoretical scheme of a vault (a); the reconstruction of the vault system starting from the photogrammetric model of the angular pillar from above (b) and below (c); the section of the reconstruction ((c,d) (authors’ elaboration)).
Remotesensing 14 05152 g008aRemotesensing 14 05152 g008b
As shown in the images, the level of detail of the information model can be interrogated and updated by those using the same programme. The consolidated international acronym LOD: ‘Digital Object Development Level’ is maintained; LOI: ‘Object Development Level—Information Attributes’. To avoid confusion between the attributes Definition/Detail and Geometry, the LOG (Geometry) level was created. A general LOD scale was also defined as: —LOD A symbolic object; —LOD B generic object; —LOD C defined object; —LOD D detailed object; —LOD E specific object; —LOD F executed object; —LOD G updated object. In addition to the in-progress detail necessary to trace the seven levels set by the current regulations, it is the authors’ intention to integrate the database linked to the collection of archive data to the present date and divided into previous documentation (both excavation and photographic and/or graphic). The information linked to the construction in digital form has been divided into:
-
Definition of the different types of material used (local stone and brick) and explanation of why it was decided to use different construction techniques.
-
Definition and different representation of the data acquired through direct survey and data from analysis and calculation.
-
Any coeval sites that can be used as a possible comparison.
The information stored in different levels, although available and consultable (Figure 9), will find a unified place in the HBIM model accessible from a dedicated platform in which to arrange the 3D reconstruction of the site starting from the photogrammetric data, since some problems, inconsistencies, and variables still must be resolved, starting from the comparison with similar and mostly coeval sites that can provide other cues for a more accurate reconstruction.
A comparison between the 3D point cloud and the reconstructed model was conducted regarding solely the pillar, which in fact was the starting point of the geometrical analysis and the philological reconstruction. The comparison was done using the software CloudCompare providing a cloud to mesh analysis.
The final standard deviation between the two models was 0.056 m that was considered acceptable bearing in mind that the comparison was done between an unstructured 3D point cloud of an ancient remain, derived from a reality-based survey, and a CAD drawing that is an approximation (Figure 10).

5. Discussion

Over the last thirty years, activities in the fields of the survey and representation of Architecture and the Environment have focused attention on the need to acquire ever more rigorously the data necessary to provide reliable reconstructions of the reality under investigation, extended to the identification of missing parts by means of philological analyses based on the objectivity of the survey. Decisive help has come from the instruments and methods based on the products of computer science research, which has placed at the service of surveyors economically accessible no-contact tools and technologies, and software packages, sometimes open source, of great efficiency and are intuitively applicable. Similarly, the latest generation CADs have enabled the representation of geometric models not only of high definition but also capable of parametrically governing the modification of the shapes represented.
The current research horizon, using new and powerful three-dimensional acquisition systems, has further revolutionised the way we store, share, and access point clouds, promoting a different approach to survey activities and their digital denotation. The aim has shifted from the mere visualization of the physical–morphological characteristics of the artefact to the semantic structuring of the components. In other words, from mere graphical representation to the reconstruction of parts with clear technical meaning, simulated within virtual processes that build the model as an information space. It is therefore conceived as a virtual ecosystem, which can also be adapted during the investigation to interpret technical, scientific, and didactic requirements.
The multidisciplinary interest, resulting from the current socio-economic as well as cultural approach, strongly characterizes the decision-making processes. Consequently, the final model constitutes not just the visualization of a geometric form (parametric, if you like) but a real “data base” that the dedicated program governs in the way it relates to different areas [50]. Interoperability between the professional figures involved in the action, very often belonging to different disciplines, can thus be extended over time. The digital model becomes the catalyst for diachronic information that can always be updated.
Different knowledge (architectural, constructional, structural, management, etc.) thus converge in models produced by the conscious aggregation of elements that, endowed with an internal structure, can be interrogated in compliance with precise rules [51]. The use of information systems and digital fruition processes become keys to development, creative economic, and employment, according to Pier Luigi Sacco [52]. Ensuring, even today and always, an extraordinary ability to produce added value beyond mere documentation, remains the cultural approach, and not only the technical operational one, as it identifies and links significant content using a structured search engine. It can therefore be said, summarising, that BIM models are “virtualised realities” with an intrinsic capacity for design interrogation and analysis. In fact, attributing weight characteristics, or structural, thermal, quantitative, degradation behaviour to geometry involves providing data and characteristics that go far beyond the mere visualisation of form. The use of semantics for describing/querying information models (BIM) guarantees the possibility of “remediating” aspects to produce and distribute goods or services through dedicated platforms [53]. For this purpose, databases based solely on data from three-dimensional acquisition technologies are not sufficient, but the definition of a semantic structuring for queryable “digital archives” is required. A substantial advancement in 3D scanning procedures is therefore required, together with a methodological approach that integrates diagnostic investigation procedures. Truly interoperable models are to be realised (since they are shared in format), thus able to enrich the interdisciplinary knowledge of the elements under investigation, by scholars, researchers, and even non-expert users. From a theoretical point of view, the advanced study of point clouds fits into discipline-specific production systems and/or individual analysis, which from an IT point of view develops products and services for multimodal purposes. The flexibility and ease of access to 3D data, placed at the origin of the workflow, when combined with a simplification of semantic data storage, makes cloud-based systems an efficient and effective tool for successfully integrating 3D surveys, analyses, and construction projects. The development of a standard open access platform, to “contain”, implement, and share historical, documentary, metric, morphological, material and conservation information, is therefore a starting point for any action aimed at the knowledge, conservation, restoration, dissemination, valorisation, and protection of the inherited architectural heritage.
A rigorous language, functional to the reading interpretation of the architectural and environmental 3D survey, developed with an adequate approach (ICT, of which the BIM model is a part), will allow the applied research of new and interesting fields of investigation (cf. RICS Evaluation—Global Standards effective 31 January).
The case study presented here is part of this research panorama, which obviously directly involves the disciplinary field of surveying and architectural communication. The results obtained (and those in the process of being obtained) are an appropriate opportunity to investigate and discuss the flexibility of cloud-based systems and the prospects that can be derived from them for the analysis and design of architectural, building, and environmental artefacts.

6. Conclusions

The use of the 3D point cloud, obtained by employing photogrammetry techniques, made it possible to base the digital reconstruction of the Oppido cloister on accurate and precise data, despite the difficulty of access and the poor state of the millenary ruins overgrown by vegetation.
Meticulous philological reasoning legitimised the interpretation of the missing parts with reference to the theoretical and methodological tools provided for the critical and mediated development of cultural heritage and in particular archaeology, on which much of the potential offered by digital technologies has been poured [54]. The technique employed as forms of prior memory has produced a mass of dates that semantic selection has sought to address the creation/communication of a model that considers philosophical as well as practical implications [55]. The occasion was in fact propitious to agree with the Superintendency of Reggio Calabria on a change in the objectives of data collection. No longer is there only the visualisation of 3D clouds or the use of a tourist route linked to the information of an information system [56], but instead a digital database, shared and interoperable, to experiment with modes of collaboration and interaction between the engineering and archaeology sectors, culminating in the production of an archive of information that can be expanded and modified over time, according to a consolidated need among the actors and promoters of heritage conservation [57]; a versatile and fruitful approach for the documentation of archaeological heritage, nominating itself as a complete knowledge management system, useful both for the consultation of the contained materials and for the more analytical study of the sites, aimed at comparing possible conscious reconstruction.
The transition towards the organisation of a streamlined information method (BIM) in its broadest sense of a collaborative process between actors operating according to structured logic [58] reveals the strategic potential of the results in the making. The state of the constructed model although “generic” to date (UNI 11337-4 2017), allows for a “federal” or “global” model in which the diachronically updatable 3D documentation is combined with the archive of historical and technical data. Therefore, the criteria and principles by means of which the results of an unprecedented and meticulous 3D survey were obtained, place the application verification among the scientific topics of current interest for the subject area.

Author Contributions

Conceptualization, A.R.; methodology, S.G.B. and A.R.; software, S.G.B. and S.L.G.; validation, S.G.B.; formal analysis, S.G.B., A.R. and S.L.G.; investigation, A.R.; resources, S.G.B.; data curation, S.G.B. and S.L.G.; writing—original draft preparation, A.R. and S.G.B.; writing—review and editing, S.G.B.; supervision, A.R. All authors have read and agreed to the published version of the manuscript.

Funding

This research received no external funding.

Data Availability Statement

Not applicable.

Acknowledgments

The authors want to thank the Superintendence of Oppido Mamertina for allowing to proceed with the work, Virtutim srls for providing the logistics, and the company Oben for giving the Lidar data. The authors also want to thank the Department of Engineering of Università degli Studi della Campania Luigi Vanvitelli for accepting Giner as Visiting Professor/Scientist—CALL 2020 D.R. n 0094, project: The Origins of Architectural Ichnographiae and Orthographiae graphic virtualizations.

Conflicts of Interest

The authors declare no conflict of interest.

References

  1. Cerquetti, M. The material and the immaterial. Towards a sustainable approach to management in the global context. Il Cap. Cult. Stud. Value Cult. Herit. 2015, 2, 247–269. [Google Scholar]
  2. ICOM Statutes, Adopted by the 22nd General Assembly in Vienna, Austria on 24 August 2007. Available online: https://icom.museum/en/resources/standards-guidelines/museum-definition/ (accessed on 20 August 2022).
  3. Liberti, R. Momenti e Figure Nella Storia Della Vecchia e Nuova Oppido—VII—Quaderni Mamertini—53-Litografia Diaco snc Quaderni Mamertini Reggio; Riveduto e Corretto: Parma, Italy, 2016. [Google Scholar]
  4. Docci, M. Metodi e Tecniche Integrate di Rilevamento per la Realizzazione di Modelli Virtuali Dell’architettura Della Città; Cangemi Editore: Milano, Italy, 2009; ISBN 9788849214154. [Google Scholar]
  5. Gonizzi Barsanti, S.; Remondino, F.; Fenández-Palacios, B.J.; Visintini, D. Critical Factors and Guidelines for 3D Surveying and Modelling in Cultural Heritage. Int. J. Herit. Digit. Era 2014, 3, 141–158. [Google Scholar] [CrossRef] [Green Version]
  6. Migliari, R. (Ed.) Disegno come Modello; Edizioni Kappa: Roma, Italy, 2004. [Google Scholar]
  7. Cabaleiro, M.; Branco, J.M.; Sousa, H.S.; Conde, B. First results on the combination of laser scanner and drilling resistance tests for the assessment of the geometrical condition of irregular cross-sections of timber beams. Mater. Struct. 2018, 51, 99. [Google Scholar] [CrossRef]
  8. Kharroubi, A.; Hajji, R.; Billen, R.; Poux, F. Classification and Integration of Massive 3D Points Clouds in a Virtual Reality (VR) Environment. Int. Arch. Photogramm. Remote Sens. Spatial Inf. Sci. 2019, 42, 165–171. [Google Scholar] [CrossRef] [Green Version]
  9. Poux, F.; Billen, R. A Smart Point Cloud Infrastructure for intelligent environments. In Laser Scanning; CRC Press: Boca Raton, FL, USA, 2019; ISBN 9781351018869. [Google Scholar]
  10. Bassier, M.; Vergauwen, M.; Poux, F. Point Cloud vs. Mesh Features for Building Interior Classification. Remote Sens. 2020, 12, 2224. [Google Scholar] [CrossRef]
  11. Reza, M.; Lichti, D.D.; Ruwanpura, J.Y. Automatic Recognition of Common Structural Elements from Point Clouds for Automated Progress Monitoring and Dimensional Quality Control in Reinforced Concrete Construction. Remote Sens. 2019, 11, 1102. [Google Scholar] [CrossRef] [Green Version]
  12. The London Charter for the Computer-Based Visualisation of Cultural Heritage. 2009. Available online: http://www.londoncharter.org/fileadmin/templates/main/docs/london_charter_2_1_en.pdf (accessed on 20 August 2022).
  13. Bendicho, V.M.L.M. International Guidelines for Virtual Archaeology: The Seville Principles. In Good Practice in Archaeological Diagnostics. Natural Science in Archaeology; Corsi, C., Slapšak, B., Vermeulen, F., Eds.; Springer: Cham, Switzerland, 2012. [Google Scholar] [CrossRef]
  14. Brusaporci, S.; Trizio, I. La carta di Londra e il patrimonio architettonico. SCIRES 2013, 3, 55–68. [Google Scholar]
  15. Yang, L.; Cheng, J.C.; Wang, Q. Semi-automated generation of parametric BIM for steel structures based on terrestrial laser scanning data. Autom. Constr. 2020, 112, 103037. [Google Scholar] [CrossRef]
  16. Rossi, A. (ri)COSTRUIRE (in)DIGITALE in BIM-OGGI-Italia n 3 di Disegno Book Series; libreriauniversitaria.it: Padova, Italy, 2019. [Google Scholar]
  17. Quattrini, R.; Clini, P.; Nespeca, R.; Ruggeri, L. Measurement and Historical Information Building: Challenges and opportunities in the representation of semantically structured 3D content. Disegnarecon 2016, 9, 14.1–14.11. [Google Scholar]
  18. Costamagna, L.; Visonà, P. Oppido Mamertina: Calabria, Italia: Ricerche Archeologiche Nel Territorio e in Contrada Mell; Gangemi Editore: Rome, Italy, 1999. [Google Scholar]
  19. Liberti, R. Momenti e Figure Nella Storia Della Vecchia e Nuova Oppido-VI; Litografia Diaco snc: Reggio Calabria, Italy, 2003; Volume 45. [Google Scholar]
  20. Roma, G.; Coscarella, A.; Gallo, P.; La Marca, A.; Lanza, G. Oppido Mamertina (RC): La cattedrale di Oppido Vecchio (campagna di scavo 1996). Archeol. Postmedievale Soc. Ambiente Produzioni 1998, 2, 75–106. [Google Scholar]
  21. Remondino, F. From Point Cloud to Surface: The Modeling and Visualization Problem, International Archives of the Photogrammetry. Remote Sens. Spat. Inf. Sci. 2004, 34. Available online: https://www.isprs.org/proceedings/XXXIV/5-W10/ (accessed on 1 September 2022).
  22. Gonizzi Barsanti, S.; Giner, S.L.; Rossi, A. Towards a Multimodal Representation: Claudia Octavia’s Bequeathal. Remote Sens. 2022, 14, 429. [Google Scholar] [CrossRef]
  23. Martinez Espejo Zaragoza, I.; Caroti, G.; Piemonte, A. The use of image and laser scanner survey archives for cultural heritage 3D modelling and change analysis. ACTA IMEKO 2021, 10, 114. [Google Scholar] [CrossRef]
  24. Bevilacqua, M.G.; Caroti, G.; Piemonte, A.; Ulivieri, D. Reconstruction of Lost Architectural Volumes by Integration of Photogrammetry from Archive Imagery with 3D Models of the Status Quo. The International Archives of the Photogrammetry. Remote Sens. Spat. Inf. Sci. 2019, 119–125. [Google Scholar] [CrossRef]
  25. Parenti, R. La lettura stratigrafica delle murature in contesti archeologici e di restauro architettonico. Restauro E Città 1985, 1, 55–68. [Google Scholar]
  26. Dimier, A. L’art Cistercien Hors de France; Zodiaque: Paris, France, 1971. [Google Scholar]
  27. Kubach, H.E. Romanesque Architecture (History of World Architecture); Faber&Faber Ltd.: London, UK, 1979. [Google Scholar]
  28. Argan, G.C. L’architettura Protocristiana, Preromanica E Romanica; Edizioni Dedalo: Bari, Italy, 1978. [Google Scholar]
  29. Carbonara, G.; Desideri, I. Montecassino e L’architettura Campano-Abruzzese Nell’xi Secolo; Università Degli Studi di Roma, Istituto di Fondamenti Dell’architettura: Roma, Italy, 1981. [Google Scholar]
  30. Docci, M.; Migliari, R. Scienza Della Rappresentazione. Fondamenti e Applicazioni della Geometria Descrittiva; Carocci: Roma, Italy, 1992; ISBN 884300414X. [Google Scholar]
  31. Rossi, A. Il quadrato claustrale di sant cugat del Valles. In Melodie di pietre Torre del Greco (NA), Edizioni Scientifiche e Artistiche; Edizioni Scientifiche e Artistiche: Torre del Greco, Italy, 2014. [Google Scholar]
  32. Huerta, S. Galileo was wrong! The geometrical design of masonry arches. Nexus Netw. J. 2006, 8, 25–52. [Google Scholar] [CrossRef] [Green Version]
  33. Huerta, S. Oval Domes: History, Geometry and Mechanics. Nexus Netw. J. 2007, 9, 213. [Google Scholar] [CrossRef] [Green Version]
  34. Rossi, A. From drawing to technical drawing. Nexus Netw. J. 2012, 14, 135–149. [Google Scholar] [CrossRef] [Green Version]
  35. Rondelet, J.B. Traité Théorique et Pratique de L’art de Bâtir, III.; Firmin–Didot: Paris, France, 1805. [Google Scholar]
  36. Boito, C. Architettura del Medioevo in Italia; Oligo: Milano, Italy, 1881. [Google Scholar]
  37. Cattaneo, R. L’architettura in Italia dal sec. VI al 1000 Circa; Kessinger Publishing, LLC: Whitefish, MT, USA, 1889. [Google Scholar]
  38. Zevi, B. Lezioni di Storia Dell’architettura Italiana, I; Stab. Tipo Litografico V. Ferri: Roma, Italy, 1947. [Google Scholar]
  39. Fletcher, B. A History of Architecture; Taylor & Francis Ltd.: Abingdon-on-Thames, UK, 1996. [Google Scholar]
  40. Cataldi, G. Sistemi Statici in Architettura; Teorema Edizioni: Firenze, Italy, 1974. [Google Scholar]
  41. Pizzetti, G.; Zorgno Trisciuoglio, A.M. Principi Statici e Forme Strutturali; Utet: Torino, Italy, 1980. [Google Scholar]
  42. Benvenuto, E. La Scienza delle Costruzioni e il suo Sviluppo Storico; Sansoni: Firenze, Italy, 1981. [Google Scholar]
  43. Apollonio, F.I.; Giovannini, E.C. A paradata documentation methodology for the Uncertainty Visualization in digital reconstruction of CH artefacts. SCIRES-IT 2015, 5, 1–24. [Google Scholar]
  44. Arayici, Y.; Coates, P.; Koskela, L.; Kagioglou, M.; Usher, C.; O’Reilly, K. BIM adoption and implementation for architectural practices. Struct. Surv. 2011, 29, 7–25. [Google Scholar] [CrossRef] [Green Version]
  45. De Luca, L. Towards the Semantic-aware 3DDigitisation of Architectural Heritage: The “Notre-Dame de Paris” Digital Twin Project, SUMAC’20. In Proceedings of the 2nd Workshop on Structuring and Understanding of Multimedia Heritage Contents, Seattle, WA, USA, 12–16 October 2020; pp. 3–4. [Google Scholar] [CrossRef]
  46. Bolognesi, C.; Garagnani, S. From a Point Cloud Survey to a Mass 3D Modelling: Renaissance HBIM in Poggio a Caiano. Int. Arch. Photogramm. Remote Sens. Spatial Inf. Sci. 2018, 42, 117–123. [Google Scholar] [CrossRef] [Green Version]
  47. Frèzier, A.F. La Théorie et la Pratique de la Coupe des Pierres et Bois. T1 (Eds 1737–1739); Hachette Livre BNF: Strasbourg, Germany, 2012. [Google Scholar]
  48. Gruber, T.R. Towards principles for the design of ontologies used for knowledge sharing. In Formal Ontology in Conceptual Analysis and Knowledge Representation; Guarino, N., Poli, R., Eds.; Kluwer Academic Publishers: Deventer, The Netherlands, 1993. [Google Scholar]
  49. Neuhold, E. Interoperability and semantics: An introduction into the past and a look at the future. In Proceedings of the 10th European Conference on Product and Process Modelling (ECPPM 2014), Vienna, Austria, 17–19 September 2014; CRC Press/Balkema: Boca Raton, FL, USA, 2015; pp. 7–9. [Google Scholar]
  50. Fai, S.; Duckworth, T.; Graham, K.; Wood, N. Building Information Modelling and the conservation of modern heritage. In Proceedings of the 24th World Congress of Architecture, Tokyo, Union Internationale des Architectes (UIA), Tokyo, Japan, 25 September–1 October 2011. [Google Scholar]
  51. Sacco, P.L. Le Industrie Culturali E Creative e l’Italia: Una Potenzialità Inespressa su cui Scommettere. Fabbrica Della Cultura. 2016. Available online: http://www.fabbricacultura.com/wp-content/uploads/2013/11/industrie-culturali-creative_sole24.pdf (accessed on 24 August 2022).
  52. Verganti, R. Design Driven Innovation; Harvard Business Press: Cambridge, UK, 2009. [Google Scholar]
  53. Balzola, A.; Rosa, P. La Rete Fuori di sé; Feltrinelli: Milano, Italy, 2011. [Google Scholar]
  54. Boudrillard, J. Violence of the Virtual and Integral Reality. Int. J. Baudrillard Stud. 2005, 2, 1–16. [Google Scholar]
  55. Woodward, A.; Heesom, D. Implementing HBIM on conservation heritage projects: Lessons from renovation case studies. Int. J. Build. Pathol. Adapt. 2021, 39, 96–114. [Google Scholar] [CrossRef]
  56. Addison, A.; Santana Quintero, M.; Severo, M. Cultural heritage repositories: Digital archives for conservation and management. In Browsing Architecture: Metadata and Beyond; Zambelli, M., Janowiak, A.H., Neuckermans, H., Eds.; Fraunhofer IRB: Stuttgart, Germany, 2008; pp. 306–317. [Google Scholar]
  57. Kensek, K.K. Building Information Modeling, 1st ed.; Routledge: London, UK, 2014; ISBN 9780415717748. [Google Scholar]
  58. Kymmel, W. Building Information Modeling: Planning and Managing Construction Projects with 4D CAD and Simulations; McGraw-Hill Education: New York, NY, USA, 2008. [Google Scholar]
Figure 1. The site of ancient Oppido Mamertina from Google Earth (a); the site of the city with the indication of the Cultural Heritages from https://issuu.com/galbatir/docs/06oppidomamertina/11 (accessed on 25 September 2022) (b).
Remotesensing 14 05152 g001
Figure 2. Problems related to the lighting of the site: very brightly lit areas and other extremely shaded areas are clearly visible on the same masonry (a); example of shooting against the sun (b); the image post-processed in Lightroom in order to balance dark and light areas. On the right the parameters changed to process the image (c). (Photos by the authors).
Remotesensing 14 05152 g002
Figure 3. Presence of trees in the site that covered the wall structures (a) and trick used to have a better view of the structures in the images (b) (photo by the authors).
Remotesensing 14 05152 g003
Figure 4. The 3D point cloud obtained through the photogrammetric process: (a) Zenithal view of the site; (b) Prospective view of the site from north-west; (c) the walls with the indication of the shape of the arches; (d) orthophoto of the pillar—view from South (authors’ elaboration).
Remotesensing 14 05152 g004aRemotesensing 14 05152 g004b
Figure 5. The orthophoto of the southern wall with the prints of the arches highlighted with red circles (authors’ elaboration).
Remotesensing 14 05152 g005
Figure 6. The dense 3D point cloud obtained from the photogrammetric process (a); the 3D dense point cloud after the cleaning (b). Software used Agisoft Metashape (authors’ elaboration).
Remotesensing 14 05152 g006
Figure 9. The organization of the geometrical database of the model, subdivided in LoG.
Remotesensing 14 05152 g009
Figure 10. The comparison between the unstructured 3D point cloud and the 3D informative modelling.
Remotesensing 14 05152 g010
Publisher’s Note: MDPI stays neutral with regard to jurisdictional claims in published maps and institutional affiliations.

