
Vegetation Landscape Changes and Driving Factors of Typical Karst Region in the Anthropocene

1
State Key Laboratory of Urban and Regional Ecology, Research Centre for Eco-Environmental Sciences, Chinese Academy of Sciences, Beijing 100085, China
2
College of Resources and Environment, University of Chinese Academy of Sciences, Beijing 100149, China
*
Author to whom correspondence should be addressed.
Remote Sens. 2022, 14(21), 5391; https://0-doi-org.brum.beds.ac.uk/10.3390/rs14215391
Submission received: 31 August 2022
/
Revised: 12 October 2022
/
Accepted: 24 October 2022
/
Published: 27 October 2022
(This article belongs to the Special Issue Forest Disturbance Monitoring Using Satellite Remote Sensing)
Abstract
:Vegetation degeneration has become a serious ecological problem for karst regions in the Anthropocene. According to the deficiency of long serial and high-resolution analysis of karst vegetation, this paper reconstructed the variation of vegetation landscape changes from 1987 to 2020 in a typical karst region of China. Using Landsat time series data, the dynamic changes and driving factors of natural karst vegetation were identified at the landscape scale. On the premise of considering the time-lag effect, the main climatic factors that influence vegetation growth were presented at the interannual timescale. Then, the approach of residual analysis was adopted to distinguish the dominant factors affecting vegetation growth. Results of trend analysis revealed that 21.5% of the forestland showed an overall significant decline in vegetation growth, while only 1.5% showed an increase in vegetation growth during the study period. Precipitation and radiation were the dominant meteorological factors influencing vegetation at the interannual timescale, as opposed to temperature. More than 70% of the natural vegetation growth was dominated by climatic factors. The area percentage of negative human impact has increased gradually since 2009 and reached 18.5% in 2020, indicating the currently serious situation of vegetation protection; fortunately, in recent years, human disturbances on vegetation have been mitigated in karst areas with the promotion of ecological conservation and restoration projects.
1. Introduction
The Agenda for Sustainable Development 2030 of United Nations is made up of the 17 Sustainable Development Goals (SDGs) that humanity will have to meet by 2030 [1]. In particular, for forest ecosystems, SDG15 calls for the conservation, restoration and sustainable use of terrestrial and inland freshwater ecosystems and their services [2]. As a pivotal part of terrestrial ecosystems, vegetation is one of the main resources involved in ecosystem functioning and providing ecosystem services [3]. Vegetation dynamic is an essential indicator of ecological environment change, reflecting both regional climate change and human activities [4,5,6,7,8]. With the intensification of human activities, global habitat conditions have changed dramatically in the Anthropocene, and vegetation is becoming more sensitive to changes in the environment, especially in karst regions [9,10,11]. Karst vegetation landscapes are often of high conservation value and vulnerable to external disturbances, which play crucial roles in the sustainment of ecological functions and prevention of rocky desertification [12,13,14]. To address the challenges caused by climate change and human activities, research on vegetation landscape changes in the Anthropocene has recently become a popular topic of research.
Nowadays, remote sensing has emerged as an effective way to retrieve vegetation characteristics and monitor the changes of vegetation landscape in long time series [15,16,17]. Numerous studies have shown that the temporal and spatial variations in vegetation are closely associated with climatic factors [17,18,19]. The annual fluctuation in precipitation has been proven to play a crucial role in vegetation change [10,20,21]. Because the phenology of vegetation is influenced by the pressures of global warming, the relationship between vegetation and temperature cannot be neglected, especially in regions where water is not a limiting factor [22,23,24]. Moreover, surface net radiation, the energy source of plant photosynthesis, is another climatic factor that influences vegetation changes [25]. Furthermore, to discuss the response of vegetation to climatic factors in a long time series, the time-lag effects should be taken into consideration because the current status of vegetation greatly depends on the accumulated climate conditions for a past period of time [13,26,27]. Recently, more studies have acknowledged time-lag effects when matching climatic factors and vegetation, which may lead to misjudgements of the climatic effect on vegetation [28,29,30].
As a typical karst region, the Lijiang River Basin has a critical need for vegetation protection to defend against rocky desertification [31]. Having obvious characteristics of fragile and vulnerable environments, the Lijiang River Basin has suffered a string of ecological problems, and the health status of forest ecosystems has received increasing attention in recent decades [32,33]. Research results have indicated that the Anthropocene challenges ecological security and causes irreversible effects on ecosystems [34,35]. In 1999, the government initiated the Returning Farmland to Forest Program (RFFP) with the specific goals of increasing forest cover and controlling the expansion of areas of cultivated land, which focused on increasing forest cover through reforestation of hillsides, cultivated land conversion, and afforestation (Liu G et al., 2017). In 2018, the Lijiang River Basin was approved to build an innovation demonstration zone for a national sustainable development agenda with the theme of sustainable use of landscape resources, providing a substantial opportunity to explore new modes of sustainable development when confronting the stresses from both climate conditions and anthropogenic activities. To reverse ecological degradation on a large scale, with the implementation of ecological restoration projects in the Lijiang River Basin, local vegetation has been restored, and the overall ecological quality has improved [12,36,37]. However, the individual and interacting contributions of climate conditions and human activities to vegetation trends need to be quantified in a statistical way [38], and the vegetation dynamics under human interference in karst regions need to be evaluated continually and precisely.
In this study, the impact of climatic factors and human factors on vegetation landscape changes were taken into consideration. The driving meteorological factors affecting vegetation growth were recognized by partial correlation analysis in consideration of time-lag effect. Then, the residuals analysis method was employed to explain the spatial and temporal changes in vegetation in the Lijiang River Basin from 1987 to 2020, and the relative contributions of climate change and human activities to vegetation dynamics were investigated. Based on these findings, this study was expected to provide support for the management of the ecological environment and optimize the sustainable development plan in karst regions within the context of the Anthropocene.
2. Materials and Methods
2.1. Study Area
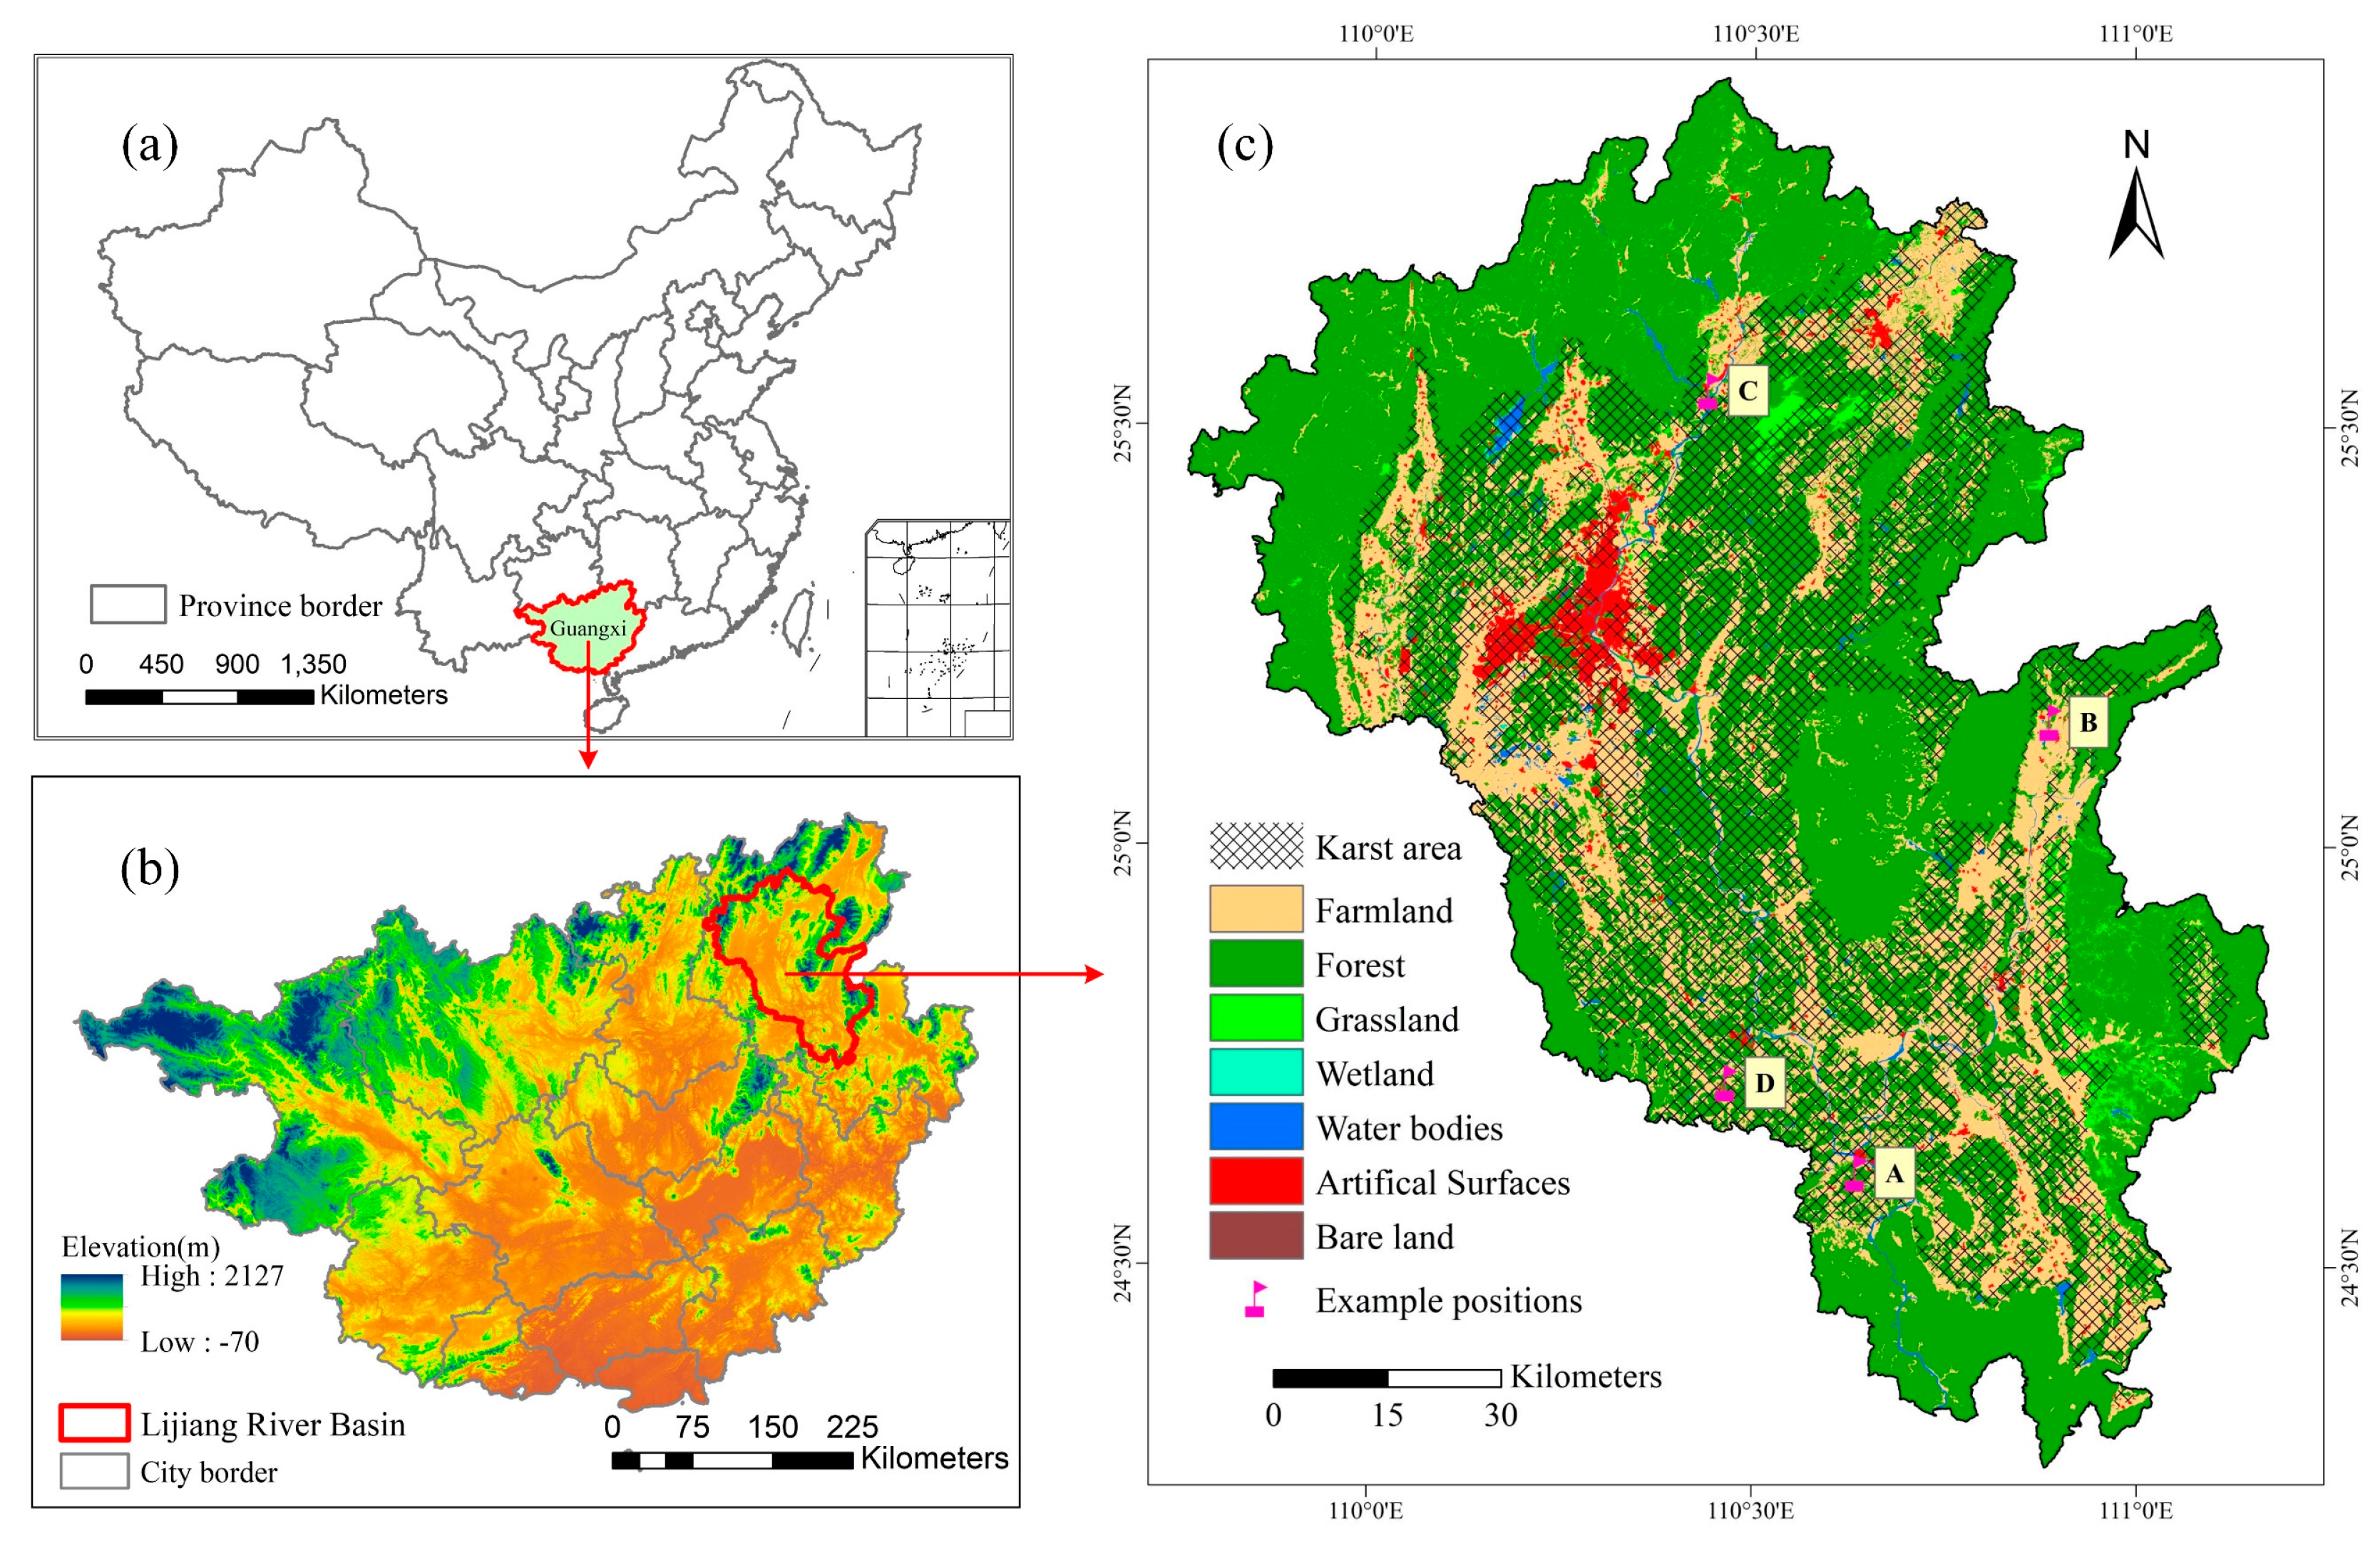
The Lijiang River Basin is a typical karst region located in Guilin city in Southwest China (Figure 1), with a subtropical monsoon climate and a mean annual precipitation of 1900 mm [39]. Due to the uneven distribution of annual rainfall, floods and draught occur frequently in this region. The average annual temperature is 19.1°, with a minimum average temperature of 9° in the winter and a maximum average temperature of 28° in the summer. The Lijiang River Basin covers an area of 12,908 km2, and the length of the Lijiang River is 164 km [40]. The topography of the study area has a declining slope from north to south, with altitudes ranging from 60 to 2127 m.
The Lijiang River Basin is famous for its widely distributed typical karst form landscapes, and approximately 32% of the forestland comprises karst areas, which are the main drivers of local tourism. Limited by the geographic conditions and resource endowment, there are a certain number of poverty-stricken people in the region, and the local economy depends heavily on tourism and agriculture [31].
2.2. Data
The datasets used in this study comprise NDVI data, gridded meteorological data and land use data (Table 1). The NDVI, calculated using the near-infrared and red bands of remote sensing data, has been widely used for monitoring vegetation changes. Given the striping noise of Landsat-7, NDVI time series from 1987 to 2020 were generated from images acquired by the Thematic Mapper (TM) and Operational Landsat Imager (OLI) sensors embedded in the Landsat-5 and Landsat-8 satellites, which had a temporal resolution of 16 days and a spatial resolution of 30 meters. All Landsat images were processed in Google Earth Engine (GEE), including atmospheric corrections, geometric corrections, and cross-calibrations among different Landsat sensors [41,42,43,44]. The quality assessment (QA) band was used to remove bad-quality pixels (clouds or cloud shadows), and the annual maximum NDVI values were calculated to represent the peak growth state of vegetation in a given year. The monthly gridded reanalysis dataset for temperature, precipitation and surface net radiation from 1987 to 2020 was obtained from ERA5 hourly data released on the Climate Data Store (CDS) in January 2019 [45]. The land use maps based on GlobeLand30 (http://www.globallandcover.com (accessed on 1 June 2022)) are presented for background information in Figure 1c, and the elevation map in Figure 1b was produced using the ALOS Landform dataset (https://www.eorc.jaxa.jp/ALOS/en/aw3d30/index.htm (accessed on 1 June 2022)). It should be noted that three land use maps of 2000, 2010 and 2020 were used to extract forestland, the pixels signed as forests were intersected to obtain the forest mask file for the Mann–Kendall trend test, time-lag effect analysis and correlation analysis, and the union of three forest maps was used for residual analysis.
2.3. Method
The framework of the research is shown in Figure 2. Firstly, the Mann–Kendall test method was adopted to detect the trends of vegetation landscape from 1987 to 2000. Secondly, the time-lag effect was evaluated by taking into account three key meteorological factors. Finally, at the interannual timescale, residual analysis method was used to explore the main driving factor of spatial-temporal changes of karst vegetation landscapes.
2.3.1. Trend Analysis by the Mann–Kendall Test
The Mann–Kendall test is a rank nonparametric test developed by Mann and Kendall [46,47]. In this study, the Mann–Kendall trend test was used to statistically assess the decreasing or increasing trend of the vegetation in the Lijiang River Basin according to the pixel-based annual NDVI value over a 34-year period (from 1987 to 2020). To express the vegetation growth status in one year, the 95th-percentile position of the valid year-round values was calculated as the annual NDVI value. Marginal and significant vegetation trends were detected at the 10% and 5% significance levels, respectively. Based on the Z statistic of the Mann–Kendall test, the results were categorized as significant changes (Z ≥ 1.96 or Z ≤ −1.96), marginal changes (1.64 ≤ Z ≤ 1.96 or −1.96 ≤ Z ≤ −1.64) or insignificant changes (−1.64 ≤ Z ≤ 1.96) [48,49].
2.3.2. Time-Lag Effect
The vegetation growth status is dictated by meteorological conditions [50,51], while the time-lag effect generally exists between the accumulation of meteorological factors (MFs) and the identification of their consequences in a certain period. Thus, affected by the underlying geographic patterns, vegetation types and local climate conditions, the time-lag effect shows notable regional differences [52]. In this study, to quantify this time-lag effect in the Lijiang River Basin, we took three main MFs into consideration. For the MFs in a given year, the monthly meteorological factors (MMFs) of the last few months were replaced by those of the same months in the previous year to represent the time-lag effect, and then the MMFs were accumulated to obtain the annual value, which was in agreement with the time scale of the NDVI. The time-lag meteorological factor (MF_lag) of the nth year was calculated as follows:
where m is the number of time-lag months and MMF(n,i) refers to the monthly averaged value of a certain meteorological factor for the ith month in the nth year.
2.3.3. Partial Correlation and Correlation Analysis
Based on the correlation analysis method, the temporal and spatial fluctuations in the annual precipitation, temperature, surface net radiation and annual NDVI were analysed. Partial correlation was employed to measure the degree of association between each annual climatic factor and annual NDVI, with the effect of other climatic factors removed. Moreover, the human disturbance effect needed to be excluded to the greatest extent when assessing vegetation changes caused by climatic factors; here, only those pixels classified as forestland throughout the study period were selected for correlation analysis. The second-order partial correlation coefficient of the NDVI and any MF (taking MF1 as an example) after removing the effect of MF2 and MF3 is expressed as [53,54]:
where is the first-order partial correlation coefficient of NDVI and MF1, with the effect of MF2 removed:
where refers to the Pearson correlation coefficient. The significance of the correlation coefficients was assessed at the 95% level.
2.3.4. Residuals Analysis
According to the results of partial correlation analysis, the dominant climatic factors of vegetation growth in the Lijiang River Basin were screened. Without regard to human disturbance, the relationship between the annual NDVI and dominant climatic factors can be expressed using multiple linear regression:
where i represents the ith grid, j represents the jth year, n is the number of dominant climatic factors, and MFk refers to the kth time-lagged climatic factor. Multiple linear regression coefficients were required by inputting the annual NDVI and MF; thus, the climate affected NDVI could be simulated. Human-induced vegetation change was identified by the residual analysis method shown in Equation (5):
The NDVI residuals refer to the difference between the simulated and observed NDVI results, including the effect of human activities and the model error. In theory, the residuals should obey a normal distribution; therefore, the change trend of NDVI residuals could reflect human disturbance. When the residuals remained within the normal distribution range, the NDVI changes were mostly explained by climatic factors. In contrast, when the residuals deviated from the normal distribution range, positive or negative human effects were regarded as the key driving force for vegetation changes. In this study, according to the NDVI profiles shown in Figure 3, we assumed that vegetation growth depended largely on climate conditions in the rising NDVI stage, and one standard deviation () above and below the average () of NDVI residuals from 1987 to 2000 was used as the threshold for residual analysis (Peng, 2020), and the human effects were judged every two years. When the NDVI residuals of two adjacent years were both greater than , the vegetation was mainly dominated by negative human effects; in contrast, when the NDVI residuals of two adjacent years were both less than , the vegetation was mainly dominated by negative human effects; otherwise, the vegetation was defined to be dominated by climatic factors.
3. Results
3.1. Temporal Variation in Vegetation Trends
As shown in Figure 3, the annual mean NDVI value of forestland over the study period was calculated. As forestland accounts for 68% of the basin area, the NDVI profiles of forestland and the whole basin showed similar variation trends. Overall, the annual NDVI showed an increasing trend from 1987 to 2000 and a slow decline after reaching the peak in 2001.
To reveal the temporal trends of NDVI over different periods in the Lijiang River Basin, the Mann–Kendall test was performed in the forest area. As Table 2 and Figure 4 showed, changing vegetation trends in most of the forestland (83.7%) were not observed from 1987 to 2000, which demonstrated that the vegetation exhibited a steady growing state at the annual scale in this period. In the period from 2001 to 2020, more than half of the forest grids showed decreasing trends, of which 49.2% showed a significant decreasing trend and 12.4% showed a marginally significant decreasing trend, mainly concentrated at high altitudes upstream of the basin and in the vicinity of Guilin city. Throughout the whole study from 1987 to 2020, a significant decreasing trend of NDVI accounted for 21.5% of the forestland, located primarily in the northern area with high vegetation coverage; nevertheless, only 1.5% showed a significant increasing trend.
3.2. Impact of Climatic Factors on Vegetation Trends
According to the results of the partial correlation analyses shown in Table 3, precipitation and net radiation were positively correlated with NDVI, while the temperature showed a weak relationship with NDVI at the annual scale, which was inconsistent with recent studies [52,55]. Consequently, precipitation and net radiation could be recognized as the dominant MFs of vegetation in the Lijiang River Basin. Without regard to temperature, the partial correlation analyses between the annual climatic factor and NDVI in various time-lagged situations revealed that the correlation coefficient reached a maximum with a one-month time lag and then dropped, both for precipitation and net radiation. To account for this, one-month time-lagged precipitation and net radiation were adopted for further residual analyses.
The spatial patterns of the partial correlation coefficient between NDVI and dominant MFs also exhibited spatial heterogeneity (Figure 5a,b). The results of multiple linear regression fit with annual NDVI and one-month time-lagged dominant MFs are shown in Figure 5c. The averaged multiple linear correlation coefficient was 0.627, and more than 90% of the forest grids had a coefficient value larger than 0.4. Using the F test to examine the significance level of the regression (Figure 5d), 82.5% of the forest pixels passed the significance test at the 0.05 level, which confirmed a satisfactory linear fit between the NDVI and dominant MFs at the annual scale.
3.3. Relative Roles of Climate Change and Human Activities in Vegetation Change
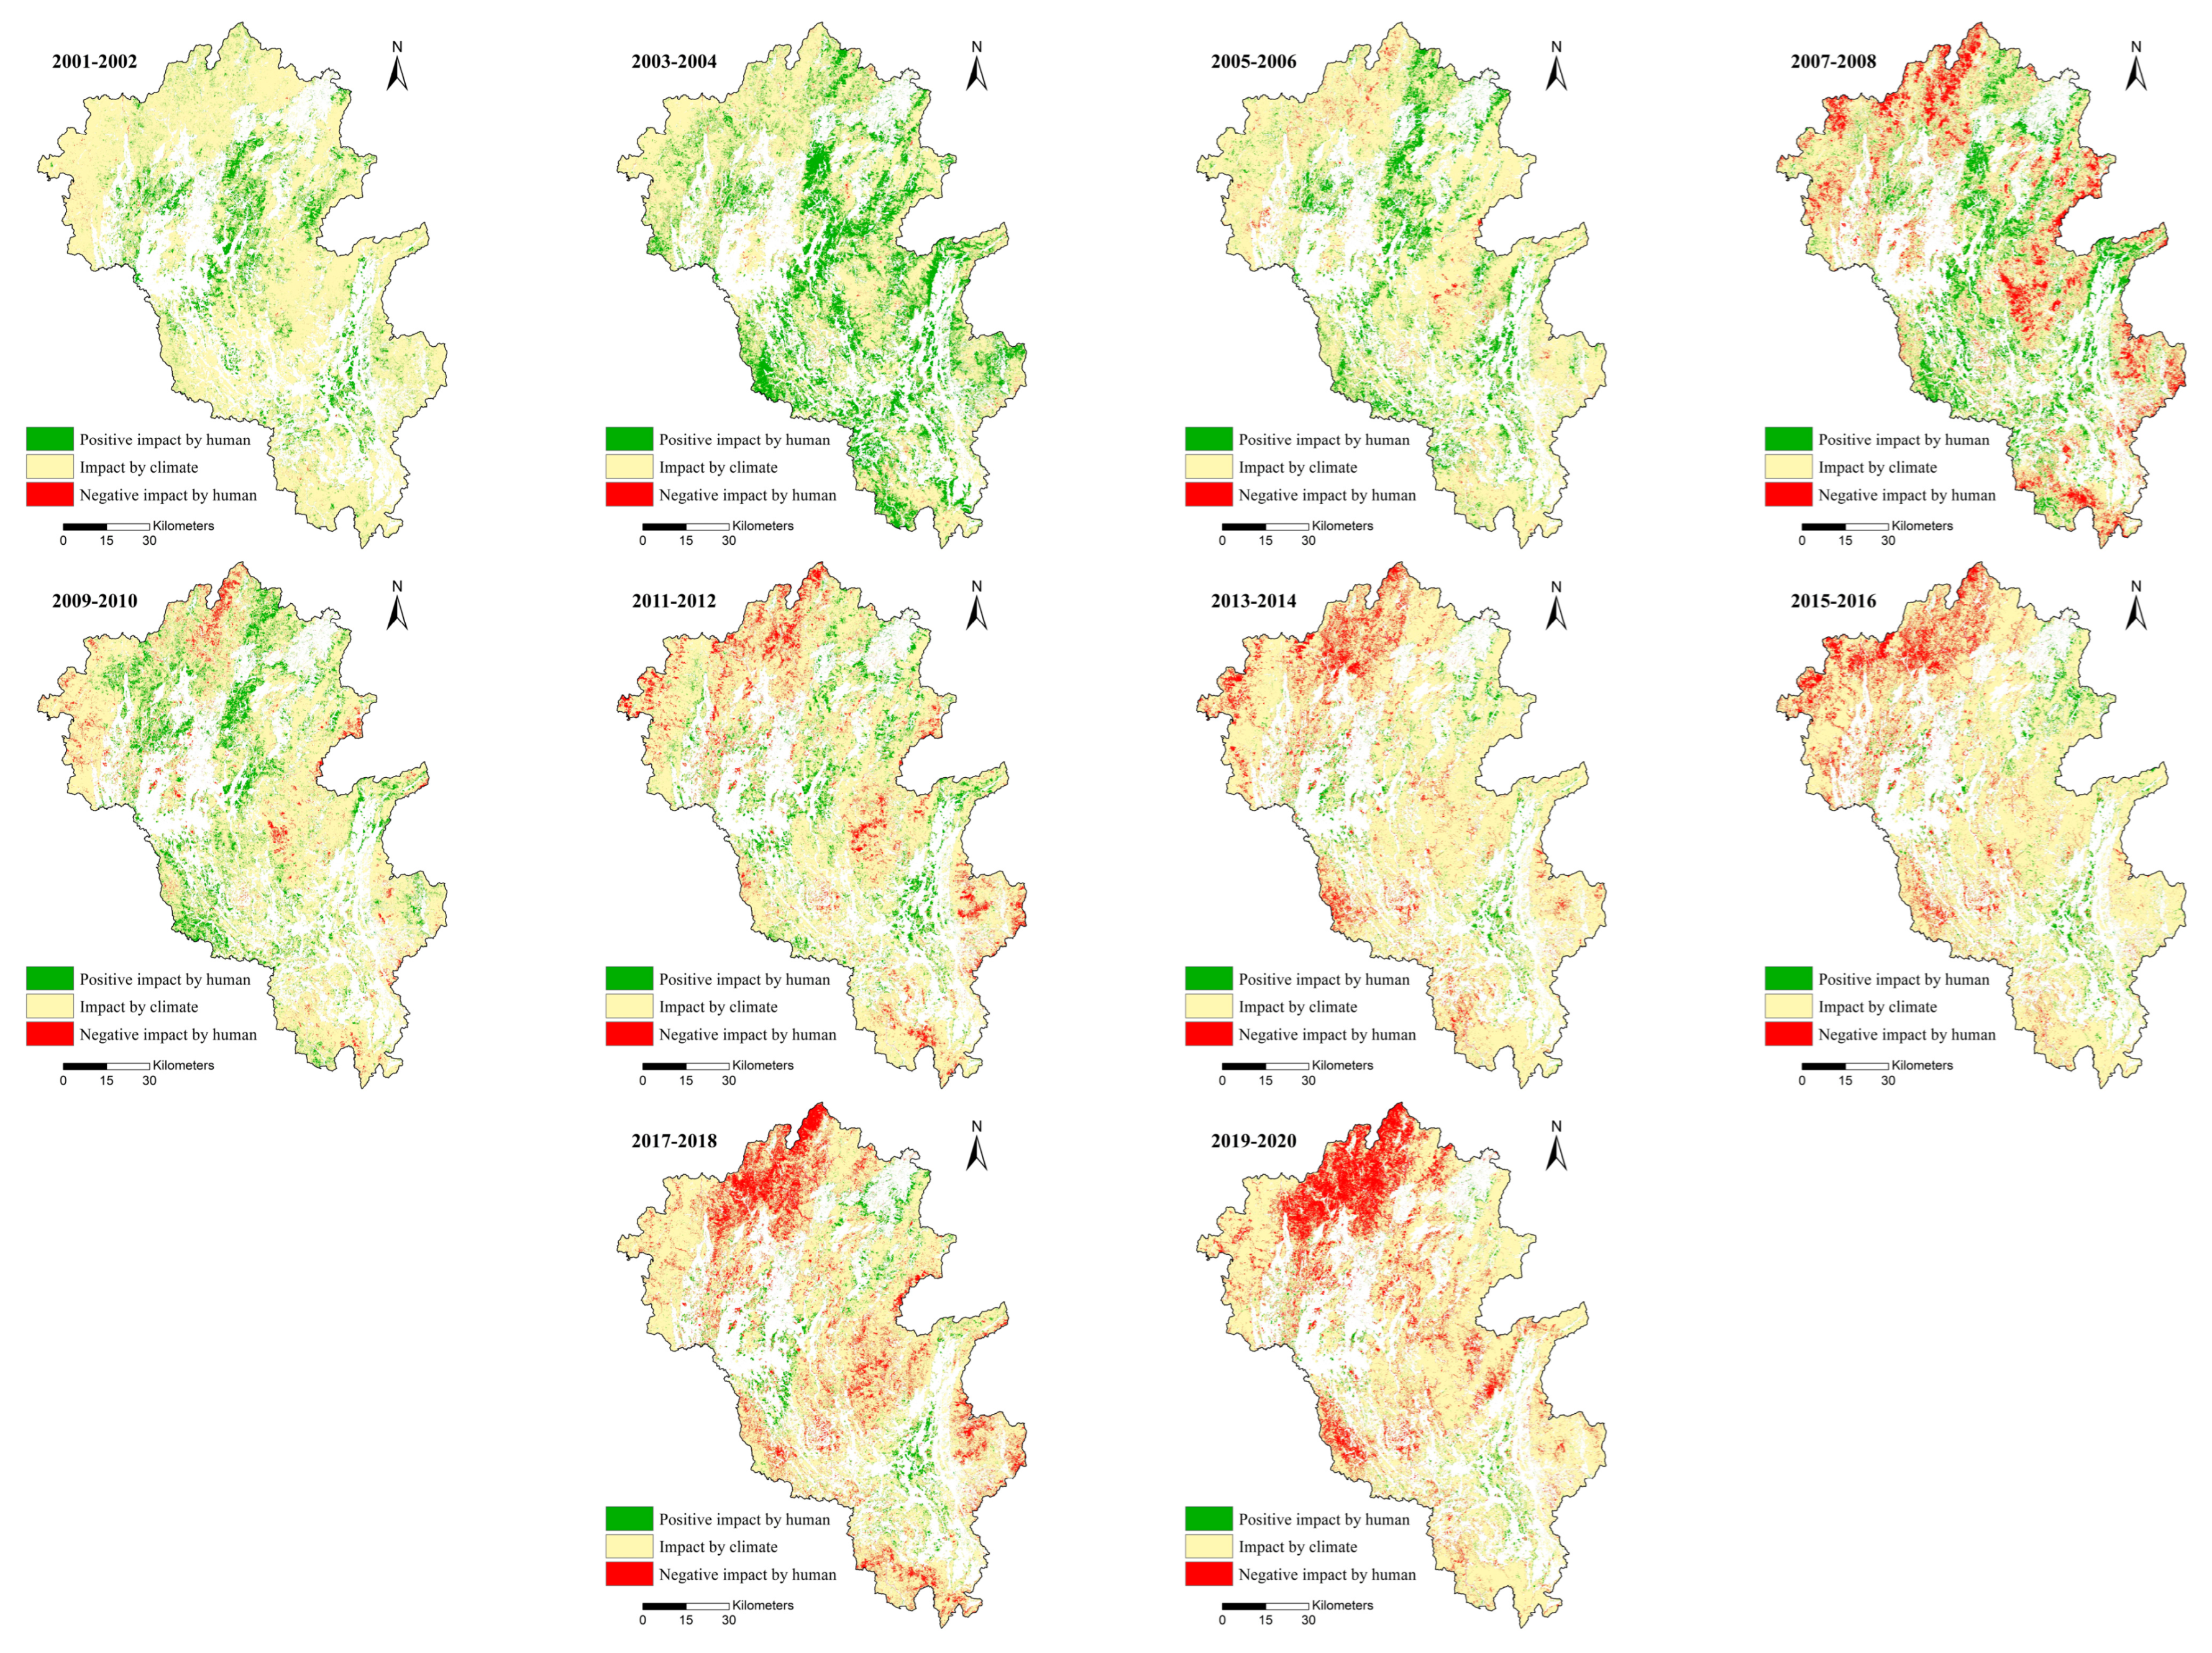
According to the classified results of residual analyses, the effects of climate change and human activities on the vegetation growth dynamics from 2001 to 2020 were distinguished for each grid (Figure 6). Overall, the change in vegetation was dominated by climate change in most areas (more than 70% of the forestland) in the Lijiang River Basin, and the human activities changed dramatically over both time and space. From 2001 to 2006, the proportion of area under a positive human effect was approximately 20% (Table 4), while the area of negative human effect accounted for only a very small fraction and was scattered in the basin. Since 2007, the area of negative human impact has shown an obvious regional aggregative distribution and continued to gradually increase from 2009 to 2020 until reaching a maximum percentage of 18.5% in the period of 2019–2020. Conversely, the area of positive human impact had a general decreasing trend since 2009, falling to just 5.4% in the period of 2019−2020.
Spatially, the distribution of human effects on vegetation exhibited obvious spatial clustering characteristics, with most grids identified as exhibiting positive human effects located in core protected areas near the Lijiang River or karst regions, indicating that local ecological protection and restoration projects played certain roles in natural vegetation conservation. The vegetation with negative human effects was mostly distributed along the basin margins, especially in the upper reaches of the Lijiang River at high altitudes, reflecting that the forest and natural vegetation in the areas with low levels of protection were under the constant pressure of human activities over the last decade. Although a series of ecological projects with afforestation and reforestation have been or will be implemented, the restoration of damaged vegetation may take a long time, and the effects should be further monitored.
3.4. Human Activities in Karst Areas and Non-Karst Areas
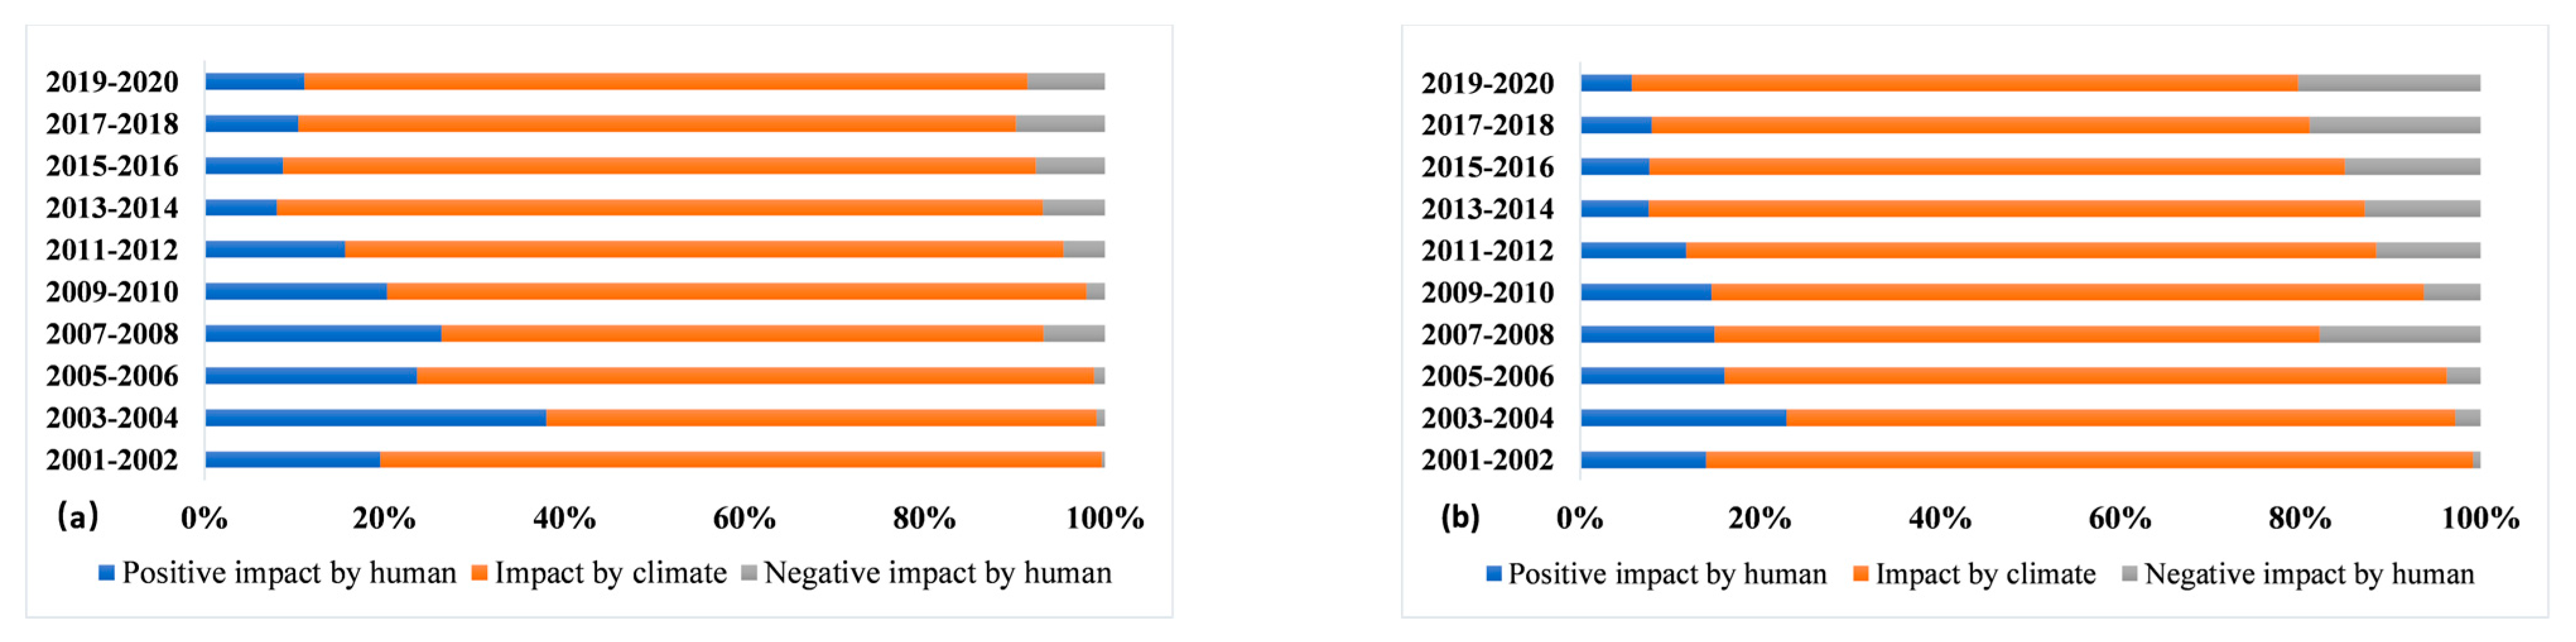
In the Lijiang River Basin, there were significant differences in the vegetation growth environment between karst areas and non-karst areas. Due to the steep terrain and poor soil conditions, the formation of the forest ecosystem took a long time in karst areas, and most destruction would be extremely difficult to recover. To assess changes in the human activities in karst areas, the area percentages of different dominant factors in karst areas and non-karst areas were calculated. As Figure 7 shows, the vegetation in most areas was dominated by climatic factors. The area percentages of positive human impacts in karst areas were all greater than those in non-karst areas during various periods. Compared with the average percentage of negative human impacts of 11% in non-karst areas, the value in karst areas was only 4.5%. Although negative human impacts continued to expand since 2009 in the whole basin, the proportion of negative human impact in karst areas increased much more slowly and even started to decline in the period of 2019–2020. In addition, the proportion of positive human impacts in karst areas maintained a steady increase from 2013 to 2020, which reflected the effect of various policy measures on protecting and restoring karst landscapes in recent years.
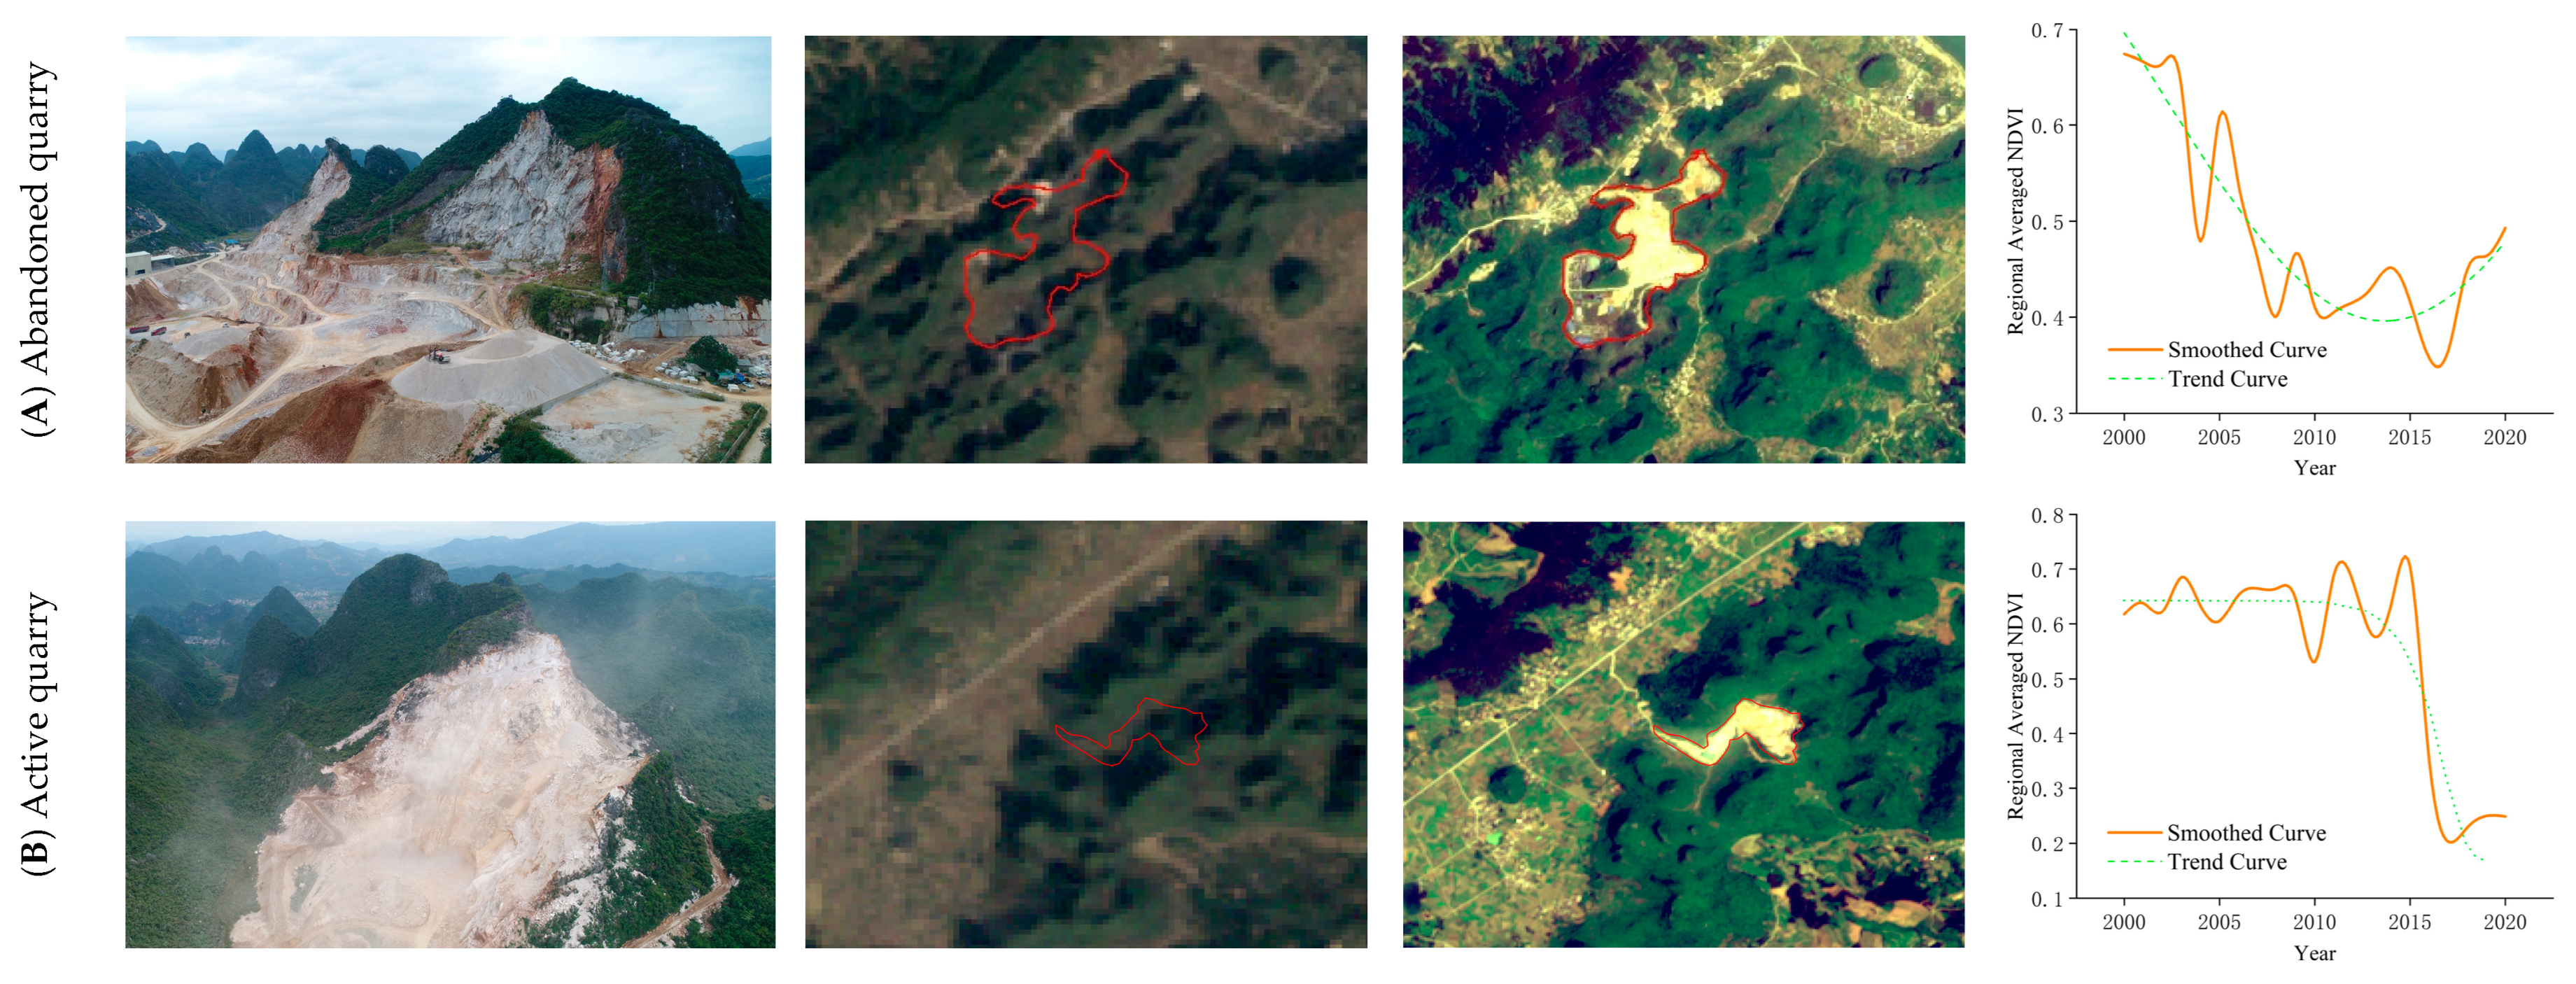
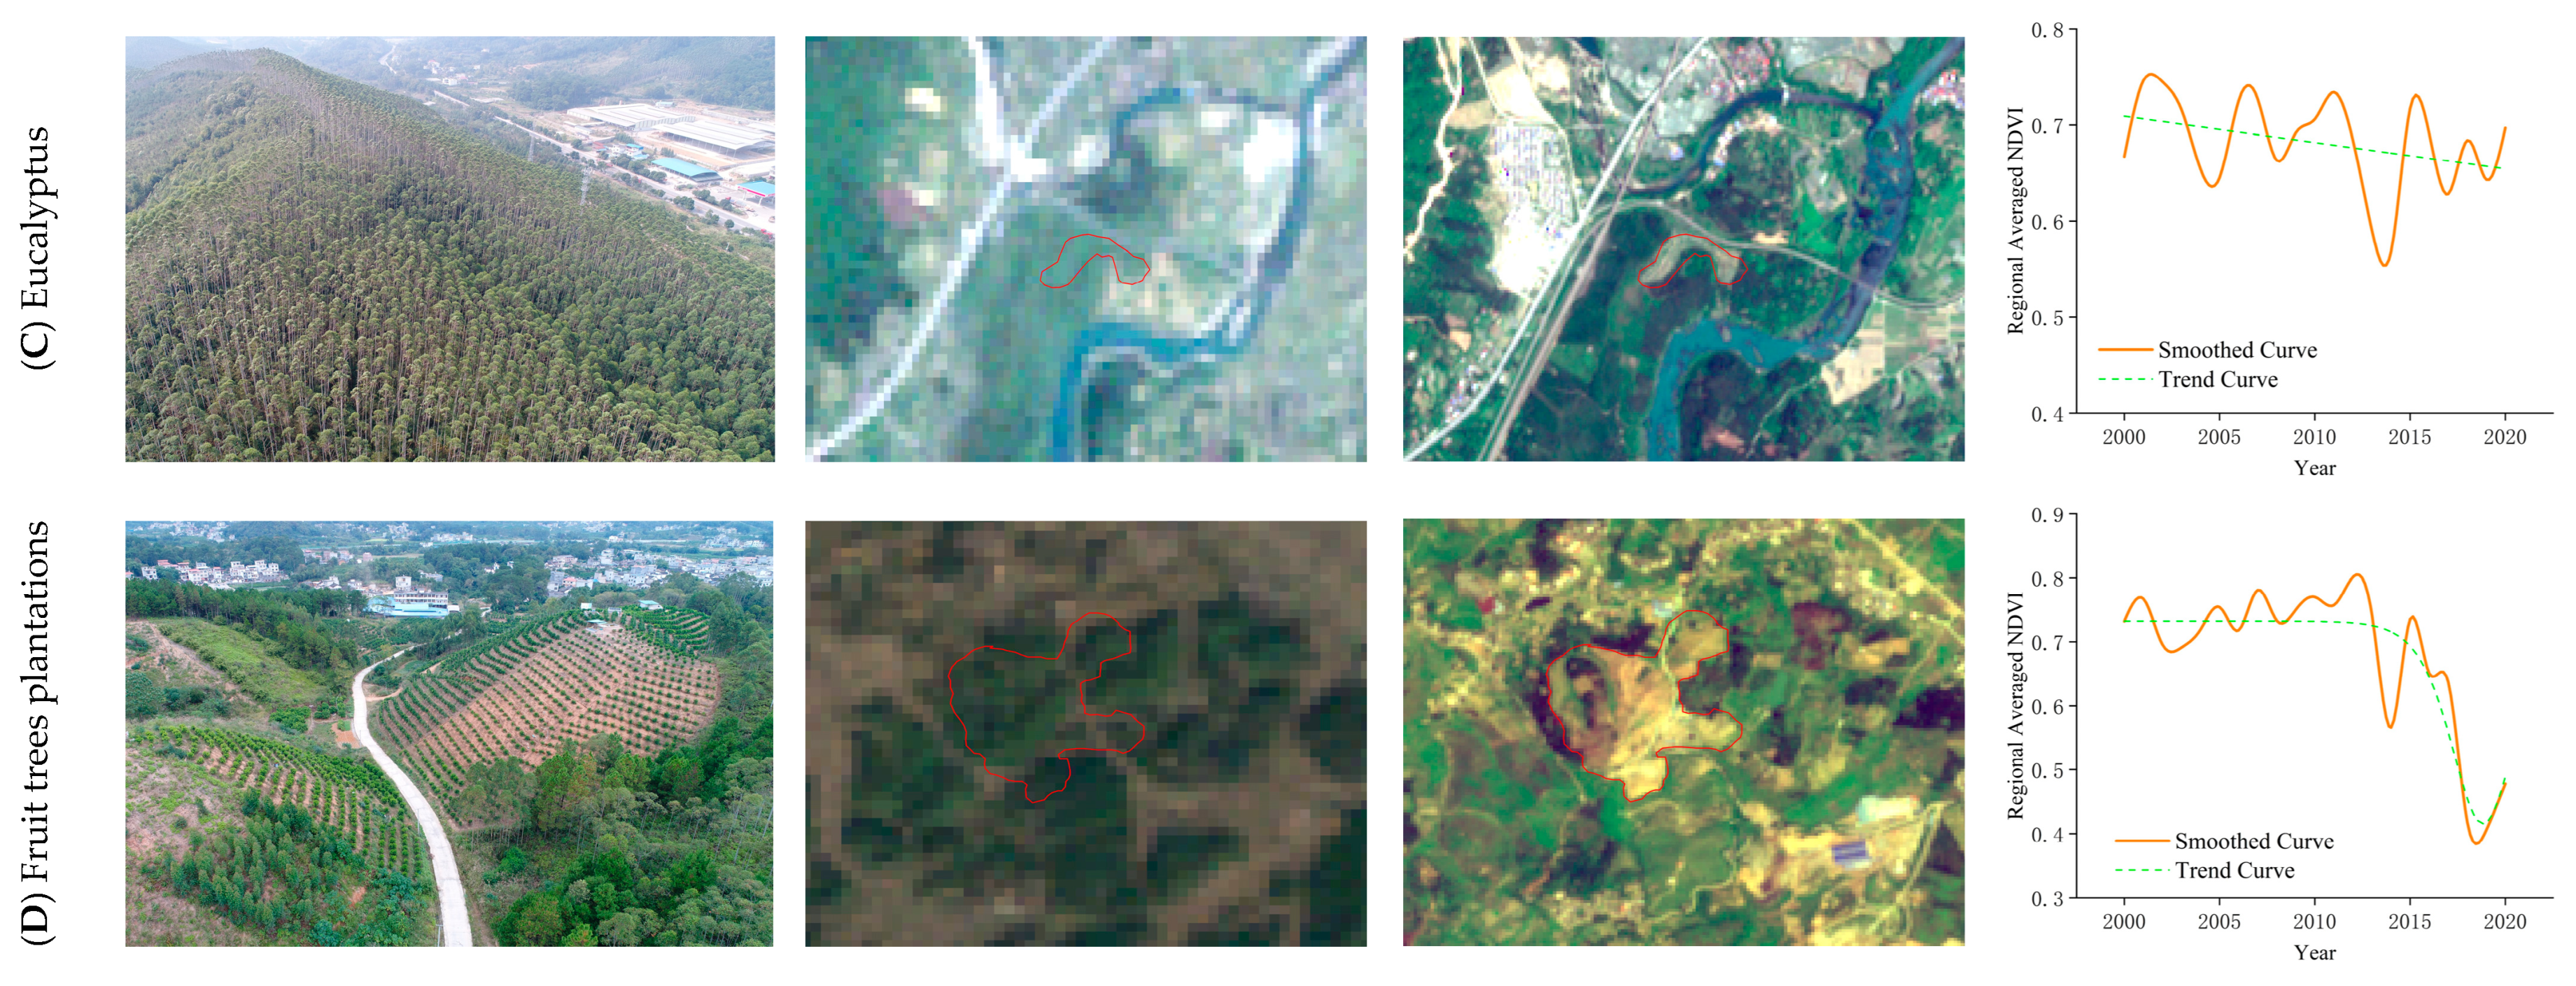
Based on the dominant factor analysis, the downside of human activities still outweighed the positive influence on natural vegetation. High-intensity human activities, mainly the unrestrained utilization of land resources, have increased the pressure on vulnerable karst landscapes in the whole basin. Figure 8 shows four cases in karst area, reflecting the damage to natural vegetation caused by diversified human production activities. As illustrated in case(A) and case(B) of Figure 8, the destruction of forests and fragmentation of landscapes were direct consequences of quarry operations, and the NDVI curve manifestations of mining activities sharply decreased; moreover, these mining activities also had negative impacts on regional ecology, such as degradation of ecosystems, deterioration of water quality and biodiversity loss [56,57,58]. Case(C) shows a large area of artificially grown Eucalyptus. This kind of fast-growing tree has been widely planted in basins with short rotation lengths and strong adaptability, posing a threat to autochthonous species. Additionally, the plantations of Eucalyptus depleted the poor soil in karst regions and hastened regional rocky desertification after logging. As Case(D) indicates, the orchards were reclaimed from native trees on the hillsides. No grass or other plants grew among the parallel rows of fruit trees. Undoubtedly, the cultivation of fruit trees has caused severe ecological and environmental consequences. The utilization of pesticides in fertilizers contaminated the surface soil, and pollutants more easily migrated and diffused on slopes via surface runoff. Furthermore, soil erosion was aggravated, and vegetation coverage sharply decreased with the extensive expansion of orange trees, resulting in the continuous destruction of vegetation landscapes.
4. Discussion
4.1. Vegetation Changes under Different Coverage Levels
As the dominant bedrock form, highly soluble carbonate rocks in the Lijiang River Basin have the potential to evolve into rocky desertification affected by extreme rainfall and more frequent floods [59]. To express the degrees of rock desertification quantitatively, based on the annual NDVI, the pixel-based vegetation coverage ratio (VCR, calculated with ) in forestland from 2000 to 2020 was calculated and divided into 5 types [60,61]. The area ratios of different vegetation coverage types are presented in Figure 9. In the last two decades, the VCR has shown an overall downward trend. The percentage of high vegetation coverage (VCR ≥ 0.8) decreased greatly to approximately 40% in 2020, down from approximately 70% in 2000, most of this coverage shifted to moderate vegetation coverage (0.4 ≤ VCR < 0.8). Moreover, these forest areas with a steady decrease in VCR were potentially at risk of rock desertification; this risk was especially strong for the local vulnerable karst landform. Therefore, rock desertification in the Lijiang River Basin still faces a serious situation.
According to the results of the correlation analysis, the combined climatic factors had a general positive correlation with vegetation growth, and the difference in vegetation coverage conditions might result in the spatial heterogeneity of the multiple linear correlation coefficients. The averaged multiple linear correlation coefficients between NDVI and climatic factors under 5 different VCR types were calculated (Table 5), and regular differences were apparent in different VCR types. The correlation coefficients showed a trend of rising with the decrease in VCR, indicating that the effects of climatic factors on vegetation were more significant in sparsely vegetated regions. Therefore, it could be assumed that the growth of sparse vegetation is more sensitive to extreme climatic conditions.
4.2. Comparison with Similar Studies
In recent years, many studies have focused on vegetation dynamics and changes and their driving forces. It is possible that due to the difference in study scale, some differences exist between this study and previous studies:
(1) The dominant climatic factors affecting vegetation growth were temperature and precipitation in Southwest China, as studied by Peng et al. [62]. Compared with our study at the interannual timescale, the fitting of the vegetation index with temperature and precipitation at the monthly timescale was better due to the highly correlated seasonal variations between monthly climatic factors and vegetation growth within a year. The results of the correlation analysis of two variables with the same change cycles might be distorted over a decade time scale. Therefore, the time attributes of climatic factors are important when analysing vegetation dynamics under climate change.
(2) Several studies have concluded that the vegetation growth in the research area increased after the implementation of conservation projects after 2000 [38,63]; however, based on our research, the situation of vegetation restoration is not optimistic. The decrease of overall vegetation coverage has been accompanied by increasing human impacts since 2000 (Figure 2 and Table 4). In other words, the negative impacts of human activities on vegetation changes have gradually increased since 2000. From the spot investigation of the Lijiang River Basin in 2020, human disturbances to natural vegetation were still widely distributed, including quarrying activities, Eucalyptus planting, and orchard expansion. The difference in the spatial scales was most likely the main reason for the different conclusions. However, there was no conclusive evidence of whether the different temporal scales or spatial scales led to the different research results. At least, the regional vegetation dynamics were sensitive to the choice of scales, and the scale effect may represent an important direction for future research.
5. Conclusions
This study analysed dynamic changes in vegetation landscapes and their driving forces in a typical karst region in southern China. The innovations and characteristics of this paper were that it analysed the impacts of climate change and human activities on vegetation change at a much higher spatial resolution of 30 m, and more parcel-based vegetation changes caused by human disturbance could be detected at this scale. The results showed that vegetation changed from enhanced to suppressed from 1987 to 2020, and the peak stage occurred in approximately 2001. Precipitation and net radiation were the most important climatic factors affecting vegetation growth. Using the residual analysis method, this study separated the impact of climate change and human activities on vegetation. Climatic factors were regarded as the dominant factors in most of the forest area. The dominant areas of negative human impact have continuously expanded within the last ten years, in contrast to the trend of areas dominated by positive human impacts. Compared with those in non-karst areas, more positive human impacts and less negative human impacts were detected in karst areas, indicating that ecological protection and restoration measures played certain roles in natural vegetation conservation. However, the key protected areas strengthened by the ecological protection policies were limited, and the status of the vegetation landscape was not viewed optimistically from an overall basin perspective. The protection effect of vegetation needs to be tracked continuously.
Author Contributions
M.Y. conceived the study and analysed the data. M.Y. and S.S. drafted the manuscript. G.H. and Y.S. revised the first draft. All authors provided revisions to the manuscript, All authors have read and agreed to the published version of the manuscript.
Funding
This work was jointly funded by the National Key R&D Program of China, grant numbers 2019YFC0507501 and 2018YFC1801105; the National Natural Science Foundation of China, grant number 32201435 and U21A2041; and Guangxi Special Fund Project of Innovation Driven Development, grant number Gui Ke AA20161004-4.
Data Availability Statement
The datasets analysed during the current study are available from the corresponding author on reasonable request.
Conflicts of Interest
The authors declare no conflict of interest.
References
- Economic and Social Council. Report of the Inter-Agency and Expert Group on Sustainable Development Goal Indicators. In Proceedings of the Statistical Commission Fifty-First Session, New York, NY, USA, 3–6 March 2020; p. 13.
- Grizzetti, B.; Liquete, C.; Pistocchi, A.; Vigiak, O.; Zulian, G.; Bouraoui, F.; De Roo, A.; Cardoso, A.C. Relationship between ecological condition and ecosystem services in European rivers, lakes and coastal waters. Sci. Total Environ. 2019, 671, 452–465. [Google Scholar] [CrossRef] [PubMed]
- Lunetta, R.S.; Knight, J.F.; Ediriwickrema, J.; Lyon, J.G.; Worthy, L.D. Land-cover change detection using multi-temporal MODIS NDVI data. Remote Sens. Environ. 2006, 105, 142–154. [Google Scholar] [CrossRef]
- Arneth, A.; Harrison, S.; Zaehle, S.; Tsigaridis, K.; Menon, S.; Bartlein, P.; Feichter, J.; Korhola, A.; Kulmala, M.; O’Donnell, D.; et al. Terrestrial biogeochemical feedbacks in the climate system. Nat. Geosci. 2010, 3, 525–532. [Google Scholar] [CrossRef] [Green Version]
- Liu, R.; Xiao, L.; Liu, Z.; Dai, J. Quantifying the relative impacts of climate and human activities on vegetation changes at the regional scale. Ecol. Indic. 2018, 93, 91–99. [Google Scholar] [CrossRef]
- Qu, S.; Wang, L.; Lin, A.; Zhu, H.; Yuan, M. What drives the vegetation restoration in Yangtze River basin, China: Climate change or anthropogenic factors? Ecol. Indic. 2018, 90, 438–450. [Google Scholar] [CrossRef]
- Chen, Y.; Feng, X.; Tian, H.; Wu, X.; Gao, Z.; Feng, Y.; Piao, S.; Lv, N.; Pan, N.; Fu, B. Accelerated increase in vegetation carbon sequestration in China after 2010: A turning point resulting from climate and human interaction. Glob. Chang. Biol. 2021, 27, 5848–5864. [Google Scholar] [CrossRef]
- Guo, B.W.Q.; Zang, W.; Luo, W. Spatial-temporal shifts of ecological vulnerability of Karst Mountain ecosystem-impacts of global change and anthropogenic interference. Sci. Total Environ. 2020, 741, 140256. [Google Scholar] [CrossRef]
- Song, X.-P.; Hansen, M.C.; Stehman, S.V.; Potapov, P.V.; Tyukavina, A.; Vermote, E.F.; Townshend, J.R. Global land change from 1982 to 2016. Nature 2018, 560, 639–643. [Google Scholar] [CrossRef]
- Zhao, S.; Pereira, P.; Wu, X.; Zhou, J.; Cao, J.; Zhang, W. Global karst vegetation regime and its response to climate change and human activities. Ecol. Indic. 2020, 113, 106208. [Google Scholar] [CrossRef]
- Zheng, K.; Tan, L.; Sun, Y.; Wu, Y.; Duan, Z.; Xu, Y.; Gao, C. Impacts of climate change and anthropogenic activities on vegetation change: Evidence from typical areas in China. Ecol. Indic. 2021, 126, 107648. [Google Scholar] [CrossRef]
- Tong, X.; Brandt, M.; Yue, Y.; Horion, S.; Wang, K.; De Keersmaecker, W.; Tian, F.; Schurgers, G.; Xiao, X.; Luo, Y.; et al. Increased vegetation growth and carbon stock in China karst via ecological engineering. Nat. Sustain. 2018, 1, 44–50. [Google Scholar] [CrossRef]
- Peng, X.; Dai, Q.; Ding, G.; Shi, D.; Li, C. Impact of vegetation restoration on soil properties in near-surface fissures located in karst rocky desertification regions. Soil Tillage Res. 2020, 200, 104620. [Google Scholar] [CrossRef]
- Zhang, C.H.; Qi, X.; Wang, K.; Zhang, M.; Yue, Y. The application of geospatial techniques in monitoring karst vegetation recovery in southwest China: A review. Prog. Phys. Geogr. Earth Environ. 2017, 41, 450–477. [Google Scholar] [CrossRef]
- Jalonen, J.; Järvelä, J.; Koivusalo, H.; Hyyppä, H. Deriving Floodplain Topography and Vegetation Characteristics for Hydraulic Engineering Applications by Means of Terrestrial Laser Scanning. J. Hydraul. Eng. 2014, 140, 04014056. [Google Scholar] [CrossRef]
- Lama, G.F.C.; Errico, A.; Pasquino, V.; Mirzaei, S.; Preti, F.; Chirico, G.B. Velocity uncertainty quantification based on Riparian vegetation indices in open channels colonized by Phragmites australis. J. Ecohydraulics 2021, 7, 71–76. [Google Scholar] [CrossRef]
- Piao, S.; Wang, X.; Park, T.; Chen, C.; Lian, X.; He, Y.; Bjerke, J.; Chen, A.; Ciais, P.; Tømmervik, H.; et al. Characteristics, drivers and feedbacks of global greening. Nat. Rev. Earth Environ. 2019, 1, 14–27. [Google Scholar] [CrossRef] [Green Version]
- Parmesan, C.; Yohe, G. A globally coherent fingerprint of climate change impacts across natural systems. Nature 2003, 421, 37–42. [Google Scholar] [CrossRef]
- Sun, W.; Song, X.; Mu, X.; Gao, P.; Wang, F.; Zhao, G. Spatiotemporal vegetation cover variations associated with climate change and ecological restoration in the Loess Plateau. Agric. For. Meteorol. 2015, 209, 87–99. [Google Scholar] [CrossRef]
- Xu, X.; Chen, H.; Levy, J.K. Spatiotemporal vegetation cover variations in the Qinghai-Tibet Plateau under global climate change. Sci. Bull. 2008, 53, 915–922. [Google Scholar] [CrossRef] [Green Version]
- Asmus, M.L.; Nicolodi, J.; Anello, L.S.; Gianuca, K. The risk to lose ecosystem services due to climate change: A South American case. Ecol. Eng. 2019, 130, 233–241. [Google Scholar] [CrossRef]
- Piao, S.; Ciais, P.; Friedlingstein, P.; Peylin, P.; Reichstein, M.; Luyssaert, S.; Margolis, H.; Fang, J.; Barr, A.; Chen, A.; et al. Net carbon dioxide losses of northern ecosystems in response to autumn warming. Nature 2008, 451, 49–52. [Google Scholar] [CrossRef] [PubMed]
- Wang, J.; Meng, J.J.; Cai, Y.L. Assessing vegetation dynamics impacted by climate change in the southwestern karst region of China with AVHRR NDVI and AVHRR NPP time-series. Environ. Earth Sci. 2007, 54, 1185–1195. [Google Scholar] [CrossRef]
- Qu, S.; Wang, L.; Lin, A.; Yu, D.; Yuan, M.; Li, C. Distinguishing the impacts of climate change and anthropogenic factors on vegetation dynamics in the Yangtze River Basin, China. Ecol. Indic. 2019, 108, 105724. [Google Scholar] [CrossRef]
- King, D.A.; Bachelet, D.M.; Symstad, A.J.; Ferschweiler, K.; Hobbins, M. Estimation of potential evapotranspiration from extraterrestrial radiation, air temperature and humidity to assess future climate change effects on the vegetation of the Northern Great Plains, USA. Ecol. Model. 2015, 297, 86–97. [Google Scholar] [CrossRef] [Green Version]
- Vicente-Serrano, S.M.; Gouveia, C.; Camarero, J.J.; Beguería, S.; Trigo, R.; López-Moreno, J.I.; Azorín-Molina, C.; Pasho, E.; Lorenzo-Lacruz, J.; Revuelto, J.; et al. Response of vegetation to drought time-scales across global land biomes. Proc. Natl. Acad. Sci. USA 2013, 110, 52–57. [Google Scholar] [CrossRef] [Green Version]
- Wu, D.H.; Zhao, X.; Liang, S.L.; Zhou, T.; Huang, K.C.; Tang, B.J.; Zhao, W.Q. Time-lag effects of global vegetation responses to climate change. Glob. Chang. Biol. 2015, 21, 3520–3531. [Google Scholar] [CrossRef]
- Zhang, Y.; Zhang, C.; Wang, Z.; Chen, Y.; Gang, C.; An, R.; Li, J. Vegetation dynamics and its driving forces from climate change and human activities in the Three-River Source Region, China from 1982 to 2012. Sci. Total Environ. 2016, 563, 210–220. [Google Scholar] [CrossRef]
- Zuo, D.; Han, Y.; Xu, Z.; Li, P.; Ban, C.; Sun, W.; Pang, B.; Peng, D.; Kan, G.; Zhang, R.; et al. Time-lag effects of climatic change and drought on vegetation dynamics in an alpine river basin of the Tibet Plateau, China. J. Hydrol. 2021, 600, 126532. [Google Scholar] [CrossRef]
- Sun, Q.; Liu, C.; Chen, T.; Zhang, A. A Weighted-Time-Lag Method to Detect Lag Vegetation Response to Climate Variation: A Case Study in Loess Plateau, China, 1982–2013. Remote Sens. 2021, 13, 923. [Google Scholar] [CrossRef]
- He, G.; Zhao, X.; Yu, M. Exploring the multiple disturbances of karst landscape in Guilin World Heritage Site, China. CATENA 2021, 203, 105349. [Google Scholar] [CrossRef]
- Guo, F.; Jiang, G.; Yuan, D.; Polk, J.S. Evolution of major environmental geological problems in karst areas of Southwestern China. Environ. Earth Sci. 2012, 69, 2427–2435. [Google Scholar] [CrossRef]
- Wu, L.; Wang, S.; Bai, X.; Tian, Y.; Luo, G.; Wang, J.; Li, Q.; Chen, F.; Deng, Y.; Yang, Y.; et al. Climate change weakens the positive effect of human activities on karst vegetation productivity restoration in southern China. Ecol. Indic. 2020, 115, 106392. [Google Scholar] [CrossRef]
- Li, N.; Wang, J.; Wang, H.; Fu, B.; Chen, J.; He, W. Impacts of land use change on ecosystem service value in Lijiang River Basin, China. Environ. Sci. Pollut. Res. 2021, 28, 46100–46115. [Google Scholar] [CrossRef] [PubMed]
- Wang, Q.; Meng, J.; Mao, X. Scenario simulation and landscape pattern assessment of land use change based on neighborhood analysis and auto-logistic model: A case study of Lijiang River Basin. Geogr. Res. 2014, 33, 1073–1084. [Google Scholar]
- Brandt, M.; Yue, Y.; Wigneron, J.-P.; Tong, X.; Tian, F.; Jepsen, M.R.; Xiao, X.; Verger, A.; Mialon, A.; Al-Yaari, A.; et al. Satellite-Observed Major Greening and Biomass Increase in South China Karst During Recent Decade. Earth’s Future 2018, 6, 1017–1028. [Google Scholar] [CrossRef]
- Chen, C.; Park, T.; Wang, X.; Piao, S.; Xu, B.; Chaturvedi, R.K.; Fuchs, R.; Brovkin, V.; Ciais, P.; Fensholt, R.; et al. China and India lead in greening of the world through land-use management. Nat. Sustain. 2019, 2, 122–129. [Google Scholar] [CrossRef]
- Zhang, X.; Yue, Y.; Tong, X.; Wang, K.; Qi, X.; Deng, C.; Brandt, M. Eco-engineering controls vegetation trends in southwest China karst. Sci. Total Environ. 2021, 770, 145160. [Google Scholar] [CrossRef]
- Zhang, Y.; Li, J.; Qin, Q. Identification of Factors Influencing Locations of Tree Cover Loss and Gain and Their Spatio-Temporally-Variant Importance in the Li River Basin, China. Remote Sens. 2016, 8, 201. [Google Scholar] [CrossRef] [Green Version]
- Liu, G.; Jin, Q.; Li, J.; Li, L.; He, C.; Huang, Y.; Yao, Y. Policy factors impact analysis based on remote sensing data and the CLUE-S model in the Lijiang River Basin, China. CATENA 2017, 158, 286–297. [Google Scholar] [CrossRef]
- Yang, Z.; Fang, C.; Li, G.; Mu, X. Integrating multiple semantics data to assess the dynamic change of urban green space in Beijing, China. Int. J. Appl. Earth Obs. Geoinf. 2021, 103, 102479. [Google Scholar] [CrossRef]
- Dwyer, J.L.; Roy, D.P.; Sauer, B.; Jenkerson, C.B.; Zhang, H.K.; Lymburner, L. Analysis Ready Data: Enabling Analysis of the Landsat Archive. Remote Sens. 2018, 10, 1363. [Google Scholar] [CrossRef]
- Zhou, Y.; Dong, J.; Liu, J.; Metternicht, G.; Shen, W.; You, N.; Zhao, G.; Xiao, X. Are There Sufficient Landsat Observations for Retrospective and Continuous Monitoring of Land Cover Changes in China? Remote Sens. 2019, 11, 1808. [Google Scholar] [CrossRef] [Green Version]
- Latella, M.; Luijendijk, A.; Moreno-Rodenas, A.M.; Camporeale, C. Satellite Image Processing for the Coarse-Scale Investigation of Sandy Coastal Areas. Remote Sens. 2021, 13, 4613. [Google Scholar] [CrossRef]
- Muñoz, S.J. ERA5-Land Monthly Averaged Data from 1981 to Present. Copernicus Climate Change Service (C3S) Climate Data Store (CDS). Available online: https://cds.climate.copernicus.eu/cdsapp#!/home (accessed on 1 June 2022).
- Kendall, M. A New Measure of Rank Correlation. Biometrika 1938, 30, 81–93. [Google Scholar] [CrossRef]
- Hamed, K.H. Trend detection in hydrologic data: The Mann–Kendall trend test under the scaling hypothesis. J. Hydrol. 2008, 349, 350–363. [Google Scholar] [CrossRef]
- Guclu, Y.S. Multiple Sen-innovative trend analyses and partial Mann-Kendall test. J. Hydrol. 2018, 566, 685–704. [Google Scholar] [CrossRef]
- Güçlü, Y.S. Improved visualization for trend analysis by comparing with classical Mann-Kendall test and ITA. J. Hydrol. 2020, 584, 124674. [Google Scholar] [CrossRef]
- Piao, S.; Nan, H.; Huntingford, C.; Ciais, P.; Friedlingstein, P.; Sitch, S.; Peng, S.; Ahlström, A.; Canadell, J.G.; Cong, N.; et al. Evidence for a weakening relationship between interannual temperature variability and northern vegetation activity. Nat. Commun. 2014, 5, 5018. [Google Scholar] [CrossRef] [Green Version]
- Zhao, M.; Running, S.W. Drought-Induced Reduction in Global Terrestrial Net Primary Production from 2000 Through 2009. Science 2010, 329, 940–943. [Google Scholar] [CrossRef] [Green Version]
- Ding, Y.; Li, Z.; Peng, S. Global analysis of time-lag and -accumulation effects of climate on vegetation growth. Int. J. Appl. Earth Obs. Geoinf. 2020, 92, 102179. [Google Scholar] [CrossRef]
- Fisher, R.A. The distribution of the partial correlation coefficient. Metron 1923, 3, 329–332. [Google Scholar]
- Baba, K.; Shibata, R.; Sibuya, M. Partial correlation and conditional correlation as measures of conditional independence. Aust. N. Z. J. Stat. 2004, 46, 657–664. [Google Scholar] [CrossRef]
- Huang, S.; Zheng, X.; Ma, L.; Wang, H.; Huang, Q.; Leng, G.; Meng, E.; Guo, Y. Quantitative contribution of climate change and human activities to vegetation cover variations based on GA-SVM model. J. Hydrol. 2020, 584, 124687. [Google Scholar] [CrossRef]
- Sonter, L.J.; Ali, S.H.; Watson, J.E.M. Mining and biodiversity: Key issues and research needs in conservation science. Proc. R. Soc. B Boil. Sci. 2018, 285, 20181926. [Google Scholar] [CrossRef] [Green Version]
- Modiegi, M.; Rampedi, I.T.; Tesfamichael, S.G. Comparison of multi-source satellite data for quantifying water quality parameters in a mining environment. J. Hydrol. 2020, 591, 125322. [Google Scholar] [CrossRef]
- Islam, K.; Vilaysouk, X.; Murakami, S. Integrating remote sensing and life cycle assessment to quantify the environmental impacts of copper-silver-gold mining: A case study from Laos. Resour. Conserv. Recycl. 2020, 154, 8–20. [Google Scholar] [CrossRef]
- Jiang, Z.; Lian, Y.; Qin, X. Rocky desertification in Southwest China: Impacts, causes, and restoration. Earth Sci. Rev. 2014, 132, 1–12. [Google Scholar] [CrossRef]
- Feng, D.; Wang, J.; Fu, M.; Liu, G.; Zhang, M.; Tang, R. Spatiotemporal variation and influencing factors of vegetation cover in the ecologically fragile areas of China from 2000 to 2015: A case study in Shaanxi Province. Environ. Sci. Pollut. Res. 2019, 26, 28977–28992. [Google Scholar] [CrossRef]
- Zhang, M.; Wang, J.; Li, S. Tempo-spatial changes and main anthropogenic influence factors of vegetation fractional coverage in a large-scale opencast coal mine area from 1992 to 2015. J. Clean. Prod. 2019, 232, 940–952. [Google Scholar] [CrossRef]
- Peng, J.; Jiang, H.; Liu, Q.; Green, S.M.; Quine, T.A.; Liu, H.; Qiu, S.; Liu, Y.; Meersmans, J. Human activity vs. climate change: Distinguishing dominant drivers on LAI dynamics in karst region of southwest China. Sci. Total Environ. 2020, 769, 144297. [Google Scholar] [CrossRef]
- Wang, J.; Wang, K.; Zhang, M.; Zhang, C. Impacts of climate change and human activities on vegetation cover in hilly southern China. Ecol. Eng. 2015, 81, 451–461. [Google Scholar] [CrossRef]
Figure 1.
Location of the Lijiang River Basin. (a) Map of Chinese provincial districts. (b) Map of Guangxi Zhuang Autonomous Region. (c) Land use map of Lijiang River Basin.
Figure 1.
Location of the Lijiang River Basin. (a) Map of Chinese provincial districts. (b) Map of Guangxi Zhuang Autonomous Region. (c) Land use map of Lijiang River Basin.

Figure 2.
Framework of the research. The green boxes represent data, blue boxes represent model or method, whereas white and orange boxes represent intermediate results and final results, respectively.
Figure 2.
Framework of the research. The green boxes represent data, blue boxes represent model or method, whereas white and orange boxes represent intermediate results and final results, respectively.

Figure 3.
NDVI profiles from 1987 to 2020 in Lijiang River Basin.

Figure 4.
Spatial distribution of NDVI in forest areas in (a) 1987; (b) 2001; (c) 2020 and the change trend of annual NDVI covering (d) 1987−2000; (e) 2001−2020; (f) 1987−2020.
Figure 4.
Spatial distribution of NDVI in forest areas in (a) 1987; (b) 2001; (c) 2020 and the change trend of annual NDVI covering (d) 1987−2000; (e) 2001−2020; (f) 1987−2020.

Figure 5.
(a) Partial correlation coefficient of annual NDVI and precipitation; (b) partial correlation coefficient of annual NDVI and net radiation; (c) multiple linear correlation coefficient (Mr) of annual NDVI with precipitation and net radiation; (d) significance of multiple linear regression.
Figure 5.
(a) Partial correlation coefficient of annual NDVI and precipitation; (b) partial correlation coefficient of annual NDVI and net radiation; (c) multiple linear correlation coefficient (Mr) of annual NDVI with precipitation and net radiation; (d) significance of multiple linear regression.

Figure 6.
Distribution of dominant factors on vegetation growth every two years from 2000 to 2020.

Figure 7.
Area percentage of different dominant factors in (a) karst areas and (b) non-karst areas.

Figure 8.
Cases of negative human activities. (A) Abandoned quarry. (B) Active quarry. (C) Eucalyptus. (D) Fruit trees plantations. The locations of the cases are shown in Figure 1c. The first column shows the photos taken by unmanned aerial vehicles in 2020, the 2nd and 3rd columns show the true colour Landsat-5 image of 2000 and the true colour Landsat-8 image of 2020, respectively, and the last column shows the NDVI time-series profile of each human disturbed zone.


Figure 9.
Area ratio of different vegetation coverage rates from 2000 to 2020.


Table 1.
Datasets used in this study.
| Data | Source | Time Range | Resolution |
|---|---|---|---|
| NDVI | Landsat-5/TM | 1987 to 2011 | 30 m, 16 days |
| Landsat-8/OLI | 2013 to 2020 | 30 m, 16 days | |
| Precipitation/2 m Temperature/Surface net radiation | ERA5-Land | 1987 to 2020 | 0.1° × 0.1°, monthly |
| Land use data | GlobeLand30 | 2000, 2010 and 2020 | 30 m |
Table 2.
Area percentage of different vegetation change trends (%).
| Period | Decreased Significantly | Decreased Marginally | Increased Significantly | Increased Marginally | Unchanged |
|---|---|---|---|---|---|
| 1987–2000 | 0.8 | 1.0 | 7.5 | 6.9 | 83.7 |
| 2001–2020 | 49.2 | 12.4 | 0.4 | 0.8 | 37.2 |
| 1987–2020 | 21.5 | 7.7 | 1.5 | 5.1 | 64.3 |
Table 3.
Changes in the partial correlation coefficient of NDVI and precipitation/air temperature/surface net radiation (represented by Pr_P, Pr_NR and Pr_T, respectively) under different time-lag conditions.
Table 3.
Changes in the partial correlation coefficient of NDVI and precipitation/air temperature/surface net radiation (represented by Pr_P, Pr_NR and Pr_T, respectively) under different time-lag conditions.
| Time-Lag | 0 Month | 1 Month | 2 Month | 3 Month | 4 Month | 5 Month | 6 Month |
|---|---|---|---|---|---|---|---|
| Pr_P | 0.355 | 0.407 | 0.368 | 0.361 | 0.342 | 0.288 | 0.25 |
| Pr_NR | 0.37 | 0.439 | 0.383 | 0.345 | 0.321 | 0.269 | 0.215 |
| Pr_T | −0.05 | −0.07 | −0.08 | −0.07 | −0.05 | −0.06 | −0.07 |
Table 4.
Area percentage of different dominant factors on vegetation change (%).
| Dominant Factor | 2001–2002 | 2003–2004 | 2005–2006 | 2007–2008 | 2009–2010 | 2011–2012 | 2013–2014 | 2015–2016 | 2017–2018 | 2019–2020 |
|---|---|---|---|---|---|---|---|---|---|---|
| PH | 15.8 | 27.8 | 18.5 | 18.6 | 16.4 | 13.0 | 7.8 | 8.0 | 8.8 | 5.4 |
| NH | 0.7 | 2.2 | 2.9 | 14.3 | 5.0 | 9.3 | 10.9 | 12.7 | 16.0 | 18.5 |
| C | 83.6 | 70.0 | 78.6 | 67.1 | 78.6 | 77.7 | 81.3 | 79.3 | 75.2 | 76.2 |
Note: PH means positive human impact, NH means negative human impact, and C means climate change.
Table 5.
Multiple linear correlation coefficient results of annual NDVI with precipitation and net radiation under different vegetation coverage rates.
Table 5.
Multiple linear correlation coefficient results of annual NDVI with precipitation and net radiation under different vegetation coverage rates.
| VCR ≥ 0.8 | 0.6 ≤ VCR < 0.8 | 0.4 ≤ VCR < 0.6 | 0.2 ≤ VCR < 0.4 | VCR < 0.2 | |
|---|---|---|---|---|---|
| Mr | 0.608 | 0.620 | 0.650 | 0.684 | 0.703 |
Publisher’s Note: MDPI stays neutral with regard to jurisdictional claims in published maps and institutional affiliations. |
© 2022 by the authors. Licensee MDPI, Basel, Switzerland. This article is an open access article distributed under the terms and conditions of the Creative Commons Attribution (CC BY) license (https://creativecommons.org/licenses/by/4.0/).
Share and Cite
MDPI and ACS Style
Yu, M.; Song, S.; He, G.; Shi, Y. Vegetation Landscape Changes and Driving Factors of Typical Karst Region in the Anthropocene. Remote Sens. 2022, 14, 5391. https://0-doi-org.brum.beds.ac.uk/10.3390/rs14215391
AMA Style
Yu M, Song S, He G, Shi Y. Vegetation Landscape Changes and Driving Factors of Typical Karst Region in the Anthropocene. Remote Sensing. 2022; 14(21):5391. https://0-doi-org.brum.beds.ac.uk/10.3390/rs14215391
Chicago/Turabian StyleYu, Mingzhao, Shuai Song, Guizhen He, and Yajuan Shi. 2022. "Vegetation Landscape Changes and Driving Factors of Typical Karst Region in the Anthropocene" Remote Sensing 14, no. 21: 5391. https://0-doi-org.brum.beds.ac.uk/10.3390/rs14215391
Note that from the first issue of 2016, this journal uses article numbers instead of page numbers. See further details here.