

A Multi-Source Data Fusion Method to Improve the Accuracy of Precipitation Products: A Machine Learning Algorithm

1
Department of Meteorology and the Center of Excellence for Climate Change Research, King Abdulaziz University, Jeddah 21589, Saudi Arabia
2
Institute of Geography (Landscape Ecology), Humboldt University of Berlin, Rudower Chaussee 16, 12489 Berlin, Germany
*
Author to whom correspondence should be addressed.
Remote Sens. 2022, 14(24), 6389; https://0-doi-org.brum.beds.ac.uk/10.3390/rs14246389
Submission received: 3 October 2022
/
Revised: 27 November 2022
/
Accepted: 6 December 2022
/
Published: 17 December 2022
(This article belongs to the Special Issue Advances in Mesoscale Meteorology and Precipitation Monitoring and Processes Using Remote Sensing Observations and Technologies)
Abstract
:In recent decades, several products have been proposed for estimating precipitation amounts. However, due to the complexity of climatic conditions, topography, etc., providing more accurate and stable precipitation products is of great importance. Therefore, the purpose of this study was to develop a multi-source data fusion method to improve the accuracy of precipitation products. In this study, data from 14 existing precipitation products, a digital elevation model (DEM), land surface temperature (LST) and soil water index (SWI) and precipitation data recorded at 256 gauge stations in Saudi Arabia were used. In the first step, the accuracy of existing precipitation products was assessed. In the second step, the importance degree of various independent variables, such as precipitation interpolation maps obtained from gauge stations, elevation, LST and SWI in improving the accuracy of precipitation modelling, was evaluated. Finally, to produce a precipitation product with higher accuracy, information obtained from independent variables were combined using a machine learning algorithm. Random forest regression with 150 trees was used as a machine learning algorithm. The highest and lowest degree of importance in the production of precipitation maps based on the proposed method was for existing precipitation products and surface characteristics, respectively. The importance degree of surface properties including SWI, DEM and LST were 65%, 22% and 13%, respectively. The products of IMERGFinal (9.7), TRMM3B43 (10.6), PRECL (11.5), GSMaP-Gauge (12.5), and CHIRPS (13.0 mm/mo) had the lowest RMSE values. The KGE values of these products in precipitation estimation were 0.56, 0.48, 0.52, 0.44 and 0.37, respectively. The RMSE and KGE values of the proposed precipitation product were 6.6 mm/mo and 0.75, respectively, which indicated the higher accuracy of this product compared to existing precipitation products. The results of this study showed that the fusion of information obtained from different existing precipitation products improved the accuracy of precipitation estimation.
1. Introduction
Access to accurate precipitation data is of great importance in various applications such as agriculture, water resources, drought monitoring, runoff modelling, flood and storm risk assessment, industry, etc. [1,2,3,4,5]. In this regard, one of the limiting factors of research and development in the field of meteorology and water sciences worldwide is the lack of basic data such as precipitation [6,7]. Ground stations are one of the most widely used sources for accessing precipitation data in climatic and environmental applications. However, these sources are associated with serious shortcomings, such as the short length of the time series and the scattered spatial distribution of data collection stations [8,9]. Ground network stations are scattered in many parts of the world, especially in developing countries due to geographical and economic constraints [10,11,12].
In recent years, researchers have been looking for a supplement to supplement the information obtained from ground precipitation stations [11,13,14,15]. Hence, many different methods and products have been proposed, including global networked precipitation databases, the use of satellite images, interpolation methods, and numerical methods for estimating precipitation in areas without dense meteorological and precipitation stations [1,11,16,17,18]. Each of these methods and products has advantages and disadvantages. Often, satellite precipitation is less accurate than ground-based precipitation data. Researchers have paid special attention to these products in recent years because of their spatial and temporal resolution and wide geographical coverage. The results of previous reports and studies demonstrate the remarkable potential of these products in various climatic fields [10,11,12,16,19].
Today, different types of satellites are moving hundreds of kilometers above the earth, observing large areas in specific time cycles, each of which collects specific information from the atmosphere, surface or underground [20,21,22,23,24,25,26,27]. During the last decades, remote sensing data have been widely applied in many applications, such as precipitation [16,28], hydrology [26,27,29], water management [30], soil moisture [31,32], land cover/use [33,34], urban growth [35,36], urban heat islands [37,38,39], thermal comfort [40], surface ecological status [41,42,43], surface biophysical variables [44,45], and dust [25,46], etc. Meteorological satellites provide quantitative and numerical information on meteorological phenomena over a wide range. This information gives researchers and meteorologists a better view of dynamic weather patterns and precipitation systems [6,7,14,47,48].
Precipitation estimation methods using satellite images are relatively complex. Using this data, it is possible to estimate the volume of rainwater based on water vapor absorption, and thermal and radar bands at different spatial and temporal scales [13,14,15,17,49,50]. The use of satellite data for precipitation estimation has several advantages, such as high temporal and spatial resolution, global spatial coverage on the oceans and land, especially in mountainous and inaccessible areas [18,51]. However, various studies have shown that satellite-based precipitation products in many areas contain uncertainty and large errors [52,53,54]. Yamamoto, et al. [55] showed that the satellite-retrieved precipitation particularly over the mountainous regions, can be associated with large uncertainties. The data quality of these satellite products can be affected by underestimation or overestimation [16,56]. The spatial and temporal accuracy of precipitation products affects the prediction and modelling of natural hazards like floods, landslides, and dust storms [4,10,57]. It is therefore important to evaluate the accuracy of existing precipitation products before using them in different applications. It is equally imperative to provide an algorithm to improve the accuracy of precipitation products.
Previous studies in the field of precipitation can be divided into several main groups, including: (1) the development of algorithms and precipitation products based on satellite and gauge data or a combination of them [5,9,52,58]; (2) accuracy evaluations of various precipitation products [11,18,50,59,60,61,62]; and (3) the use of precipitation products in different applications [10,54,57,61]. In these studies, precipitation products are classified into four groups: gauge-based products; satellite-based products; gauge-corrected satellites; and reanalysis products [16,62]. Also, in addition to satellite observations and ground-based rain gauges, meteorological Doppler radars play a crucial role in estimating precipitation and complementing ground-based precipitation measurements [63,64]. The accuracy of each of these products has been evaluated on the scale of the whole region, catchments, climatic classes, etc. [10,15,16]. The results of these studies showed that the accuracy of precipitation products is not the same. These products each have strengths and weaknesses in estimating precipitation amounts based on atmospheric, climatic, and geographical conditions. Hence, it cannot be concluded that the accuracy of a precipitation satellite product is always higher or lower than other products in different conditions. Hence the combination of the capabilities of precipitation satellite products, ground station data and auxiliary information can lead to a product with higher accuracy in different conditions [58,62,65]. As a result of combining various data sources over the past decade, new precipitation products have been developed, such as the US National Climate Service Forecasting Center (CPC) (CMORPH) [66], Precipitation Estimation from Remotely Sensed Information using Artificial Neural Networks (PERSIANN) [52], Tropical Rainfall Measuring Mission (TRMM), Multi-satellite precipitation Analysis (TMPA) [67], NRL-Blend satellite precipitation estimates from laboratory NRL Naval Research [68], Global Precipitation Measurement (GPM), and Multi-Satellite Integrated Recovery for GPM (IMERG) [69]. These precipitation products can be classified into four groups including: (1) gauge-based products; (2) satellite-based products; (3) gauge-corrected satellites; and (4) reanalysis products [16]. These products have a temporal resolution of hourly, daily, or monthly, and a spatial resolution of 4 km to 250 km.
The purpose of this study was to develop a multi-source data fusion method to improve the accuracy of precipitation products. For this purpose, the accuracy of a comprehensive set of different existing precipitation products that are currently available were evaluated. Then, to achieve a more accurate precipitation product, information obtained from different existing precipitation products, surface properties, and precipitation data recorded at gauge stations were combined based on a machine learning model.
2. Study Area
Saudi Arabia is the largest country in west Asia with a total area of about 2,150,000 km2. With a population of 35.9 million, this country is located between 30°W–57°W and 12°N–35°N (Figure 1). Located in an arid region with wide temperature differences between day and night, Saudi Arabia occupies a significant portion of the Arabian Peninsula. The three large deserts, Al Nufud Al Kabir, Ad-Dahna, and Rub Al-Khali are the most well-known deserts in Saudi Arabia. There are no rivers in Saudi Arabia. Its topography varies from mountain ranges rising from the central part to the west to relatively flat terrain in the east. The impact of topography leads to a semi-arid climate in the southwest region, whereas the rest of the country has a hot and dry desert climate. Rainfall in the country has high spatial and temporal changes. Eastern and southwest regions receive more rainfall than other regions of the country.
In northern Saudi Arabia, the rainy season begins in October and ends in April, with the rest of the year being dry. A mountain range, running north-south along the Red Sea, reaching heights of more than 1500 m in the south-western area, causes a varied precipitation pattern. A combination of convective and orographic rainfall occurs throughout the year in this region of Saudi Arabia [70]. The average annual precipitation in this country is 100 mm. In desert regions, it is less than 100 mm, while in mountainous regions it varies between 250 and 300 mm [70,71,72]. Each season in Saudi Arabia has its own meteorological characteristics [72,73]. The Intertropical Convergence Zone (ITCZ) and the northward movement of the southwest monsoon are frequently responsible for summer rainfalls, except in the highlands where the uplift factor is dominant [72]. Meanwhile, westerly waves in the upper atmosphere and disturbances from the Mediterranean Sea and the Sudan Trough cause winter rainfalls.
3. Data and Methods
3.1. Data
In this study, several types of ground and satellite data including monthly precipitation data recorded in 256 ground stations, monthly precipitation products, digital elevation model (DEM), monthly land surface temperature (LST) and monthly soil water index (SWI) products were used from 2003 to 2021. Precipitation stations in the study area were divided into three groups and the data recorded in them were used for different purposes. The data of the first group, consisting of 83 stations, were used to prepare a monthly precipitation map based on the interpolation method. The data of the second group, consisting of 57 stations, were utilized to calibrate the proposed method in preparing a more accurate precipitation product. Finally, the third group, including data from 116 stations, was used to evaluate the accuracy of existing and produced precipitation products in this study. The precipitation products used in this study include gauge-based products, satellite-based products, gauge-corrected satellites, and reanalysis products (Table 1). The precipitation products are very diverse; however, this study used only products whose currently available data were up to date. MOD11C3 product obtained from MODIS was used to consider the effect of surface temperature in the precipitation modelling process. The spatial resolution of this product was 5000 m. The data are available on the https://ladsweb.modaps.eosdis.nasa.gov/ (10 June 2022) website. Also, the SWI product obtained from Metop ASCAT with a spatial resolution of 10,000 m was used as a quantitative parameter related to soil moisture in the precipitation modelling process. The data are available on the https://land.copernicus.vgt.vito.be/ (12 June 2022) website. The DEM of ALOS World 3D with a spatial resolution of 30 m for 2011 was considered as a product representing the elevation parameter in the precipitation modelling process. The data are available on the https://www.eorc.jaxa.jp/ALOS/en/dataset/aw3d30 (12 June 2022) website. In evaluating the accuracy of existing precipitation products and implementing the proposed method to produce a precipitation product, the spatial resolution of different data was converted to 25 km by the cubic convolution interpolation method [74].
3.2. Methods
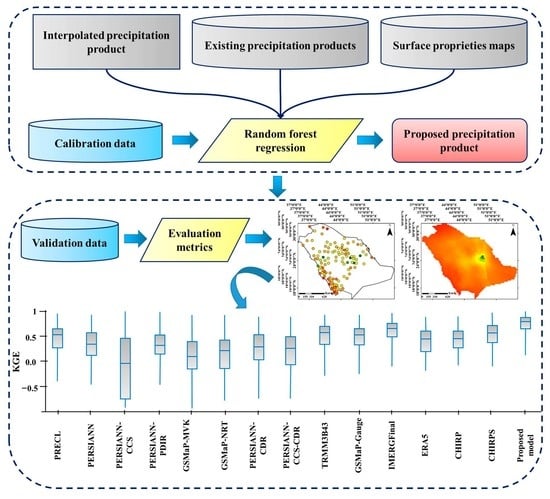
The overall process of the proposed method to generate a precipitation product with high accuracy is presented in Figure 2. In the first step, the accuracy of existing precipitation products was evaluated based on point-to-pixel and pixel-to-pixel strategies. In the second step, the degree of importance of various independent variables including existing precipitation products, precipitation interpolation map obtained from the interpolation method, elevation, and LST and SWI in producing the proposed precipitation product were evaluated and compared with each other. In the third step, to produce a precipitation product with higher accuracy, information obtained from these independent variables were combined using a machine learning algorithm.
3.2.1. Assessing the Accuracy of Precipitation Products
In this study, various metrics and strategies based on gauge data were used to evaluate the accuracy of precipitation products. The metrics used and their equations are summarized in Table 2. Each of these metrics was calculated with two “point-to-pixel” and “pixel-to-pixel” strategies. In the point-to-pixel strategy, the accuracy of different precipitation products was evaluated based on precipitation data recorded at gauge stations (selected for products validation, Figure 1d). In this strategy, the results of the accuracy assessments were presented at the scale of each gauge station. In the pixel-to-pixel strategy, the accuracy of different precipitation products was evaluated based on the precipitation map obtained from the interpolation of gauge station data (selected for products validation, Figure 1d). Using this strategy, the accuracy of different precipitation products was evaluated spatially and continuously in each pixel of the study area.
Many interpolation algorithms for precipitation data have been suggested, including simple averaging [84], Thiessen polygons [28], inverse distance weighting (IDW) [85], and various Kriging methods [86,87]. In order to determine the accuracy of the interpolation method, a variety of factors can be taken into consideration. These factors include the structure of the rain gauge network and the topography of the region. It should be noted that the ordinary Kriging (OK) approach was used in this work because of its high accuracy in simulating regional changes in precipitation amounts in Saudi Arabia [88]. OK’s key step was to create a semi-variogram utilizing precipitation data and geographical locations, as well as geostatistical correlations and weights of neighbor observations [89,90]. A detailed description of the process of interpolating precipitation maps using OK was presented by Adhikary, et al. [91]. The OK method was implemented separately for each date and an interpolated map of precipitation based on ground stations was produced for each date.
Relative Bias (RBias)
RBias, as a bias indicator, represents the degree of overall underestimation (negative values) or overestimation (positive values) of predictions.
Correlation Coefficient (CC)
The Pearson correlation coefficient is employed to measure the linear relationship between estimated and measured precipitation.
Root Mean Squared Error (RMSE)
RMSE represents average the magnitude of the error, which is a negatively oriented score, i.e., lower values show better results.
Random Error (RE)
Random errors are unpredictable fluctuations in the estimated precipitation concerning the measured precipitation.
Systematic Error (SE)
Systematic errors are predictable and reproducible inaccuracies that are consistently in the same direction
Kling- Gupta Efficiency (KGE)
KGE represents similarity degree between the estimated values from datasets and observations. Multi-component nature of KGE incorporates linear correlation, bias, and variability within a single objective function, providing a more balanced model evaluation. The optimum value of KGE is one.
3.2.2. Proposed Method for Preparing a Precipitation Product
In this study, a method based on combining information obtained from different sources was presented to prepare a precipitation product with higher accuracy. A total of 14 existing precipitation products, an OK-based precipitation product, LST, elevation and SWI were used as independent variables for generating the proposed precipitation product (dependent variable). Equation (1) was used to calculate the amount of precipitation based on the proposed method:
where f is a function representing the relationship between the independent variables and the dependent variable. In this study, a random forest regression algorithm is used to determine the f-function. In this algorithm, the optimal number of trees was determined based on repetition and evaluation of results from 50 to 300 trees with a step size of 50. Finally, 150 was selected as the optimal number of trees.
To construct and calibrate the final function to estimate the dependent variable (precipitation) based on independent variables, ground station data intended for calibration have been used (Figure 1d). The importance degree of independent variables was calculated based on VarImp function in a random forest algorithm.
4. Results
4.1. The Importance Degree of Independent Variables
The results of evaluating the importance degree of the independent variables were presented in Figure 3. Final precipitation products produced using the proposed method are primarily based on existing precipitation products (55%), which are more important than interpolated precipitation products (35%), and topographic and biophysical properties (elevation, LST and SWI) (15%). On a study area scale, the following existing precipitation products have the highest importance degree in producing the final precipitation product: IMERGFinal, TRMM3B43, PRECL, PERSIANN-CCS-CDR, and GSMaP-Gauge. Under different conditions, different existing precipitation products play a varying role in generating a final precipitation product. With regard to surface biophysical and topographic properties, the importance degree of SWI, elevation, and LST in the estimation of precipitation was 65, 22 and 13%, respectively. Considering SWI, elevation, and LST as independent variables in generating the proposed precipitation product increases the accuracy of precipitation estimation.
4.2. Evaluate the Accuracy of Precipitation Products Based on a Pixel-to-Pixel Strategy
The results of the accuracy evaluation of different precipitation products based on the precipitation map obtained from OK interpolation are shown in Table 3. The IMERGFinal (9.7), TRMM3B43 (10.6), PRECL (11.5), GSMaP-Gauge (12.5), and CHIRPS (13.0 mm/mo) products have the lowest RMSE values. The KGE values of these products are 0.56, 0.48, 0.52, 0.44 and 0.37, respectively. These products have the highest accuracy in estimating precipitation at the study area scale. PERSIANN-CCS, GSMaP-NRT, GSMaP-MVK and PERSIANN-CCS products have the lowest accuracy in precipitation estimation. PRECL, PERSIANN, GSMaP-MVK and GSMaP-Gauge products estimate more precipitation values than the actual values and PERSIANN-CCS, PERSIANN-CDR, GSMaP-NRT and PERSIANN-CCS-CDR products estimate fewer precipitation values than the actual values. The correlation coefficient between gauge-based products and satellite-based products and actual data is lower than gauge-corrected satellites and reanalysis products. The accuracy of existing precipitation products from the gauge-corrected satellite group is higher than other groups.
The variability ratio metric indicates the similarity degree of the changes in estimated precipitation values with observed precipitation values. Among the precipitation products, four products have similar variability to the observed data (variability ratio between 0.90 and 1.10). Other products such as PERSIANN, GSMaP-NRT and PERSIANN-CCS with variability ratio values of 1.52, 1.54, and 0.65, differ in their degree of variation from the observed data. The RMSE and KGE values of the proposed precipitation product are 6.6 mm/mo and 0.75, respectively, which indicates the higher accuracy of this product compared to existing precipitation products; 95 % of the errors in this product were random.
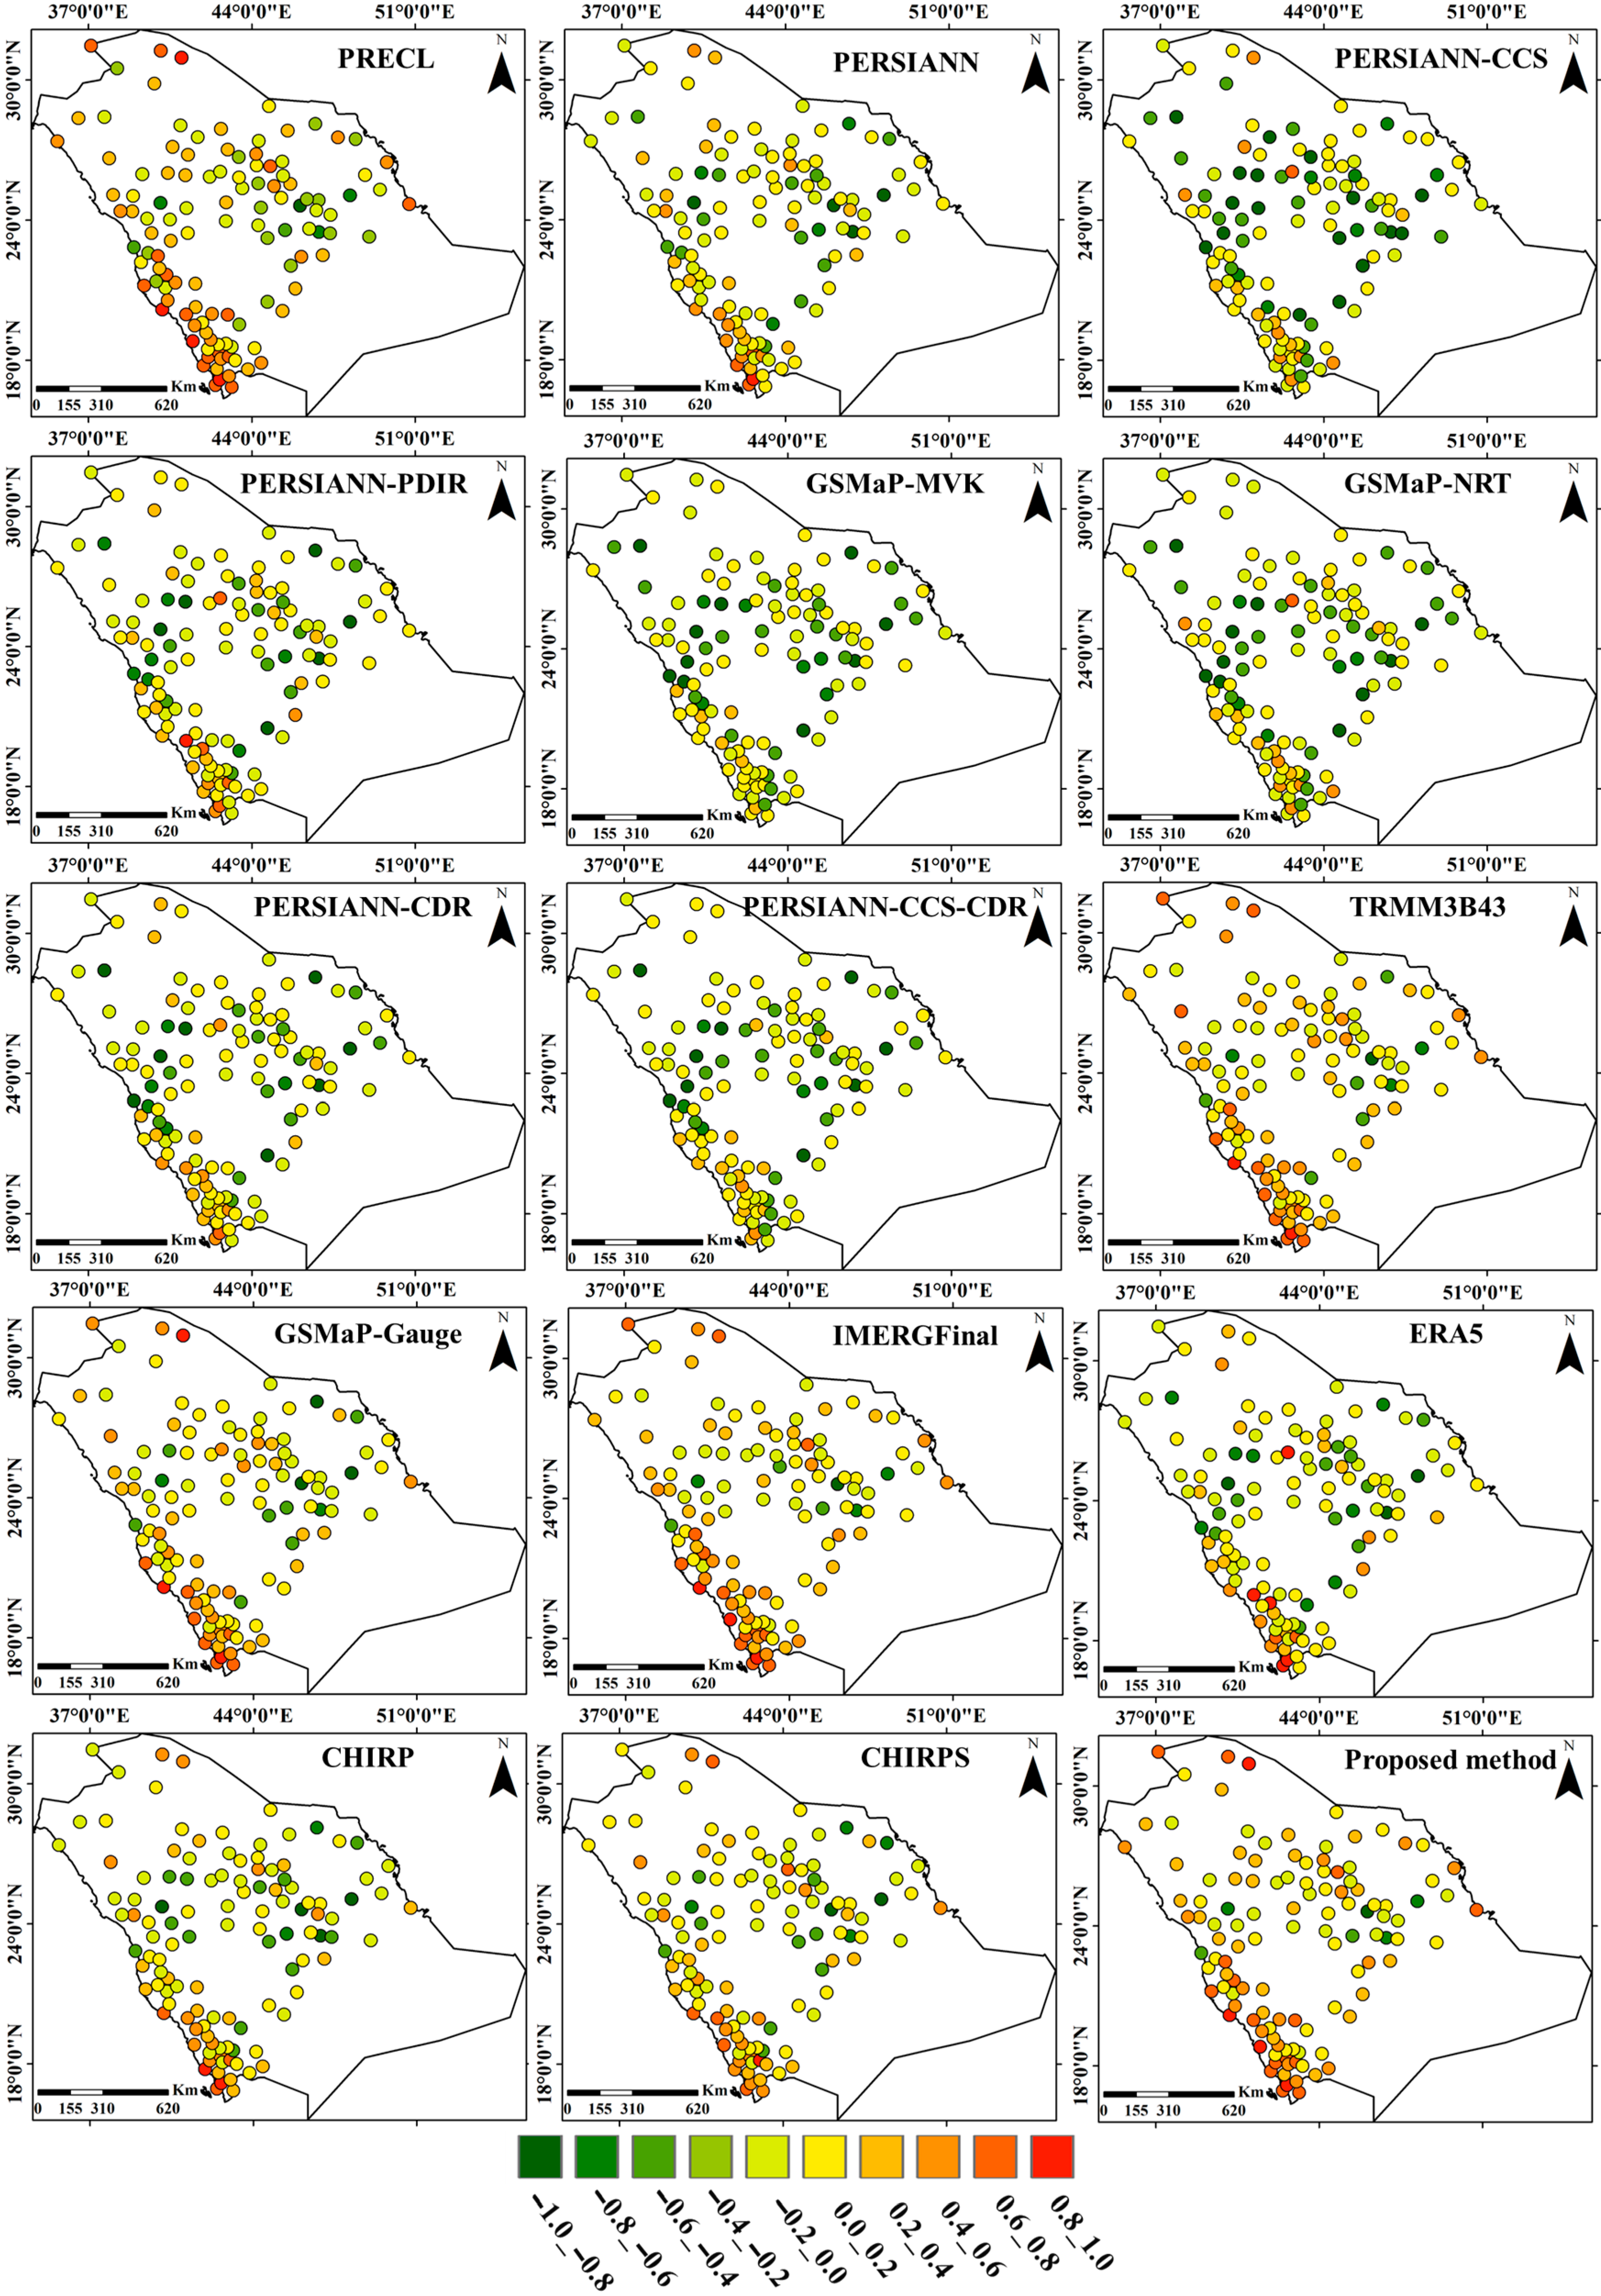
The spatial distribution of KGE values for different precipitation products at the pixel scale is shown in Figure 4. The accuracy of precipitation products in the southwestern and northern regions of Saudi Arabia is better than in other regions. However, the accuracy of precipitation products varies in different regions of the study area. KGE values for the PERSIANN-CCS product are less than 0 in most pixels. KGE values for PRECL, TRMM3B43, IMERGFinal and GSMaP-Gauge products in more than 50% of regions above 0.5 indicate the high accuracy of these products in precipitation estimation. The area of regions with KGE values higher than 0.5 in the proposed precipitation product is higher than the existing precipitation products.
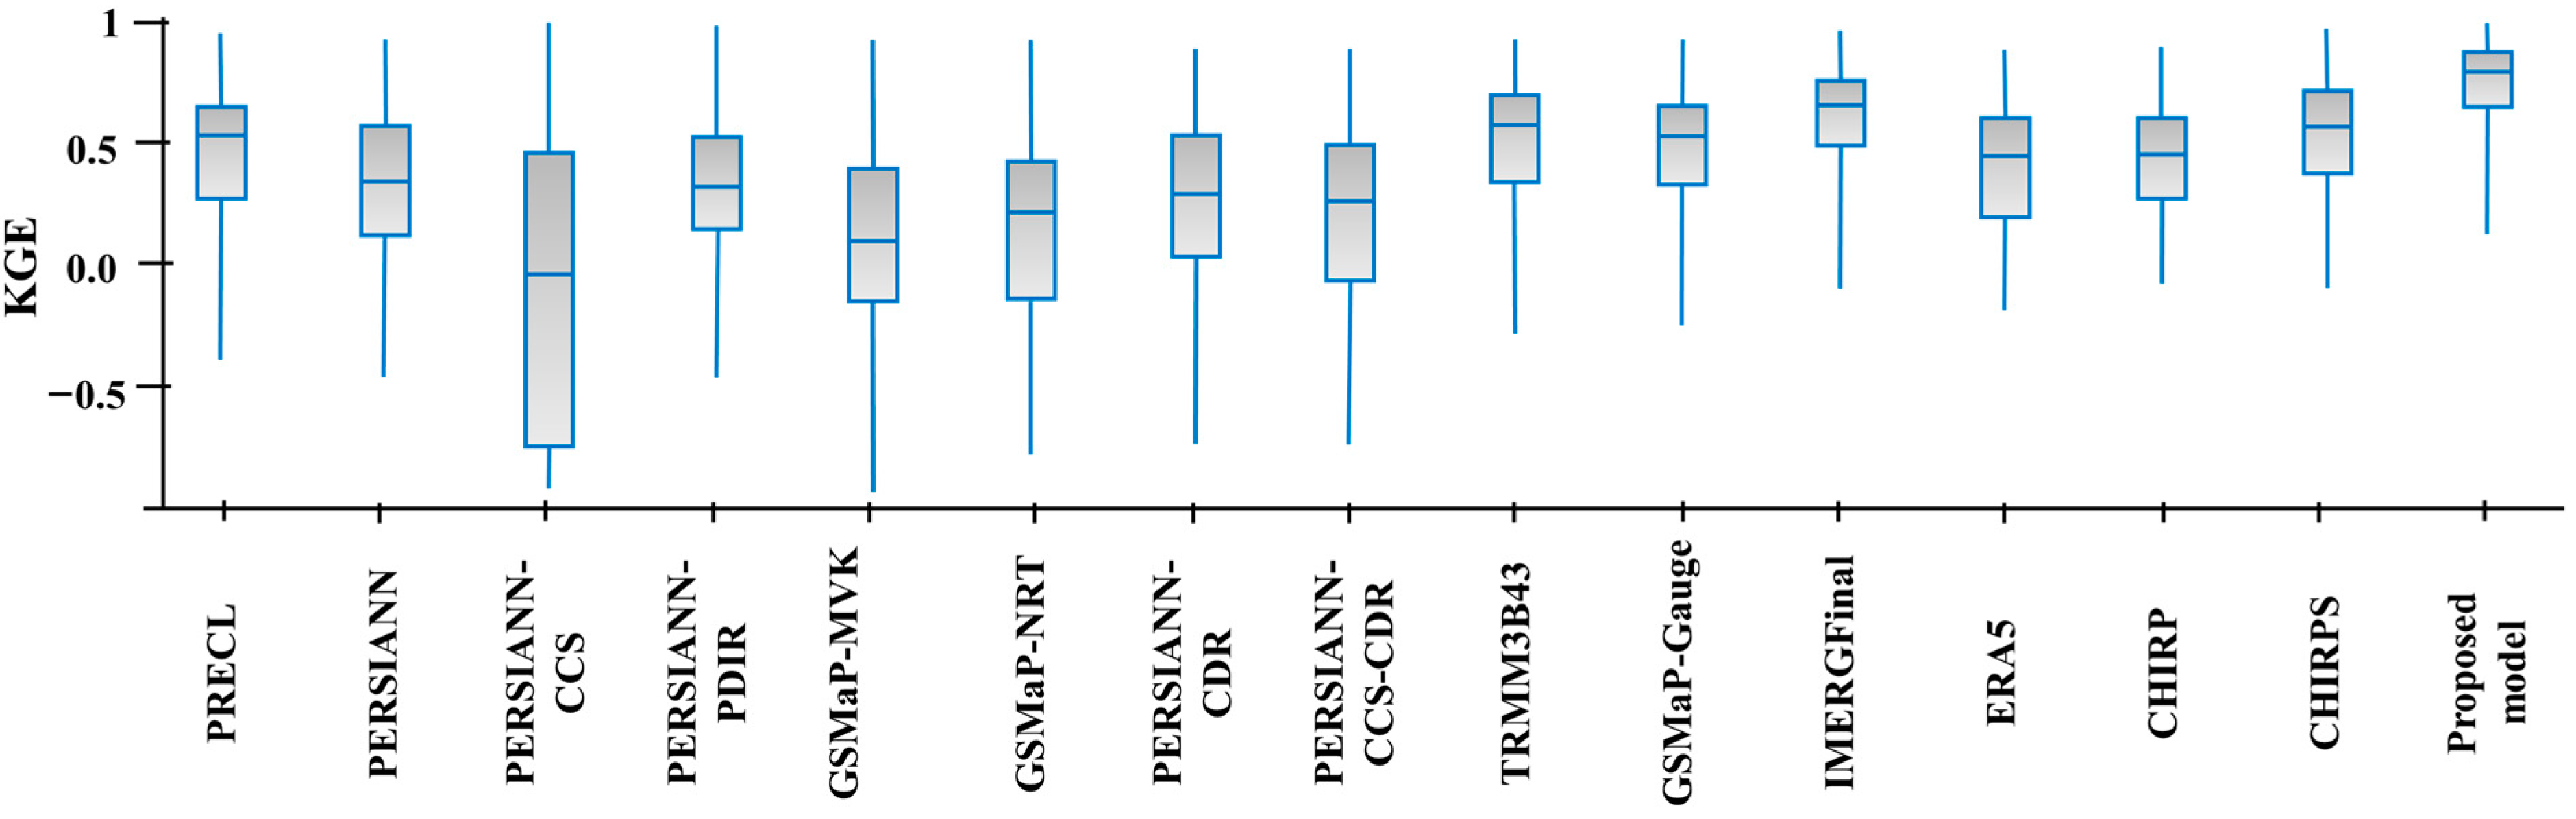
Figure 5 shows the KGE boxplot for precipitation products. The proposed product accuracy in estimating precipitation amounts was higher than the existing precipitation products. Also, the accuracy of the proposed product in pixels with different conditions was close to each other. This indicates that the accuracy of the proposed precipitation product is stable despite changes in geographical, climatic, and topographical conditions. Variations in KGE values of PERSIANN-CCS, GSMaP-MVK, PERSIANN-CCS-CDR and GSMaP-NRT products in different conditions were high, which indicates the low accuracy of these products.
4.3. Evaluate the Accuracy of Precipitation Products Based on a Point-to-Pixel Strategy
The accuracy evaluation results of different precipitation products based on the data of the validation stations were shown in Table 4. The lowest and highest RMSEs were for IMERGFinal and PERSIANN-CCS products, respectively. The average RMSE of precipitation products in the groups of gauge-based products, satellite-based products, gauge-corrected satellites, and reanalysis products are 19.5, 29.3, 22.1 and 22.3 mm/mo, respectively. Satellite-based products and gauge-based products groups have the lowest and highest accuracy, respectively. The RMSE value of the precipitation estimate based on the proposed method is 13.6. The results show higher accuracy of the proposed product than other products in precipitation estimation. Among PERSIANN family products, PERSIANN-CDR and PERSIANN-CCR products have the highest and lowest RMSE values, respectively. Evaluation based on the point-to-pixel strategy shows lower accuracy for existing precipitation products in precipitation estimation than the pixel-to-pixel strategy. Variability ratio values for all products are less than 1, which indicates a lower variation of precipitation values estimated by these products than the observed precipitation values. Rbias metric values indicate that the estimated precipitation values for PRECL, PERSIANN and GSMaP-Gauge products are lower than the observed precipitation values. Estimated precipitation values based on CHIRPS, PERSIANN-CCS, GSMaP-NRT and GSMaP-MVK are higher than other products and actual precipitation. KGE values calculated based on the point-to-pixel strategy are lower than the pixel-to-pixel strategy. In most precipitation products, the systematic error is greater than 0.5; however, the systematic error for PERSIANN-CDR, TRMM3B43, IMERGFinal, and ERA5 products is 0.35, 0.28, 0.30 and 0.37, respectively. The value of the systematic error for the results of the proposed product is 0.18, which indicates the high accuracy of the proposed product in estimating the amount of precipitation.
The spatial distribution of KGE at validation stations for the period 2003 to 2021 is shown in Figure 6. TRMM3B43, IMERG-Final, PRECL and GSMaP-Gauge have better accuracy than other products with KGE averages of 0.36, 0.38, 0.36 and 0.31, respectively. The results show that PERSIANN family products have low accuracy in precipitation estimation, among which PERSIANN-CCS is the weakest precipitation product, which has negative KGE values in many stations. ERA5 has relatively high accuracy in estimating precipitation, especially in the southwest regions. However, the accuracy of this precipitation product is low in the central regions. In general, the accuracy of different products in the northern and southwestern regions of Saudi Arabia, including Jabal Sawda, is higher than in other regions. The KGE values of all stations based on the proposed product are higher than 0. The average KGE of these stations based on the proposed method is 0.50, which indicates the high accuracy of the proposed product.
The KGE boxplot for precipitation products at the ground station scale is shown in Figure 7. The KGE range for IMERGFinal, GSMaP-Gauge, TRMM3B43, CHIRP, CHIRPS and PRECL products is lower than other products. The highest range of KGE values is for PERSIANN-CCS, PERSIANN-PDIR and GSMaP-NRT products. The median values of PRECL, TRMM3B43 and IMERGFinal products are 0.36, 0.39 and 0.43, respectively, which indicates the higher accuracy of these products than other precipitation products. The range of KGE values for the proposed product is much more limited than for other precipitation products. Also, the median KGE values for this product are 0.60.
5. Discussion
In this study, the accuracy of precipitation products under different conditions was evaluated. The point-to-pixel and pixel-to-pixel approaches were used to evaluate the accuracy of precipitation products [53,92]. The calculated accuracy values for different products, based on the pixel-to-pixel approach, were significantly higher than the point-to-pixel approach. However, database rankings based on two approaches showed the same results. Hence, two approaches can be used instead of each other to rank the dataset regardless of the values of the evaluation criteria. Saemian, et al. [16] also showed that the results of the accuracy of precipitation products evaluated on point-to-pixel and pixel-to-pixel strategies were consistent with each other. Only evaluations based on the pixel-to-pixel approach overestimated the skill of the datasets compared to the point-to-pixel approach.
The results of the accuracy assessment showed that the accuracy of existing precipitation products is different. IMERGFinal, TRMM3B43, and PRECL products had higher accuracy than other products. Moreover, the results demonstrated that systematic error is an important component of the total error in PERSIANN, PERSIANN-CCS, CHIRP and CHIRPs products. The findings of Prakash [14] confirmed this result. The evaluation results showed that the PERSIANN group products have different accuracy in estimating precipitation. For example, the PERSIANN product estimated the amount of precipitation to be less than the observed value, and the PERSIANN-CCS product estimated the amount of precipitation to be higher than the observed amount. Nguyen, et al. [13], in their study in the United States, showed that the PERSIANN-CCS product estimated the amount of precipitation more than the observed amount. The higher accuracy of the PERSIANN-CDR product indicated the importance of gauge-based adjustment to improve satellite observation [11,19].
Alternatively, the results of this study showed that the accuracy of gauge-based products is higher than satellite-based products and reanalysis products. Furthermore, the use of gauge-corrected satellite group data from ground stations can further improve the accuracy of these products [12,93]. Saemian, et al. [16] showed that reanalysis products outperform satellite-based products practically after gauge adjustment. In a number of previous studies, it was shown that the accuracy of reanalysis products in estimating precipitation in warm and dry regions is higher than other products [1,11,59]. Also, Xu, et al. [48] recently demonstrated that reanalysis products perform better than satellite-based products in North America, Europe, and Australia. Nonetheless, Chen, et al. [60] pointed out that satellite-based products perform better than reanalysis products.
Overall, the accuracy of existing precipitation products varies from region to region and depends on the type of precipitation, topography, and climatic factors [2]. This study also revealed that the accuracy was not constant under all conditions. Hosseini-Moghari, et al. [50] demonstrated that the accuracy of precipitation products varies under different climatic conditions and precipitation classes. Hence, in this study, to achieve a higher accuracy precipitation product, information obtained from different precipitation products, surface properties, and precipitation data recorded at ground stations was combined based on a machine learning algorithm. The random forest algorithm has a high ability to build complex relationships between dependent and independent variables [94,95]. Therefore, in this study, this algorithm was used as a machine learning algorithm. The results showed that the fusion of information related to the spatial distribution of precipitation obtained from different sources improved the accuracy of precipitation estimation. The basic principle of the proposed method is to use the capabilities and advantages of different existing precipitation products and surface characteristics. This will enable production of a new and more accurate precipitation product. Ahmed, et al. [5] showed that combining the results of several products can improve the accuracy of precipitation estimation. The importance degree of each of the dependent variables in increasing the accuracy of precipitation estimation is different. Qureshi, et al. [10] reported that the use of elevation and latitude parameters as correction factors increases the accuracy of precipitation estimation.
This study represents a comprehensive evaluation of almost all available satellite-based products over Saudi Arabia, discussing their strengths, weaknesses, and spatiotemporal discrepancies. Previous studies highlighted the discrepancy in comparisons between precipitation estimates from region to region [12,16,19,28]. Our findings in the context of comparing the accuracy of different precipitation products only pertain to Saudi Arabia and are not necessarily transferable to other regions. However, the method proposed in this study to prepare a more accurate precipitation product is not limited to a specific place or time. It can be used in all regions and at all times. However, this study has limitations. The spatial resolution difference of precipitation products with each other and with the spatial resolution of other independent variables including elevation, LST, and SWI is one of the important limitations in the process of evaluating the accuracy of precipitation products and the new product. The time difference between precipitation data from precipitation products and those recorded at the ground station is another limitation of the study. Also, one of the limitations of the proposed method is the higher required processing volume and time to prepare a more accurate precipitation product than other products. Nevertheless, higher volumes and longer processing times are necessary for better accuracy in estimating precipitation amounts.
6. Conclusions
Evaluating the accuracy of precipitation products in different conditions is of great importance. The results of this study showed that, in general, the accuracy of gauge-based products is higher than other groups, including satellite-based products and reanalysis products. However, the accuracy of different products in various climatic, topographic, and geographical conditions is varied. Therefore, in order to achieve a product with stable accuracy in different conditions, a combination of existing precipitation products with ancillary information obtained from other sources was proposed. On a study area scale, among precipitation products, IMERGFinal, TRMM3B43, PERSIANN-CDR, ERA5, PERSIANN-CCS-CDR and GSMaP-Gauge were the most important variables in the production of the proposed precipitation product. The importance degree of the precipitation interpolation product was greater than the surface biophysical and topography characteristics. Among the biophysical characteristics, the importance degree of SWI was higher than LST and Elevation. According to the results, the proposed product is more accurate at estimating precipitation than existing precipitation products. We found that a point-to-pixel assessment understated the quality of datasets when compared to a pixel-to-pixel evaluation. The ordering of products, however, was the same in both approaches. The findings of this study can be utilized to help determine which precipitation dataset to employ for a certain application.
Author Contributions
M.E.A. and S.Q. conceived and designed the research of the first draft, and wrote the first draft; M.E.A. and S.Q. re-designed the research, revised and edited the paper. All authors have read and agreed to the published version of the manuscript.
Funding
This research work was funded by Institutional Fund Projects under grant no. (IFPDP-241-22).
Data Availability Statement
The data used to support the findings of this study are available from the corresponding author upon reasonable request.
Acknowledgments
The authors gratefully acknowledge technical and financial support from Ministry of Education and Deanship of Scientific Research (DSR), King Abdulaziz University (KAU), Jeddah, Saudi Arabia.
Conflicts of Interest
The authors declare no conflict of interest.
References
- Salman, S.A.; Shahid, S.; Ismail, T.; Al-Abadi, A.M.; Wang, X.-J.; Chung, E.-S. Selection of gridded precipitation data for Iraq using compromise programming. Measurement 2019, 132, 87–98. [Google Scholar] [CrossRef]
- Seyyedi, H.; Anagnostou, E.N.; Beighley, E.; McCollum, J. Hydrologic evaluation of satellite and reanalysis precipitation datasets over a mid-latitude basin. Atmos. Res. 2015, 164, 37–48. [Google Scholar] [CrossRef]
- Sheffield, J.; Goteti, G.; Wood, E.F. Development of a 50-year high-resolution global dataset of meteorological forcings for land surface modeling. J. Clim. 2006, 19, 3088–3111. [Google Scholar] [CrossRef] [Green Version]
- Sun, W.; Ma, J.; Yang, G.; Li, W. Statistical and hydrological evaluations of multi-satellite precipitation products over Fujiang river basin in humid southeast China. Remote Sens. 2018, 10, 1898. [Google Scholar] [CrossRef] [Green Version]
- Ahmed, K.; Sachindra, D.; Shahid, S.; Iqbal, Z.; Nawaz, N.; Khan, N. Multi-model ensemble predictions of precipitation and temperature using machine learning algorithms. Atmos. Res. 2020, 236, 104806. [Google Scholar] [CrossRef]
- Zhan, Y.; Ren, G.; Yang, S. Change in precipitation over the Asian continent from 1901-2016 based on a new multi-source dataset. Clim. Res. 2018, 76, 41–57. [Google Scholar] [CrossRef]
- Zhou, Y.; Nelson, K.; Mohr, K.I.; Huffman, G.J.; Levy, R.; Grecu, M. A spatial-temporal extreme precipitation database from GPM IMERG. J. Geophys. Res. Atmos. 2019, 124, 10344–10363. [Google Scholar] [CrossRef]
- Guo, B.; Zhang, J.; Xu, T.; Croke, B.; Jakeman, A.; Song, Y.; Yang, Q.; Lei, X.; Liao, W. Applicability assessment and uncertainty analysis of multi-precipitation datasets for the simulation of hydrologic models. Water 2018, 10, 1611. [Google Scholar] [CrossRef] [Green Version]
- Chen, S.; Xiong, L.; Ma, Q.; Kim, J.-S.; Chen, J.; Xu, C.-Y. Improving daily spatial precipitation estimates by merging gauge observation with multiple satellite-based precipitation products based on the geographically weighted ridge regression method. J. Hydrol. 2020, 589, 125156. [Google Scholar] [CrossRef]
- Qureshi, S.; Koohpayma, J.; Firozjaei, M.K.; Kakroodi, A.A. Evaluation of Seasonal, Drought, and Wet Condition Effects on Performance of Satellite-Based Precipitation Data over Different Climatic Conditions in Iran. Remote Sens. 2021, 14, 76. [Google Scholar] [CrossRef]
- Satgé, F.; Defrance, D.; Sultan, B.; Bonnet, M.-P.; Seyler, F.; Rouche, N.; Pierron, F.; Paturel, J.-E. Evaluation of 23 gridded precipitation datasets across West Africa. J. Hydrol. 2020, 581, 124412. [Google Scholar] [CrossRef] [Green Version]
- Sun, Q.; Miao, C.; Duan, Q.; Ashouri, H.; Sorooshian, S.; Hsu, K.L. A review of global precipitation data sets: Data sources, estimation, and intercomparisons. Rev. Geophys. 2018, 56, 79–107. [Google Scholar] [CrossRef] [Green Version]
- Nguyen, P.; Ombadi, M.; Sorooshian, S.; Hsu, K.; AghaKouchak, A.; Braithwaite, D.; Ashouri, H.; Thorstensen, A.R. The PERSIANN family of global satellite precipitation data: A review and evaluation of products. Hydrol. Earth Syst. Sci. 2018, 22, 5801–5816. [Google Scholar] [CrossRef] [Green Version]
- Prakash, S. Performance assessment of CHIRPS, MSWEP, SM2RAIN-CCI, and TMPA precipitation products across India. J. Hydrol. 2019, 571, 50–59. [Google Scholar] [CrossRef]
- Sharifi, E.; Steinacker, R.; Saghafian, B. Assessment of GPM-IMERG and other precipitation products against gauge data under different topographic and climatic conditions in Iran: Preliminary results. Remote Sens. 2016, 8, 135. [Google Scholar] [CrossRef] [Green Version]
- Saemian, P.; Hosseini-Moghari, S.-M.; Fatehi, I.; Shoarinezhad, V.; Modiri, E.; Tourian, M.J.; Tang, Q.; Nowak, W.; Bárdossy, A.; Sneeuw, N. Comprehensive evaluation of precipitation datasets over Iran. J. Hydrol. 2021, 603, 127054. [Google Scholar] [CrossRef]
- Yuan, F.; Zhang, L.; Soe, K.M.W.; Ren, L.; Zhao, C.; Zhu, Y.; Jiang, S.; Liu, Y. Applications of TRMM-and GPM-era multiple-satellite precipitation products for flood simulations at sub-daily scales in a sparsely gauged watershed in Myanmar. Remote Sens. 2019, 11, 140. [Google Scholar] [CrossRef] [Green Version]
- Eini, M.R.; Olyaei, M.A.; Kamyab, T.; Teymoori, J.; Brocca, L.; Piniewski, M. Evaluating three non-gauge-corrected satellite precipitation estimates by a regional gauge interpolated dataset over Iran. J. Hydrol. Reg. Stud. 2021, 38, 100942. [Google Scholar] [CrossRef]
- Beck, H.E.; Pan, M.; Roy, T.; Weedon, G.P.; Pappenberger, F.; Van Dijk, A.I.; Huffman, G.J.; Adler, R.F.; Wood, E.F. Daily evaluation of 26 precipitation datasets using Stage-IV gauge-radar data for the CONUS. Hydrol. Earth Syst. Sci. 2019, 23, 207–224. [Google Scholar] [CrossRef] [Green Version]
- Firozjaei, M.K.; Sedighi, A.; Firozjaei, H.K.; Kiavarz, M.; Homaee, M.; Arsanjani, J.J.; Makki, M.; Naimi, B.; Alavipanah, S.K. A historical and future impact assessment of mining activities on surface biophysical characteristics change: A remote sensing-based approach. Ecol. Indic. 2021, 122, 107264. [Google Scholar] [CrossRef]
- Weng, Q.; Firozjaei, M.K.; Sedighi, A.; Kiavarz, M.; Alavipanah, S.K. Statistical analysis of surface urban heat island intensity variations: A case study of Babol city, Iran. GISci. Remote Sens. 2019, 56, 576–604. [Google Scholar] [CrossRef]
- Valjarević, A.; Morar, C.; Živković, J.; Niemets, L.; Kićović, D.; Golijanin, J.; Gocić, M.; Bursać, N.M.; Stričević, L.; Žiberna, I. Long term monitoring and connection between topography and cloud cover distribution in Serbia. Atmosphere 2021, 12, 964. [Google Scholar] [CrossRef]
- Firozjaei, M.K.; Kiavarz, M.; Alavipanah, S.K.; Lakes, T.; Qureshi, S. Monitoring and forecasting heat island intensity through multi-temporal image analysis and cellular automata-Markov chain modelling: A case of Babol city, Iran. Ecol. Indic. 2018, 91, 155–170. [Google Scholar] [CrossRef]
- Firozjaei, M.K.; Kiavarz, M.; Homaee, M.; Arsanjani, J.J.; Alavipanah, S.K. A novel method to quantify urban surface ecological poorness zone: A case study of several European cities. Sci. Total Environ. 2021, 757, 143755. [Google Scholar] [CrossRef] [PubMed]
- Boloorani, A.D.; Kazemi, Y.; Sadeghi, A.; Shorabeh, S.N.; Argany, M. Identification of dust sources using long term satellite and climatic data: A case study of Tigris and Euphrates basin. Atmos. Environ. 2020, 224, 117299. [Google Scholar] [CrossRef]
- Schmugge, T.J.; Kustas, W.P.; Ritchie, J.C.; Jackson, T.J.; Rango, A. Remote sensing in hydrology. Adv. Water Resour. 2002, 25, 1367–1385. [Google Scholar] [CrossRef]
- Schultz, G.A.; Engman, E.T. Remote Sensing in Hydrology and Water Management; Springer Science & Business Media: Berlin, Germany, 2012. [Google Scholar]
- Liu, J.; Duan, Z.; Jiang, J.; Zhu, A. Evaluation of three satellite precipitation products TRMM 3B42, CMORPH, and PERSIANN over a subtropical watershed in China. Adv. Meteorol. 2015, 2015, 151239. [Google Scholar] [CrossRef] [Green Version]
- Moghaddam, M.H.R.; Sedighi, A.; Fayyazi, M.A. Applying MNDWI index and linear directional mean analysis for morphological changes in the Zarriné-Rūd River. Arab. J. Geosci. 2015, 8, 8419–8428. [Google Scholar] [CrossRef]
- Calera, A.; Campos, I.; Osann, A.; D’Urso, G.; Menenti, M. Remote sensing for crop water management: From ET modelling to services for the end users. Sensors 2017, 17, 1104. [Google Scholar] [CrossRef] [Green Version]
- Fathololoumi, S.; Vaezi, A.R.; Firozjaei, M.K.; Biswas, A. Quantifying the effect of surface heterogeneity on soil moisture across regions and surface characteristic. J. Hydrol. 2021, 596, 126132. [Google Scholar] [CrossRef]
- Fathololoumi, S.; Firozjaei, M.K.; Biswas, A. Improving spatial resolution of satellite soil water index (SWI) maps under clear-sky conditions using a machine learning approach. J. Hydrol. 2022, 615, 128709. [Google Scholar] [CrossRef]
- Firozjaei, M.K.; Daryaei, I.; Sedighi, A.; Weng, Q.; Alavipanah, S.K. Homogeneity Distance Classification Algorithm (HDCA): A Novel Algorithm for Satellite Image Classification. Remote Sens. 2019, 11, 546. [Google Scholar] [CrossRef] [Green Version]
- Fathololoumi, S.; Firozjaei, M.K.; Li, H.; Biswas, A. Surface biophysical features fusion in remote sensing for improving land crop/cover classification accuracy. Sci. Total Environ. 2022, 838, 156520. [Google Scholar] [CrossRef] [PubMed]
- Firozjaei, M.K.; Sedighi, A.; Jelokhani-Niaraki, M. An urban growth simulation model based on integration of local weights and decision risk values. Trans. GIS 2020, 24, 1695–1721. [Google Scholar] [CrossRef]
- Dadras, M.; Shafri, H.Z.; Ahmad, N.; Pradhan, B.; Safarpour, S. Spatio-temporal analysis of urban growth from remote sensing data in Bandar Abbas city, Iran. Egypt. J. Remote Sens. Space Sci. 2015, 18, 35–52. [Google Scholar] [CrossRef] [Green Version]
- Kiavarz, M.; Hosseinbeigi, S.B.; Mijani, N.; Shahsavary, M.S.; Firozjaei, M.K. Predicting spatial and temporal changes in surface urban heat islands using multi-temporal satellite imagery: A case study of Tehran metropolis. Urban Clim. 2022, 45, 101258. [Google Scholar] [CrossRef]
- Coutts, A.M.; Harris, R.J.; Phan, T.; Livesley, S.J.; Williams, N.S.; Tapper, N.J. Thermal infrared remote sensing of urban heat: Hotspots, vegetation, and an assessment of techniques for use in urban planning. Remote Sens Env. 2016, 186, 637–651. [Google Scholar] [CrossRef]
- Mijani, N.; Firozjaei, M.K.; Mijani, M.; Khodabakhshi, A.; Qureshi, S.; Arsanjani, J.J.; Alavipanah, S.K. Exploring the effect of COVID-19 pandemic lockdowns on urban cooling: A tale of three cities. Adv. Space Res. 2022, in press. [Google Scholar] [CrossRef]
- Mijani, N.; Alavipanah, S.K.; Firozjaei, M.K.; Arsanjani, J.J.; Hamzeh, S.; Weng, Q. Modeling outdoor thermal comfort using satellite imagery: A principle component analysis-based approach. Ecol. Indic. 2020, 117, 106555. [Google Scholar] [CrossRef]
- Qureshi, S.; Alavipanah, S.K.; Konyushkova, M.; Mijani, N.; Fathololomi, S.; Firozjaei, M.K.; Homaee, M.; Hamzeh, S.; Kakroodi, A.A. A Remotely Sensed Assessment of Surface Ecological Change over the Gomishan Wetland, Iran. Remote Sens. 2020, 12, 2989. [Google Scholar] [CrossRef]
- Firozjaei, M.K.; Fathololoumi, S.; Kiavarz, M.; Biswas, A.; Homaee, M.; Alavipanah, S.K. Land Surface Ecological Status Composition Index (LSESCI): A novel remote sensing-based technique for modeling land surface ecological status. Ecol. Indic. 2021, 123, 107375. [Google Scholar] [CrossRef]
- Hu, X.; Xu, H. A new remote sensing index for assessing the spatial heterogeneity in urban ecological quality: A case from Fuzhou City, China. Ecol. Indic. 2018, 89, 11–21. [Google Scholar] [CrossRef]
- Firozjaei, M.K.; Alavipanah, S.K.; Liu, H.; Sedighi, A.; Mijani, N.; Kiavarz, M.; Weng, Q. A PCA–OLS Model for Assessing the Impact of Surface Biophysical Parameters on Land Surface Temperature Variations. Remote Sens. 2019, 11, 2094. [Google Scholar] [CrossRef] [Green Version]
- Shorabeh, S.N.; Kakroodi, A.A.; Firozjaei, M.K.; Minaei, F.; Homaee, M. Impact Assessment Modeling of Climatic Conditions on Spatial-temporal Changes in Surface Biophysical Properties Driven by Urban Physical Expansion Using Satellite Images. Sustain. Cities Soc. 2022, 80, 103757. [Google Scholar] [CrossRef]
- Moghaddam, M.H.R.; Sedighi, A.; Fasihi, S.; Firozjaei, M.K. Effect of environmental policies in combating aeolian desertification over Sejzy Plain of Iran. Aeolian Res. 2018, 35, 19–28. [Google Scholar] [CrossRef]
- Trinh-Tuan, L.; Matsumoto, J.; Ngo-Duc, T.; Nodzu, M.I.; Inoue, T. Evaluation of satellite precipitation products over Central Vietnam. Prog. Earth Planet. Sci. 2019, 6, 54. [Google Scholar] [CrossRef] [Green Version]
- Xu, L.; Chen, N.; Moradkhani, H.; Zhang, X.; Hu, C. Improving global monthly and daily precipitation estimation by fusing gauge observations, remote sensing, and reanalysis data sets. Water Resour. Res. 2020, 56, e2019WR026444. [Google Scholar] [CrossRef]
- Ghozat, A.; Sharafati, A.; Hosseini, S.A. Long-term spatiotemporal evaluation of CHIRPS satellite precipitation product over different climatic regions of Iran. Theor. Appl. Climatol. 2021, 143, 211–225. [Google Scholar] [CrossRef]
- Hosseini-Moghari, S.-M.; Tang, Q. Validation of GPM IMERG V05 and V06 precipitation products over Iran. J. Hydrometeorol. 2020, 21, 1011–1037. [Google Scholar] [CrossRef] [Green Version]
- Liu, C.-Y.; Aryastana, P.; Liu, G.-R.; Huang, W.-R. Assessment of satellite precipitation product estimates over Bali Island. Atmos. Res. 2020, 244, 105032. [Google Scholar] [CrossRef]
- Hsu, K.-l.; Gao, X.; Sorooshian, S.; Gupta, H.V. Precipitation estimation from remotely sensed information using artificial neural networks. J. Appl. Meteorol. Climatol. 1997, 36, 1176–1190. [Google Scholar] [CrossRef]
- Peng, F.; Zhao, S.; Chen, C.; Cong, D.; Wang, Y.; Ouyang, H. Evaluation and comparison of the precipitation detection ability of multiple satellite products in a typical agriculture area of China. Atmos. Res. 2020, 236, 104814. [Google Scholar] [CrossRef]
- Satgé, F.; Ruelland, D.; Bonnet, M.-P.; Molina, J.; Pillco, R. Consistency of satellite-based precipitation products in space and over time compared with gauge observations and snow-hydrological modelling in the Lake Titicaca region. Hydrol. Earth Syst. Sci. 2019, 23, 595–619. [Google Scholar] [CrossRef] [Green Version]
- Yamamoto, M.K.; Shige, S.; Yu, C.-K.; Cheng, L.-W. Further improvement of the heavy orographic rainfall retrievals in the GSMaP algorithm for microwave radiometers. J. Appl. Meteorol. Climatol. 2017, 56, 2607–2619. [Google Scholar] [CrossRef]
- Taghizadeh, E.; Ahmadi-Givi, F.; Brocca, L.; Sharifi, E. Evaluation of satellite/reanalysis precipitation products over Iran. Int. J. Remote Sens. 2021, 42, 3474–3497. [Google Scholar] [CrossRef]
- Tekeli, A.E.; Fouli, H. Evaluation of TRMM satellite-based precipitation indexes for flood forecasting over Riyadh City, Saudi Arabia. J. Hydrol. 2016, 541, 471–479. [Google Scholar] [CrossRef]
- Ceccherini, G.; Ameztoy, I.; Hernández, C.P.R.; Moreno, C.C. High-resolution precipitation datasets in South America and West Africa based on satellite-derived rainfall, enhanced vegetation index and digital elevation model. Remote Sens. 2015, 7, 6454–6488. [Google Scholar] [CrossRef] [Green Version]
- Basheer, M.; Elagib, N.A. Performance of satellite-based and GPCC 7.0 rainfall products in an extremely data-scarce country in the Nile Basin. Atmos. Res. 2019, 215, 128–140. [Google Scholar] [CrossRef]
- Chen, A.; Chen, D.; Azorin-Molina, C. Assessing reliability of precipitation data over the Mekong River Basin: A comparison of ground-based, satellite, and reanalysis datasets. Int. J. Climatol. 2018, 38, 4314–4334. [Google Scholar] [CrossRef]
- Chen, J.; Wang, Z.; Wu, X.; Chen, X.; Lai, C.; Zeng, Z.; Li, J. Accuracy evaluation of GPM multi-satellite precipitation products in the hydrological application over alpine and gorge regions with sparse rain gauge network. Hydrol. Res. 2019, 50, 1710–1729. [Google Scholar] [CrossRef]
- Li, C.; Tang, G.; Hong, Y. Cross-evaluation of ground-based, multi-satellite and reanalysis precipitation products: Applicability of the Triple Collocation method across Mainland China. J. Hydrol. 2018, 562, 71–83. [Google Scholar] [CrossRef]
- Huang, J.C.; Yu, C.K.; Lee, J.Y.; Cheng, L.W.; Lee, T.Y.; Kao, S.J. Linking typhoon tracks and spatial rainfall patterns for improving flood lead time predictions over a mesoscale mountainous watershed. Water Resour. Res. 2012, 48. [Google Scholar] [CrossRef]
- Todini, E. A Bayesian technique for conditioning radar precipitation estimates to rain-gauge measurements. Hydrol. Earth Syst. Sci. 2001, 5, 187–199. [Google Scholar] [CrossRef] [Green Version]
- Xiao, S.; Xia, J.; Zou, L. Evaluation of multi-satellite precipitation products and their ability in capturing the characteristics of extreme climate events over the Yangtze River Basin, China. Water 2020, 12, 1179. [Google Scholar] [CrossRef] [Green Version]
- Joyce, R.J.; Janowiak, J.E.; Arkin, P.A.; Xie, P. CMORPH: A method that produces global precipitation estimates from passive microwave and infrared data at high spatial and temporal resolution. J. Hydrometeorol. 2004, 5, 487–503. [Google Scholar] [CrossRef]
- Huffman, G.J.; Bolvin, D.T.; Nelkin, E.J.; Wolff, D.B.; Adler, R.F.; Gu, G.; Hong, Y.; Bowman, K.P.; Stocker, E.F. The TRMM multisatellite precipitation analysis (TMPA): Quasi-global, multiyear, combined-sensor precipitation estimates at fine scales. J. Hydrometeorol. 2007, 8, 38–55. [Google Scholar] [CrossRef]
- Turk, J.T.; Mostovoy, G.V.; Anantharaj, V. The NRL-blend high resolution precipitation product and its application to land surface hydrology. In Satellite Rainfall Applications for Surface Hydrology; Springer: Berlin/Heidelberg, Germany, 2010; pp. 85–104. [Google Scholar]
- Huffman, G.J.; Bolvin, D.T.; Braithwaite, D.; Hsu, K.; Joyce, R.; Xie, P.; Yoo, S.-H. NASA global precipitation measurement (GPM) integrated multi-satellite retrievals for GPM (IMERG). Algorithm Theor. Basis Doc. (ATBD) Version 2015, 4, 26. [Google Scholar]
- Hasanean, H.; Almazroui, M. Rainfall: Features and variations over Saudi Arabia, a review. Climate 2015, 3, 578–626. [Google Scholar] [CrossRef] [Green Version]
- Al-Zahrani, M.; Husain, T. An algorithm for designing a precipitation network in the south-western region of Saudi Arabia. J. Hydrol. 1998, 205, 205–216. [Google Scholar] [CrossRef]
- Hag-elsafi, S.; El-Tayib, M. Spatial and statistical analysis of rainfall in the Kingdom of Saudi Arabia from 1979 to 2008. Weather 2016, 71, 262–266. [Google Scholar] [CrossRef]
- ŞEN, Z.; Al-Suba’i, K. Hydrological considerations for dam siting in arid regions: A Saudi Arabian study. Hydrol. Sci. J. 2002, 47, 173–186. [Google Scholar] [CrossRef]
- Keys, R. Cubic convolution interpolation for digital image processing. IEEE Trans. Acoust. Speech Signal Process. 1981, 29, 1153–1160. [Google Scholar] [CrossRef] [Green Version]
- Chen, M.; Xie, P.; Janowiak, J.E.; Arkin, P.A. Global land precipitation: A 50-yr monthly analysis based on gauge observations. J. Hydrometeorol. 2002, 3, 249–266. [Google Scholar] [CrossRef]
- Sorooshian, S.; Hsu, K.-L.; Gao, X.; Gupta, H.V.; Imam, B.; Braithwaite, D. Evaluation of PERSIANN system satellite-based estimates of tropical rainfall. Bull. Am. Meteorol. Soc. 2000, 81, 2035–2046. [Google Scholar] [CrossRef]
- Nguyen, P.; Ombadi, M.; Gorooh, V.A.; Shearer, E.J.; Sadeghi, M.; Sorooshian, S.; Hsu, K.; Bolvin, D.; Ralph, M.F. Persiann dynamic infrared–rain rate (PDIR-now): A near-real-time, quasi-global satellite precipitation dataset. J. Hydrometeorol. 2020, 21, 2893–2906. [Google Scholar] [CrossRef]
- Ushio, T.; Sasashige, K.; Kubota, T.; Shige, S.; Okamoto, K.i.; Aonashi, K.; Inoue, T.; Takahashi, N.; Iguchi, T.; Kachi, M. A Kalman filter approach to the Global Satellite Mapping of Precipitation (GSMaP) from combined passive microwave and infrared radiometric data. J. Meteorol. Soc. Japan Ser. II 2009, 87, 137–151. [Google Scholar] [CrossRef] [Green Version]
- Tashima, T.; Kubota, T.; Mega, T.; Ushio, T.; Oki, R. Precipitation extremes monitoring using the near-real-time GSMaP product. IEEE J. Sel. Top. Appl. Earth Obs. Remote Sens. 2020, 13, 5640–5651. [Google Scholar] [CrossRef]
- Ashouri, H.; Hsu, K.-L.; Sorooshian, S.; Braithwaite, D.K.; Knapp, K.R.; Cecil, L.D.; Nelson, B.R.; Prat, O.P. PERSIANN-CDR: Daily precipitation climate data record from multisatellite observations for hydrological and climate studies. Bull. Am. Meteorol. Soc. 2015, 96, 69–83. [Google Scholar] [CrossRef] [Green Version]
- Sadeghi, M.; Lee, J.; Nguyen, P.; Hsu, K.; Sorooshian, S.; Braithwaite, D. Precipitation Estimation from Remotely Sensed Information using Artificial Neural Networks-Cloud Classification System-Climate Data Record (PERSIANN-CCS-CDR). In Proceedings of the AGU Fall Meeting Abstracts, San Francisco, CA, USA, 13 December 2019; p. H13P-1964. [Google Scholar]
- Hersbach, H.; Bell, B.; Berrisford, P.; Hirahara, S.; Horányi, A.; Muñoz-Sabater, J.; Nicolas, J.; Peubey, C.; Radu, R.; Schepers, D. The ERA5 global reanalysis. Q. J. R. Meteorol. Soc. 2020, 146, 1999–2049. [Google Scholar] [CrossRef]
- Funk, C.; Peterson, P.; Landsfeld, M.; Pedreros, D.; Verdin, J.; Shukla, S.; Husak, G.; Rowland, J.; Harrison, L.; Hoell, A. The climate hazards infrared precipitation with stations—A new environmental record for monitoring extremes. Sci. Data 2015, 2, 150066. [Google Scholar] [CrossRef] [Green Version]
- Xie, P.; Xiong, A.Y. A conceptual model for constructing high-resolution gauge-satellite merged precipitation analyses. J. Geophys. Res. Atmos. 2011, 116. [Google Scholar] [CrossRef]
- Hu, Q.; Yang, D.; Li, Z.; Mishra, A.K.; Wang, Y.; Yang, H. Multi-scale evaluation of six high-resolution satellite monthly rainfall estimates over a humid region in China with dense rain gauges. Int. J. Remote Sens. 2014, 35, 1272–1294. [Google Scholar] [CrossRef]
- Goovaerts, P. Geostatistical approaches for incorporating elevation into the spatial interpolation of rainfall. J. Hydrol. 2000, 228, 113–129. [Google Scholar] [CrossRef]
- Lebrenz, H.; Bárdossy, A. Geostatistical interpolation by quantile kriging. Hydrol. Earth Syst. Sci. 2019, 23, 1633–1648. [Google Scholar] [CrossRef] [Green Version]
- Wackernagel, H. Multivariate Geostatistics: An Introduction with Applications; Springer Science & Business Media: New York, NY, USA, 2003. [Google Scholar]
- Liao, K.; Lai, X.; Liu, Y.; Zhu, Q. Uncertainty analysis in near-surface soil moisture estimation on two typical land-use hillslopes. J. Soils Sediments 2016, 16, 2059–2071. [Google Scholar] [CrossRef]
- Fathololoumi, S.; Vaezi, A.R.; Alavipanah, S.K.; Ghorbani, A.; Biswas, A. Comparison of spectral and spatial-based approaches for mapping the local variation of soil moisture in a semi-arid mountainous area. Sci. Total Environ. 2020, 724, 138319. [Google Scholar] [CrossRef]
- Adhikary, S.K.; Muttil, N.; Yilmaz, A.G. Genetic programming-based ordinary kriging for spatial interpolation of rainfall. J. Hydrol. Eng. 2016, 21, 04015062. [Google Scholar] [CrossRef]
- Xu, R.; Tian, F.; Yang, L.; Hu, H.; Lu, H.; Hou, A. Ground validation of GPM IMERG and TRMM 3B42V7 rainfall products over southern Tibetan Plateau based on a high-density rain gauge network. J. Geophys. Res. Atmos. 2017, 122, 910–924. [Google Scholar] [CrossRef]
- Krakauer, N.Y.; Lakhankar, T.; Dars, G.H. Precipitation trends over the Indus basin. Climate 2019, 7, 116. [Google Scholar] [CrossRef] [Green Version]
- Firozjaei, M.K.; Fathololoumi, S.; Alavipanah, S.K.; Kiavarz, M.; Vaezi, A.R.; Biswas, A. A new approach for modeling near surface temperature lapse rate based on normalized land surface temperature data. Remote Sens. Env. 2020, 242, 111746. [Google Scholar] [CrossRef]
- Bartkowiak, P.; Castelli, M.; Notarnicola, C. Downscaling Land Surface Temperature from MODIS Dataset with Random Forest Approach over Alpine Vegetated Areas. Remote Sens. 2019, 11, 1319. [Google Scholar] [CrossRef]
Figure 1.
Maps of: (a) digital elevation model of the study area and spatial distribution of (b) gauge stations used in interpolation-based precipitation map generation; (c) gauge stations used in calibration of the proposed method; and (d) gauge stations used in accuracy evaluation of existing products and proposed method in precipitation estimation.

Figure 2.
Conceptual framework of the study.

Figure 3.
The importance degree of the independent variables in improving the accuracy of precipitation estimation.
Figure 3.
The importance degree of the independent variables in improving the accuracy of precipitation estimation.

Figure 4.
Spatial distribution of KGE for the precipitation datasets. The KGE values are computed at each pixel within 2003–2021 based on the precipitation map obtained from interpolation method.
Figure 4.
Spatial distribution of KGE for the precipitation datasets. The KGE values are computed at each pixel within 2003–2021 based on the precipitation map obtained from interpolation method.

Figure 5.
Box-plot of KGE values for the study area within 2003–2021 obtained from pixel-to-pixel assessment strategy.
Figure 5.
Box-plot of KGE values for the study area within 2003–2021 obtained from pixel-to-pixel assessment strategy.

Figure 6.
Spatial distribution of KGE for the precipitation datasets in geographical location of validation stations based on point-to-pixel strategy.
Figure 6.
Spatial distribution of KGE for the precipitation datasets in geographical location of validation stations based on point-to-pixel strategy.

Figure 7.
Boxplot of KGE values for the study area within 2003–2021 obtained from point to pixel assessment strategy.
Figure 7.
Boxplot of KGE values for the study area within 2003–2021 obtained from point to pixel assessment strategy.


Table 1.
Details of used existing precipitation products in this study.
| Dataset | Data Source | Spatial Resolution | Temporal Resolution | Spatial Coverage | Temporal Coverage | References |
|---|---|---|---|---|---|---|
| PRECL | Gauge-Based Products | 0.5° × 0.5° | 1 mo | Global land | 1948–present | [75] |
| PERSIANN | Satellite-Based Products | 0.25° × 0.25° | 1, 3, 6 h/1 d | 60°S–60°N | 2000–present | [52] |
| PERSIANN-CCS | 0.04° × 0.04° | 1, 3, 6 h/1 d | 60°S–60°N | 2003–present | [76] | |
| PERSIANN-PDIR | 0.04° × 0.04° | 1, 3, 6 h/1 d | 60°S–60°N | 2000–present | [77] | |
| GSMaP-MVK | 0.1° × 0.1° | 1 h/1 d | 60°S–60°N | 2000–present | [78] | |
| GSMaP-NRT | 0.1° × 0.1° | 1 h/1 d | 60°S–60°N | 2000–present | [79] | |
| PERSIANN-CDR | Gauge corrected satellites | 0.25° × 0.25° | 1 d/1 mo | 60°S–60°N | 1983-present | [80] |
| PERSIANN-CCS-CDR | 0.04° × 0.04° | 3, 6 h/1 d | 60°S–60°N | 1983–present | [81] | |
| TRMM3B43 | 0.25° × 0.25° | 3 h/1 d | 50°S–50°N | 1998–present | [67] | |
| GSMaP-Gauge | 0.1° × 0.1° | 1 h/1 d | 60°S–60°N | 2002–present | [78] | |
| IMERGFinal | 0.1° × 0.1° | 30 min | 90°S–90°N | June 2000–present | [16] | |
| ERA5 | Reanalysis Products | 31 km | 1 h/1 mo | 90°S–90°N | 1979–present | [82] |
| CHIRP | 0.05° × 0.05° | 1 d | 50°S–50°N | 1981–present | [83] | |
| CHIRPS | 0.05° × 0.05° | 1d | 50°S–50°N | 1981–present | [83] |
Table 2.
Metrics used to evaluate the accuracy of precipitation products and their equations. In these equations, E and O represent the estimated values of precipitation based on products and observed precipitation based on ground stations, respectively, N represents the number of observations, MSE represents the mean square error, E* represents the estimated values of precipitation based on the regression relationship. Linear (aO + b) between precipitation values estimated based on precipitation products and recorded at ground stations. Also, µ and σ represent the mean and standard deviations of the time series, respectively [16].
| Statistical Metric | Equation | Perfect Value | Description |
|---|---|---|---|
| Relative Bias (RBias) | 0 | RBias, as a bias indicator, represents the degree of overall underestimation (negative values) or overestimation (positive values) of predictions. | |
| Correlation Coefficient (CC) | 1 | The Pearson correlation coefficient is employed to measure the linear relationship between estimated and measured precipitation. | |
| Root Mean Squared Error (RMSE) | 0 | RMSE represents average the magnitude of the error, which is a negatively oriented score, i.e., lower values show better results. | |
| Random Error (RE) | 1 | Random errors are unpredictable fluctuations in the estimated precipitation concerning the measured precipitation. | |
| Systematic Error (SE) | 0 | Systematic errors are predictable and reproducible inaccuracies that are consistently in the same direction | |
| Kling- Gupta Efficiency (KGE) | ;; | 1 | KGE represents similarity degree between the estimated values from datasets and observations. Multi-component nature of KGE incorporates linear correlation, bias, and variability within a single objective function, providing a more balanced model evaluation. The optimum value of KGE is one. |
Table 3.
Results of the accuracy evaluation of different precipitation products based on precipitation map obtained from interpolation method.
Table 3.
Results of the accuracy evaluation of different precipitation products based on precipitation map obtained from interpolation method.
| Dataset | KGE | Corr. | Variability Ratio | Rbias | RMSE (mm/mon) | Systematic Error | Random Error |
|---|---|---|---|---|---|---|---|
| PRECL | 0.52 | 0.75 | 0.91 | −0.15 | 11.5 | 0.20 | 0.80 |
| PERSIANN | 0.20 | 0.42 | 1.52 | −0.40 | 16.9 | 0.37 | 0.63 |
| PERSIANN-CCS | −0.03 | 0.18 | 0.65 | 0.71 | 29.6 | 0.20 | 0.80 |
| PERSIANN-PDIR | 0.17 | 0.38 | 0.78 | 0.35 | 17.1 | 0.29 | 0.71 |
| GSMaP-MVK | 0.14 | 0.36 | 1.43 | −0.32 | 20.0 | 0.31 | 0.69 |
| GSMaP-NRT | 0.12 | 0.33 | 1.54 | 0.38 | 21.1 | 0.23 | 0.77 |
| PERSIANN-CDR | 0.15 | 0.38 | 0.75 | 0.41 | 18.5 | 0.15 | 0.85 |
| PERSIANN-CCS-CDR | 0.14 | 0.36 | 0.83 | 0.45 | 19.0 | 0.32 | 0.68 |
| TRMM3B43 | 0.48 | 0.70 | 0.93 | 0.14 | 10.6 | 0.08 | 0.92 |
| GSMaP-Gauge | 0.44 | 0.65 | 1.25 | −0.17 | 12.9 | 0.21 | 0.79 |
| IMERGFinal | 0.56 | 0.80 | 0.91 | 0.10 | 9.7 | 0.10 | 0.90 |
| ERA5 | 0.26 | 0.70 | 1.38 | 0.26 | 16.8 | 0.17 | 0.83 |
| CHIRP | 0.33 | 0.51 | 0.81 | 0.22 | 14.5 | 0.38 | 0.62 |
| CHIRPS | 0.37 | 0.59 | 0.90 | 0.18 | 13.0 | 0.32 | 0.68 |
| Proposed method | 0.75 | 0.92 | 1.04 | 0.04 | 6.6 | 0.07 | 0.93 |
Table 4.
Results of accuracy evaluation of different precipitation products based on point-to-pixel strategy in geographical location of validation stations.
Table 4.
Results of accuracy evaluation of different precipitation products based on point-to-pixel strategy in geographical location of validation stations.
| Dataset | KGE | Corr. | Variability Ratio | Rbias | RMSE (mm/mon) | Systematic Error | Random Error |
|---|---|---|---|---|---|---|---|
| PRECL | 0.36 | 0.25 | 0.71 | −0.19 | 19.5 | 0.50 | 0.50 |
| PERSIANN | 0.15 | 0.19 | 0.60 | −0.32 | 26.5 | 0.67 | 0.33 |
| PERSIANN-CCS | −0.01 | 0.12 | 0.42 | 0.53 | 34.5 | 0.50 | 0.50 |
| PERSIANN-PDIR | 0.19 | 0.22 | 0.65 | 0.35 | 28.5 | 0.59 | 0.41 |
| GSMaP-MVK | 0.17 | 0.20 | 0.63 | 0.41 | 27.1 | 0.61 | 0.59 |
| GSMaP-NRT | 0.14 | 0.23 | 0.60 | 0.45 | 29.7 | 0.43 | 0.57 |
| PERSIANN-CDR | 0.16 | 0.29 | 0.68 | 0.26 | 25.9 | 0.35 | 0.65 |
| PERSIANN-CCS-CDR | 0.13 | 0.20 | 0.59 | 0.32 | 28.4 | 0.52 | 0.48 |
| TRMM3B43 | 0.36 | 0.35 | 0.73 | 0.08 | 18.9 | 0.28 | 0.72 |
| GSMaP-Gauge | 0.31 | 0.32 | 0.83 | −0.06 | 20.6 | 0.41 | 0.59 |
| IMERGFinal | 0.38 | 0.40 | 0.76 | 0.05 | 17.5 | 0.30 | 0.70 |
| ERA5 | 0.27 | 0.46 | 0.53 | 0.30 | 23.5 | 0.37 | 0.63 |
| CHIRP | 0.20 | 0.28 | 0.51 | 0.12 | 22.6 | 0.58 | 0.42 |
| CHIRPS | 0.26 | 0.30 | 0.68 | 0.09 | 21.0 | 0.52 | 0.48 |
| Proposed method | 0.50 | 0.64 | 0.89 | 0.04 | 13.6 | 0.18 | 0.82 |
Disclaimer/Publisher’s Note: The statements, opinions and data contained in all publications are solely those of the individual author(s) and contributor(s) and not of MDPI and/or the editor(s). MDPI and/or the editor(s) disclaim responsibility for any injury to people or property resulting from any ideas, methods, instructions or products referred to in the content. |
© 2022 by the authors. Licensee MDPI, Basel, Switzerland. This article is an open access article distributed under the terms and conditions of the Creative Commons Attribution (CC BY) license (https://creativecommons.org/licenses/by/4.0/).
Share and Cite
MDPI and ACS Style
Assiri, M.E.; Qureshi, S. A Multi-Source Data Fusion Method to Improve the Accuracy of Precipitation Products: A Machine Learning Algorithm. Remote Sens. 2022, 14, 6389. https://0-doi-org.brum.beds.ac.uk/10.3390/rs14246389
AMA Style
Assiri ME, Qureshi S. A Multi-Source Data Fusion Method to Improve the Accuracy of Precipitation Products: A Machine Learning Algorithm. Remote Sensing. 2022; 14(24):6389. https://0-doi-org.brum.beds.ac.uk/10.3390/rs14246389
Chicago/Turabian StyleAssiri, Mazen E., and Salman Qureshi. 2022. "A Multi-Source Data Fusion Method to Improve the Accuracy of Precipitation Products: A Machine Learning Algorithm" Remote Sensing 14, no. 24: 6389. https://0-doi-org.brum.beds.ac.uk/10.3390/rs14246389
Note that from the first issue of 2016, this journal uses article numbers instead of page numbers. See further details here.