
Research of Distance-Intensity Imaging Algorithm for Pulsed LiDAR Based on Pulse Width Correction


1
National Key Laboratory of Tunable Laser Technology, Harbin Institute of Technology, Harbin 150001, China
2
Geling Institute of AI and Robotics, Shenzhgen 518063, China
3
Harbin Institute of Technology, School of Electronic and Information Engineering, Harbin 150001, China
*
Author to whom correspondence should be addressed.
Remote Sens. 2022, 14(3), 507; https://0-doi-org.brum.beds.ac.uk/10.3390/rs14030507
Submission received: 14 December 2021
/
Revised: 15 January 2022
/
Accepted: 17 January 2022
/
Published: 21 January 2022
(This article belongs to the Topic Information Sensing Technology for Intelligent/Driverless Vehicle)
Abstract
:Walking error has been problematic for pulsed LiDAR based on a single threshold comparator. Traditionally, walk error must be suppressed by some time discrimination methods with extremely complex electronic circuits and high costs. In this paper, we propose a compact and flexible method for reducing walk error and achieving distance-intensity imaging. A single threshold comparator and commercial time digital converter chip are designed to measure the laser pulse’s time of flight and pulse width. In order to obtain first-class measurement accuracy, we designed a specific pulse width correction method based on the Kalman filter to correct the laser recording time, significantly reducing the ranging walk error by echo intensity fluctuation. In addition, the pulse width obtained by our method, which is a recording of the laser intensity, is conducive to target identification. The experiment results verified plane point clouds of various targets obtained by the proposed method with a plane flatness less than 0.34. The novel contribution of the study is to provide a highly integrated and cost-effective solution for the realization of high-precision ranging and multi-dimensional detection by pulsed LiDAR. It is valuable for realizing multi-dimension, outstanding performance, and low-cost LiDAR.
1. Introduction
The basic principle of pulsed laser ranging is that the laser pulse is actively fired to the target, the laser echo of the illuminated point on the target is detected, the flight time of the laser pulse is measured, and the distance information of the target is calculated. Pulsed laser detection and ranging (LiDAR) has the advantages of high peak power of laser emission, long detection distance, and a low requirement on the coherence of the light source. It has been widely used in the fields of forest vegetation mapping [1], environment detection [2], and three-dimensional urban modeling [3,4]. Especially in recent years, with the rise of autonomous vehicles and unmanned aerial vehicles (UAVs), lidar has seen more applications and development. Kim, Tae-Hyeong et al. [5] proposed a lidar placement method for the multiple lidar system of autonomous vehicles to reduce the dead zone and improves the point cloud resolution. Chisholm, RA et al. [6] presented an end-to-end autonomous system for estimating tree diameters using a below-canopy UAV in parklands. Choi, Yeon Ji et al. [7] presented a deep learning (DL) approach with LiDAR data to aid autonomous navigation for UAVs in completely unknown, GPS-denied indoor environments. These applications are based on LiDAR’s basic ranging function.
The main factors affecting the accuracy of pulse laser ranging include the bandwidth of receiving channel, the signal-to-noise ratio of echo, the accuracy of time measurement, and time discrimination. Typically, the shorter the pulse width of the transmitting laser of the pulse lidar, the higher the ranging accuracy [8]. Therefore, a high bandwidth receiving channel is indispensable [9]. A professional time digital converter (TDC) timing chip can ensure the accuracy of time measurement in about one hundred ps [10]. The time discrimination methods of laser pulse signal mainly include analog time discrimination and digital time identification methods. The digital time identification method is to digitize the analog signal through the high-speed analog/digital converter(ADC) chip and then process the converted digital signal through the digital signal processing chip. Usually, time discrimination and time measurement can be realized simultaneously by this kind of method [11]. The application of high speed ADC brings various echo information. Full waveform analysis has become a key research direction. Full waveform analysis provide additional information on the target’s properties compared to conventional discrete echo systems [12]. Waveform centroid method is a representative algorithm of full waveform algorithm, which can achieve high precision ranging and provide more information [13]. Although digital time identification method is more accurate than the analog time discrimination method, the digital time discrimination method has disadvantages such as high cost, complex circuits, and higher volume and application environment requirements [14,15]. The analog time discrimination method should match with the special TDC timing chip to measure the laser’s flight of time. The sample analog time discrimination method (leading edge discrimination) is greatly affected by the echo waveform of the pulsed laser, which limits the accuracy of the ranging to a great extent [16]. Researchers have proposed some discrimination methods to to reduce walk error caused by the variation of echo intensity (such as the constant fraction discrimination [17] and high-pass filtering discrimination [18,19]). Nevertheless, the need for high receiving bandwidth dramatically increases the difficulty of circuit design and implementation of the above modified methods.
In this paper, aiming to simultaneously improve the accuracy of LiDAR’s analog time discrimination method and its robustness to laser pulse intensity fluctuation, we designed a time discrimination and measurement circuit with a single threshold comparator and TDC-GPX2 timing chip. By measuring the laser pulse width, and combined with machine learning compensated time of laser’s flight of time, the range measurement accuracy of the lidar is improved effectively, and the time drift caused by the fluctuation of laser pulse echo intensity is obviously reduced. Meanwhile, the pulse width is used as the recording method of laser echo intensity, and the distance-intensity imaging of the lidar is realized. The outstanding contribution of this paper is to achieve high precision ranging with low cost circuit, and effectively deal with the fluctuation of echo intensity and echo intensity recording. To verify the feasibility and performance of our design, a series of experiments were carried out as follows.
2. Plused LiDAR Radiative Transmission Mechanism
In order to more accurately describe the time domain distribution of echo pulse, according to the actual shape of the transmitting pulse, this paper adopts the Gaussian function as the expression of the transmitting pulse time domain waveform [20]:
where I is the transmitted power parameter; is the transmitted delay time;
is the
parameter related to pulse width.
The attenuation coefficient generated during transmission, reflection and reception of the echo pulse can be expressed as:
where is the parmeter of system; is the one-way atmospheric attenuation coefficient; is the area of the receiving aperture; is the photodetector response coefficient; is the bidirectional reflectance distribution function (BRDF) of the target; is the amplification of the detector amplifier circuit; is echo incidence angle; derived from the calculation of the backscattering cross-section for the Lambert targets. For specific targets (such as specular targets), the formula may be adjusted.
The time domain waveform of echo pulse received by the photodetector can be expressed as:
where is the time domain broadening coefficient; is the time interval between the transmitted pulse and the echo pulse, which is equal to twice the distance between the target and the laser emitter divided by the speed of light.
Herein, the distance between LiDAR and target can be calculated by:
where c is the velocity of light; T is the flight of time. In LiDAR applications, the velocity of light is generally considered to be a constant value.
3. Methodology
A structure chart of the pulsed LiDAR system appears in Figure 1. Generally, it can be divided into three subsystems: transmitting system, receiving system, and data processing system. The MCU outputs two signals, one drives the triggering pulse circuit to enable the laser to transmit laser pulse, and one goes into the time interval measurement circuit as the starting pulse of the ranging. The driving circuit controls the MEMS mirror to scan the forward scene. Once the transmitted laser pulse illuminates the target surface, the Backscatter laser beam is collected and aggregated into the photosensitive side of the avalanche photodiode (APD) by receiving lens. It is converted to a current signal by the APD. The current signal is amplified and discriminated to a square wave pulse signal and be transferred to the time interval measurement circuit as the ending pulse of the ranging. Time to digital converter (TDC) is the core device of the time interval measurement circuit, which can calculate the time interval between the two pulses. Finally, the ranging results are calculated in the data processing system by Equation (1).
3.1. Time Discrimination Methods for Pulsed LiDAR
3.1.1. Leading-Edge Discrimination(LD)
In this method, a threshold comparator is used to determine the arrival moment of the laser pulse. When the rising edge of the laser pulse exceeds the pre-established threshold, the arrival moment is detected. Although leading edge discrimination is relatively simple and easy to be implemented, it is sensitive to amplitude time walk and rising time walk. Figure 2 shows an example of an transmitted pulse and three echo pulses with various peak values and the same arrivel time. Due to the fixed threshold, the stop moment of the echo is more forward with the higher amplitude it is. Thus, , , and , the flight times obtained by leading edge discrimination are arranged from small to large.
3.1.2. Constant Fraction Discrimination (CFD)
In the constant fraction discrimination method, the given threshold of the comparator varies with the peak value of a received waveform. The arrival moment is identified at the fixed proportional point at the peak of the received waveform through a series of special circuits. The constant fraction discriminator divides the input signal into two channels, one for the delay and the other for attenuation, and then obtains the digital signal brings through the high-speed comparator. It not only adopts the zero-crossing timing technology but also can adjust the trigger ratio. The amplitude time walk caused by fluctuation of laser intensity is greatly reduced.
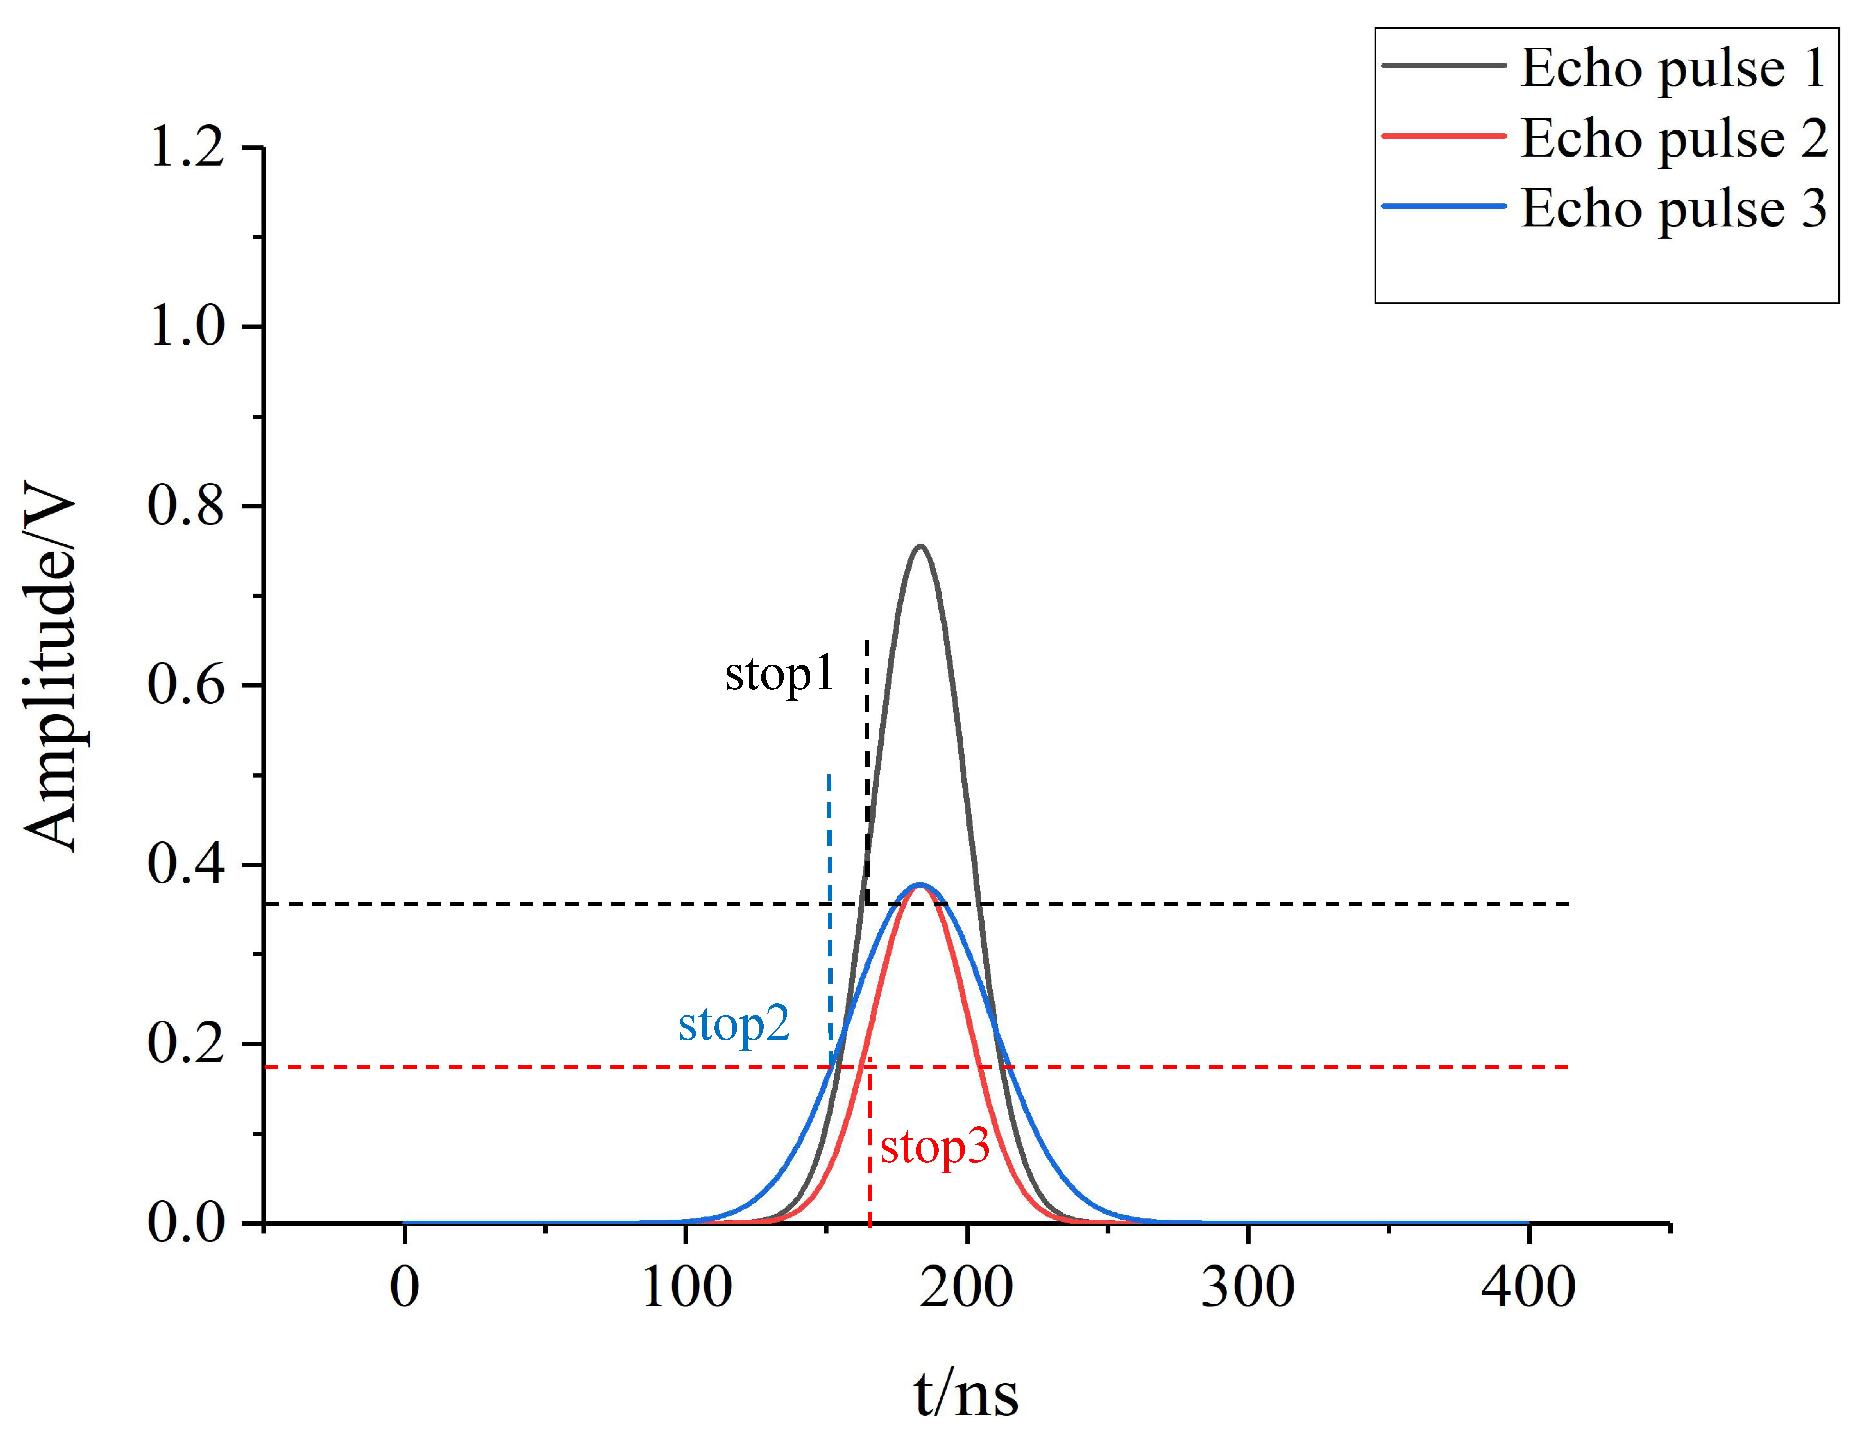
As shown in Figure 3, echo 1 and 3 are of different peak values but of the same full width at half maximum (FWHM). Echo 2 and 3 are of the same peak values but of the different FWHMs. It can be seen that the stop moments of echo 1 and 3 are successfully positioned at the same percentage point with the same trigger ratio.
However, although the peak value of echo pulse 2 is the same as it of the echo pulse 3, stop moments extracted from the two echos are different. It can be seen that the FWHM of the echo 2 is bigger than it of the echo 3, implying that the constant fraction discrimination is sensitive to the FWHMs of the received waveforms.
3.2. Our Method
Considering the limitations of the above time discrimination methods on echo fluctuation, pulse width, and detector unsaturated, we propose a new approach. It relies on a simple single threshold comparator circuit and TDC-GP22 chip to measure the laser pulse’s leading-edge time interval and echo pulse width. Set the TDC-GP22 chip to pulse width measurement mode. The flight of time can be calculated with . The pulse width of reference laser pulse and echo laser pulse can be obtained by and , respectively. The principle diagram of time measurement is shown in Figure 4.
Then, the Kalman filter method is combined to get the best compensation time interval, and finally combines the time interval and compensation pulse width to obtain the high precision laser pulse’s flight of time. To avoid the influence of echo overbroadening, we design a compensating pulse width screening mechanism. When the echo pulse width after Kalman filtering is too wide, a preset value is selected as the compensation value of the echo pulse width. In this algorithm, we choose 0.5 as the pulse width compensation coefficient. For different pulse laser system, it can be adjusted according to the actual situation. Accordingly, the implementation of the proposed algorithm has been illustrated in Figure 5.
At the same time, the laser echo pulse width can be used to record the intensity of laser echo, which helps to realize the LiDAR to identify different objects at the same distance.
In the process of the kalman filter aogorithm, we have two distinct set of equations. Ones are prediction set, as the following:
Anthoers are correction set, as the following:
where the matrices A, B, and H are equal to 1; R is the variance of TDC output results, herein we set it as 20ps; Q is the variance of measurement, which is set as 5ps in our paper; is the Kalman gain; is the previous estimation; is the current estimation.
4. Experimental Verification
To verify our design’s validity, the proposed algorithm is demonstrated and evaluated in terms of accuracy with experimental datasets. Herein, we design a pulsed Lidar system , as showed in Figure 6. Table 1 lists the specifications of our system.
4.1. Experimental Phenomenon
For the pulsed LiDAR with the max ranging distance above 1 km, the peak power of the laser pulse is generally in the order of tens of watts. When the target is close or the reflectivity is strong, the energy of the echo laser pulse is also intense. Such a high-intensity echo pulse will cause the saturation of the impulse response in APD. This phenomenon has a significant influence on the ranging performance of standard pulsed LiDAR. A similar APD impulse response saturation phenomenon was also observed using the pulse lidar system built in this paper, as shown in Figure 7. The target object of this experiment is the standard diffuse plate with 50% reflectivity, and the distance is 5.51 m. We observe the signals before the discriminator with oscilloscope in Figure 7.
As Figure 7 showed, in the initial stage (pump power control voltage from 200 mv to 350 mv), with the increase of echo laser power, the peak value of the APD photoelectric response signal also increases. With the further growth of laser power, the amplitude of the APD response pulse does not increase, but the pulse width of the APD response pulse does increase. Along with the saturation of the APD impulse response, the rising edge of the pulse also appears to move forward to a certain extent.
4.2. Experimental Verification
In the actual dynamic ranging, laser intensity fluctuation and pulse width saturation are more likely to occur when the target is close to the LiDAR. We distributed single-point laser ranging on diffuse panels with reflectivity of 15%, 20%, 35%, 50%, and 75% at approximately 10 m from the LiDAR. At each diffuse panel, 15,000 times measurements are made. The ranging data obtained by leading-edge discrimination, constant fraction discrimination methods and our algorithm are shown in Table 2.
We evaluated the relationships between target’s reflectivity and time ranging results of three methods in Figure 8.
As shown in Figure 8, we notice that, the ranging result of the leading-edge discrimination decreases significantly with the enhancement of target reflectivity.There was no evidence that constant fraction discrimination has a favorable influence on attenuating the fluctuation of echo intensity on ranging results. The ranging results of the two algorithms both fluctuate obviously when the target reflectivity is low. The echo is sensitive to the target’s reflection characteristics. Vibrations caused by speckle and temperature fluctuations are more intense, when the echo signal is relatively weak. In contrast, the ranging results of our algorithm and targets’reflectivities have almost no mutual effect. The range measurement results of different reflectance targets at the same distance fluctuated within 30 ps. It can be concluded that this method is robust to the fluctuation of laser pulse echo intensity.
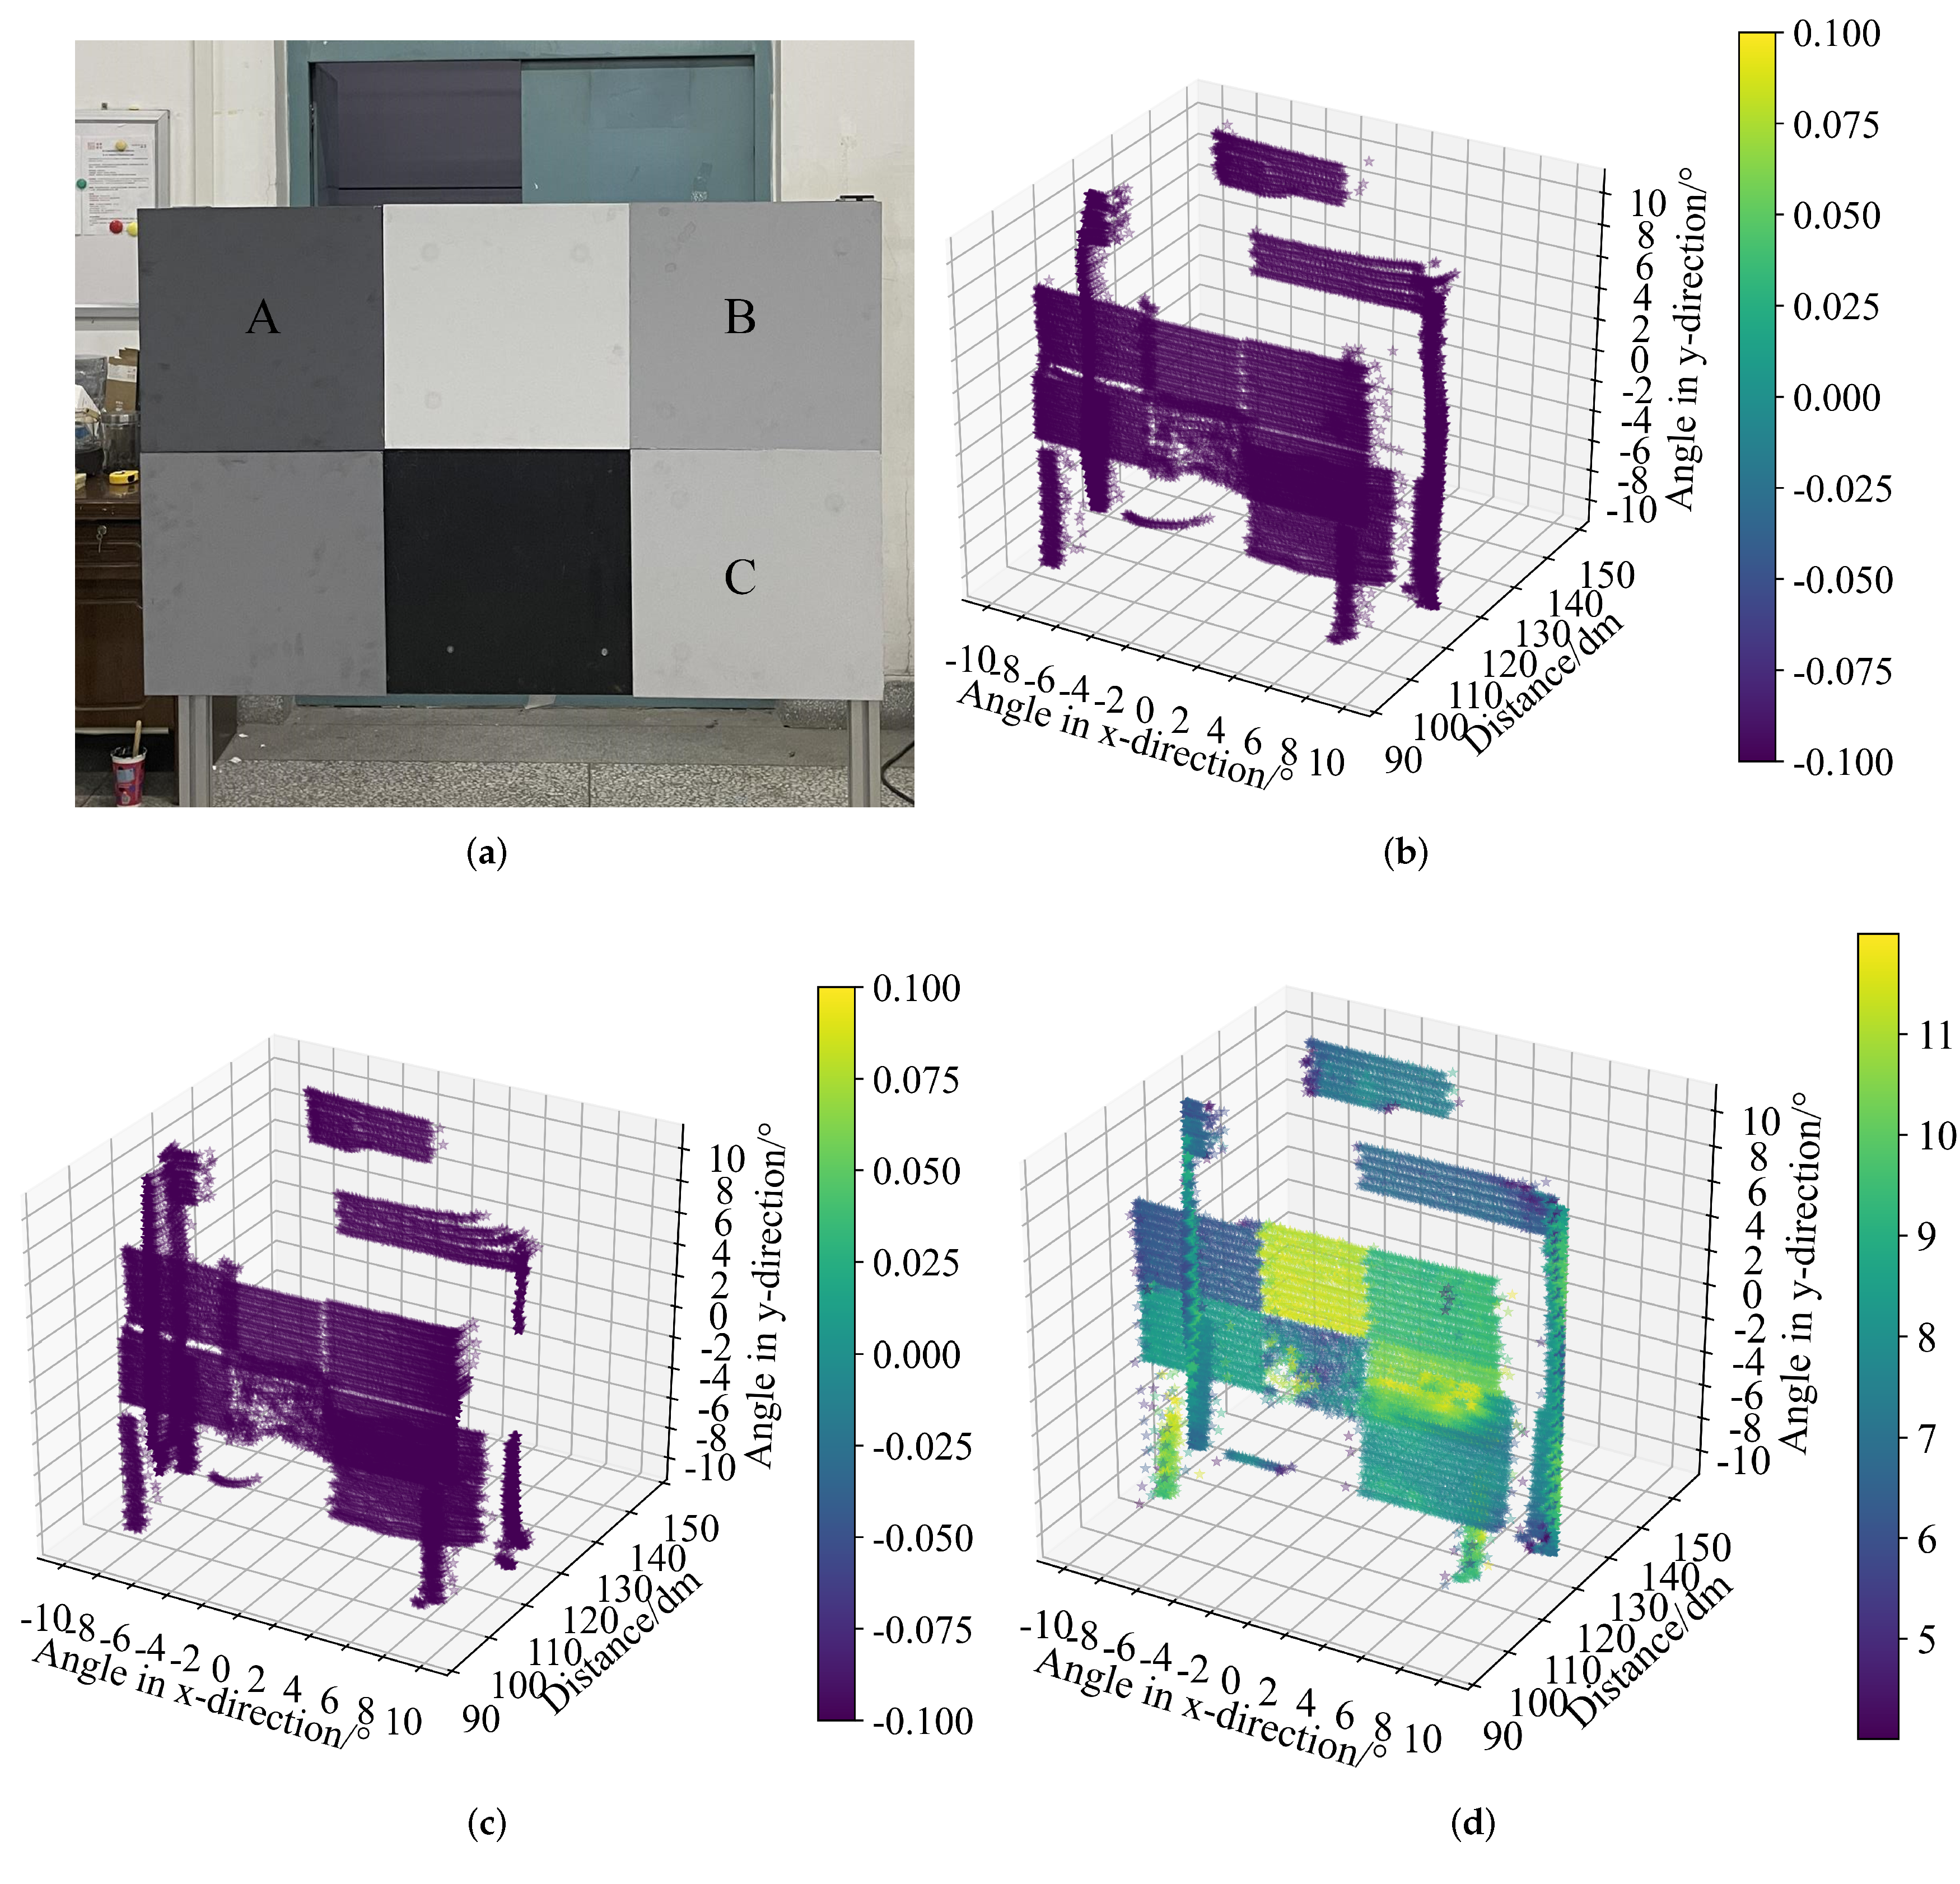
To further verify the effect of the proposed algorithm in actual point cloud imaging, diffuse panels with different reflectance, metal doors, and white walls are selected as scanning targets, respectively. The obtained point cloud images are shown in Figure 9 and Figure 10.
Figure 9 and Figure 10 shows the point cloud imaging results. The value of the color bars in Figure 9 and Figure 10 are pulse width data obtained by our algorithm. As shown in Figure 9b,c, the point cloud data of diffuse panels with various reflectivity obtained by the leading-edge discrimination and constant fraction discrimination are uneven. While the point cloud data of diffuse panels with varied reflectivity obtained by our algorithm are almost all in the same plane. In our algorithm, pulse width data are used as intensity values to color point cloud data, which helps distinguish objects with different properties at the same distance. Similar experiments have been carried out in our previous work [21], and the experimental results show that the point cloud results measured by this method are basically at the same level as those obtained by the centroid algorithm. However, the hardware cost and time consumption of this method are much lower, and high speed ADC and large amount of data calculation are not required. Figure 10b,c show that the central part of the metal door is protruding, and the door frame and background wall are also deformed to a certain extent. The point cloud data obtained by leading-edge discrimination and constant fraction discrimination are seriously inconsistent with the actual shape of the target. In the point cloud data obtained by our algorithm, the metal door panels, the door frame, and the background wall are flat, reflecting the target’s shape. The center part of the metal door in Figure 10 coincides with the center of the laser beam scanning region of the LiDAR, and the laser beam is almost parallel to the normal direction of the metal door panel. The echo intensity of this part of the beam is relatively strong, similar to specular reflection. Accordingly, the ranging performance of leading-edge discrimination is seriously reduced, which is consistent with the above analysis.
Herein, the point-cloud data of diffuse plate with different reflectance and metal door obtained by leading-edge discrimination, constant fraction discrimination, and our algorithm are selected to calculate the plane flatness of each. The coordinates of the three points of diffuse reflectance plates with different reflectance and the metal door (A–C in Figure 9 and D–F in Figure 10) were fitted to the initial plane as follows:
Calculate the distance of each point to the fitting plane:
The flatness of the feature surface can be calculated by the following formula:
The plane flatness data of the three planes are shown in Table 3.
As the data presented in Table 3, the flatness of the plane point cloud data obtained by our algorithm is significantly better than that obtained by the leading-edge discrimination and constant fraction discrimination. The flatness of each plane point cloud data obtained by the algorithm in this paper is less than 0.34. The above algorithms’ plane flatness of point cloud data of metal door panels obtained is the most apparent difference. Due to similar specular reflection in the center part of the metal door, the echo intensity of the center part of the metal door is considerably different from that of the edge part.
5. Conclusions
A pulsed LiDAR with a distance-intensity imaging algorithm based on pulse width correction is experimentally demonstrated. Real-time distance-intensity point-cloud mapping is achieved. A simple high-speed threshold comparator and a commercial TDC chip are combined to allow simultaneous measurement of pulse width and time of flight. A designed Kalman filter is used to process the data to reduce data disturbance. The pulse width correction method can tremendously reduce the ranging error caused by laser echo intensity fluctuation. The experiment results verified plane point clouds of various targets obtained by the proposed method with a plane flatness less than 0.34. Meanwhile, the pulse intensity data recorded by pulse width obtained by our design contribute to identifying different objects at the same distance.
Author Contributions
S.Y. conducted the simulations and experiments and completed the manuscript; G.Y. gave some suggestions and revised the work; Q.L. and Y.W. carefully improved the presentation of the manuscript; Y.W. participated in data curation and ploting; C.W. modified the manuscript. All authors have read and agreed to the published version of the manuscript.
Funding
This work was supported by the National Key Scientific Instrument and Equipment Development Projects of China (Grant No. 62027823) and Shenzhen Fundamental Research Program (Grant No. JCYJ2020109150808037).
Institutional Review Board Statement
Not applicable.
Informed Consent Statement
Not applicable.
Data Availability Statement
Not applicable.
Acknowledgments
The authors would like to thank T.C. for supplying guidance in circuit design.
Conflicts of Interest
The authors declare no conflict of interest.
References
- Korpela, I.; Hovi, A.; Korhonen, L. Backscattering of individual LiDAR pulses from forest canopies explained by photogrammetrically derived vegetation structure. ISPRS J. Photogramm. Remote Sens. 2013, 83, 81–93. [Google Scholar] [CrossRef]
- Fan, Y.C.; Wu, B.T.; Huang, C.J.; Bai, Y.H. Environment Detection of 3D LiDAR by Using Neural Networks. In Proceedings of the 2019 IEEE International Conference on Consumer Electronics, Las Vegas, NV, USA, 11–13 January 2019. [Google Scholar]
- Lum, D.J. Ultrafast time-of-flight 3D LiDAR. Nat. Photonics 2020, 14, 2–4. [Google Scholar] [CrossRef]
- Chen, Z.; Lan, Z.; Long, H.; Hu, Q. 3D modeling of pylon from airborne LiDAR data. In Proceedings of the Remote Sensing of the Environment: 18th National Symposium on Remote Sensing of China, Wuhan, China, 20–23 October 2012; Tong, Q., Shan, J., Zhu, B., Eds.; 2014; Volume 9158. [Google Scholar]
- Kim, T.H.; Park, T.H. Placement Optimization of Multiple Lidar Sensors for Autonomous Vehicles. IEEE Trans. Intell. Transp. Syst. 2020, 21, 2139–2145. [Google Scholar] [CrossRef]
- Chisholm, R.A.; Rodriguez-Ronderos, M.E.; Lin, F. Estimating Tree Diameters from an Autonomous Below-Canopy UAV with Mounted LiDAR. Remote Sens. 2021, 13, 2576. [Google Scholar] [CrossRef]
- Choi, Y.J.; Rahim, T.; Ramatryana, I.N.A.; Shin, S.Y. Improved CNN-Based Path Planning for Stairs Climbing in Autonomous UAV with LiDAR Sensor. In Proceedings of the 2021 International Conference on Electronics, Information and Communication (ICEIC), Jeju, Korea, 31 January–3 February 2021. [Google Scholar]
- Amann, M.C.; Bosch, T.; Lescure, M.; Myllyla, R.; Rioux, M. Laser ranging: A critical review of usual techniques for distance measurement. Opt. Eng. 2001, 40, 10–19. [Google Scholar]
- Kurtti, S.; Nissinen, J.; Kostamovaara, J. A Wide Dynamic Range CMOS Laser Radar Receiver With a Time-Domain Walk Error Compensation Scheme. IEEE Trans. Circuits Syst. I-Regul. Pap. 2017, 64, 550–561. [Google Scholar] [CrossRef]
- Priyanka, C.; Latha, P. Design and Implementation of Time to Digital Converters. In Proceedings of the 2015 International Conference on Innovations in Information, Embedded and Communication Systems, Coimbatore, India, 19–20 March 2015. [Google Scholar]
- Liu, M.; Liu, H.; Li, X.; Zhu, Z. A 60-m Range 6.16-mW Laser-Power Linear-Mode LiDAR System With Multiplex ADC/TDC in 65-nm CMOS. IEEE Trans. Circuits Syst. I-Regul. Pap. 2020, 67, 753–764. [Google Scholar] [CrossRef]
- Ullrich, A.; Hollaus, M.; Briese, C.; Wagner, W.; Doneus, M. Utilization of full-waveform data in airborne laser scanning applications. In Proceedings of the Laser Radar Technology and Applications XII, The International Society for Optical Engineering, Orlando, FL, USA, 9–13 April 2007; Volume 6550, p. 65500. [Google Scholar]
- Yl, A.; Tc, B.; Ql, A.; Bz, A.; Yb, A.; Cw, A. Waveform centroid discrimination of return pulse weighting method in LIDAR system. Optik 2019, 180, 840–846. [Google Scholar]
- Yoshioka, K.; Kubota, H.; Fukushima, T.; Kondo, S.; Ta, T.T.; Okuni, H.; Watanabe, K.; Hirono, M.; Ojima, Y.; Kimura, K.; et al. A 20-ch TDC/ADC Hybrid Architecture LiDAR SoC for 240 x 96 Pixel 200-m Range Imaging With Smart Accumulation Technique and Residue Quantizing SAR ADC. IEEE J. Solid-State Circuits 2018, 53, 3026–3038. [Google Scholar] [CrossRef]
- Xia, X.; Ye, M.; He, J.; Hu, K.; Zhao, Y. A novel TDC/ADC hybrid reconstruction ROIC for LiDAR. Ieice Electron. Express 2019, 16, 20181076. [Google Scholar] [CrossRef] [Green Version]
- Zhou, G.; Huang, W.; Zhou, X.; Zhang, L.; Chen, P.; Huang, J.; Zhang, R. A new Approach to minimize walk error in pulsed Laser rangefinding. In Proceedings of the 2017 IEEE International Geoscience and Remote Sensing Symposium, Fort Worth, TX, USA, 23–28 July 2017; pp. 1708–1711. [Google Scholar]
- Yao, P.; Tu, B.; Wang, X.; Zhang, Y.; Zhao, P. A high performance constant fraction discriminator for pulsed laser proximity fuze. In Proceedings of the Selected Papers from Conferences of the Photoelectronic Technology Committee of the Chinese Society of Astronautics 2014, Part II, China, 1 August–1 October 2014; Du, X., Fan, D., Le, J., Lv, Y., Yao, J., Bao, W., Wang, L., Eds.; 2015; Volume 9522. Available online: https://www.spiedigitallibrary.org/conference-proceedings-of-spie/9522/1/A-high-performance-constant-fraction-discriminator-for-pulsed-laser-proximity/10.1117/12.2179946.short?SSO=1%EF%BC%8C (accessed on 13 December 2021).
- Palojarvi, P.; Ruotsalainen, T.; Kostamovaara, J. A 250-MHz BiCMOS receiver channel with leading edge timing discriminator for a pulsed time-of-flight laser rangefinder. IEEE J. Solid-State Circuits 2005, 40, 1341–1349. [Google Scholar] [CrossRef]
- Kurtti, S.; Kostamovaara, J. An integrated optical receiver with widerange timing discrimination characteristics. In Proceedings of the Esscirc 2005: Proceedings of the 31st European Solid-State Circuits Conference, Grenoble, France, 12–16 September 2005; pp. 435–438. [Google Scholar]
- Abdallah, H.; Baghdadi, N.; Bailly, J.S.; Pastol, Y.; Fabre, F. Wa-LiD: A New LiDAR Simulator for Waters. IEEE Geosci. Remote Sens. Lett. 2012, 9, 744–748. [Google Scholar] [CrossRef] [Green Version]
- Yan, S.; Yang, G.; Li, Q.; Zhang, B.; Wang, C. Distance–Intensity Image Strategy for Pulsed LiDAR Based on the Double-Scale Intensity-Weighted Centroid Algorithm. Remote Sens. 2021, 13, 432. [Google Scholar] [CrossRef]
Figure 1.
A structure chart of the pulsed LiDAR system.

Figure 2.
Transmitted pulse and echo pulses with various amplitudes.

Figure 3.
Echo pulses with various amplitudes and pulse widths.

Figure 4.
The principle diagram of time measurement.

Figure 5.
The flow chart of the proposed algorithm.

Figure 6.
The experimental pulsed LiDAR. (a) External view; (b) Internal MCU and TDC circuit board.

Figure 7.
The echo signals with various pump power control voltages with a target of 50% diffuse reflection plate at 5.51 m.
Figure 7.
The echo signals with various pump power control voltages with a target of 50% diffuse reflection plate at 5.51 m.

Figure 8.
Standard error map of time ranging results with two methods at various diffuse panels of the same distance.
Figure 8.
Standard error map of time ranging results with two methods at various diffuse panels of the same distance.

Figure 9.
Testing environments 1. (a) Picture of diffuse reflector; (b) Point cloud of diffuse reflector by LD; (c) Point cloud of diffuse reflector by CFD; (d) Point cloud of diffuse reflector by our method.
Figure 9.
Testing environments 1. (a) Picture of diffuse reflector; (b) Point cloud of diffuse reflector by LD; (c) Point cloud of diffuse reflector by CFD; (d) Point cloud of diffuse reflector by our method.

Figure 10.
Testing environments 2. (a) Picture of diffuse reflector; (b) Point cloud of diffuse reflector by LD; (c) Point cloud of diffuse reflector by CFD; (d) Point cloud of diffuse reflector by our method.
Figure 10.
Testing environments 2. (a) Picture of diffuse reflector; (b) Point cloud of diffuse reflector by LD; (c) Point cloud of diffuse reflector by CFD; (d) Point cloud of diffuse reflector by our method.


Table 1.
Specifications of the pulsed Lidar system.
| Parameter | Value |
|---|---|
| Laser wavelength | 1550 nm |
| Laser pulse width | 10 ns |
| Laser beam diameter | 1.0 mm |
| Angle of divergence | 0.51 mrad |
| Size of APD photosensitive surface | 1 mm |
| TDC | GPX2 |
Table 2.
Time ranging results of three methods at various diffuse panels of the same distance.
| Target Reflectivity | Mean Ranging Result of LED (ps) | Variance (ps) | Mean Ranging Result of CFD (ps) | Variance (ps) | Mean Ranging Result of Our Algorithm (ps) | Variance (ps) |
|---|---|---|---|---|---|---|
| 10% | 70,924.70 | 56,548.28 | 70,912.50 | 51,479.56 | 70,739.80 | 34,499.76 |
| 20% | 68,359.95 | 4563.23 | 68,515.30 | 4125.41 | 70,753.20 | 2891.41 |
| 35% | 67,544.38 | 2777.36 | 67,541.45 | 2532.42 | 70,771.33 | 2322.06 |
| 50% | 67,233.22 | 2207.41 | 67,321.22 | 2212.27 | 70,781.56 | 2162.92 |
| 75% | 66,861.95 | 1725.11 | 66,898.32 | 1895.68 | 70,800.12 | 2119.94 |
Table 3.
The plane flatness data of the three planes.
| Methods | Surface Evenness of Diffuse Reflection Plate | Surface Evenness of Metal Door Panels with Painted |
|---|---|---|
| Leading edge discrimination | 0.5130 | 1.9776 |
| Constant fraction discrimination | 0.4992 | 1.8775 |
| Our algorithm | 0.2725 | 0.3230 |
Publisher’s Note: MDPI stays neutral with regard to jurisdictional claims in published maps and institutional affiliations. |
© 2022 by the authors. Licensee MDPI, Basel, Switzerland. This article is an open access article distributed under the terms and conditions of the Creative Commons Attribution (CC BY) license (https://creativecommons.org/licenses/by/4.0/).
Share and Cite
MDPI and ACS Style
Yan, S.; Yang, G.; Li, Q.; Wang, Y.; Wang, C. Research of Distance-Intensity Imaging Algorithm for Pulsed LiDAR Based on Pulse Width Correction. Remote Sens. 2022, 14, 507. https://0-doi-org.brum.beds.ac.uk/10.3390/rs14030507
AMA Style
Yan S, Yang G, Li Q, Wang Y, Wang C. Research of Distance-Intensity Imaging Algorithm for Pulsed LiDAR Based on Pulse Width Correction. Remote Sensing. 2022; 14(3):507. https://0-doi-org.brum.beds.ac.uk/10.3390/rs14030507
Chicago/Turabian StyleYan, Shiyu, Guohui Yang, Qingyan Li, Yue Wang, and Chunhui Wang. 2022. "Research of Distance-Intensity Imaging Algorithm for Pulsed LiDAR Based on Pulse Width Correction" Remote Sensing 14, no. 3: 507. https://0-doi-org.brum.beds.ac.uk/10.3390/rs14030507
Note that from the first issue of 2016, this journal uses article numbers instead of page numbers. See further details here.