
Effects of Mulching on Maize Yield and Evapotranspiration in the Heihe River Basin, Northwest China


1
Center for Agricultural Water Research in China, China Agricultural University, Beijing 100083, China
2
National Field Scientific Observation and Research Station on Efficient Water Use of Oasis Agriculture in Wuwei of Gansu Province, Wuwei 733000, China
3
Key Laboratory of Agricultural Water Saving of the Ministry of Water Resources, Beijing 100083, China
4
Department of Civil Engineering, Indian Institute of Technology Bombay, Powai, Mumbai 400076, India
*
Author to whom correspondence should be addressed.
Remote Sens. 2022, 14(3), 700; https://0-doi-org.brum.beds.ac.uk/10.3390/rs14030700
Submission received: 21 December 2021
/
Revised: 29 January 2022
/
Accepted: 31 January 2022
/
Published: 2 February 2022
(This article belongs to the Special Issue Remote Sensing of Watershed)
Abstract
:Plastic film mulching is an effective way to manage agricultural fields in water shortage areas. Through increasing the soil surface temperature at the early stage of crop growth and reducing the soil evaporation during the whole growth period, plastic film mulching can realize the effect of water saving and yield increase. This study examined the effects of plastic film mulching on crop yield and evapotranspiration (ET) in the Heihe River basin in Northwest China. By using remote sensing data, the gridding G-AquaCrop model was built to simulate the maize yield and ET in the basin under conditions of film mulching and no-film mulching. Through an analysis of changes in maize yield and ET before and after film mulching, suitable areas for film mulching in the whole basin were identified. Through comparative analysis, it was found that after plastic film mulching, maize yield in 12–41% of the Heihe River basin increased to a certain extent, reaching 8%. Furthermore, film mulching decreased ET by 5–30% in 34–41% of areas planted with maize. Based on these results, suggestions were made on suitable areas for expansion of maize cultivation to balance the benefits of water saving and production increase with environmental pollution. Furthermore, the way of assessing the suitable mulching area is obtained by examining the meteorological condition directly. The results of this study are of great significance for rational allocation of agricultural production resources and efficient utilization of agricultural water resources.
1. Introduction
Plastic film mulching is a field management technique that results from advances in the field of material science. In addition to all the benefits of traditional biological mulching (i.e., to increase temperature, conserve soil moisture, and reduce evaporation) [1,2], plastic film mulching has several advantages, such as low cost, easy production, and good performance [3]. As a result, plastic film mulching has been widely used in agriculture in recent years [4,5,6,7]. It is likely that the use of plastic film mulching will continue to increase in the future, especially considering the increasing food demands due to population growth and the anticipated impacts of climate change.
In China, increasing population and climate change have already raised concerns about food security, and the situation is anticipated to only worsen [8,9,10]. Projections of more frequent and greater magnitude droughts [11,12,13,14] emphasize the need for water saving in the agricultural sector, especially since the sector is the largest consumer of water. In this regard, plastic film mulching offers an important means, as it has the benefits of water saving, especially with low cost and greater efficiency in production. Needless to say, the benefits of plastic film mulching are largest when it is used in regions where water resources are already scarce and agriculture is a key sector, such as the Heihe River basin in Northwest China.
The Heihe River basin, located in the arid Hexi Corridor of Northwest China, is an important commodity grain production base in China [15,16]. Due to its geography and climatic conditions, this area has been facing a severe shortage of water resources for a long time [17]. Theoretically speaking, plastic film mulching has a great potential for application in this area. However, due to differences in climate and soil types over the region, not all areas in the basin can produce satisfactory results with film mulching [18]. Another issue is that the plastic film cannot be degraded in a short time after being discarded [19], which not only results in environmental pollution but also reduces crop yield to varying degrees. Jiang et al. (2017) used the dye tracer method to track soil water movement, and the results highlighted that the presence of residual plastic film fragments significantly influenced soil physical properties, altered soil water distribution, and decreased the matching degree of the flow distribution region and the maize root (densely rooted) zone [20]. Gao et al. (2019) used meta-analysis to show that the crop yield decreased significantly with increased time and residual plastic film exceeded 240 kg/ha [21]. Thus, the use of plastic film mulching without considering its applicability may aggregate negative effects. Therefore, in actual production, it is necessary to allocate agricultural production according to local conditions in order to realize efficient utilization of resources.
Producing more food with less water has been the goal of agricultural development in arid areas, especially where mulch is widely used. Crop water productivity (WP) refers to the ratio of crop yield to crop evapotranspiration (ET) during yield acquisition [22,23,24]. By definition, a larger WP is the goal pursued by researchers and farmers. For this reason, WP can be used as a key index to explore the potential and suitability of plastic film mulching in the Heihe River basin.
The AquaCrop model published by the Food and Agriculture Organization (FAO) is a typical water-driven crop growth simulation model [25,26,27]. It accurately simulates not only the crop yield but also the ET in the process of crop growth. Further, it divides the ET into soil evaporation (E) and crop transpiration (Tr). At the same time, compared with other crop growth simulation models (e.g., EPIC, DSSAT, WOFOST, APSIM, and WAVES) [28,29,30,31,32], this model requires fewer input parameters with stable performance and can simulate different field management practices, such as different irrigation methods, film mulching methods, and fertilization methods [25,26]. It is indeed a good choice to use the AquaCrop model to explore the effects of different field management practices on WP in arid areas. Ran et al. (2017) showed that the simulation performance of the AquaCrop model was better than that of the SIMDualKc model under deficit irrigation conditions through a 5-year field experiment data verification [33]. Compared with SIMDualKc model [34], the AquaCrop model not only considered the effect of soil water content, but also took into account the physiological damage (for example, a decrease in canopy coverage) caused by long-term water shortage when simulating Tr., Shen et al. (2019) used the AquaCrop model to simulate the changes in ET of seed maize with and without film mulching in the Shiyang River basin in Northwest China and verified the results with field data [35]. The results not only showed that the model had good simulation performance under both conditions but also indicated that plastic film mulching significantly reduced soil evaporation, thereby reducing water consumption during the growth period of the crop. The current AquaCrop model does not take into account the effects of plant diseases and pests on crop growth and yield. In this case, the simulation results are often the potential yield (defined by solar radiation and temperature) or attainable yield (limited by water and nutrient availability) rather than the actual yield (reduced by diseases, pests, and environmental stressors); this seems to be a common flaw in most crop growth models [36]. Tigkas et al. (2015) and Li et al. (2019) showed that when the independent variables were meteorological conditions or management measures, the crop model was an ideal tool. In this way, other influencing factors can be set to have a neutral role in crop growth without affecting the interpretation of the results [37,38].
Despite these encouraging results, it is important to note that most simulation models such as AquaCrop are applicable only at the field scale. This presents certain limitations when applied to the Heihe River basin. This is because, due to the wide distribution of maize planting areas in the whole Heihe River basin, the spatial heterogeneities meteorological, soil and management variables in the region are large and are difficult to calculate and measure [39]. Therefore, although the AquaCrop model has been found to perform well for field-scale studies, it cannot be directly applied to regional studies due to limitations and difficulties in parameter estimation.
Advances in remote sensing technology have provided effective support for exploring the potential of plastic film mulching in the Heihe River basin using the AquaCrop model [40,41]. For example, many studies have proposed different important indexes in agricultural production using remote sensing data. Jin et al. (2020) and Toshihiro et al. (2006) estimated crop physiological indicators such as canopy coverage (CC) and growth period by using remote sensing data such as the enhanced vegetation index (EVI) and the three-band water index (TBWI) [42,43]. Lorite et al. (2013) and Han et al. (2019, 2020) used remote sensing technology to obtain CC, sowing date, aboveground biomass and other crop physiological indicators preliminarily. Then, the above indicators were introduced into the crop model and distributed simulation was carried out [44,45,46]. These results indicate that the coupling of remote sensing data and crop models can extend the application scale of existing crop models.
According to the above review, plastic film mulching has great application potential in arid areas of northwest China. However, few studies attempt to clarify the application effect and applicability of plastic film mulching in the whole Heihe River basin; this provided the motivation for the present study. In this study, the spatial distribution of water-saving and yield-increasing effects of plastic film mulching in the Heihe River basin was investigated and suggestions for suitable expansion areas were put forward. First, the maize sowing date and CC without statistical data were retrieved from EVI data and normalized difference vegetation index (NDVI) data, respectively. This lays a foundation for subsequent simulation and analysis. Due to the limited availability of land use data, only data for the period of 2011–2014 were considered. Further, combined with other products for the grids (i.e., meteorological data, land use data, soil variables), the gridding G-AquaCrop model was constructed. The G-AquaCrop model outputted maize yield and ET during the whole growth period under different scenarios (mulching/no-mulching). On the basis of reliable output results, the application effect and applicability of plastic film mulching of maize field in the Heihe River basin were quantified. At the same time, a new method to quickly obtain the applicability of plastic film mulching was proposed.
2. Materials and Methods
2.1. Study Area
This study focused on the maize cultivation area of the Heihe River basin (Figure 1) in the arid inland region of Northwest China. The basin is located in the middle of the Hexi Corridor, at 97°42′~102°04′ E, 37°41′~42°42′ N and covering an area of 142,900 square kilometers [47]. The maize cultivation areas in this study are mainly distributed in nine counties: Shandan, Minle, Ganzhou, Linze, Gaotai, Sunan, Suzhou, Jiayuguan, and Jinta in the middle and lower reaches of the Heihe River basin, as shown in Figure 1. In this area, the climate is mainly temperate continental arid climate; the annual average temperature is 4–8 °C; the annual average precipitation decreases from more than 250 mm in the east to less than 50 mm in the west; the annual average evaporation increases from the east to the west, from less than 2000 mm to more than 4000 mm; and the annual average sunshine duration reaches 3000–4000 h [48,49,50]. It is a relatively suitable area for agricultural development in the whole Heihe River basin. The main crops in the region are maize, spring wheat, spring barley, and spring rapeseed. Among these, maize occupies the largest area [51].
2.2. Acquisition of Spatial Heterogeneity Variables
2.2.1. Land Use Data
The land use data used in this study were from the Landsat remote sensing data obtained by the Heihe Plan Science Data Center (http://heihedata.org/ (accessed on 10 December 2019)), with a spatial resolution (SR) of 30 m. In order to matching other available forcing data, the 500 m SR is applied. The 500 m SR can also reflect spatial heterogeneity for the relatively flat agriculture land. The area cultivated under maize was re-samples to 500 m resolution using NEAREST by ArcGIS. This data was used as the basic data for this study and also as a reference for other data processing.
2.2.2. Meteorological Data
The ERA (ECMWF re-analysis-interim) data of precipitation (, mm), maximum air temperature (, °C), minimum air temperature (, °C), wind speed at 10 m height (, m/s), solar net radiation (, MJ m−2 d−1), surface pressure (, kPa), and dew point temperature (, °C) was obtained from the European Centre for Medium-Range Weather Forecast (ECMWF, https://www.ecmwf.int/ (accessed on 11 August 2021)), with a spatial resolution of 0.125° (13.89 km) and a temporal resolution of one day. In this study, the spatial resolution was re-sampled to 500 m using NEAREST with the land use data as the reference.
The reference crop evapotranspiration (, mm/d) was calculated by the Penman–Monteith method [52]:
where is the average net radiation of the crop surface; is the soil heat flux, which is approximately equal to 0 in a day, is the hygrometer constant, is the average temperature; is the average wind speed at a height of 2 m, is the saturated water pressure at average temperature, is the actual water pressure; and is the slope of the water pressure curve.
2.2.3. Soil Variables
The main soil types in the Heihe River basin include clay, sand, and silt. The distribution of soil types was obtained from the Digital soil mapping dataset of soil texture in the Heihe River basin (2012–2014) (spatial resolution was 100 m) [53] downloaded from the National Tibetan Plateau Data Center (https://data.tpdc.ac.cn/zh-hans/ (accessed on 25 August 2020)). The distribution of the soil hydraulic properties (including soil saturated water content, field water capacity, and saturated water conductivity) were also derived from the Digital soil mapping dataset of hydrological features in the Heihe River basin (2012) (spatial resolution is 90 m) [54] downloaded from the same website. In this study, the spatial resolution was uniformly aggregated to 500 m by NEAREST.
2.2.4. Sowing Date Retrieval
The sowing date is the starting point of time for crop growth and yield simulation by the AquaCrop model. Accurate acquisition of the spatial distribution data of sowing date in grids is of great importance for maize yield and ET. With the help of MODIS-NDVI, Han et al. (2019) obtained the sowing date of maize in the middle reaches of the irrigation area in the Heihe River through the threshold method [45]. However, many studies have shown that EVI has been improved to overcome the problems of atmospheric noise, soil background, and saturation on the basis of NDVI, and more and more studies choose to use EVI for phenological monitoring [55,56,57,58,59]. Therefore, in this study, MYDEV1D China 250 M EVI daily product of Geospatial Data Cloud (http://www.gscloud.cn/#page1/3 (accessed on 18 September 2020)) was used for sowing date retrieval. The sowing date was calculated using [60]:
where is the EVI value of day i, and is the empirical threshold, which is closely related to crop variety and planting area. Due to the lack of empirical data, this study used the empirical sowing date data of the Yingke Irrigation District in the Heihe River basin, i.e., 22 April [61], to carry out the backward deduction so that the calculated sowing date generally falls on 22 April. Here, is 0.22.
2.2.5. Canopy Coverage Retrieval
Canopy coverage (CC) is an important variable connecting the maize plant body and the AquaCrop model, which reflects crop growth [62]. In this study, MYDND1M China 500 M NDVI monthly composite product of the Geospatial Data Cloud (http://www.gscloud.cn/#page1/3 (accessed on 23 September 2020)) was adopted. The spatial resolution of data was re-sampled to 500 m using NEAREST by ArcGIS. The CC was calculated using:
where WDRVI is the wide dynamic threshold vegetation index [63], is the maximum leaf area index of maize, which was set as 5 [64]; and is the empirical coefficient, which was set as 0.2.
2.3. G-AquaCrop Model Parameterization & Yield and ET Simulation
2.3.1. G-AquaCrop Model
Since the AquaCrop model came into being, it has been widely used and recognized, especially in arid areas [25,26,33,35].
In the simulation of the AquaCrop model, the key process of conversion from CC to yield (Y) may be summarized as [26]:
where is the adjusted canopy coverage, is the largest standard crop transpiration coefficient, is the soil water stress coefficient, is the plant transpiration, is the normalized water productivity, is the air temperature stress coefficient, is the reference harvest index, and is the water stress adjustment factor. In this study, water stress was not considered, and so both and were 1. According to Equations (5)–(8), accurate simulation of CC is a necessary prerequisite for the accurate simulation of maize Y and ET (For more detailed model mechanism process, please refer to Raes et al. (2009)).
However, since the Heihe River basin covers a large area and the meteorological, soil, vegetation, and other variables have significant spatial heterogeneity, it is impossible to use the point-scale AquaCrop model for simulation. Therefore, this study combined the advantages of AquaCrop plug-in v6.0, ArcMap 10.0, and Matlab R2018a software to build a G-AquaCrop model. The G-AquaCrop model uses ArcGIS 10.0 software to grid all spatial heterogeneity variables obtained by remote sensing. Each grid in the Heihe River basin was taken as an independent simulation unit and was simulated by the AquaCrop model. Then, the ArcGIS 10.0 software was used to present the simulation results of each grid in the basin map. Due to the large number of grids in the Heihe River basin, this study prepared each input file required for the model operation in advance and used Matlab R2018a to call AquaCrop plug-in v6.0 to simulate. Calendar Day was used for simulation in this study.
2.3.2. Setting Simulation Scenarios for the G-AquaCrop Model
In order to compare the effects of plastic film mulching on Y and ET in the Heihe River basin, two simulation scenarios were set up in this study: (1) plastic film mulching; and (2) no plastic film mulching. In order to control the variables and highlight the influence of plastic film mulching, the irrigation schedule of the two scenarios was unified. Due to the lack of actual irrigation statistics, the irrigation schedule was set based on the irrigation experience of Yingke irrigation area. Yingke irrigation area is located in the middle reaches of the Heihe River basin, which could be regarded as a good representative for the region. The irrigation amount in Yingke irrigation area was 507–819 mm, and its average value (663 mm) was taken as the total amount of irrigation here. The irrigation events were four times, with border irrigation. The water stress was excluded from all scenarios in this study. It is assumed that there is no fertility stress, i.e., fertility is not limited. At the same time, due to the widespread application of pesticides in agricultural production for the study period, plant diseases and insect pests were not included in the two scenarios. In addition, according to the FAO recommended value, under the film mulching condition, the mulching proportion parameter was set to 70% and the mulching effect parameter was set to 100%. Under the condition of no film mulching, the film mulching proportion and the film mulching effect parameters were set as 0 (Table 1). Due to the lack of spatial distribution data of plastic film mulching in the Heihe River basin, this study considered the non-plastic film mulching scenario as the current basic scenario, and the simulation results of Y under the non-plastic film mulching condition were compared with the data in the 2012–2015 Statistical Yearbook of the Gansu Provincial Bureau of Statistics (http://tjj.gansu.gov.cn/ (accessed on 13 December 2020)). Table 1 shows the management parameter settings in different scenarios.
2.3.3. Tuning and Simulation of G-AquaCrop Model
Increasing the accuracy of the simulation parameter in each grid can improve the simulation of Y in the G-AquaCrop model and the accuracy of ET simulation. In addition to the spatial heterogeneity variables that can be obtained from remote sensing data, there are some mechanical parameters involved in the G-AquaCrop model. According to past studies [35], the nine parameters in Table 2 are the most sensitive parameters about maize Y and ET in the model, which would be adjusted in this study.
As mentioned above, accurate simulation of CC is the premise of accurate simulation of maize Y and ET. Therefore, monthly CC values of remote sensing retrieval were taken as the verification data of each grid’s parameter in the basic scenario (that is, without film mulching). With the help of Matlab R2018a software, a particle swarm optimization (PSO) algorithm was used to conduct gridding optimization and parameter tuning [65,66]. In order to highlight the effect of film mulching and simplify the simulation process, the same set of parameters was used for the corresponding grid of film mulching and no-film mulching scenarios, and only the proportion parameter and effect parameter of film mulching were changed.
The objective of parameter optimization is to minimize the difference between the CC values obtained by remote sensing and which output by the model on the corresponding date. The objective function is:
where refers to the CC value of remote sensing retrieval, refers to the CC value of the corresponding date output by AquaCrop model, and n is the number of during the growth period of maize in each grid.
Parameters were optimized via the server. The CPU was Intel (R) Xeon (R) Silver 4214 @2.20 GHz 2.19 GHz, and the operating memory was 128 GB. In the PSO algorithm, the number of particles and iterations were both set to 30. The elapsed time of optimization was 210 s for each grid. Due to the large number of grids in the research area, taking the year 2014 as an example, the number of grids was 9901. Therefore, all grids of each year were first grouped according to the sowing date to improve optimization efficiency. Some grids were selected for parameter optimization in each group, which (about 60) with the nearest grid number shared a set of parameter optimization results. The spatial distribution of parameter optimization objective function is shown in Figure 2, where, means the optimization result is Very good, means the optimization result is Good, and means the optimization result is Normal. It can be seen from Figure 2 that satisfactory results were obtained during parameter optimization for 4 years, providing a solid foundation for the accurate simulation of Y and ET. When is reached, the input parameters of this model are adopted as the optimal parameters, as shown in Table 2.
After the parameters were adjusted, each grid-specific parameter was brought into the G-AquaCrop model to carry out the simulation of Y and ET. Through extensive literature reading, we obtained some ground experimental observations from published papers. The data were collected from three ground stations in the Heihe River basin, including maize yield and leaf area index (LAI). Using Equation (5), LAI was converted into CC. The data details are shown in Table 3. Then, we fitted the simulation results of the corresponding grid with the observation data to evaluate the simulation effect of G-AquaCrop model. Due to the limited amount of ground observation data, this study also averaged the Y per unit area of grid in the same county without film mulching and compared it with the Y per unit area of the county obtained through the Statistical Yearbook. Here, we used the following statistical evaluation indicators: the root mean squared error (RMSE), normalized root mean squared error (NRMSE), Willmott’s index of agreement (d), and mean bias error (MBE).
where is field observation data or yearbook data, and is the simulated data. When represents field observation data, n represents the quantity of observation data; when represents yearbook data, n is the number of counties. For the RMSE, when the RMSE value is close to 0, the simulation results are in good agreement with the measured results. While for the d, the closer it is to 1, the better the simulation result is. The NRMSE can indicate the degree of overall consistency, and the MBE can represent positive and negative attributes of model bias.
2.4. Relationship between Mulching Areas and Meteorological Variables
The suitable areas for mulching were given by comparing the model output results under different conditions. Based on this result, the study attempts to explore the relationship between the mulching areas and their meteorological variables (accumulated temperature and precipitation). Here, the relationship between mulching areas and meteorological variables was expressed by a ratio, which of the number of grids recommended for mulching to the total number of grids under each meteorological condition:
where i refers to the specific total accumulated temperature value or total precipitation value in each grid during the whole crop growth period. When i stands for accumulated temperature, ; when i represents precipitation, . is the number of grids mulching under condition of i meteorological value; is the number of grids without mulching under i condition; is the ratio of the recommended grid number for film mulching to the total grid number under the same accumulated temperature value or precipitation value.
3. Results
3.1. Spatial Distribution of Sowing Date
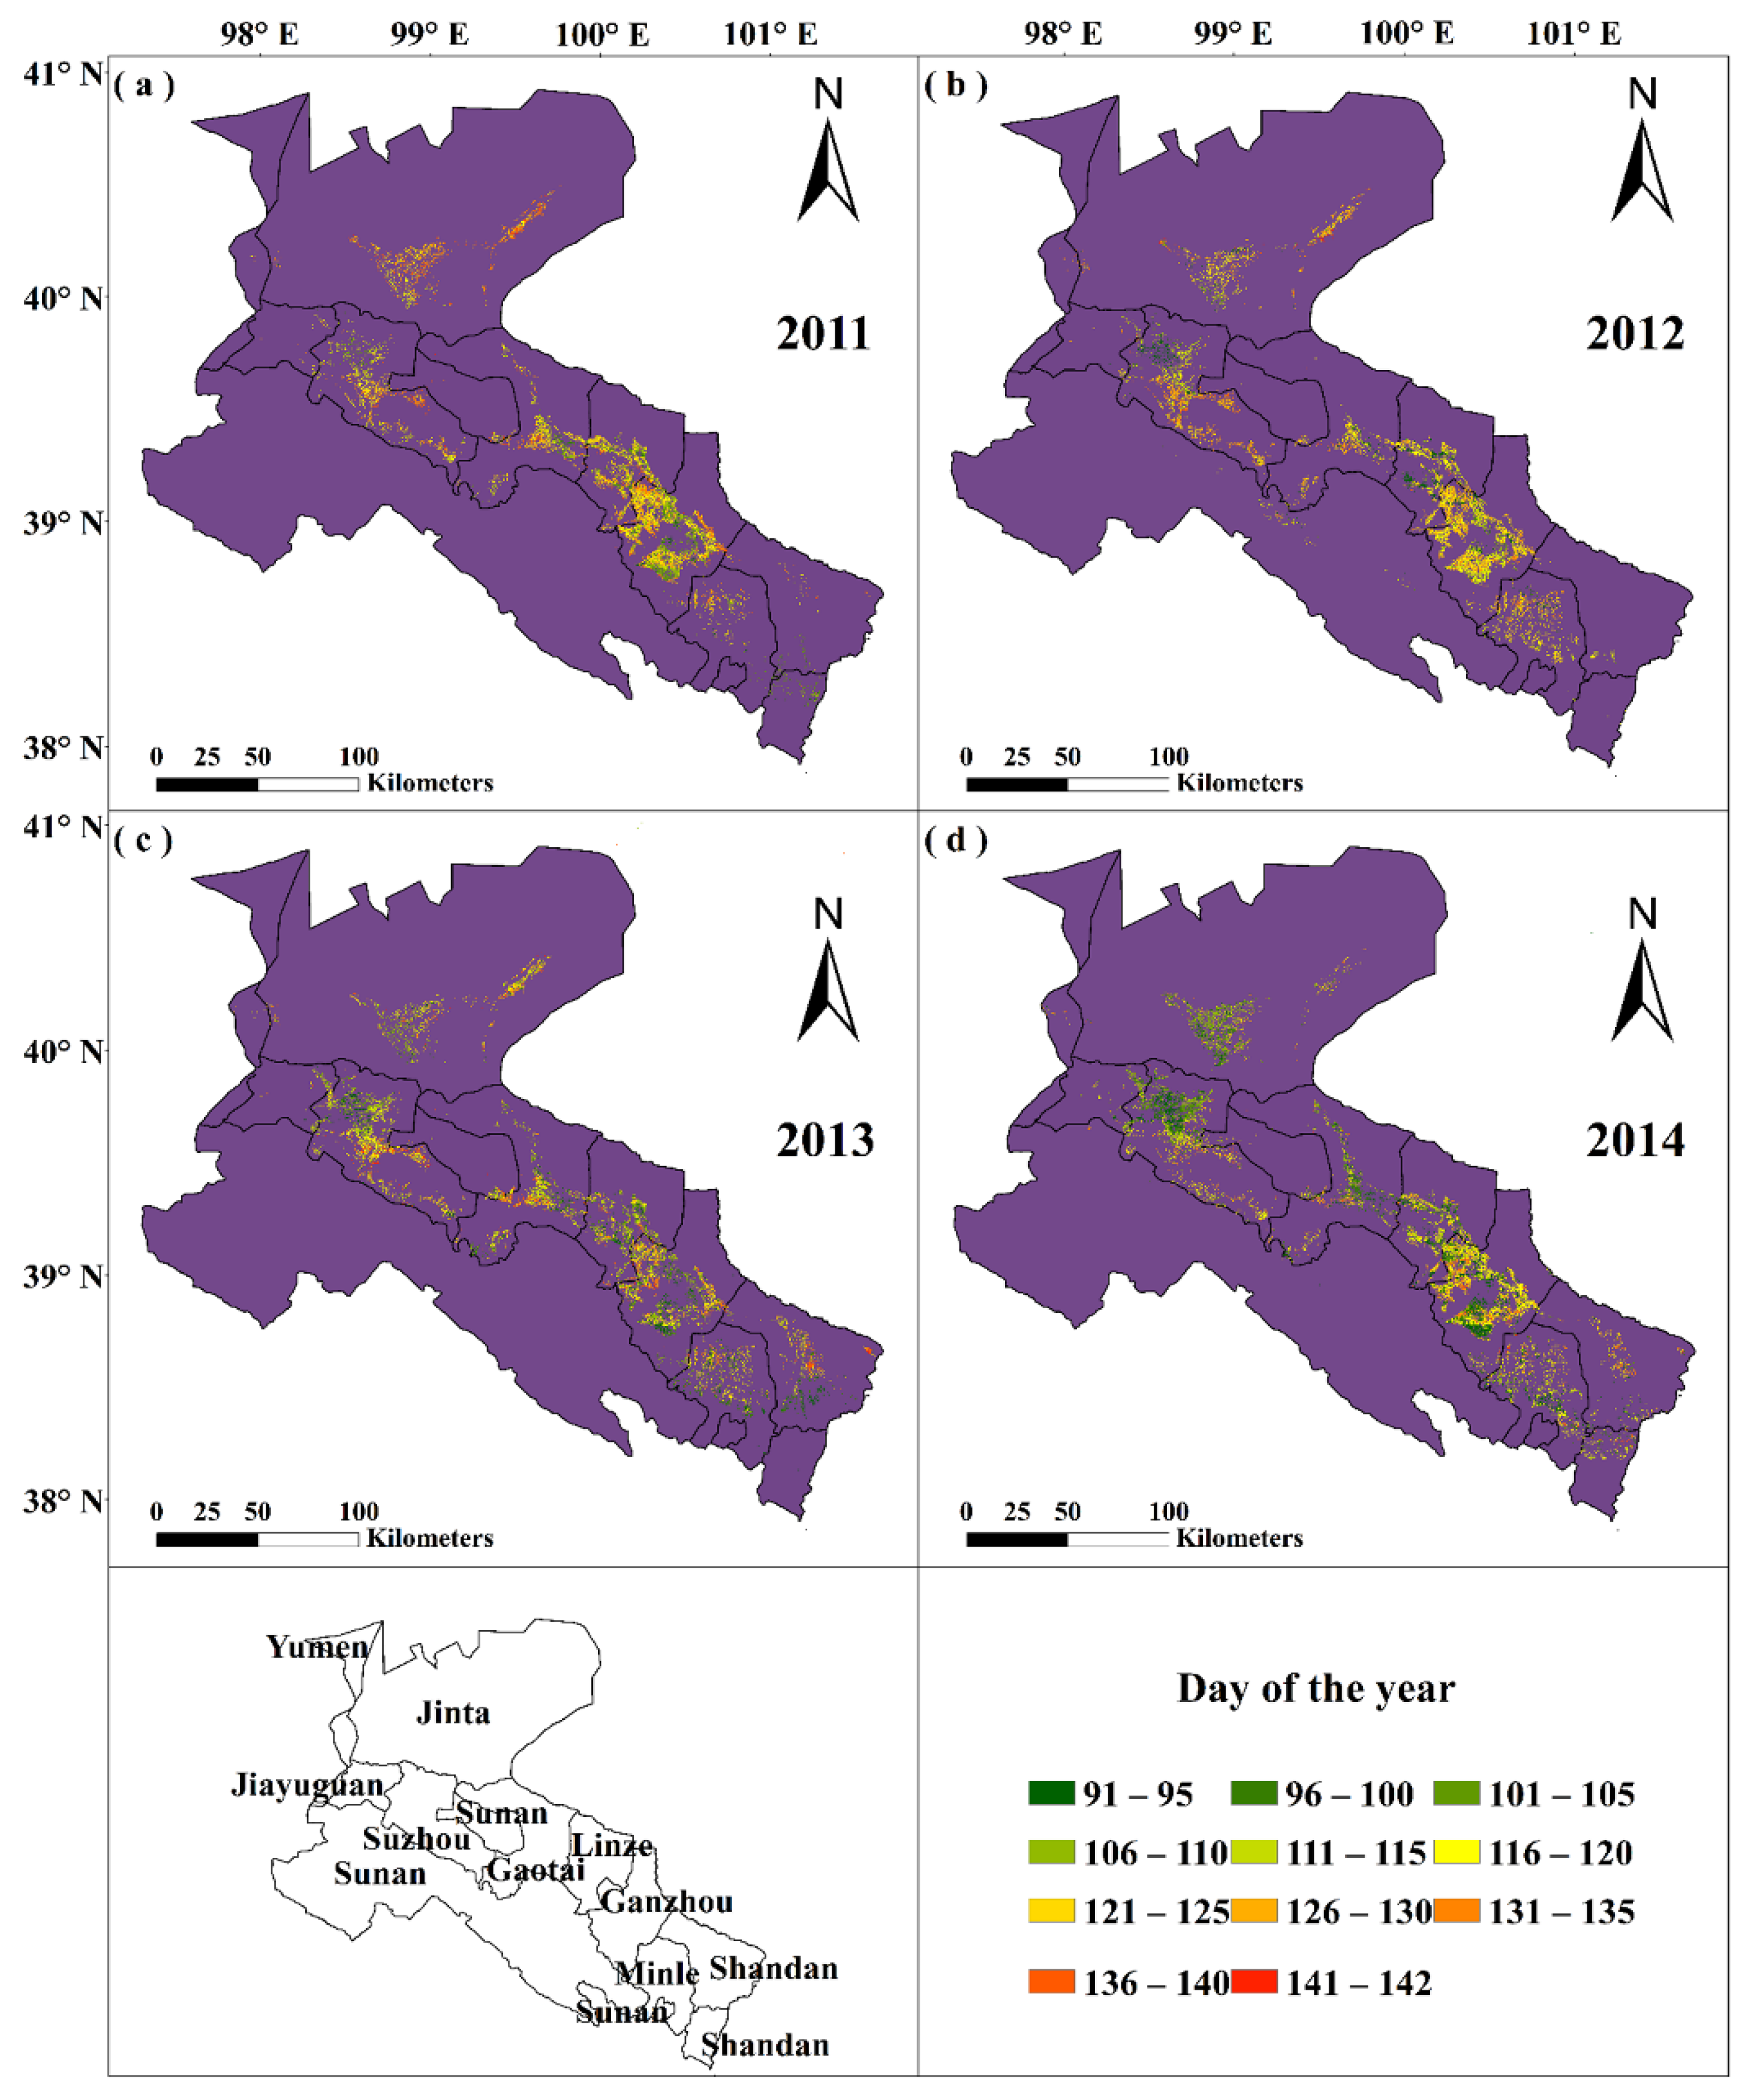
Through the inversion method of the sowing date introduced above, the spatial distribution map of the maize sowing dates from 2011 to 2014 in the Heihe River basin was obtained, as shown in Figure 3. As can be seen from Figure 3, the sowing date of maize in the Heihe River basin was approximately from the 91st day to the 142nd day of a year, with a span of 52 days. In most areas, the sowing dates are concentrated on the 111th–125th day, around 22 April. From the spatial perspective, this part of the region is densely distributed in the Ganzhou and Linze counties. The maize areas in these two counties are irrigated areas, where unified field management measures are implemented. The sowing date of maize in the irrigated areas is about 22 April, which is consistent with the results obtained in this study. However, in areas outside the irrigated areas, such as Jinta and Suzhou, there are certain differences between the sowing dates and the irrigated areas due to differences in geography, climate, and crop varieties. It is obvious that the sowing date in the northern part of the Ganzhou region is generally early, which may be related to the maize varieties planted in this region. Ganzhou is the largest maize seed production base at the county level in China. However, some studies have shown that in actual production, the seed maize should be separated from the sowing date of field maize with a flexible time of 30–40 days [69] to better carry out seed production. This is why the sowing date in the northern region of Ganzhou is regularly advanced.
3.2. Spatial Distribution of Y under Different Scenarios
Figure 4 shows the spatial distribution of maize Y per unit area in the Heihe River basin from 2011 to 2014 under the two scenarios. Figure 4a,c,e,g represents the no-film mulching scenario for the four respective years (top to bottom), and Figure 4b,d,f,h represents the film mulching scenario. In general, the maximum Y per unit area of maize in the Heihe River basin was 17.6–20.7 t/ha, while the average Y was only 8.6–10.0 t/ha. These values indicated that there was a large difference in the spatial distribution of maize Y per unit area. At the same time, after film mulching, the maximum Y did not increase significantly, but in a local range, film mulching did improve the Y of maize to a certain extent. From one point of view, plastic film mulching is already in use in some areas. If plastic film mulching was covered in a wide range, there would be two consequences: first, plastic film mulching could not reach the desired effect; second, it would put great pressure on the ecological environment.
Figure 5 shows the comparison between the observed and simulated Y and CC of maize at the three field stations in the Heihe River basin. Through consulting the published literature, we obtained some data of maize planting experiment in Heihe River basin. After excluding the data with inconsistent planting years and unclear planting locations, data of the three field stations in Table 3 were finally selected for comparison. The d and R2 values for maize Y and CC were larger than 0.90, indicating good agreement for both Y and CC. The simulated Y slightly underestimated the observed values, with MBE of −0.51 t/ha. While the simulated CC slightly overestimated the observed values, with MBE of 1.6%. Considering all the statistical indicators, the G-AquaCrop model has good simulation performance. The results of Zhang et al. (2021) also included 5 Y values [70]. All the statistical indicators about Y in our study are superior to the results of Zhang et al.
Table 4 shows the fitting effect of maize Y per unit area at the county level in the Heihe River basin from 2011 to 2014. The results showed that, under the condition of no-film mulching, the RMSE and NRMSE of spatial average Y reached 1.29 t/ha and 14.37 (dimensionless), respectively. The absolute values of MBE were not larger than 0.77 t/ha. However, the absolute value of maize yield MBE was 1.19 t/ha in the study of Zhang et al. (2021) [70]. For 9901 grids in the Heihe River basin, the fitting accuracy of our study is acceptable. After film mulching, the Y in each county was generally improved, to a certain extent. However, the simulated Y in Shandan in 2013 and 2014 was abnormally low. According to the meteorological data of these two years, spring drought of different degrees occurred in Shandan from January to April in 2013 and 2014. The government and agricultural management departments issued early warning information in advance and suggested farmers to take countermeasures. Therefore, the Statistical Yearbook data on Y did not show much decline. However, in the G-AquaCrop model simulation, empirical irrigation data was still used, resulting in abnormally low values. Similarly, spatial averaging weakened the local effect of film mulching, as will be described in detail in Section 3.3.
In general, the distribution of maize in the irrigated areas of Ganzhou and Linze was relatively concentrated and the Y value was relatively stable, which is closely related to the mature planting system and field management measures in the irrigated areas. Han et al. (2019) obtained the spatial distribution of maize Y in the Yingke Irrigated Area in 2012 and 2015 [45]. In terms of quantity, the maize Y in the Yingke Irrigated Area ranged from 7.8 to 13.7 t/ha, which was consistent with the results obtained in this study. At the same time, Han et al. (2019) also found that the reason why the Y of 2015 was higher than that of 2012 might be that the sowing date of 2015 was about 10 days earlier than that of 2012. Compared with Figure 3 and Figure 4, in this study, the sowing date of northern Suzhou was earlier and its Y was higher, which was consistent with the results of Han et al. (2019).
3.3. Change in Y after Film Mulching
The Figure 6 shows the spatial distribution of Y change ratio after plastic film mulching in the Heihe River basin from 2011 to 2014. It can be clearly seen from the spatial three-dimensional diagrams that the Y change of most areas in the basin is −2–0%, and the negative value mainly comes from the random error of the model. In this study, the maize Y in the irrigated area after film mulching did not increase significantly, while the Y in Yumen, Jiayuguan, Jinta, Suzhou, Sunan, Shandan, and Minle counties significantly increased after film mulching, with the maximum increase of nearly 8%. There are two main reasons. First, the Y of maize in the irrigated area hardly increased after plastic film mulching, which may be due to the improvement of irrigation system, water and fertilizer management, and field management measures in the irrigated area at the present stage. Plastic film mulching may have been used in a large range, and the Y potential of maize has been fully tapped. However, since the spatial distribution of the film-mulched areas in the Heihe River basin could not be obtained at the present stage, this study assumed that the whole Heihe River basin was not film-mulched during parameter adjustment, and the CC data of remote sensing retrieval used in parameter adjustment was the actual CC. It is possible that the CC used for the parameter adjustment may be relatively larger in the irrigated area. Second, Jiayuguan, Jinta, and Suzhou are located in the middle and lower reaches of the Heihe River basin, whose latitudes are higher than that of the other counties, so the corresponding temperature is relatively low and the annual average precipitation is also less. Film mulching can increase soil surface temperature and reduce soil evaporation, thus promoting various physiological processes of maize plants. Therefore, after film mulching, the maize Y of Jiayuguan, Jinta, and Suzhou improved to a certain extent.
3.4. ET Changes after Film Mulching
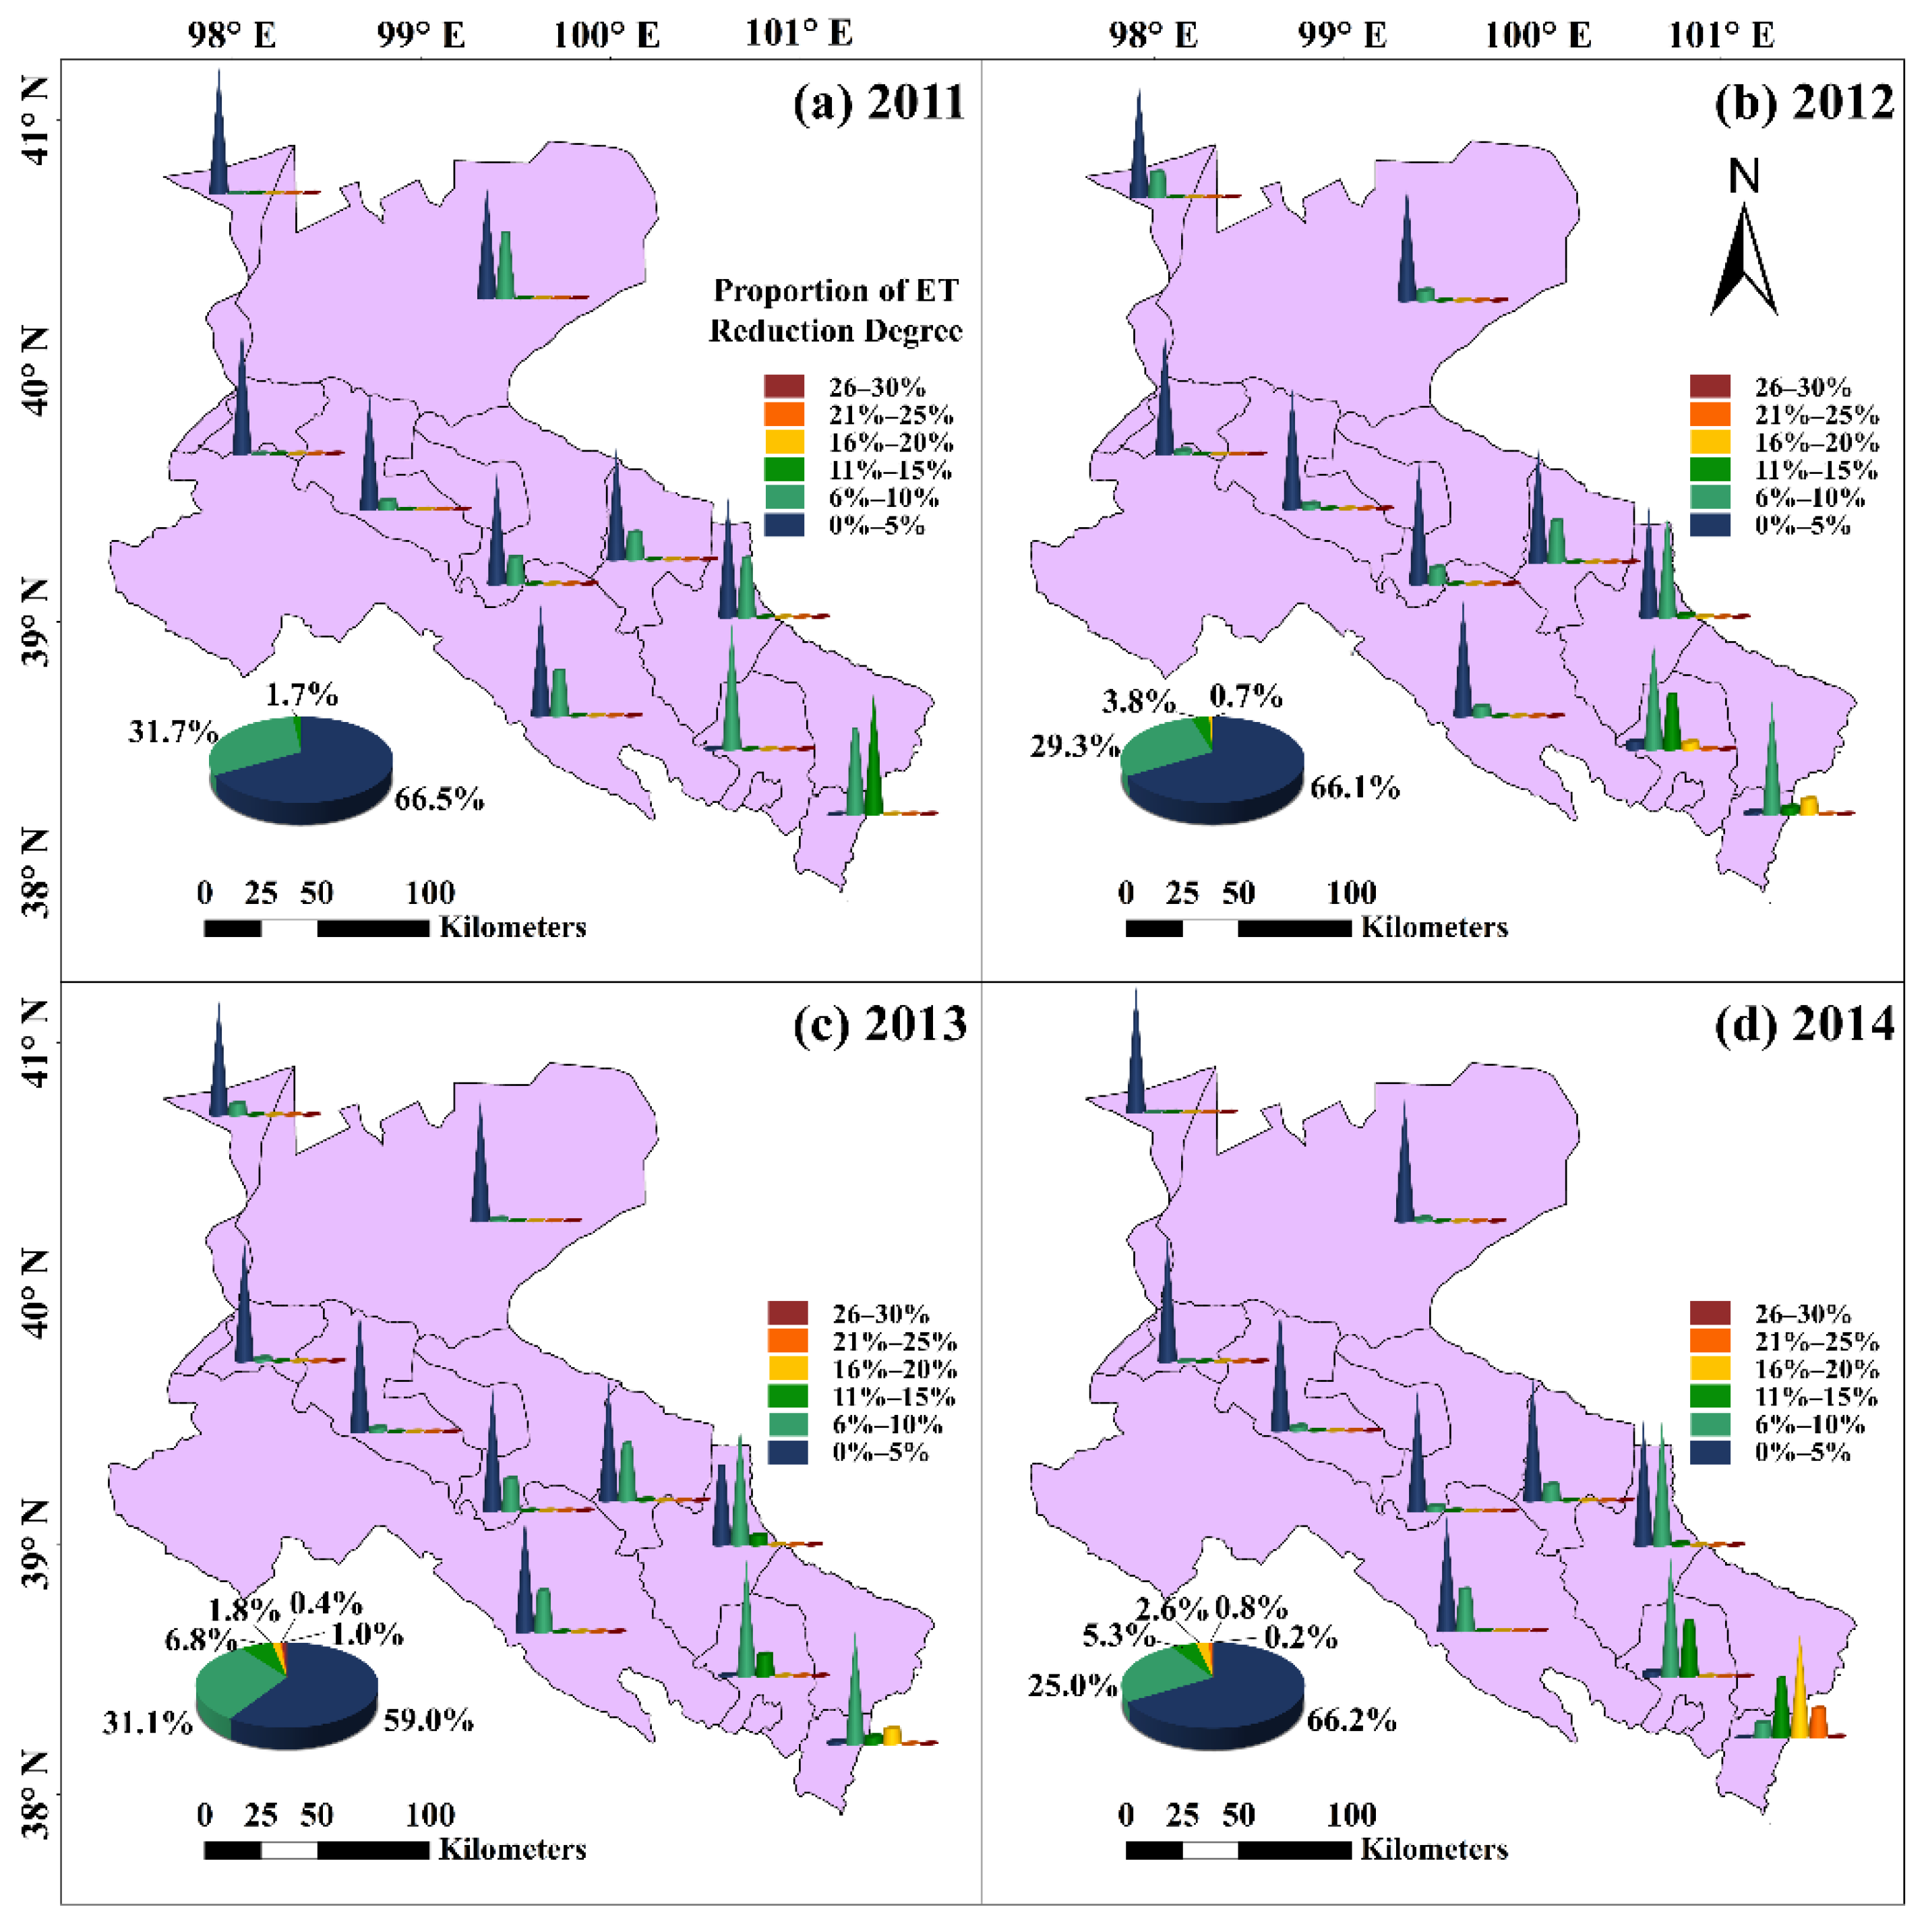
Figure 7 shows the spatial distribution of changes in ET after plastic film mulching in the Heihe River basin from 2011 to 2014. As can be seen from these diagrams, after plastic film mulching, ET in the whole maize planting area in the Heihe River basin decreased, with the maximum reduction reaching 30%. Further, ET in most areas decreased between 0.9 and 10.0%, including the irrigated areas with relatively perfect field management measures. The areas with large ET reduction were concentrated in Shandan and Minle, especially in Shandan, where the ET reduction reached 20–30% in 2014. This was mainly due to a large degree of spring drought in Shandan from January to April 2014, which reduced the soil evaporation by plastic film mulching.
3.5. Suggestions for Film Mulching According to Changes in Yield
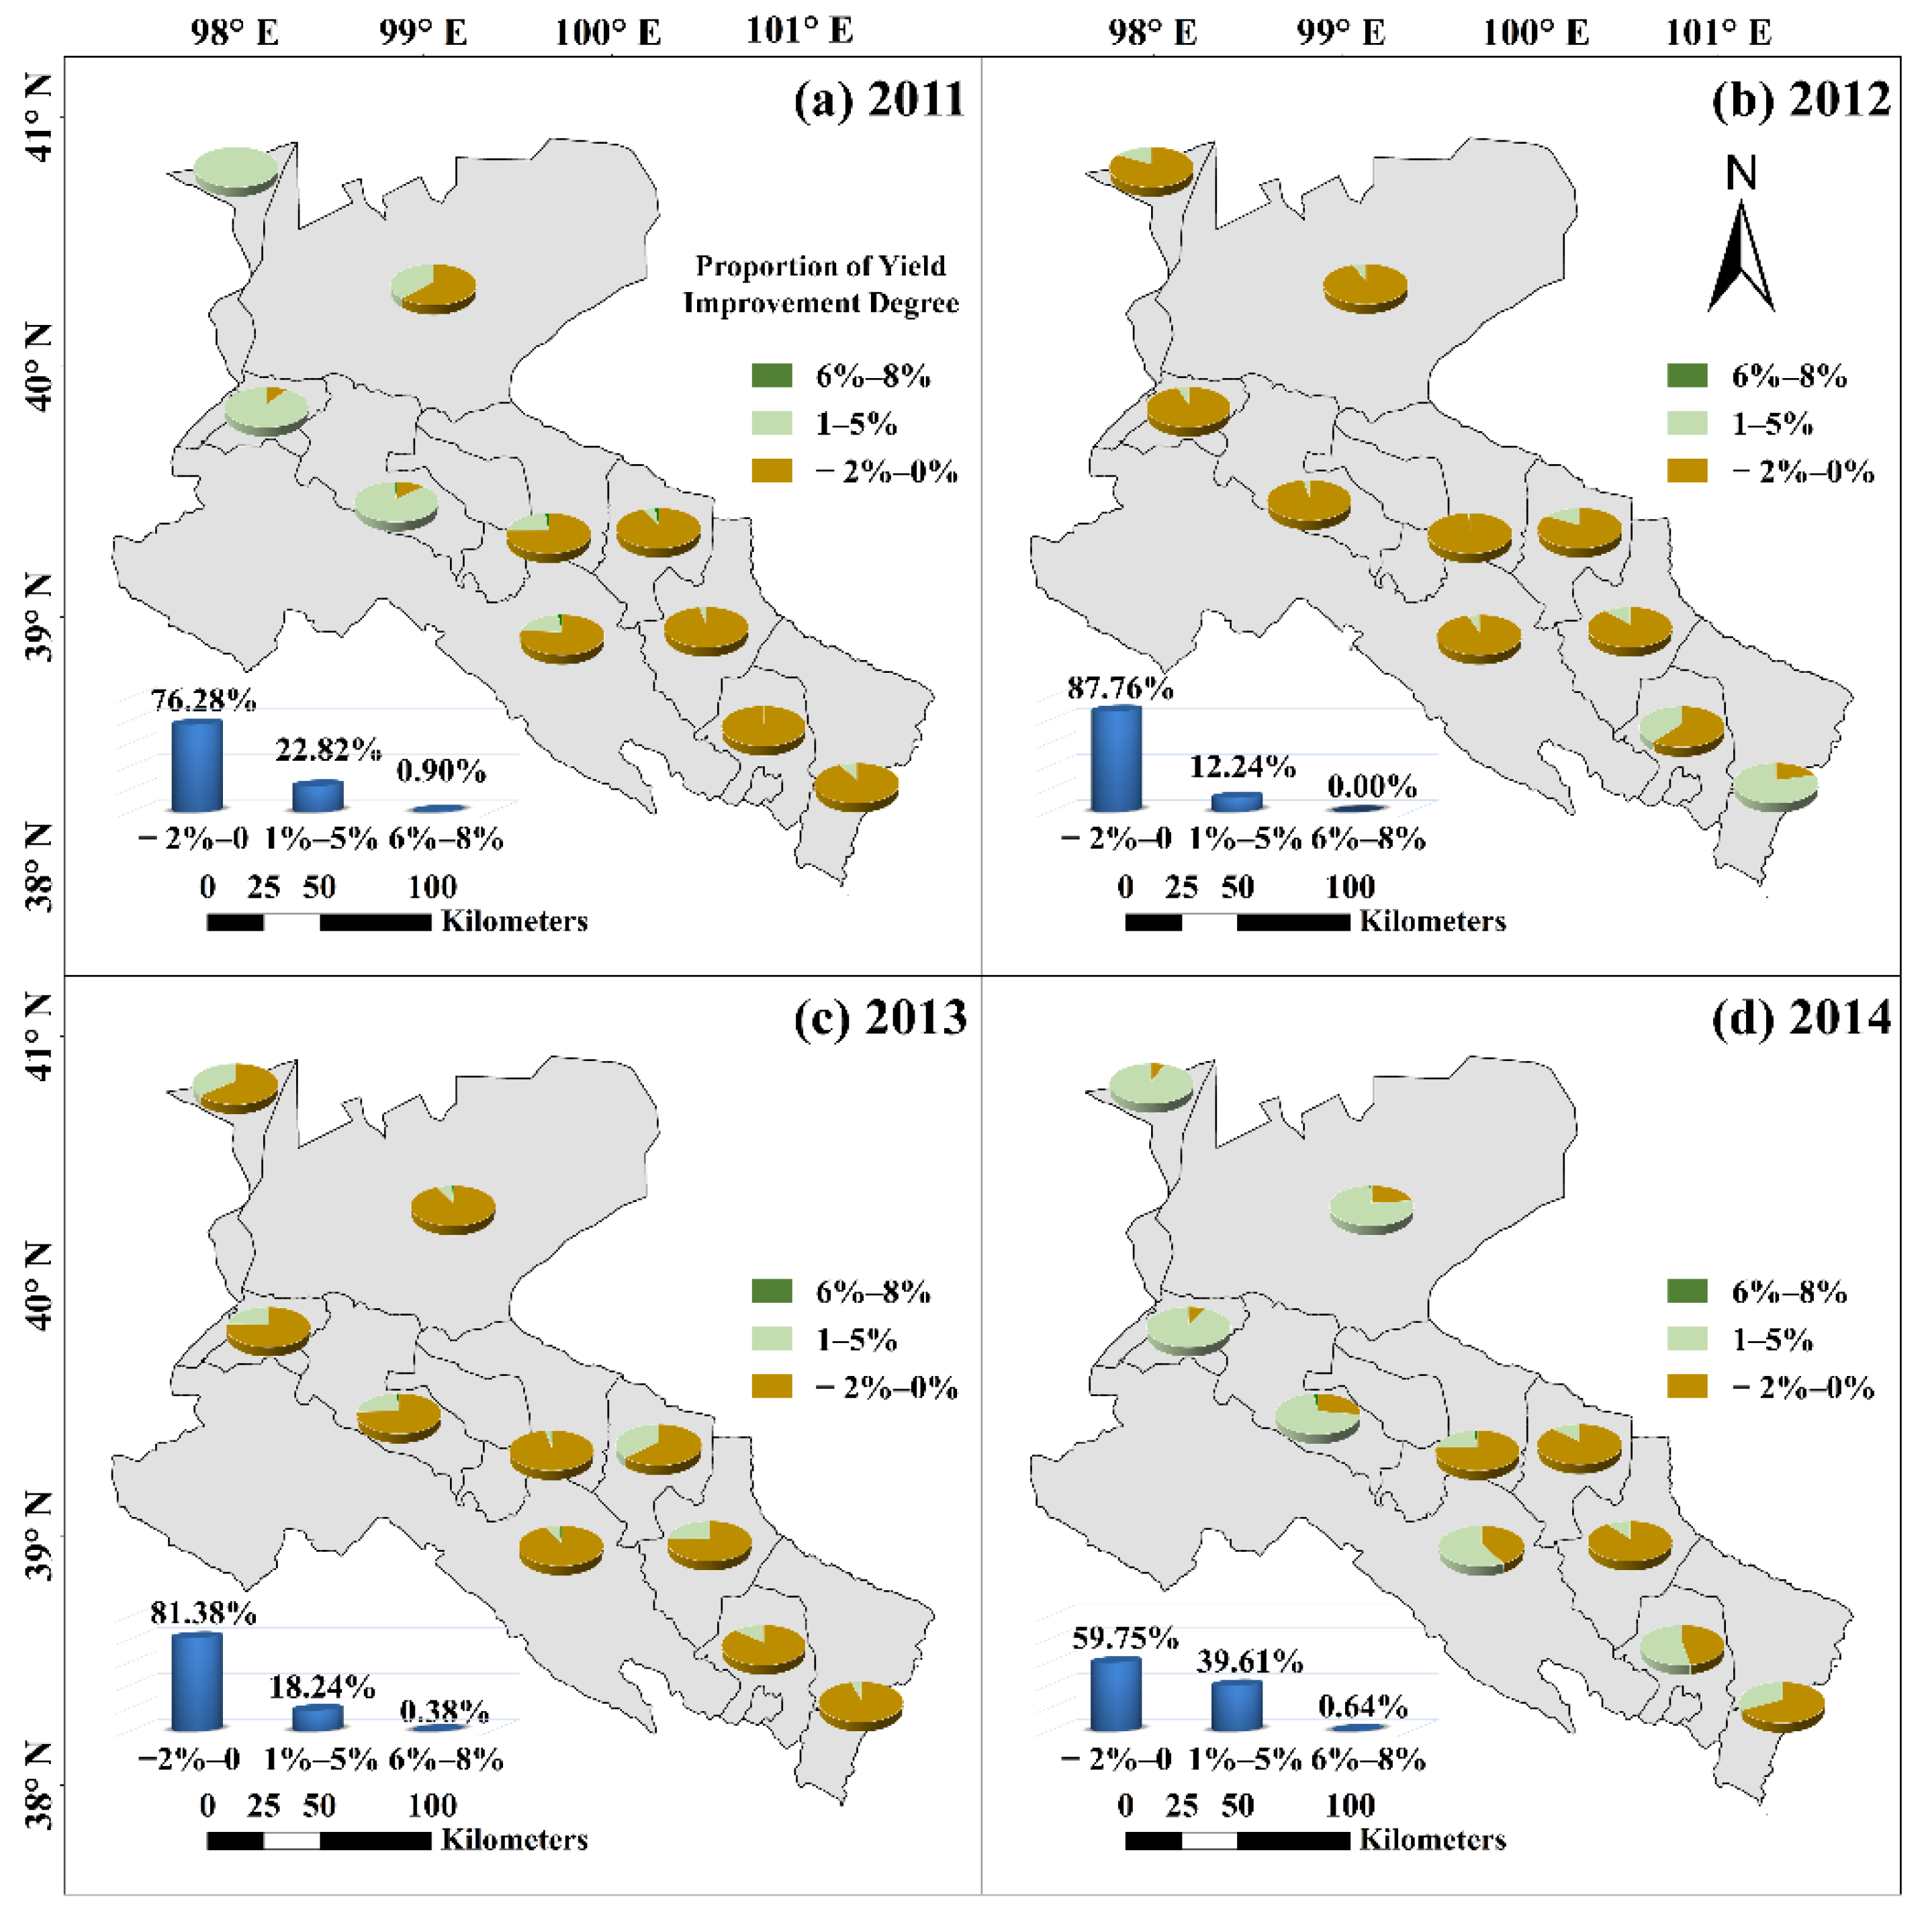
On the basis of the spatial distribution in Figure 6, a statistical chart of Y change range after plastic film mulching in the Heihe River basin from 2011 to 2014 is shown in the bar chart of each plot in Figure 6.
As can be seen, in four years, the areas where Y barely changed after plastic film mulching accounted for 59.8–87.8% of the maize cultivation area in the entire Heihe River basin. Among the areas where Y increased, the areas where Y increased by 0.1–5.0% accounted for the largest proportion, and the areas where Y increased by 5.1–8.0% accounted for less than 0.9% of the maize planting area. As mentioned above, the areas with no significant change in maize Y after plastic film mulching was mainly the irrigated areas in the middle reaches of the river basin, where various field management measures are relatively mature and crop Y potential is largely developed. On this basis, the areas with improved Y in the simulation should be encouraged to expand the area mulched with film in the actual production at the present stage to increase the maize yield. Figure 8 presents the proposed map of the mulched area according to different targets, including changes of maize Y (bottom layer in each plot), ET (middle layer), and Y and ET (top layer). As can be seen from the bottom layer in each plots, it is recommended to continue to expand the area of plastic film mulching in the southern areas of Jinta, Suzhou, Minle, and Shandan to obtain a higher yield. Irrigated areas continue to maintain the current status of field management.
3.6. Suggestions Based on ET Changes
On the basis of the spatial distribution in Figure 7, we summarized the statistical chart of changes in ET after plastic film mulching in the Heihe River basin from 2011 to 2014, as shown in the pie chart of Figure 7. From 2011 to 2014, after plastic film mulching, ET in the whole Heihe River basin decreased by varying degrees, while 59.8–66.6% of the region only decreased by 5.0% (the pie chart of Figure 7). Considering that the plastic film cannot be degraded in a short time after use, leading to white pollution to the ecological environment of the area, the water-saving benefits brought by the plastic film mulching will be greatly reduced. Therefore, it is not necessary to expand film mulching in areas where ET reduction is less than 5%. Increasing the plastic film mulching area in the areas where ET reduction exceeds 5% can reduce the water consumption of crops to a certain extent, thus promoting the sustainable development of water-saving agriculture. With the above results, a proposed film mulching map for the Heihe River basin was drawn based on the distribution of ET reduction during 2011–2014, as shown in the middle layer of each plot in Figure 8. The results indicate that it is more suitable to increase the area of film mulching in Ganzhou, Minle, Shandan, and southeast of Linze in the Heihe River basin, while it is not necessary to increase it in the other areas.
3.7. Suggestions Based on Y and ET Changes
The ability of plastic mulch to reduce soil evaporation and increase yield provides a feasible solution to improve crop water productivity. Therefore, combined with the lower and middle layers of each plot in Figure 8, it is recommended to apply film mulching in areas with increased Y and reduction of more than 5% in ET, mainly distributed in some areas of Ganzhou, Minle, Shandan, and other counties. Mulching film in this area can improve WP and achieve water saving and yield increase (the upper layer of each plot in Figure 8).
3.8. Relationship between Mulching Areas and Meteorological Variables
Relationship between mulching areas and meteorological variables were studied during the period 2011–2014 (Figure 9). As can be seen from Figure 9a, the proportion of film mulching is the highest when the accumulated temperature is between 2100 and 2400 d°C. When the accumulated temperature exceeds 2700 d°C and below 1800 d°C, there is almost no film mulching. The reason is obvious: due to full irrigation, a large accumulated temperature can support the growth of maize independently, while too small accumulated temperature cannot meet the physiological requirements of maize germination. Even with measures such as film mulching, maize cannot grow normally. Figure 9b shows the relationship between film mulching areas and precipitation. As the study area is located in an arid area, the highlights in the figure are concentrated in the part with low precipitation. It can be seen that the proportion of film mulching is highest when the precipitation is between 300 and 400 mm. Figure 9c shows the comprehensive influence of accumulated temperature and precipitation. With the increase of accumulated temperature and the decrease of precipitation, the proportion of film mulching increases. Meteorological conditions suitable for mulching are concentrated in the lower right corner of Figure 9c. By referring to this figure, you can clearly know the accumulated temperature and precipitation most suitable for plastic film mulching. Conversely, when you want to know whether the climatic conditions of an area are suitable for mulching, you can also easily obtain the results by referring to it. Therefore, Figure 9c provides a new method for judging whether mulching is suitable for each maize cultivation area in the Heihe River basin, which greatly improves the efficiency of determining.
4. Discussion and Conclusions
To study the effects of plastic film mulching on maize yield and ET in arid areas, we chose the Heihe River basin as a typical representative to explore the impacts at the regional scale. The gridding large-scale G-AquaCrop model was established fully considering spatial heterogeneity by using remote sensing data. The parameters of the G-AquaCrop model were optimized by the particle swarm optimization method. The yield and canopy coverage of maize were verified by field data, and the R2 was larger than 0.92.
There is a large amount of plastic-mulched farmland in China [71]. However, the records of the current situation of plastic film mulch used on all statistical yearbooks only included the mulching weight used. The spatial distribution of plastic film mulch was not recorded. This would undoubtedly cause some obstacles to exploring the application effect and applicability of plastic film mulching in the region. Some scholars used remote sensing technology to identify the situation of plastic film mulch [72,73,74]. They often obtained original images from UVA or high-resolution satellites. For a large area, a large amount of input is required. At the same time, the crop canopy coverage was extensive when it reached the middle and late growth period. The crop canopy would cover the ground. This could cause the identification results to be not reasonable.
The skillful strategy in our modeling approach realizes relatively reliable simulation in evaluating the effects of film mulching in the studied region. We set up two scenarios: no-mulching and plastic film mulching, and the comparison of the difference between the two scenarios is focused. There were two possible situations if there was little difference between the two scenarios. In the first situation, the area was already mulched with plastic film. The second situation was that plastic film mulch was not applicable in the area. In either situation, the area did not need additional mulching. Too much plastic film mulching not only alters soil moisture distribution, but also reduces crop yields over time. As mentioned earlier, the G-AquaCrop model does not take into account crop disease and insect infestation. Meanwhile, as pesticides have been widely used in the Heihe River basin, the effects of disease and pests are not considered here. From the perspective of the model mechanism, the limitation caused by field data loss was avoided by comparing the two scenarios.
Compared with no mulching, plastic film mulching could retain soil moisture and significantly reduce soil evaporation. The biggest drop is 30%. Plastic film mulching could improve maize yield, but the effect of it on maize yield varied spatially. Considering the environmental pressure caused by plastic film mulching, the suggestions for mulching expansion were given from different angles. In general, expanding the plastic film mulching area in the upper and lower reaches of the Heihe River basin could produce greater positive benefits. The middle reaches of the Heihe River basin where the irrigation area is located have been fully explored. This research provides a quantitative and spatial assessment of plastic film mulching application, which helps better to understand management practices.
There are also some limitations of the current study work. Although the results of this study by comparing the differences between the two scenarios are reliable, they can be further improved. With the emergence of additional higher-resolution remote sensing products, we will continue to carry out remote sensing retrieval of actual film mulching conditions and bring data into our research to obtain more accurate and reliable simulation results. The study period is relatively short due to the available land use data on spatial crop varieties, which is important for the regional simulation study. The used data for the period of 2011–2014 was well evaluated by using Google Earth high-resolution images and field survey data, and the overall accuracy reached 92.19%. Meanwhile, the 4 years for the period of 2011–2014 vary in terms of the precipitation variability. For example, the year 2013 and 2014 is the spring drought year, and the year 2012 is with abundant precipitation. The regional precipitation variability has been reflected to a certain degree. Long-term data support would be expected for the next-step investigation.
In terms of research results, the G-AquaCrop model has the original advantages of the AquaCrop model, while overcoming the limitation that the AquaCrop model can only be used on field points. Due to the water-driven attribute of the G-AquaCrop model, its outputs were sensitive to water. Ganzhou, Linze, Gaotai, Sunan, and Suzhou counties are located in the middle reaches of Heihe River basin, which are closed to the Yingke irrigation area. The irrigation schedule in this study was set according to the experience of Yingke irrigation area. Therefore, the yield simulation results in these counties were relatively good. As can be seen from Table 4, the G-AquaCrop model only slightly overestimated the maize yield of these counties. This was also a reflection of the full irrigation (no water stress) setup in this study. Jiayuguan, Jinta, and Yumen counties are located in the lower reaches of the Heihe River basin and have less precipitation. The maize yields of the three counties in Table 4 were underestimated. However, it also reflected that the G-AquaCrop model could well capture water changes, which was suitable for the northwest arid region with water shortage.
Moreover, based on mathematical statistics, the accumulated temperature and precipitation conditions with the maximum probability of plastic film mulching were obtained. The result provided a new method for quickly judging whether a certain area was suitable for plastic film mulching.
Author Contributions
Conceptualization, J.N.; methodology, J.N. and Q.S.; software, Q.S.; validation, N.L.; formal analysis, Q.S.; investigation, Q.S.; resources, J.N.; data curation, Q.S. and N.L.; writing—original draft preparation, Q.S.; writing—review and editing, J.N., N.L. and B.S.; visualization, Q.S.; supervision, J.N.; funding acquisition, J.N. All authors have read and agreed to the published version of the manuscript.
Funding
This work was financially supported by the National Natural Science Foundation of China (51621061, 51679233), the Program of Introducing Talents of Discipline to Universities (B14002) provided by Ministry of Education of the People’s Republic of China.
Institutional Review Board Statement
Not applicable.
Informed Consent Statement
Not applicable.
Data Availability Statement
The data used in this research will be available (by the corresponding author), upon reasonable request.
Acknowledgments
Thanks for land use data provided by the Heihe Plan Science Data Center; meteorological data provided by the European Centre for Medium-Range Weather Forecast; soil types and hydraulic properties data provided by the National Tibetan Plateau Data Center; MODIS-EVI/NDVI data provided by Geospatial Data Cloud. The authors thank the reviewers for their constructive comments and useful suggestions on earlier versions of this manuscript.
Conflicts of Interest
The authors declare no conflict of interest.
References
- Liu, Y.; Li, Y.F.; Li, J.S. Effects of nitrogen management on the growth and yield of mulched and drip-irrigated maize in Northeast Black Soil Regions. J. Hydraul. Eng. 2014, 45, 529–536. (In Chinese) [Google Scholar]
- Li, S.X.; Wang, Z.H.; Li, S.Q.; Gao, Y.J.; Tian, X.H. Effect of plastic sheet mulch, wheat straw mulch, and maize growth on water loss by evaporation in dryland areas of China. Agric. Water Manag. 2013, 116, 39–49. [Google Scholar] [CrossRef]
- Qin, W.; Hu, C.; Oenema, O. Soil mulching significantly enhances yields and water and nitrogen use efficiencies of maize and wheat: A meta-analysis. Sci. Rep. 2015, 5, 16210. [Google Scholar] [CrossRef] [PubMed]
- Lal, R. Sustainable intensification of China’s agroecosystems by conservation agriculture. Int. Soil Water Conserv. Res. 2018, 6, 1–12. [Google Scholar] [CrossRef]
- Li, Q.; Li, H.; Zhang, L.; Zhang, S.; Chen, Y. Mulching improves yield and water-use efficiency of potato cropping in China: A meta-analysis. Field Crop. Res. 2018, 221, 50–60. [Google Scholar] [CrossRef]
- Gao, H.; Yan, C.; Liu, Q.; Li, Z.; Yang, X.; Qi, R. Exploring optimal soil mulching to enhance yield and water use efficiency in maize cropping in China: A meta-analysis. Agric. Water Manag. 2019, 225, 105741. [Google Scholar] [CrossRef]
- Huang, Y.; Liu, Q.; Jia, W.; Yan, C.; Wang, J. Agricultural plastic mulching as a source of microplastics in the terrestrial environment. Environ. Pollut. 2020, 260, 114096. [Google Scholar] [CrossRef]
- Kang, S.; Hao, X.; Du, T.; Tong, L.; Su, X.; Lu, H.; Li, X.; Huo, Z.; Li, S.; Ding, R. Improving agricultural water productivity to ensure food security in China under changing environment: From research to practice. Agric. Water Manag. 2017, 179, 5–17. [Google Scholar] [CrossRef]
- Jiang, X. Study on China’s Food Security and the “Three Rural Issues”. J. Shanxi Agric. Sci. 2014, 42, 771–785. (In Chinese) [Google Scholar]
- Wang, J.; Li, Y.; Huang, J.; Yan, T.; Sun, T. Growing water scarcity, food security and government responses in China. Glob. Food Secur. 2017, 14, 9–17. [Google Scholar] [CrossRef]
- He, J.; Yang, X.; Li, Z.; Zhang, X.; Tang, Q. Spatiotemporal Variations of Meteorological Droughts in China During 1961–2014: An Investigation Based on Multi-Threshold Identification. Int. J. Disaster Risk Sci. 2016, 7, 63–76. [Google Scholar] [CrossRef] [Green Version]
- Ayantobo, O.O.; Li, Y.; Song, S.; Yao, N. Spatial comparability of drought characteristics and related return periods in mainland China over 1961–2013. J. Hydrol. 2017, 550, 549–567. [Google Scholar] [CrossRef]
- Fu, J.; Niu, J.; Kang, S.; Adeloye, A.; Du, T. Crop production in the Hexi Corridor challenged by future climate change. J. Hydrol. 2019, 579, 124197. [Google Scholar] [CrossRef]
- Niu, J.; Kang, S.; Zhang, X.; Fu, J. Vulnerability analysis based on drought and vegetation dynamics. Ecol. Indic. 2019, 105, 329–336. [Google Scholar] [CrossRef]
- Zhang, W.; Nie, Z.; Liu, S.; Wang, J. Threshold of influence of water resources in the Heihe River valley, northwestern Gansu, China on the ecological environment variation of the lower reaches. Geol. Bull. China 2006, 25, 244–250. (In Chinese) [Google Scholar]
- Li, X.; Lu, L.; Cheng, G.; Xiao, H. Quantifying landscape structure of the Heihe River Basin, north-west China using FRAGSTATS. J. Arid Environ. 2001, 48, 521–535. [Google Scholar] [CrossRef]
- Zhou, J.; Hu, B.X.; Cheng, G.; Wang, G.; Li, X. Development of a three-dimensional watershed modelling system for water cycle in the middle part of the Heihe rivershed, in the west of China. Hydrol. Process. 2011, 25, 1964–1978. [Google Scholar] [CrossRef]
- Yaghi, T.; Arslan, A.; Naoum, F. Cucumber (Cucumis sativus, L.) water use efficiency (WUE) under plastic mulch and drip irrigation. Agric. Water Manag. 2013, 128, 149–157. [Google Scholar] [CrossRef] [Green Version]
- Liu, E.K.; He, W.Q.; Yan, C.R. ‘White revolution’ to ‘white pollution’—agricultural plastic film mulch in China. Environ. Res. Lett. 2014, 9, 091001. [Google Scholar] [CrossRef] [Green Version]
- Jiang, X.J.; Liu, W.; Wang, E.; Zhou, T.; Xin, P. Residual plastic mulch fragments effects on soil physical properties and water flow behavior in the Minqin Oasis, northwestern China. Soil Tillage Res. 2017, 166, 100–107. [Google Scholar] [CrossRef]
- Gao, H.; Yan, C.; Liu, Q.; Ding, W.; Chen, B.; Li, Z. Effects of plastic mulching and plastic residue on agricultural production: A meta-analysis. Sci. Total Environ. 2019, 651, 484–492. [Google Scholar] [CrossRef] [PubMed]
- Rockström, J. Biomass production in dry tropical zones: How to increase water productivity. In Land and Water Integration and River Basin Management; FAO: Rome, Italy, 1995; pp. 31–48. [Google Scholar]
- Kijne, J.W.; Barker, R.; Molden, D. Water Productivity in Agriculture: Limits and Opportunities for Improvement; CAB International: Wallingford, UK, 2003. [Google Scholar]
- Comas, L.H.; Trout, T.J.; DeJonge, K.C.; Zhang, H.; Gleason, S.M. Water productivity under strategic growth stage-based deficit irrigation in maize. Agric. Water Manag. 2019, 212, 433–440. [Google Scholar] [CrossRef]
- Steduto, P.; Hsiao, T.C.; Raes, D.; Fereres, E. AquaCrop—The FAO crop model to simulate yield response to water: I. Concepts and underlying principles. Agron. J. 2009, 101, 426–437. [Google Scholar] [CrossRef] [Green Version]
- Raes, D.; Steduto, P.; Hsiao, T.C.; Fereres, E. AquaCrop—The FAO crop model to simulate yield response to water: II. Main algorithms and software description. Agron. J. 2009, 101, 438–447. [Google Scholar] [CrossRef] [Green Version]
- Hsiao, T.C.; Heng, L.; Steduto, P.; Rojas-Lara, B.; Raes, D.; Fereres, E. AquaCrop—The FAO crop model to simulate yield response to water: III. Parameterization and testing for maize. Agron. J. 2009, 101, 448–459. [Google Scholar] [CrossRef]
- van Diepen, C.A.; Wolf, J.; van Keulen, H.; Rappoldt, C. WOFOST: A simulation model of crop production. Soil Use Manag. 1989, 5, 16–24. [Google Scholar] [CrossRef]
- Sharpley, A.N.; Williams, J.R. EPIC-Erosion/Productivity Impact Calculator: 1. Model Documentation; U.S. Department of Agriculture, Agricultural Research Service: Springfield, VA, USA, 1990; pp. 206–207. [Google Scholar]
- Jones, J.W.; Hoogenboom, G.; Porter, C.H.; Boote, K.J.; Batchelor, W.D.; Hunt, L.A.; Wilkens, P.W.; Singh, U.; Gijsman, A.J.; Ritchie, J.T. The DSSAT cropping system model. Eur. J. Agron. 2003, 18, 235–265. [Google Scholar] [CrossRef]
- Keating, B.A.; Carberry, P.S.; Hammer, G.L.; Probert, M.E.; Robertson, M.J.; Holzworth, D.; Huth, N.I.; Hargreaves, J.N.G.; Meinke, H.; Hochman, Z.; et al. An overview of APSIM, a model designed for farming systems simulation. Eur. J. Agron. 2003, 18, 267–288. [Google Scholar] [CrossRef] [Green Version]
- Kang, S.; Zhang, L.; Liang, Y.; Dawes, W. Simulation of winter wheat yield and water use efficiency in the Loess Plateau of China using WAVES. Agric. Syst. 2003, 78, 355–367. [Google Scholar] [CrossRef]
- Ran, H.; Kang, S.; Li, F.; Tong, L.; Ding, R.; Du, T.; Li, S.; Zhang, X. Performance of AquaCrop and SIMDualKc models in evapotranspiration partitioning on full and deficit irrigated maize for seed production under plastic film-mulch in an arid region of China. Agric. Syst. 2017, 151, 20–32. [Google Scholar] [CrossRef]
- Rosa, R.D.; Paredes, P.; Rodrigues, G.C.; Alves, I.; Fernando, R.M.; Pereira, L.S.; Allen, R.G. Implementing the dual crop coefficient approach in interactive software. 1. Background and computational strategy. Agric. Water Manag. 2012, 103, 8–24. [Google Scholar] [CrossRef]
- Shen, Q.; Ding, R.; Du, T.; Tong, L.; Li, S. Water Use Effectiveness Is Enhanced Using Film Mulch Through Increasing Transpiration and Decreasing Evapotranspiration. Water 2019, 11, 1153. [Google Scholar] [CrossRef] [Green Version]
- Donatelli, M.; Magarey, R.D.; Bregaglio, S.; Willocquet, L.; Whish, J.P.M.; Savary, S. Modelling the impacts of pests and diseases on agricultural systems. Agric. Syst. 2017, 155, 213–224. [Google Scholar] [CrossRef] [PubMed]
- Tigkas, D.; Tsakiris, G. Early Estimation of Drought Impacts on Rainfed Wheat Yield in Mediterranean Climate. Environ. Process. 2015, 2, 97–114. [Google Scholar] [CrossRef] [Green Version]
- Li, F.; Yu, N.; Zhao, Y. Irrigation Scheduling Optimization for Cotton Based on the AquaCrop Model. Water Resour. Manag. 2019, 33, 39–55. [Google Scholar] [CrossRef]
- Xing, Y.; Liu, D.; Wang, P. Advances of the coupling application of remote sensing information and crop growth model. Adv. Earth Sci. 2009, 24, 444–451. (In Chinese) [Google Scholar]
- Meng, J.-H.; Wu, B.-F.; Du, X.; Zhang, F.-F.; Zhang, M.; Dong, T.-F. A review and outlook of applying remote sensing to precision agriculture. Remote Sens. Land Resour. 2011, 90, 1–7. (In Chinese) [Google Scholar]
- Li, C.; Wang, J.; Wang, X.; Liu, F.; Li, R. Methods for integration of remote sensing data and crop model and their prospects in agricultural application. Trans. Chin. Soc. Agric. Eng. 2008, 24, 295–301. (In Chinese) [Google Scholar]
- Jin, X.; Li, Z.; Feng, H.; Ren, Z.; Li, S. Estimation of maize yield by assimilating biomass and canopy cover derived from hyperspectral data into the AquaCrop model. Agric. Water Manag. 2020, 227, 105846. [Google Scholar] [CrossRef]
- Sakamoto, T.; Nguyen, N.V.; Ohno, H.; Ishitsuka, N.; Yokozawa, M. Spatio–temporal distribution of rice phenology and cropping systems in the Mekong Delta with special reference to the seasonal water flow of the Mekong and Bassac rivers. Remote Sens. Environ. 2006, 100, 1–16. [Google Scholar] [CrossRef]
- Lorite, I.J.; García-Vila, M.; Santos, C.; Ruiz-Ramos, M.; Fereres, E. AquaData and AquaGIS: Two computer utilities for temporal and spatial simulations of water-limited yield with AquaCrop. Comput. Electron. Agric. 2013, 96, 227–237. [Google Scholar] [CrossRef] [Green Version]
- Han, C.; Zhang, B.; Chen, H.; Wei, Z.; Liu, Y. Spatially distributed crop model based on remote sensing. Agric. Water Manag. 2019, 218, 165–173. [Google Scholar] [CrossRef]
- Han, C.; Zhang, B.; Chen, H.; Liu, Y.; Wei, Z. Novel approach of upscaling the FAO AquaCrop model into regional scale by using distributed crop parameters derived from remote sensing data. Agric. Water Manag. 2020, 240, 106288. [Google Scholar] [CrossRef]
- Feng, Q.; Liu, W.; Su, Y.; Zhang, Y.; Si, J. Distribution and evolution of water chemistry in Heihe River basin. Environ. Earth Sci. 2004, 45, 947–956. [Google Scholar] [CrossRef]
- Wang, J.; Meng, J.J. Characteristics and Tendencies of Annual Runoff Variations in the Heihe River Basin during the Past 60 years. Sci. Geogr. Sin. 2008, 28, 83–88. (In Chinese) [Google Scholar]
- Chen, X.-L. The Ecological Water Dispatching in the Heihe River from 2000 to 2004. J. Arid. Land Res. Environ. 2006, 20, 104–108. (In Chinese) [Google Scholar]
- Lai, Z.-Q.; Li, S.; Li, C.-G.; Nan, Z.-T.; Yu, W.-J. Improvement and Applications of SWAT Model in the Upper-middle Heihe River Basin. J. Nat. Res. 2013, 28, 1404–1413. (In Chinese) [Google Scholar]
- Niu, J.; Liu, Q.; Kang, S.; Zhang, X. The response of crop water productivity to climatic variation in the upper-middle reaches of the Heihe River basin, Northwest China. J. Hydrol. 2018, 563, 909–926. [Google Scholar] [CrossRef]
- Allen, R.G.; Pereira, L.S.; Raes, D.; Smith, M. Crop Evapotranspiration–Guidelines for Computing Crop Water Requirements FAO Irrigation and Drainage Paper 56; FAO: Rome, Italy, 1998; p. 300. [Google Scholar]
- Zhang, G.; Song, X. Digital Soil Mapping Dataset of Soil Texture in the Heihe River Basin (2012–2014); National Tibetan Plateau Data Center: Beijing, China, 2017. [Google Scholar]
- Zhang, G.; Song, X. Digital Soil Mapping Dataset of Hydrological Parameters in the Heihe River Basin (2012); National Tibetan Plateau Data Center: Beijing, China, 2017. [Google Scholar]
- Pan, Y.; Li, L.; Zhang, J.; Liang, S.; Zhu, X.; Sulla-Menashe, D. Winter wheat area estimation from MODIS-EVI time series data using the Crop Proportion Phenology Index. Remote Sens. Environ. 2012, 119, 232–242. [Google Scholar] [CrossRef]
- Pan, Z.; Huang, J.; Zhou, Q.; Wang, L.; Cheng, Y.; Zhang, H.; Blackburn, G.A.; Yan, J.; Liu, J. Mapping crop phenology using NDVI time-series derived from HJ-1 A/B data. Int. J. Appl. Earth Obs. Geoinf. 2015, 34, 188–197. [Google Scholar] [CrossRef] [Green Version]
- Manfron, G.; Delmotte, S.; Busetto, L.; Hossard, L.; Ranghetti, L.; Brivio, P.A.; Boschetti, M. Estimating inter-annual variability in winter wheat sowing dates from satellite time series in Camargue, France. Int. J. Appl. Earth Obs. Geoinf. 2017, 57, 190–201. [Google Scholar] [CrossRef]
- Dubovyk, O.; Landmann, T.; Erasmus, B.F.; Tewes, A.; Schellberg, J. Monitoring vegetation dynamics with medium resolution MODIS-EVI time series at sub-regional scale in southern Africa. Int. J. Appl. Earth Obs. Geoinf. 2015, 38, 175–183. [Google Scholar] [CrossRef]
- Son, N.-T.; Chen, C.-F.; Chen, C.-R.; Duc, H.-N.; Chang, L.-Y. A Phenology-Based Classification of Time-Series MODIS Data for Rice Crop Monitoring in Mekong Delta, Vietnam. Remote Sens. 2013, 6, 135–156. [Google Scholar] [CrossRef] [Green Version]
- Vyas, S.; Nigam, R.; Patel, N.K.; Panigrahy, S. Extracting Regional Pattern of Wheat Sowing Dates Using Multispectral and High Temporal Observations from Indian Geostationary Satellite. J. Indian Soc. Remote Sens. 2013, 41, 855–864. [Google Scholar] [CrossRef]
- Kang, S.Z. Multi-Process Coupling and Efficient Water Use Regulation of Agricultural Water Conversion in Oasis in Arid of Northwest China; Science Press: Beijing, China, 2019; pp. 36–37. [Google Scholar]
- Maas, S.J. Use of remotely-sensed information in agricultural crop growth models. Ecol. Model. 1988, 41, 247–268. [Google Scholar] [CrossRef]
- Gitelson, A.A.; Wardlow, B.; Keydan, G.P.; Leavitt, B. An evaluation of MODIS 250-m data for green LAI estimation in crops. Geophys. Res. Lett. 2007, 34, 20403. [Google Scholar] [CrossRef]
- Lei, H.; Yang, D.; Cai, J.; Wang, F. Long-term variability of the carbon balance in a large irrigated area along the lower Yellow River from 1984 to 2006. Sci. China Earth Sci. 2013, 56, 671–683. [Google Scholar] [CrossRef]
- Kennedy, J.; Eberhart, R. Particle swarm optimization. In Proceedings of the International Conference on Neural Networks (ICNN 95), Perth, WA, Australia, 27 November–1 December 1995; pp. 1942–1948. [Google Scholar]
- Jakubik, J.; Binding, A.; Feuerriegel, S. Directed particle swarm optimization with Gaussian-process-based function forecasting. Eur. J. Oper. Res. 2021, 295, 157–169. [Google Scholar] [CrossRef]
- Zhang, Z. Effects of Regulated Deficit Irrigation on Seed Maize. Master’s Thesis, Gansu Agricultural University, Lanzhou, China, 2012. (In Chinese). [Google Scholar]
- Jiang, Y. Simulation Analysis and Optimal Regulation for Agro-Hydrological Processes and Water Use Efficiency on Multiple Scales of the Middle Heihe River Basin. Ph.D. Thesis, China Agricultural University, Beijing, China, 2017. (In Chinese). [Google Scholar]
- Wu, T. Several key links of maize seed production. Nongcun Shiyong Keji Xinxi 2011, 5, 16. (In Chinese) [Google Scholar]
- Zhang, W.; Tian, Y.; Sun, Z.; Zheng, C. How does plastic film mulching affect crop water productivity in an arid river basin? Agric. Water Manag. 2021, 258, 107218. [Google Scholar] [CrossRef]
- Chen, Z.; Wang, L.; Liu, J. Selecting appropriate spatial scale for mapping plastic-mulched farmland with satellite remote sensing imagery. Remote Sens. 2017, 9, 265. [Google Scholar]
- Wang, H.H. Study on the Polarized Reflectance Characteristics of Agricultural Thin Membrane. Master’s Thesis, Northeast Normal University, Changchun, China, 2007. (In Chinese). [Google Scholar]
- Lu, L.; Di, L.; Ye, Y. A Decision-Tree Classifier for Extracting Transparent Plastic-Mulched Landcover from Landsat-5 TM Images. IEEE J. Sel. Top. Appl. Earth Obs. Remote Sens. 2014, 7, 4548–4558. [Google Scholar] [CrossRef]
- Lu, L.; Hang, D.; Di, L. Threshold model for detecting transparent plastic-mulched landcover using moderate-resolution imaging spectroradiometer time series data: A case study in southern Xinjiang, China. J. Appl. Remote Sens. 2015, 9, 097094. [Google Scholar] [CrossRef]
Figure 1.
Location map of the Heihe River basin and the nine counties considered in this study.

Figure 2.
Spatial distribution of parameter optimization objective function () in the Heihe River basin for four different years: (a) 2011, (b) 2012, (c) 2013, and (d) 2014.
Figure 2.
Spatial distribution of parameter optimization objective function () in the Heihe River basin for four different years: (a) 2011, (b) 2012, (c) 2013, and (d) 2014.

Figure 3.
Sowing date of maize in the Heihe River basin for four different years: (a) 2011, (b) 2012, (c) 2013, and (d) 2014.
Figure 3.
Sowing date of maize in the Heihe River basin for four different years: (a) 2011, (b) 2012, (c) 2013, and (d) 2014.

Figure 4.
Spatial distribution of simulated maize yield in the Heihe River basin from 2011 (top) to 2014 (bottom): (a,c,e,g) are the Y values without mulching; and (b,d,f,h) are the Y values with mulching.
Figure 4.
Spatial distribution of simulated maize yield in the Heihe River basin from 2011 (top) to 2014 (bottom): (a,c,e,g) are the Y values without mulching; and (b,d,f,h) are the Y values with mulching.

Figure 5.
Comparison between the observed and simulated (left) Y and (right) CC of maize at the three field stations in the Heihe River basin.
Figure 5.
Comparison between the observed and simulated (left) Y and (right) CC of maize at the three field stations in the Heihe River basin.

Figure 6.
Spatial distribution of maize Y improvement degree after mulching and the proportion of each improvement degree in the Heihe River basin for four different years: (a) 2011, (b) 2012, (c) 2013, and (d) 2014.
Figure 6.
Spatial distribution of maize Y improvement degree after mulching and the proportion of each improvement degree in the Heihe River basin for four different years: (a) 2011, (b) 2012, (c) 2013, and (d) 2014.

Figure 7.
Spatial distribution of maize ET reduction degree after mulching and the proportion of each reduction degree in the Heihe River basin for four different years: (a) 2011, (b) 2012, (c) 2013, and (d) 2014.
Figure 7.
Spatial distribution of maize ET reduction degree after mulching and the proportion of each reduction degree in the Heihe River basin for four different years: (a) 2011, (b) 2012, (c) 2013, and (d) 2014.

Figure 8.
The recommendations for mulching according the change of maize Y (bottom map in each figure); ET (middle map in each figure); and maize Y and ET (top map in each figure) after mulching for four different years: (a) 2011, (b) 2012, (c) 2013, and (d) 2014. The red area is recommended for mulching, and the yellow area is not recommended for mulching.

Figure 9.
Proportion of mulching under different meteorological conditions in the Heihe River basin for four years: (a) accumulated temperature, (b) precipitation, (c) accumulated temperature and precipitation.
Figure 9.
Proportion of mulching under different meteorological conditions in the Heihe River basin for four years: (a) accumulated temperature, (b) precipitation, (c) accumulated temperature and precipitation.


Table 1.
Parameters for characterizing on-farm water management interventions in AquaCrop.
| Irrigation technology | Technology Name | Water Application Efficiency (%) | Surface Soil Wetting Area (%) |
| Border √ | 60 | 80 | |
| Sprinkler | 75 | 100 | |
| Drip | 90 | 30 | |
| Soil management | Mulching Method | Material Factor (fm) | Mulching Cover Area (%) |
| No mulching √ | 0 | 0 | |
| Organic mulching | 0.5 | 100 | |
| Plastic mulching √ | 1 | 70 | |
| Soil fertility | Soil Fertility limiting | Soil Fertility Stress (%) | |
| No limiting √ | 0 | ||
| 20–99% | 74–2 | ||
| Irrigation schedule | Date | Water Irrigation Quantity (mm) | |
| 5/31 | 166 | ||
| 6/30 | 166 | ||
| 7/31 | 166 | ||
| 8/31 | 165 | ||
√: Management measures used in this study.
Table 2.
Optimization parameters and their default values and calibrated values.
| Parameters | Description | Default Value | Calibrated Value |
|---|---|---|---|
| KcTr,x | Crop coefficient when canopy is complete but prior to senescence | 1.05 | 1.00–1.25 |
| cc0 | Soil surface covered by an individual seedling at 90% emergence (cm2/plant) | 6.5 | 5.00–8.00 |
| Numpph | Number of plants per hectare | 50,000–100,000 | 50,000–100,000 |
| CGC | Canopy growth coefficient (fraction per day) | No reference is given on the calendar mode | 0.03–0.07 |
| CCx | Maximum canopy cover (%) | 65–99 | 60–100 |
| CDC | Canopy decline coefficient (fraction per day) | No reference is given on the calendar mode | 0.03–0.07 |
| mat | Time from sowing to maturity, i.e., length of crop cycle (day) | No reference is given on the calendar mode | 153–183 |
| wp | Water productivity normalized for ETo and CO2 (gram/m2) | 33.7 | 20.0–40.0 |
| HI0 | Reference harvest index (%) | 48–52 | 30–55 |
Table 3.
Field observation data details.
| Field Stations | Coordinate | Crop | Parameter | Year | n | Data Sources |
|---|---|---|---|---|---|---|
| 1 | (100°07′ E, 39°21′ N) | Spring Maize | Yield | 2011 | 1 | Zhang (2012) [67] |
| 2 | (100°20′ E, 38°51′ N) | Spring Maize | Yield | 2012, 2013 | 2 | Jiang (2017) [68] |
| Canopy Coverage | 2013 | 7 | ||||
| 3 | (100°34′ E, 38°57′ N) | Spring Maize | Yield | 2012, 2013 | 2 | Jiang (2017) [68] |
| Canopy Coverage | 2013 | 3 |
Table 4.
Maize yield simulation in counties in the Heihe River basin for four different years (2011–2014). (YY represents the yearbook yield per unit area, YN represents the yield per unit area of the model without film mulching, and YM represents the yield per unit area of the model without film mulching in t/ha.).
| Counties /Indicators | 2011 | 2012 | 2013 | 2014 | ||||||||
|---|---|---|---|---|---|---|---|---|---|---|---|---|
| YY | YN | YM | YY | YN | YM | YY | YN | YM | YY | YN | YM | |
| Shandan | 9.75 | 7.27 | 7.27 | 9.76 | 8.15 | 8.15 | 9.15 | 5.46 | 5.46 | 9.57 | 3.50 | 3.51 |
| Minle | 8.22 | 7.90 | 7.90 | 8.08 | 8.27 | 8.53 | 8.25 | 8.29 | 8.29 | 8.59 | 6.81 | 6.81 |
| Ganzhou | 8.34 | 8.60 | 8.59 | 8.08 | 9.87 | 9.87 | 8.08 | 9.88 | 9.88 | 8.65 | 8.07 | 8.07 |
| Linze | 8.22 | 9.23 | 9.44 | 6.95 | 8.53 | 10.96 | 7.03 | 10.58 | 10.58 | 7.40 | 9.01 | 9.01 |
| Gaotai | 8.42 | 9.86 | 10.14 | 7.29 | 11.36 | 11.35 | 7.28 | 9.86 | 9.86 | 7.77 | 10.31 | 10.32 |
| Sunan | 7.77 | 8.69 | 8.76 | 7.55 | 9.93 | 9.93 | 6.32 | 9.31 | 9.31 | 6.88 | 8.95 | 8.97 |
| Suzhou | 8.59 | 9.60 | 10.02 | 9.45 | 10.08 | 10.08 | 9.29 | 9.79 | 9.79 | 9.25 | 10.59 | 10.61 |
| Jiayuguan | 10.57 | 10.57 | 10.58 | 7.90 | 9.99 | 9.99 | 11.48 | 9.73 | 9.73 | 11.86 | 11.62 | 11.64 |
| Jinta | 10.52 | 8.79 | 8.80 | 11.91 | 10.47 | 10.48 | 11.35 | 9.34 | 9.36 | 10.96 | 10.01 | 10.02 |
| Yumen | 9.94 | 8.33 | 8.33 | 10.64 | 10.47 | 10.47 | 9.37 | 8.04 | 8.07 | 8.90 | 7.54 | 7.55 |
| RMSE (t/ha) | 1.29 | - | 2.03 | - | 2.33 | - | 2.44 | - | ||||
| NRMSE | 14.37 | - | 23.17 | - | 26.57 | - | 27.13 | - | ||||
| MBE (t/ha) | −0.15 | - | 0.77 | - | 0.27 | - | −0.37 | - | ||||
Publisher’s Note: MDPI stays neutral with regard to jurisdictional claims in published maps and institutional affiliations. |
© 2022 by the authors. Licensee MDPI, Basel, Switzerland. This article is an open access article distributed under the terms and conditions of the Creative Commons Attribution (CC BY) license (https://creativecommons.org/licenses/by/4.0/).
Share and Cite
MDPI and ACS Style
Shen, Q.; Niu, J.; Sivakumar, B.; Lu, N. Effects of Mulching on Maize Yield and Evapotranspiration in the Heihe River Basin, Northwest China. Remote Sens. 2022, 14, 700. https://0-doi-org.brum.beds.ac.uk/10.3390/rs14030700
AMA Style
Shen Q, Niu J, Sivakumar B, Lu N. Effects of Mulching on Maize Yield and Evapotranspiration in the Heihe River Basin, Northwest China. Remote Sensing. 2022; 14(3):700. https://0-doi-org.brum.beds.ac.uk/10.3390/rs14030700
Chicago/Turabian StyleShen, Qianxi, Jun Niu, Bellie Sivakumar, and Na Lu. 2022. "Effects of Mulching on Maize Yield and Evapotranspiration in the Heihe River Basin, Northwest China" Remote Sensing 14, no. 3: 700. https://0-doi-org.brum.beds.ac.uk/10.3390/rs14030700
Note that from the first issue of 2016, this journal uses article numbers instead of page numbers. See further details here.