Article

Monitoring Marine Aquaculture and Implications for Marine Spatial Planning—An Example from Shandong Province, China

1
The Second Monitoring and Application Center, China Earthquake Administration, Xi’an 710054, China
2
State Key Laboratory of Resources and Environment Information System, Institute of Geographic Sciences and Natural Resources Research, CAS, Beijing 100101, China
3
College of Resources and Environment, University of Chinese Academy of Sciences, Beijing 100049, China
4
Jiangsu Center for Collaborative Innovation in Geographical Information Resource Development and Application, Nanjing 210023, China
5
School of Geography, Nanjing Normal University, Nanjing 210023, China
*
Author to whom correspondence should be addressed.
Submission received: 10 December 2021 / Revised: 29 January 2022 / Accepted: 2 February 2022 / Published: 4 February 2022
(This article belongs to the Special Issue GIS and RS in Ocean, Island and Coastal Zone)

Abstract

:
Offshore marine aquaculture can not only provide a large amount of high-quality food for humans, but also effectively relieve the pressure on land space. However, it is difficult for traditional statistical data to reflect changes in spatial dynamics in marine aquaculture. It is also difficult to effectively manage marine space development given the current status of spatial planning regarding land–sea integration. This study used multiphase satellite remote sensing images of Shandong Province together with an automatic extraction algorithm for aquaculture to obtain spatial distribution data of marine aquaculture (surface of seawater visible by remote sensing, types of rafts, and cage aquaculture). GIS spatial overlay analysis technology was used to superimpose marine functional zoning (2010–2020) data for comparative analysis to evaluate implementation effectiveness and existing problems in marine functional zoning. Results showed that the critical time regarding substantial change in marine aquaculture area was around 2010, concurrent with the implementation of the current round of marine functional areas. The aquaculture area in the agricultural and fishery planning area increased from 228.33 km2 in 2010 to 344.6 km2 in 2018, and the overall proportion of aquaculture increased from 65.53% to 70.48%. This indicated that marine function planning can exert a guiding influence. The port area and protection area were found to be other major areas for the expansion of marine aquaculture. We also used field investigations in uncovering the phenomenon of the combined marine functions of marine aquaculture and tourism. On this basis, the role of spatial information technology in marine spatial planning was analyzed, which revealed the importance of coordinated integration of land–sea space for effective control of marine development.

1. Introduction

Globally, the area available to agriculture is often used for food production, and the marine land space has not been valued in the terms of food supply and national economic development. Marine aquaculture can be an important means of expanding environmentally friendly food production space [1]. As the population has increased and living standards improved, the demand for better and greater quantities of marine food has increased considerably, and the need to use and develop marine land space has increased significantly [2,3]. Studies have shown that global terrestrial agricultural production has continuously expanded to other ecological spaces in the past few decades, greatly changing the diversity of terrestrial ecosystems. The reductions in forest area, in particular, have changed the overall heat circulation system [4,5,6]. Research by Curtis [7] shows that between 2001 and 2015, 24% of the world’s disappearing forest area was converted into land for agricultural production. This large-scale land-use change can alter the energy and material cycles of the Earth surface, impacting global environmental change and the supply of ecosystem services [5,8,9,10]. Marine aquaculture is a method of using inshore ocean space to provide humans with a large number of high-protein foods [11]. It can effectively reduce the pressure on agricultural land, thus alleviating the impact of food production on global environmental change [12,13]. Food and Agriculture Organization (FAO) statistics show that marine fisheries food is one of the fastest-growing sectors of human food, reaching 171 million tons in 2016, and is still increasing at an average annual rate of 3 million tons. In 2014, for the first time, catch in aquaculture industries exceeded fishing catch [14], and in 2016 it accounted for 53% of the total fish catch [15]. It is clear that the status of marine territorial space in the human food system is gradually rising.
Information on the spatial distribution of and changes in marine aquaculture is of great significance in understanding the state and process of ocean development, as well as the interaction between ocean development and environmental changes [16]. However, the current global marine aquaculture data released by the FAO, and most of its statistical data, are derived from the official statistics of member countries. For this reason, the statistical data error is large, and the timeliness is difficult to guarantee [17]. In addition, these statistics most often summarize the number of aquaculture industries, and the area they cover. They provide limited information on real-time spatial distribution and environmental monitoring, and this does not meet the requirements for the real-time monitoring of the marine development process [18]. The current spatial distribution extraction algorithms and the application of research technology into marine aquaculture areas, based on satellite remote sensing images, is constantly evolving [19]. For example, research is being carried out into the extraction and application of optical remote sensing image aquaculture, using the principle of reflected sunlight imaging [20], as well as into the extraction and application of synthetic aperture radar (SAR) remote sensing image aquaculture on the principle of reflection satellite emission electromagnetic wave imaging [21,22]. Most previous related studies represent extractions of land-based pond aquaculture targets [22,23]. Some earlier studies have highlighted that the expansion of marine aquaculture areas will lead to a series of ecological problems. For example, Ottinger [24] and Gao [25] et.al. found that large amounts of animal excreta, residual bait and chemicals from aquaculture cause considerable pollution of coastal waters. Xing et.al. [26] found that the disordered proliferation of algal vegetation has led to the largest macroalgal blooms in the South Yellow Sea (China), which can potentially damage the marine environment and the regional economy.
Currently, remote sensing technology provides strong support regarding the extraction of marine aquaculture areas; however, there is a marked difference between marine aquaculture and pond aquaculture. In remote sensing images, differences between pond aquaculture objects are very obvious and rarely change with the seasons, which makes large-scale pond aquaculture acquisition possible [19,27]. However, in marine aquaculture, remote sensing imaging is less reliable because the main targets are below complex seawater backgrounds. This poses a major challenge regarding the extraction of marine aquaculture targets by artificial or automated algorithms, and hinders research based on the acquisition of spatial information from remote sensing and related applied studies. Recently, as high-resolution remote sensing technology has developed, the fine structure of marine aquaculture facilities can be revealed, providing a basis for the development of related algorithms [28,29]. However, acquisition of high-resolution images is expensive, which is not conducive to large-scale retrievals. Wang et al. [30] found that unassisted human visual observation, combined with object-oriented information extraction technology, is effective in enabling the abstraction of marine aquaculture information. Later, Wang et al. [31] further introduced an edge superimposition mechanism to realize the extraction of marine aquaculture areas from Landsat 8 satellite images (resolution: 15–30 m). These advances have made it possible to monitor dynamic changes in marine aquaculture areas using long-term remote sensing images [32].
Marine development management policies influence the process of marine aquaculture expansion. Dynamic change in the marine aquaculture area is a comprehensive reflection of the dual role of market drive and policy management. To carry out effective management and control of marine development; prevent the disorderly expansion of marine aquaculture; and strictly restrict the disorderly development of marine aquaculture activities in ecologically sensitive areas, it is imperative to carry out marine spatial planning [33,34]. Coastal countries around the world have carried out spatial planning of their marine territories to further deepen their control over development and protection, and this has become mainstream practice in marine spatial planning in developed countries [35,36,37,38,39]. Since 1998, China has continuously promoted the zoning of marine functions; continuously strengthened the guidance and supervision of marine development; established a top-down three-level marine function planning system; and achieved good results [40,41]. However, so far, the lack of objective and dynamic evaluation of the formulation and implementation of marine function zoning (MFZ) policies at all levels in China has created obstacles for the launch of a new round of marine land spatial planning.
The objective of this study was to assess the policies of marine spatial planning using long-term marine mariculture data and MFZ data. The remote sensing extraction technology of marine aquaculture has laid a foundation for the dynamic monitoring of the spatial and temporal changes in marine aquaculture. Remote sensing monitoring is required to investigate the long-term sequence of ocean development processes, creating conditions for the comprehensive development of ocean development assessment. At the same time, dynamic monitoring of marine development provides a scientific basis for the in-depth analysis of the effectiveness of (and problems relating to) the implementation of national marine development management and control policies. China’s Shandong Province is a major area of marine aquaculture. Because the high density of floating rafts and cages hinders seawater circulation, this activity is not conducive to the growth of marine life, weakens the self-healing function of the ocean, and causes a series of marine ecological environment problems [42,43] that require substantial effort and material resources to treat [44]. In our study, we used the example of Shandong Province to investigate dynamic changes in aquaculture area using Landsat satellite image data (1990–2018). The MFZ and marine aquaculture data were statistically superimposed and analyzed using geographic information system (GIS) spatial analysis technology; these provided a basis for a discussion of the function of MFZ in the spatial and temporal changes in aquaculture, and of the main problems. We concluded with a discussion of the core issues and unsolved problems in marine spatial planning for land–sea coordination; these should be addressed in future research. The derived results could help inform policy makers regarding the implementation of robust monitoring of aquaculture development, and support decision makers regarding the zoning of marine space.

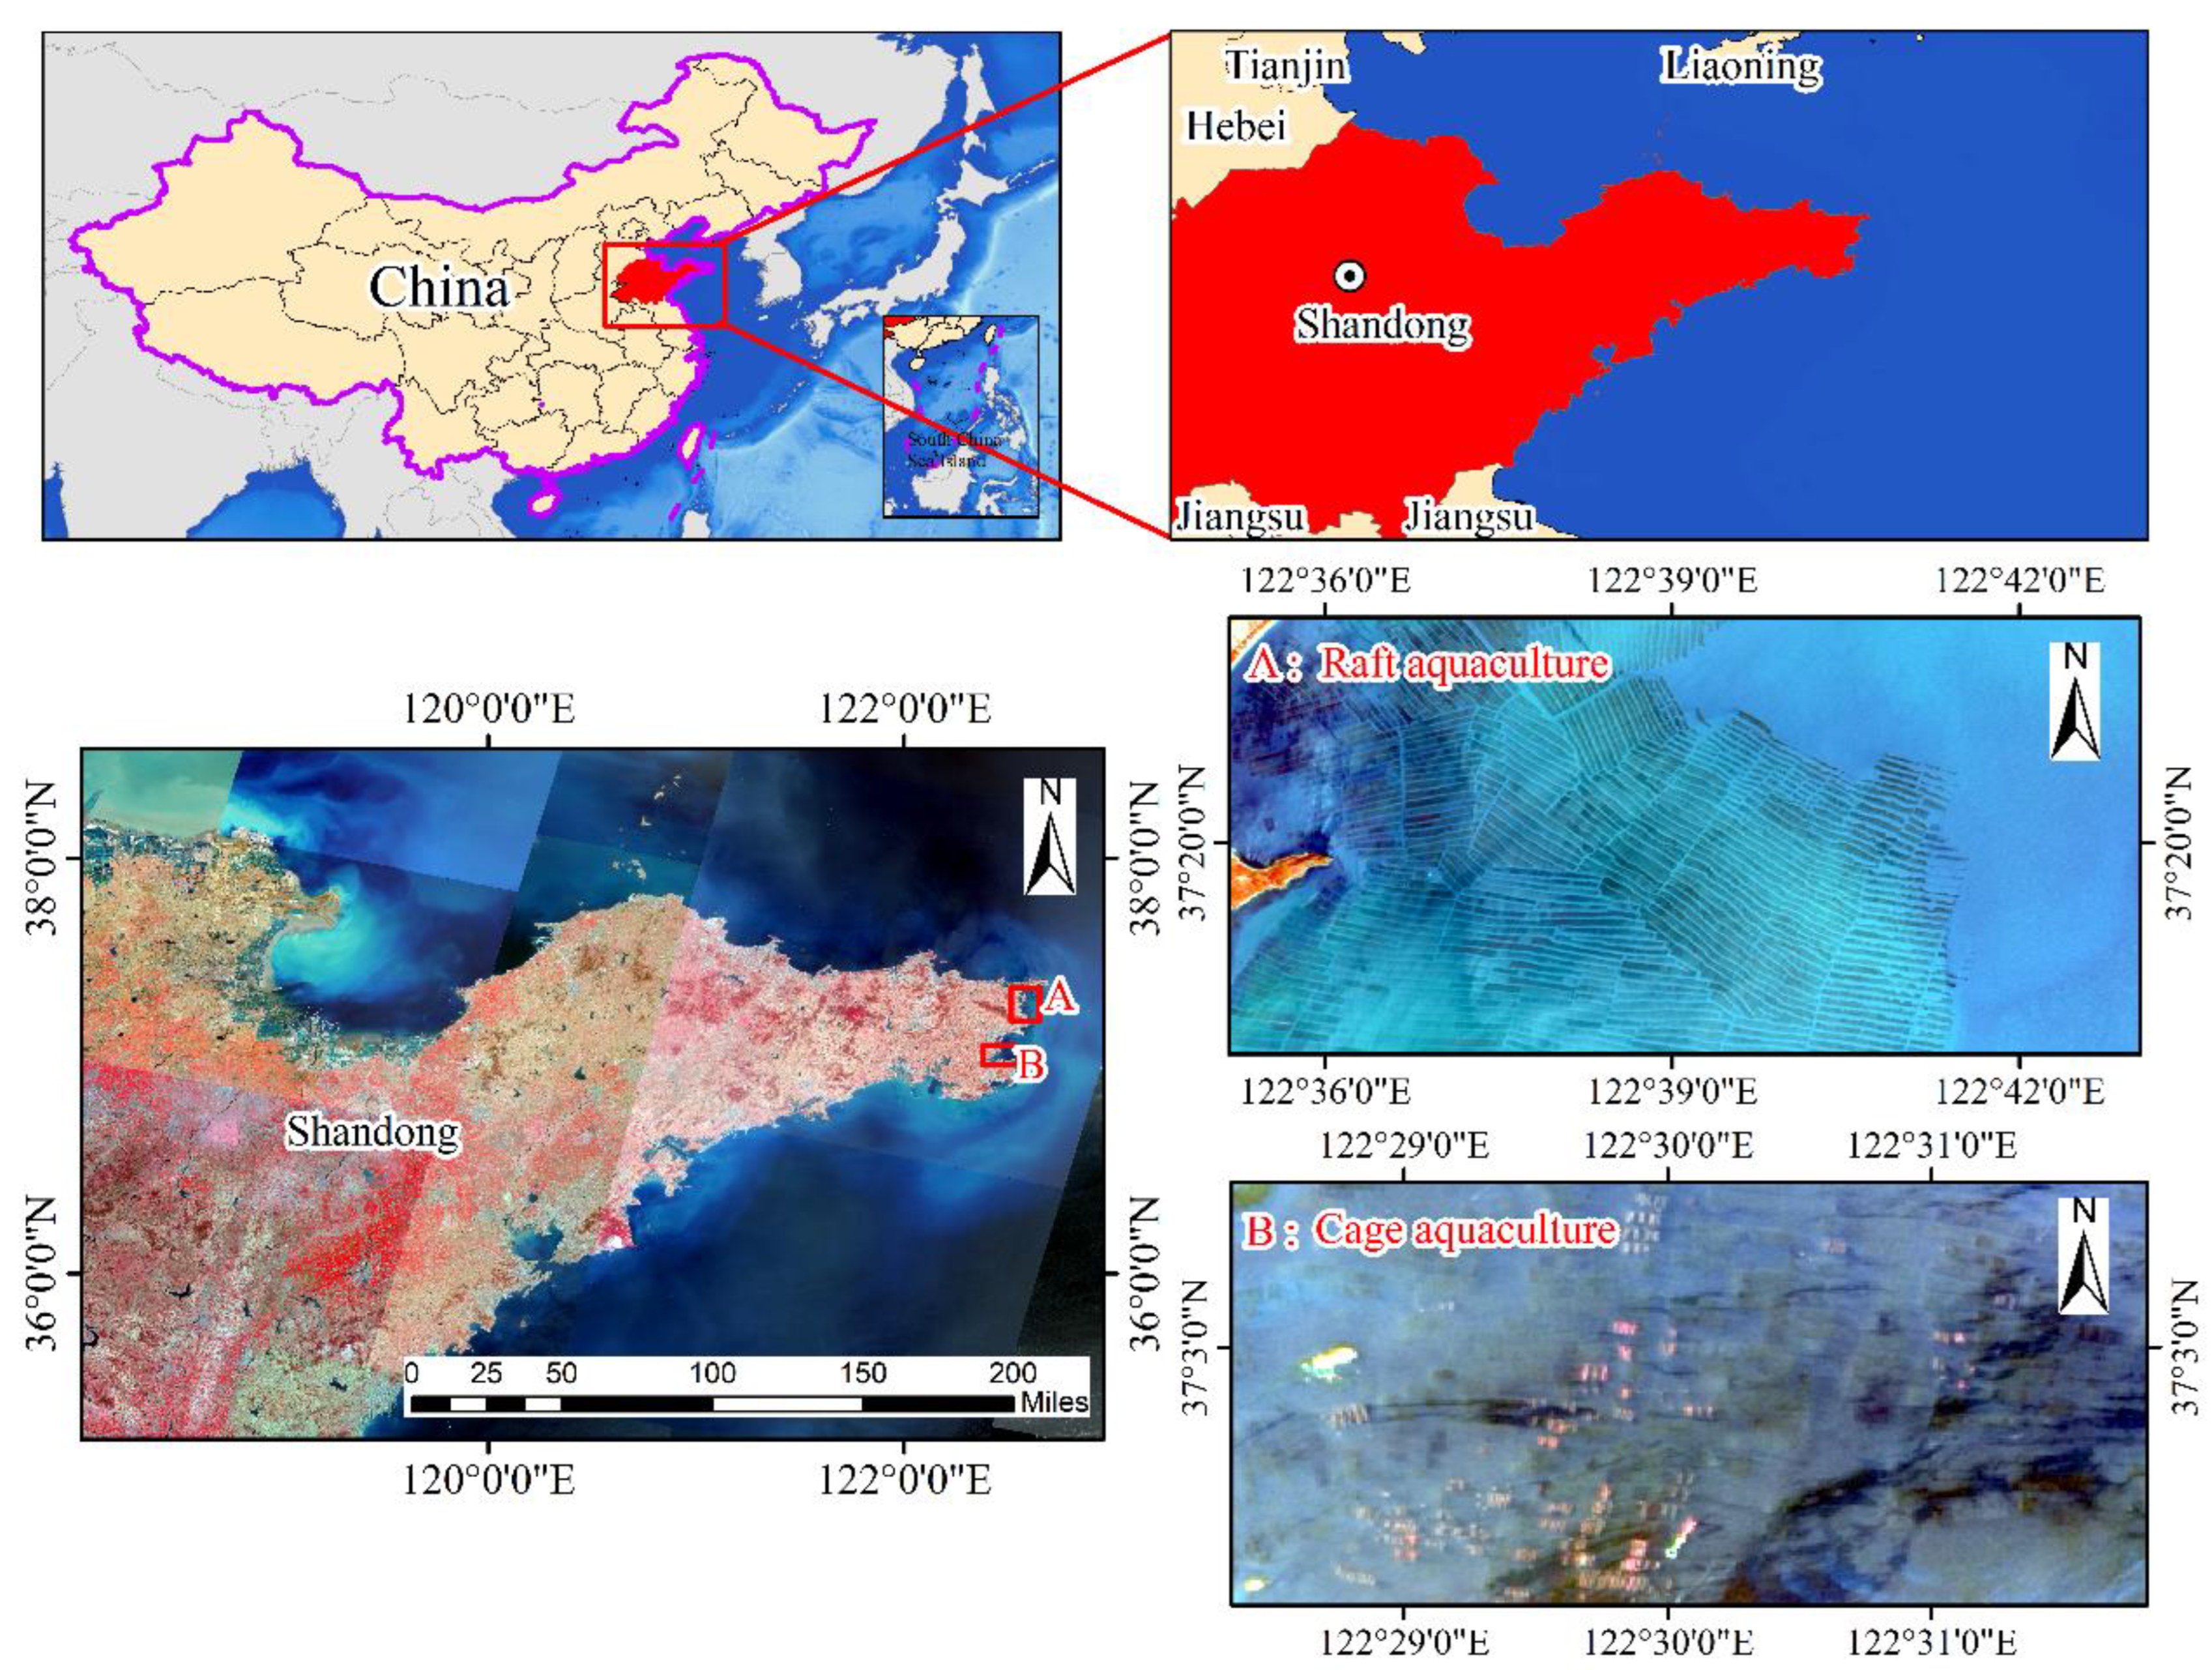
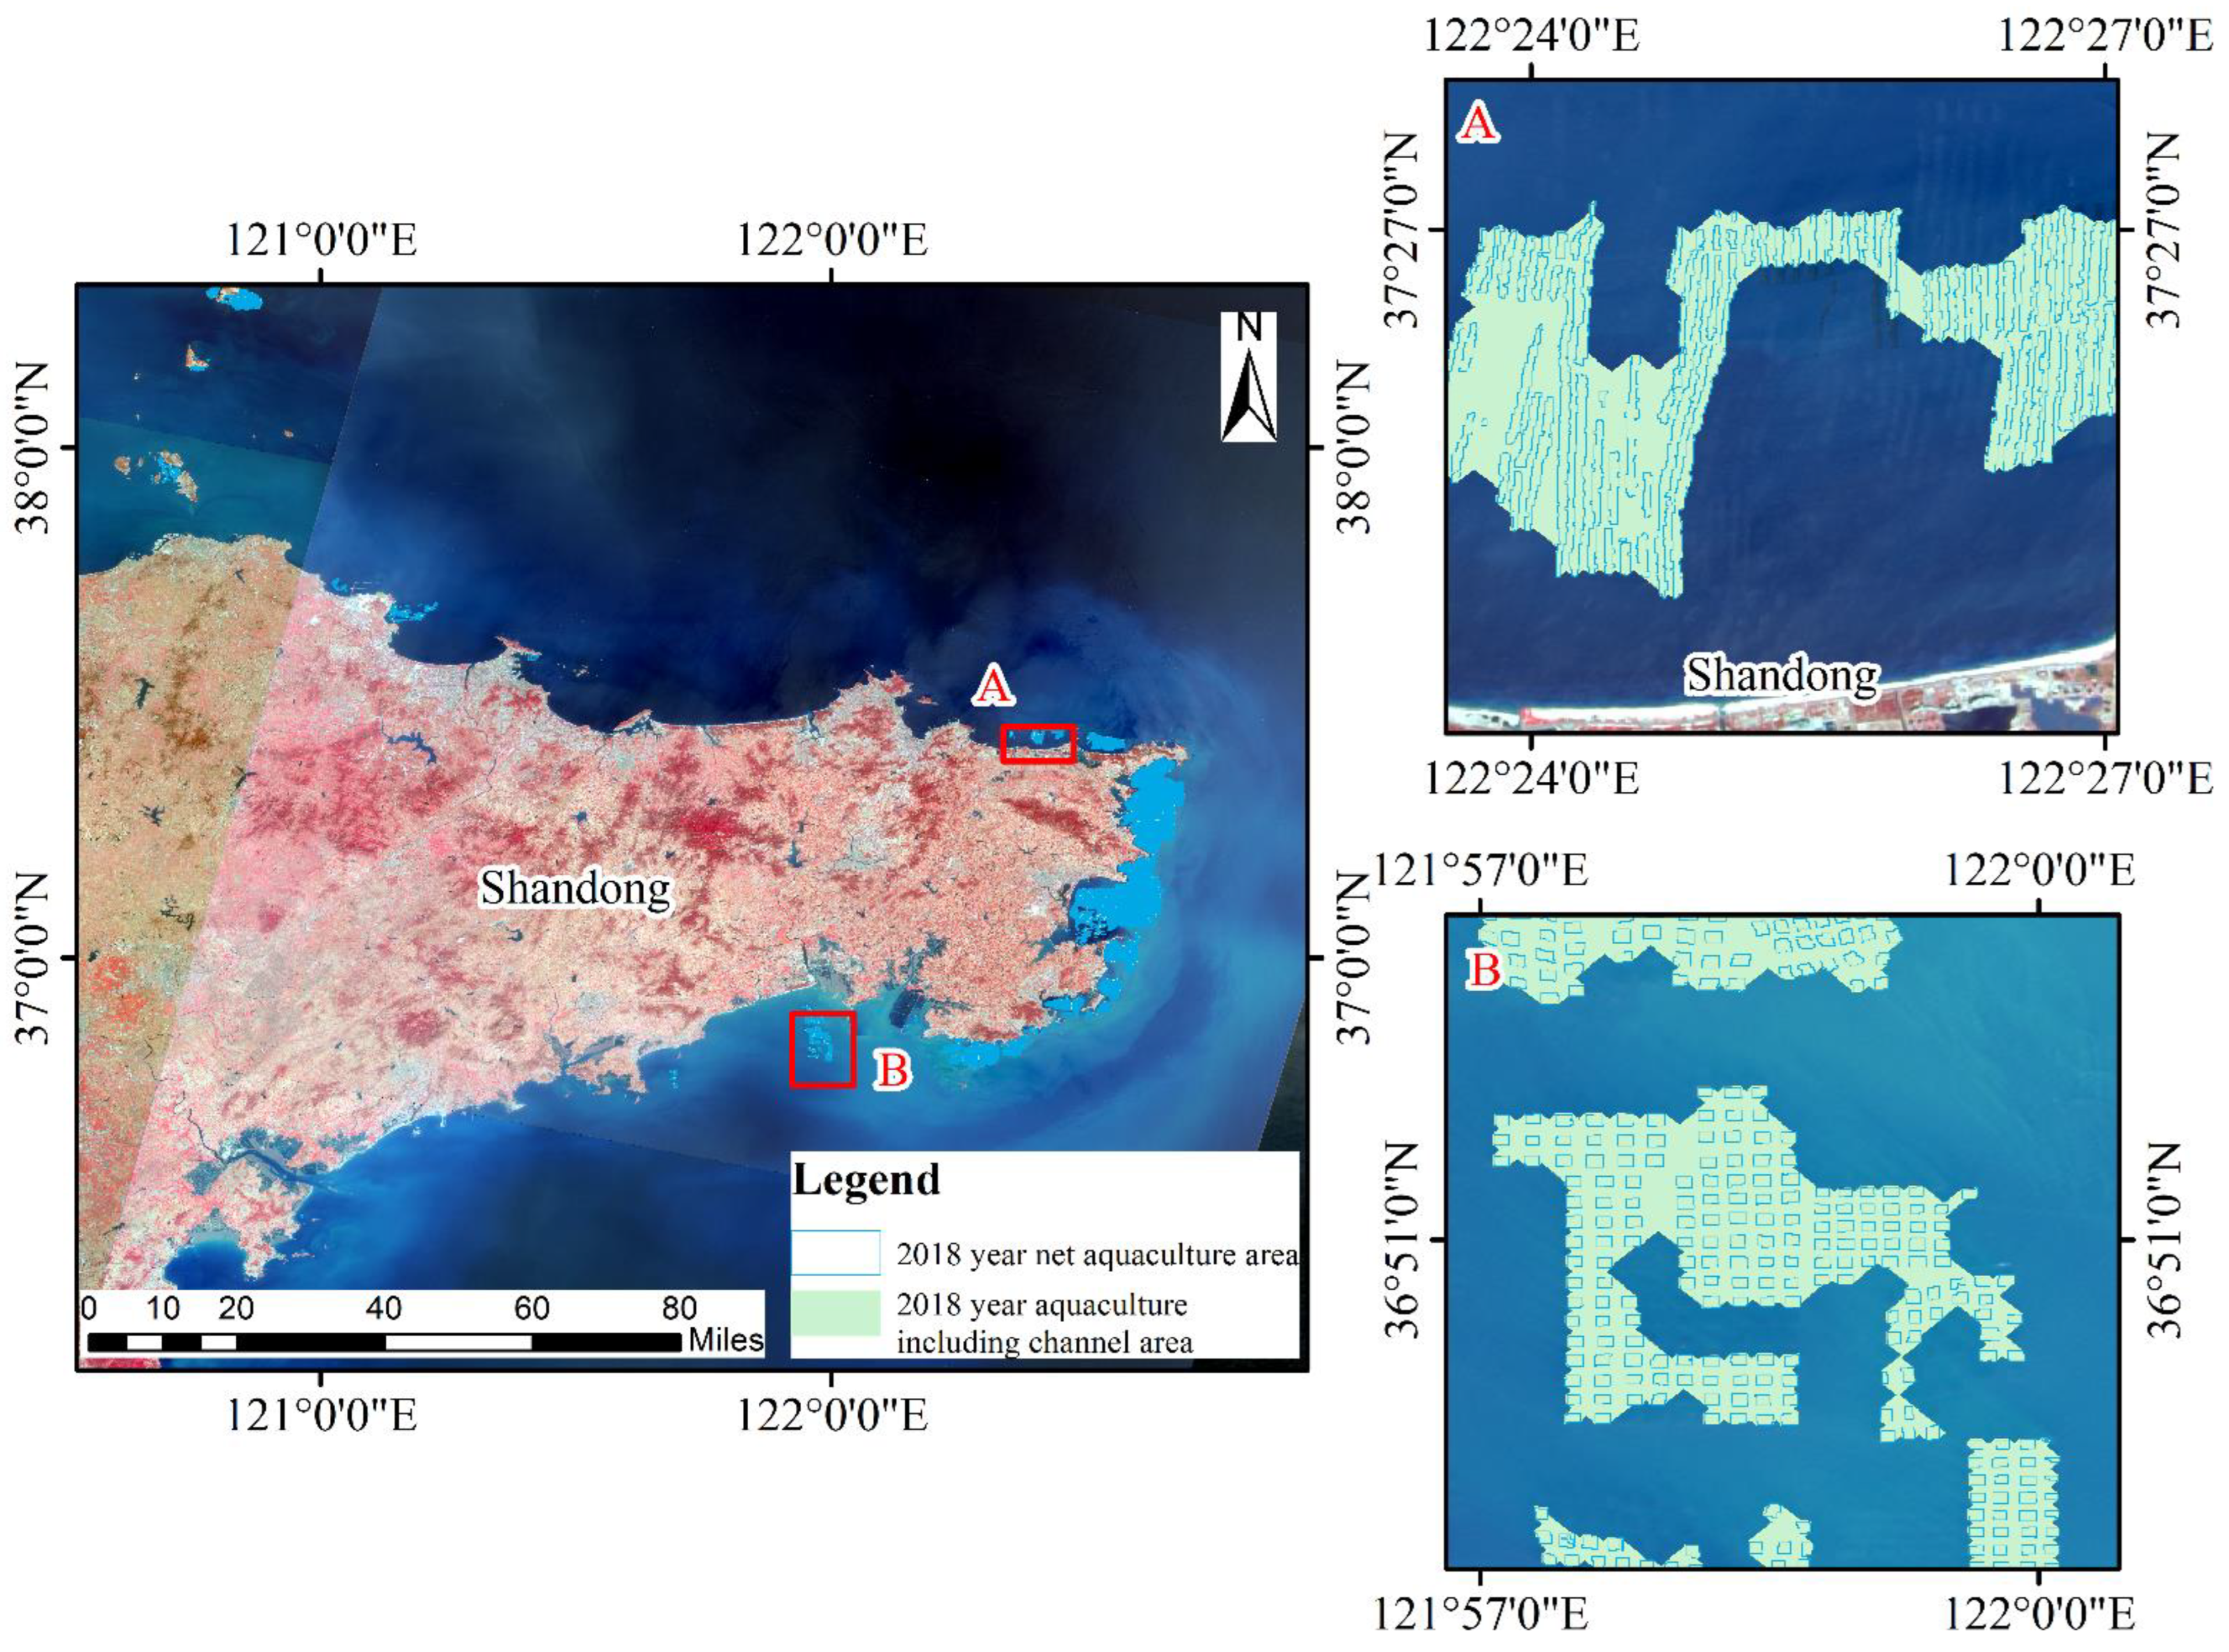
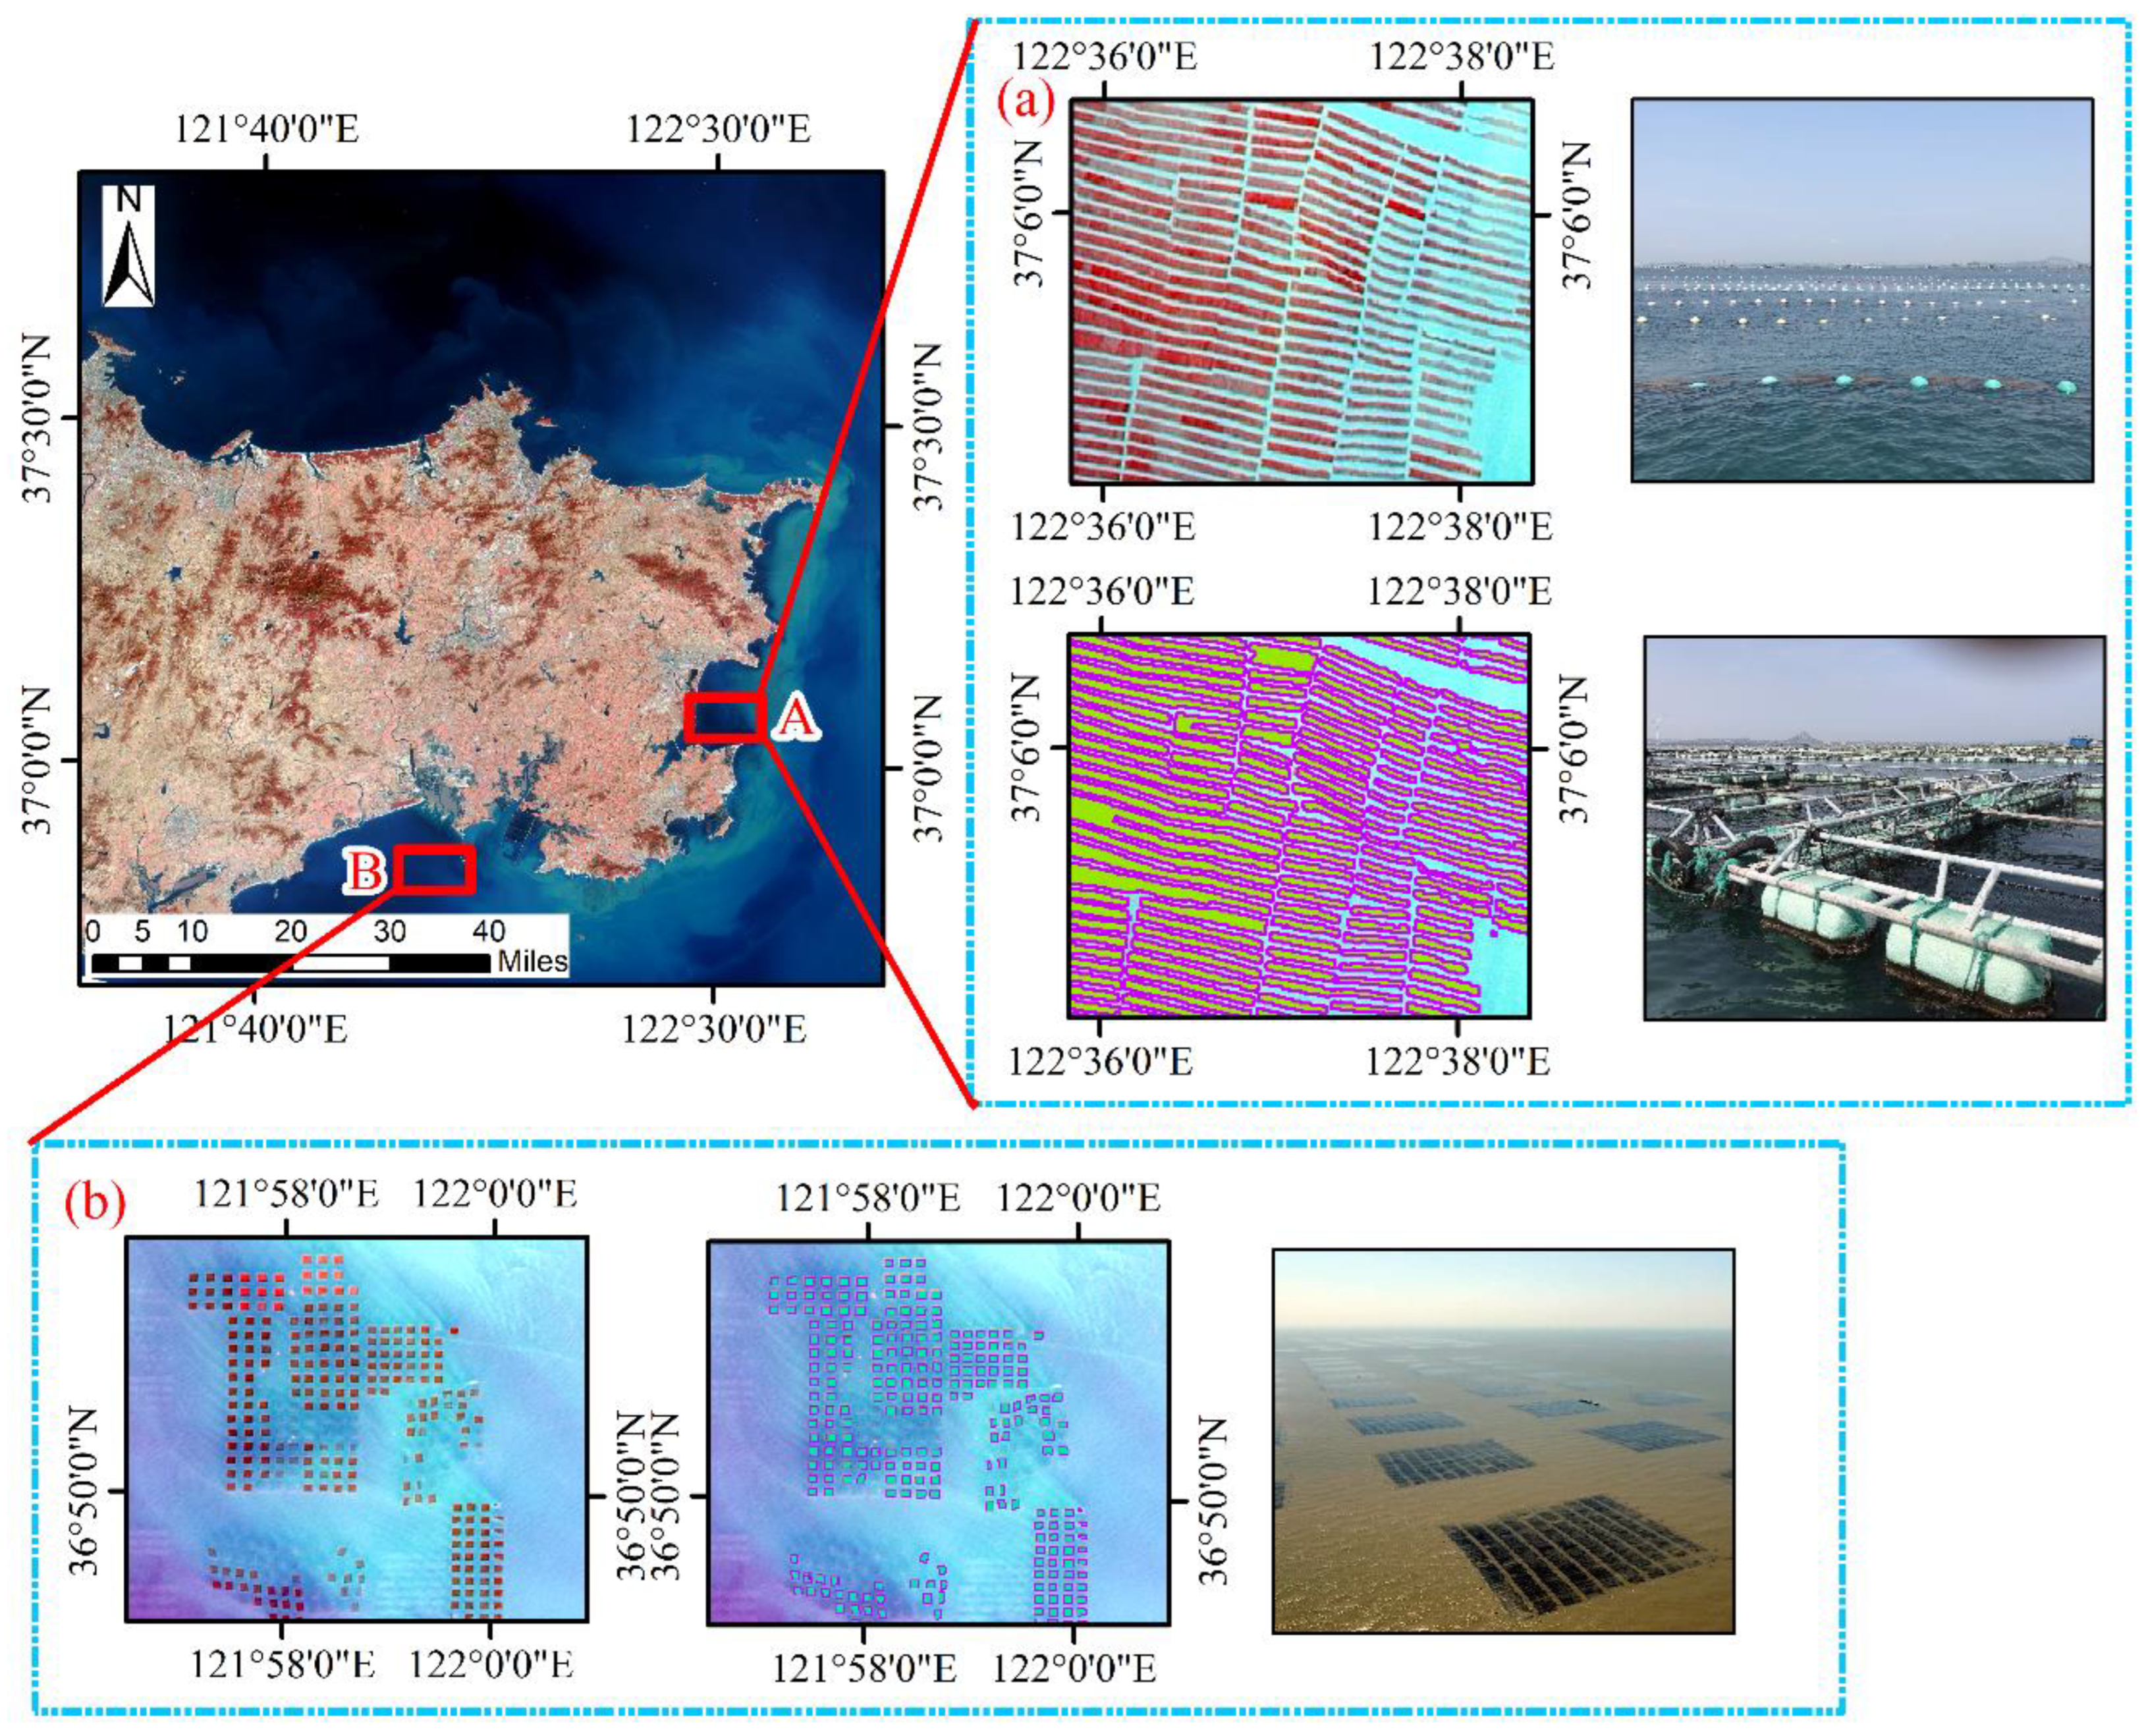
2. Study Area and Data

According to FAO statistics [15], China is the country with the largest marine aquaculture volume in the world, surpassing the total aquaculture volume of all other countries and accounting for more than 60% of the world’s total volume. We chose Shandong Province as our case study. Shandong lies on the eastern coast of China, between 34°22.9′–38°24.01′ N and 114°47.5′–122°42.3′ E (Figure 1) in the northern temperate zone. Many fertile rivers enter the sea and carry nutrients that provide abundant food for marine life. This region is suitable for the large-scale development of marine aquaculture, including raft aquaculture and cage aquaculture (Figure 1). According to the Chinese Government’s 2018 Fisheries Statistical Yearbook, Shandong Province has the largest aquaculture area of the nine coastal provinces of China [45].
The data used in this study comprised mainly Landsat5-TM, Landsat7-ETM+, and Landsat8-OLI data (https://glovis.usgs.gov/, (accessed on 1 August 2018)). Landsat satellite images were selected as the original data source for marine aquaculture extraction because of their main advantages of a resolution of up to 30 m and long time series, which allows for the dynamic monitoring of marine aquaculture. For example, if an aquaculture area being examined was 100 m wide and more than 1000 m long, Landsat images would be fully able to meet our requirements without recourse to expensive high-resolution images. As part of this study, it was essential to consider annual changes related to aquaculture when selecting the remote sensing images. Full coverage of the waters of Shandong Province required seven images; based on the aquaculture planting cycle, the period during which aquaculture was at its most prolific was selected for extraction of aquaculture areas. A literature review [46,47] and field research identified a period of 2–5 months each year during which marine aquaculture was most active, whereas the harvest period for kelp and other seaweed was 6–8 months. Please refer to Table 1 for specific details and the ranking of the data used. Please refer to Figure 2 for a detailed map of the changes in local marine aquaculture area from 1990–2018 detected in the Landsat satellite images.
Shandong Province was also the first province in China to implement MFZ. To coordinate the development of various marine resources and environmental protection, Shandong Province followed the national MFZ in October 2012 and formulated its local marine function plan. The local government hopes to achieve the following goals through this round of planning: (1) notable enhancement over control and guidance of MFZ regarding the use of maritime areas; (2) improvement of the marine ecological environment and ensuring the reasonable use of marine space in marine protected areas; (3) maintenance of the basic stability of the sea for fisheries and strengthening of conservation of living aquatic resources; (4) reasonable control over the scale of reclamation; (5) reservation of space resources for future use in sea areas; and (6) implementation of remediation and restoration of the coastal zone of sea areas. Marine aquaculture falls into the category with the largest area in MFZ, and is the most dynamic category. Not only does it change over time, but it also changes in different months. Research in this area aims to dynamically monitor the changes in marine aquaculture, explore the effectiveness of the implementation of MFZ, and provide data support for the launch of a new round of overall coordination of land and sea marine spatial planning.
Given the complex and comprehensive characteristics of MFZ, marine land spatial planning is important. We performed a detailed analysis to create conditions for the rational use of marine spatial resources and to enhance the value of the way in which marine space is used. We selected three MFZ areas with aquaculture distribution as typical case studies to analyze the evolution of the relationship between marine aquaculture areas and MFZ (Figure 3). The first of these was the traditional marine aquaculture gathering area (agricultural and fishery area A), which we used to analyze the guiding role of the agricultural and fishery area in the MFZ with respect to the aquaculture area. The second was waterway planning area B, where waterway encroachment is more serious. Statistics showed that the waterway planning area represents a functional planning area with the largest aquaculture area outside the agricultural and fishery areas. Analysis helped us understand the mechanism behind the interaction between the expansion of marine aquaculture and planning of the functional area. The third was compound functional area C, which was discovered by the research team during a field visit and found to be inconsistent with current functional area planning (see Section 4.3 for detailed analysis).

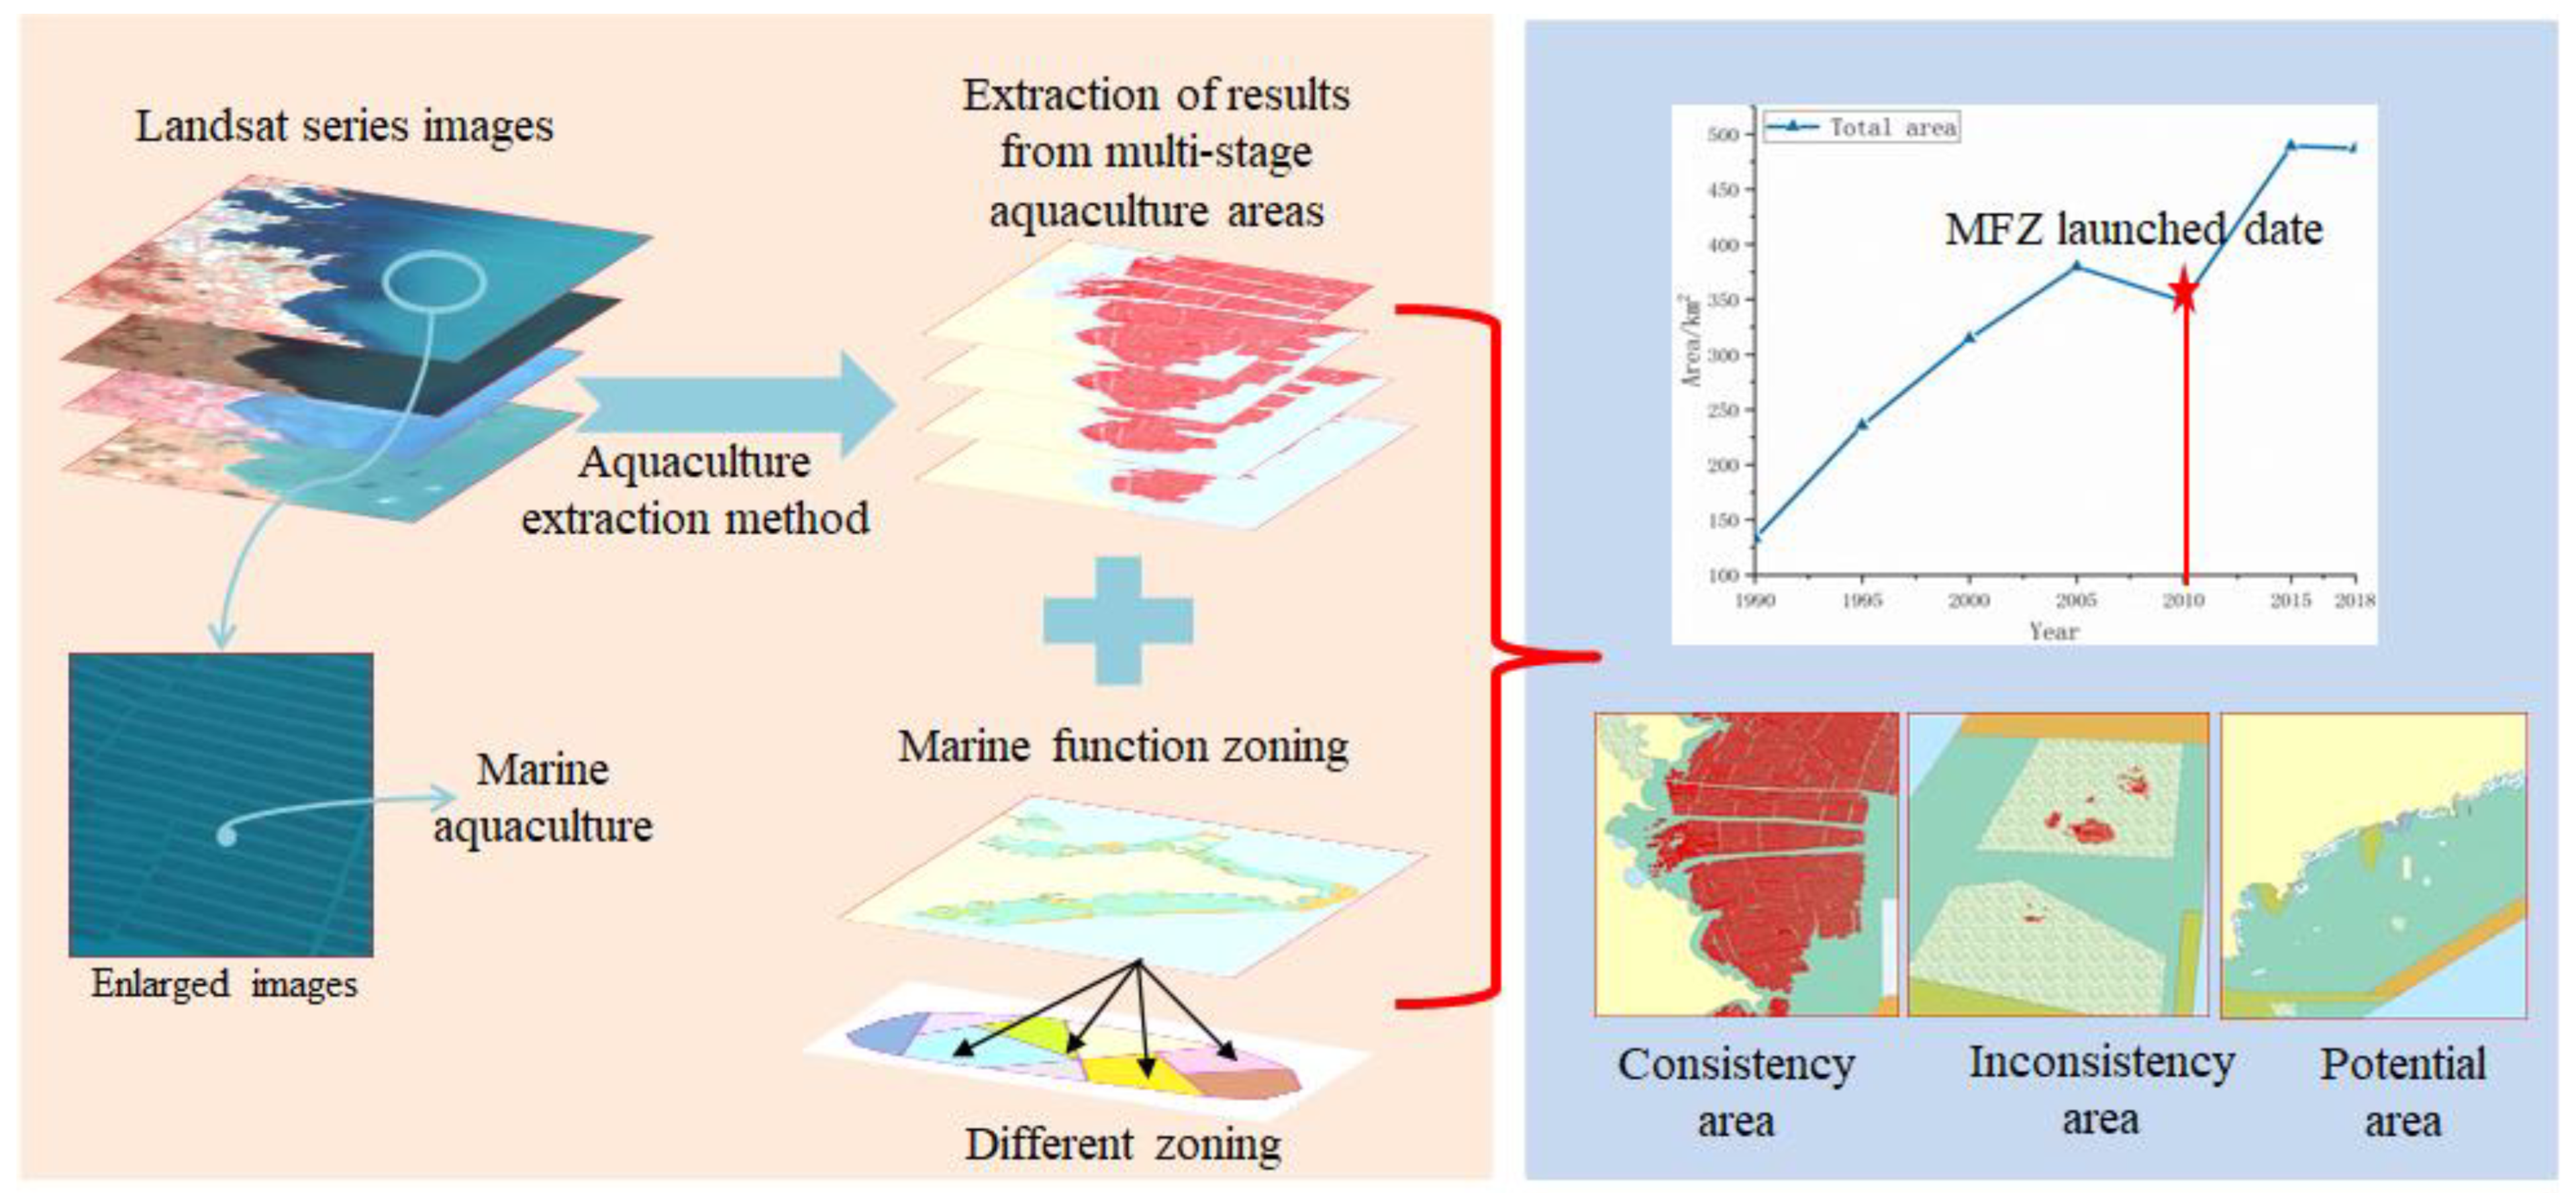
3. Study Routes and Methods

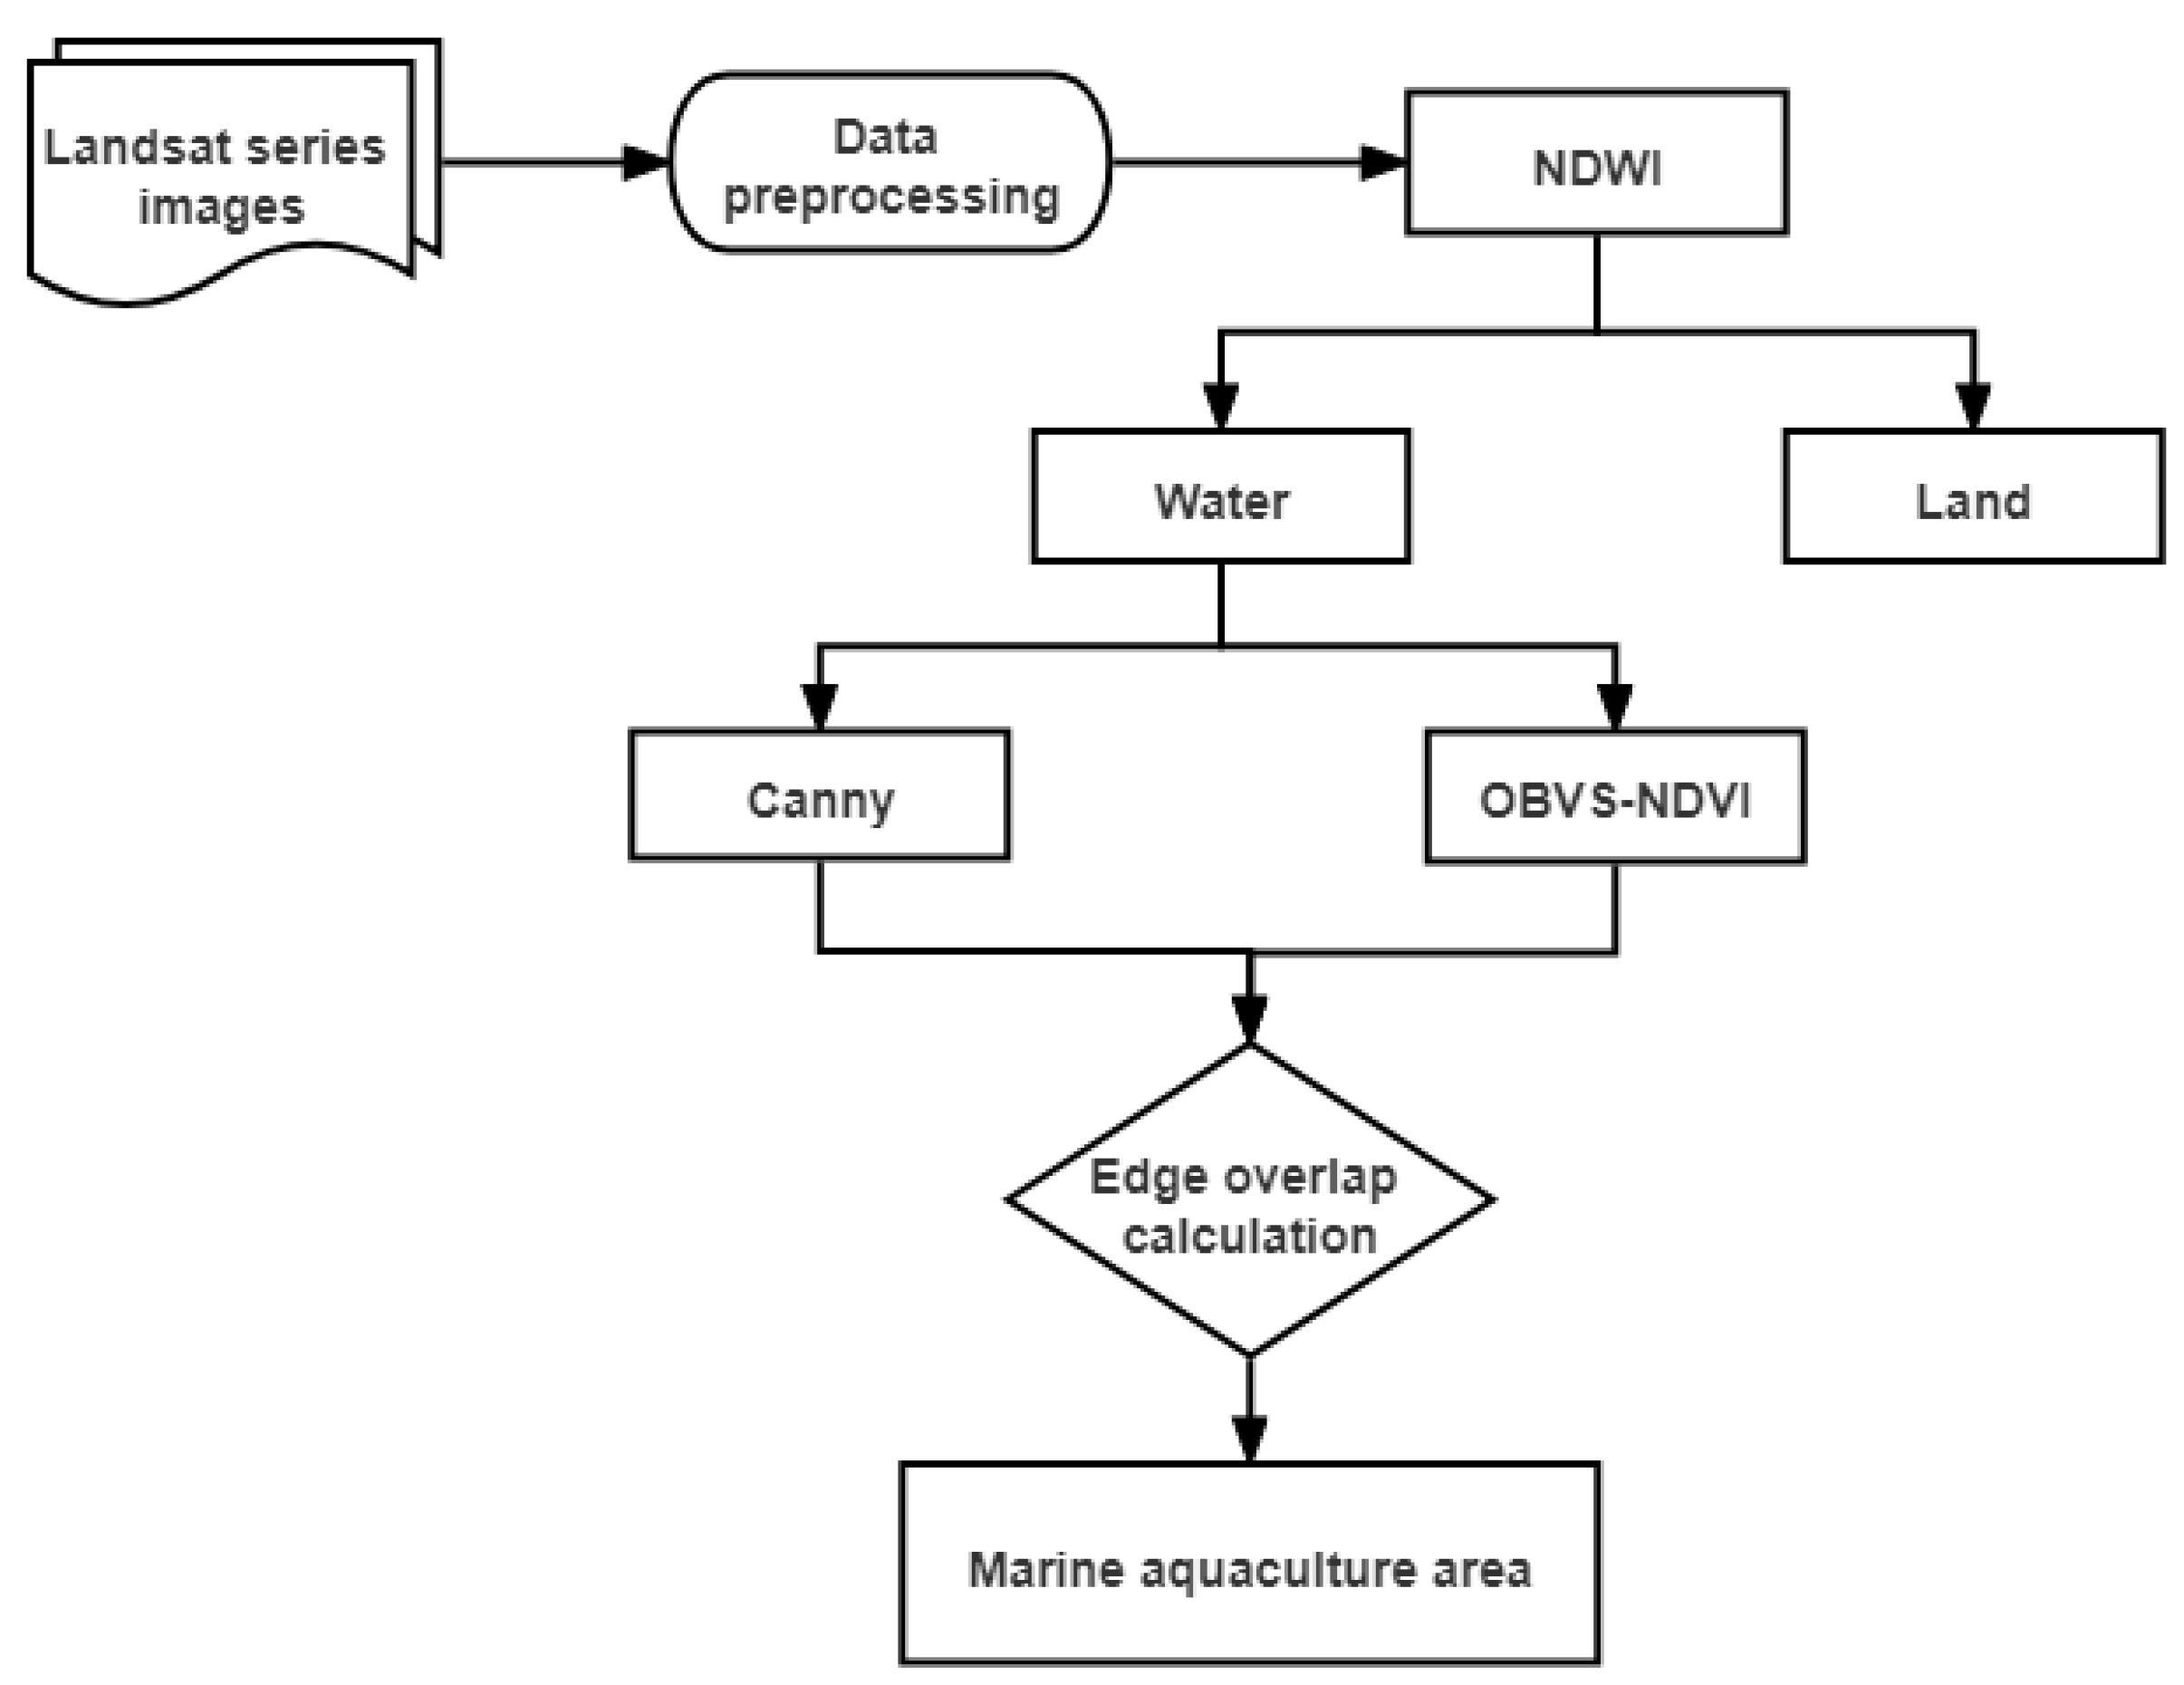
3.1. Dynamic Monitoring of Marine Aquaculture Area

A flowchart of the procedures adopted in this study is shown in Figure 4.
When selecting extraction methods for marine aquaculture areas, it is important to avoid inaccurate extraction results that can arise when marine aquaculture areas are located in a part of the spectrum close to that of the deep sea or when the spectrum is not uniform. In the case of complex seawater backgrounds, we adopted an object-oriented edge-detection method for extracting marine aquaculture areas [31], and achieved extraction of marine aquaculture areas from Landsat images. The proposed method not only makes use of the spectral characteristics of the Normalized Difference Vegetation Index (NDVI), but also integrates other spatial features, i.e., edge features. The extraction accuracy of the adopted method was >85%. The same method was also successfully applied to a study on the spatial distribution of time series data in Liaoning Province, a province neighboring Shandong Province [48]. This laid a reliable technical foundation for aquaculture extraction in Shandong Province. The specific steps of this method are given in brief in the following; please refer to our previous study for further details [31].
The first step is to separate seawater and land using the Normalized Difference Water Index (NDWI), and to eliminate interference from terrestrial and marine culture areas with similar spectral characteristics. Then, the object-based visually salient NDVI (OBVS-NDVI) features are determined to distinguish aquaculture areas from neighboring patches. Next, the approximate locations of aquaculture areas are delineated using an edge-detection algorithm. Finally, the aquaculture areas are extracted precisely by the degree of overlap of the edges and the OBVS-NDVI features of the aquaculture area. The main steps of the extraction process are shown in Figure 5.
Because the areas obtained by Xue et al. [49] and Wang et al. [30] were single aquaculture areas, they did not include the navigation channel for sowing and harvesting in the aquaculture area. However, in the statistical analysis of scale, it was necessary to treat the adjacent aquaculture contiguously (Figure 6). To superimpose aquaculture with MFZ, we connected the channel with aquaculture, and the connection result was analyzed with MFZ. We used the closed operator of the morphological method in digital image processing for standardization [50]. The principle of closing is dilation followed by erosion, which infills small cracks within the foreground object while leaving the overall position and shape unchanged, as shown in Equation (1):
ϕ B ( f ) = ε B ˘ [ δ B ( f ) ] ,
where ϕ B ( f ) indicates that image element f is closed by structural element B . The specific implementation form is to first perform expansion operation δ B on image f by using structural element B ; see Equation (2). Then, reflection B of structural element B ˘ is used as the erosion operation, as shown in Equation (3):
δ B ( X ) = { x | B x X } ,
  ε B ( X ) = { x | B x X } ,
where x represents the original trajectory of the structural element. In this study, to connect the sparse marine aquaculture areas, we took the maximum street distance between two sparse marine aquaculture areas as the range, and found that the maximum range distance was approximately 20 pixels. Therefore, we chose structural element B to select a disk with a radius of 300 m, and to maintain isotropy during contiguous processing. For disk-shaped structural elements, the reflection is the same as the original structure.
After the linkage process, on this basis, the marine aquaculture areas were divided into four grades according to size (Table 2), and the number of different-sized classes of farming area was counted separately for each period.
As there are some differences in the types of aquaculture and sea areas between Shandong Province and Liaoning Province, it was necessary to verify the accuracy after obtaining the extraction results. Therefore, a group of four people from our laboratory undertook field research in May 2019 in coastal marine aquaculture areas of Shandong Province; we conducted a two-sided investigation mainly in two ways. First, a field visit to the sea area provided valuable knowledge regarding visual interpretation of marine aquaculture areas in Landsat images. Second, discussion with the managers of a local marine aquaculture company provided information regarding the harvesting and sowing times of marine aquaculture areas and their history of change (Figure 7). Subsequently, accuracy verification was performed on the basis of available a priori knowledge. The first step in the accuracy assessment was to select a bay with a high density of marine aquaculture and relatively stable marine aquaculture from 1990–2018 to ensure the representativeness of the regional selection. Then, we randomly generated 300 sample points and discriminated against the categories of sample points combined with Landsat images and high-resolution Google Earth™ images. Finally, an accuracy assessment was performed. Because of the high cost of fieldwork and the limited number of samples, it was difficult to accurately evaluate the exactness of the interpretation. However, we found that after artificial visual inspection of the image, verification of many encryption samples could be achieved in the laboratory with almost 100% accuracy and at low cost, thereby achieving an accurate evaluation of the interpretation results. The index formula for the accuracy evaluation (Equations (4)–(6)) is:
precision = TP TP + FP ,
recall = TP TP + FN ,
F - measure = 2 · recall · precision recall + precision ,
where TP is the correct value, FP is a misstated value, FN is the missing value, and F-measure is a combination of accuracy and recall. In theory, better results should have higher accuracy and recall rates, but in practice, accuracy and recall rates are often conflicting. Therefore, the F-measure was used to evaluate the extraction results comprehensively.

3.2. Overlay Analysis of Aquaculture and MFZ

The MFZ data are from the “Regulation of Marine Function in Shandong Province” (2011–2020) [51]. They divide marine functional areas into delineated agricultural and fishery areas, port and shipping areas, industrial and urban areas, mineral and energy areas, tourism and entertainment areas, marine protected areas, special use areas, and reserved areas [52]. Among them, agricultural and fishery areas occupy the largest proportion of MFZ. Before analysis, the MFZ data need to be geometrically registered with the data relating to the aquaculture area, and vectorized, so that the aquaculture area can be spatially analyzed. We chose the automatic registration tool in ENVI5.2 software for registration; this has an accuracy of 1 m.
We conducted a spatial statistical analysis of aquaculture areas at two scales: provincial and functional area. Provincial-level statistics were used for all coastal planning areas as a statistical unit to calculate the total marine aquaculture area in different years. This statistic was mainly used to obtain the overall changing trend in aquaculture development in Shandong Province, especially the trend in change of the total aquaculture area around 2010. It was of great value in an overall examination of the promotion, suppression or ineffective exploration and analysis of functional areas for aquaculture. Functional area scale statistics (i.e., different functional planning types) were used to analyze the area covered by aquaculture. Statistics at this scale can contribute to at least two aspects of analysis: (1) to assess the degree of conformity between the current functional plan and the historical aquaculture area, and to evaluate the rationality of the plan; and (2) to analyze the guiding role of the development of functional areas and aquaculture areas from the perspective of time-series changes. In addition, to analyze the reasons for the change in aquaculture area from the perspective of the structure of aquaculture scale, we also carried out grading statistics on the size of the patches in the aquaculture area, including the number and area of patches at different levels of the aquaculture area and the proportion indicators.

4. Result

4.1. Changes in the Area and Spatial Distribution of Marine Aquaculture

4.1.1. Results of Evaluating Extraction Accuracy in Marine Aquaculture Area

In April 2019, we combined the field surveys of remote sensing images and manually encrypted 300 sample points to evaluate the extraction accuracy of marine aquaculture in the region. The evaluation results showed that the accuracy of the marine aquaculture area extracted in this study was above 85% on average (Table 1), and above 90% in some years. They fully showed that the changes in marine aquaculture area extracted by this study were comparable, and the data accuracy was reliable; this laid the foundation for subsequent analysis.
The F-measure value of the aquaculture area was obtained by calculating the confusion matrix of the extraction results of aquaculture area in phase 7 of the research area. The overall precision of extracted aquaculture areas in phase 7 of Shandong Province was greater than 84% (Table 3). This showed that the extraction scheme used in our study was feasible, and the data accuracy was increased, and so able to meet our subsequent analysis needs.

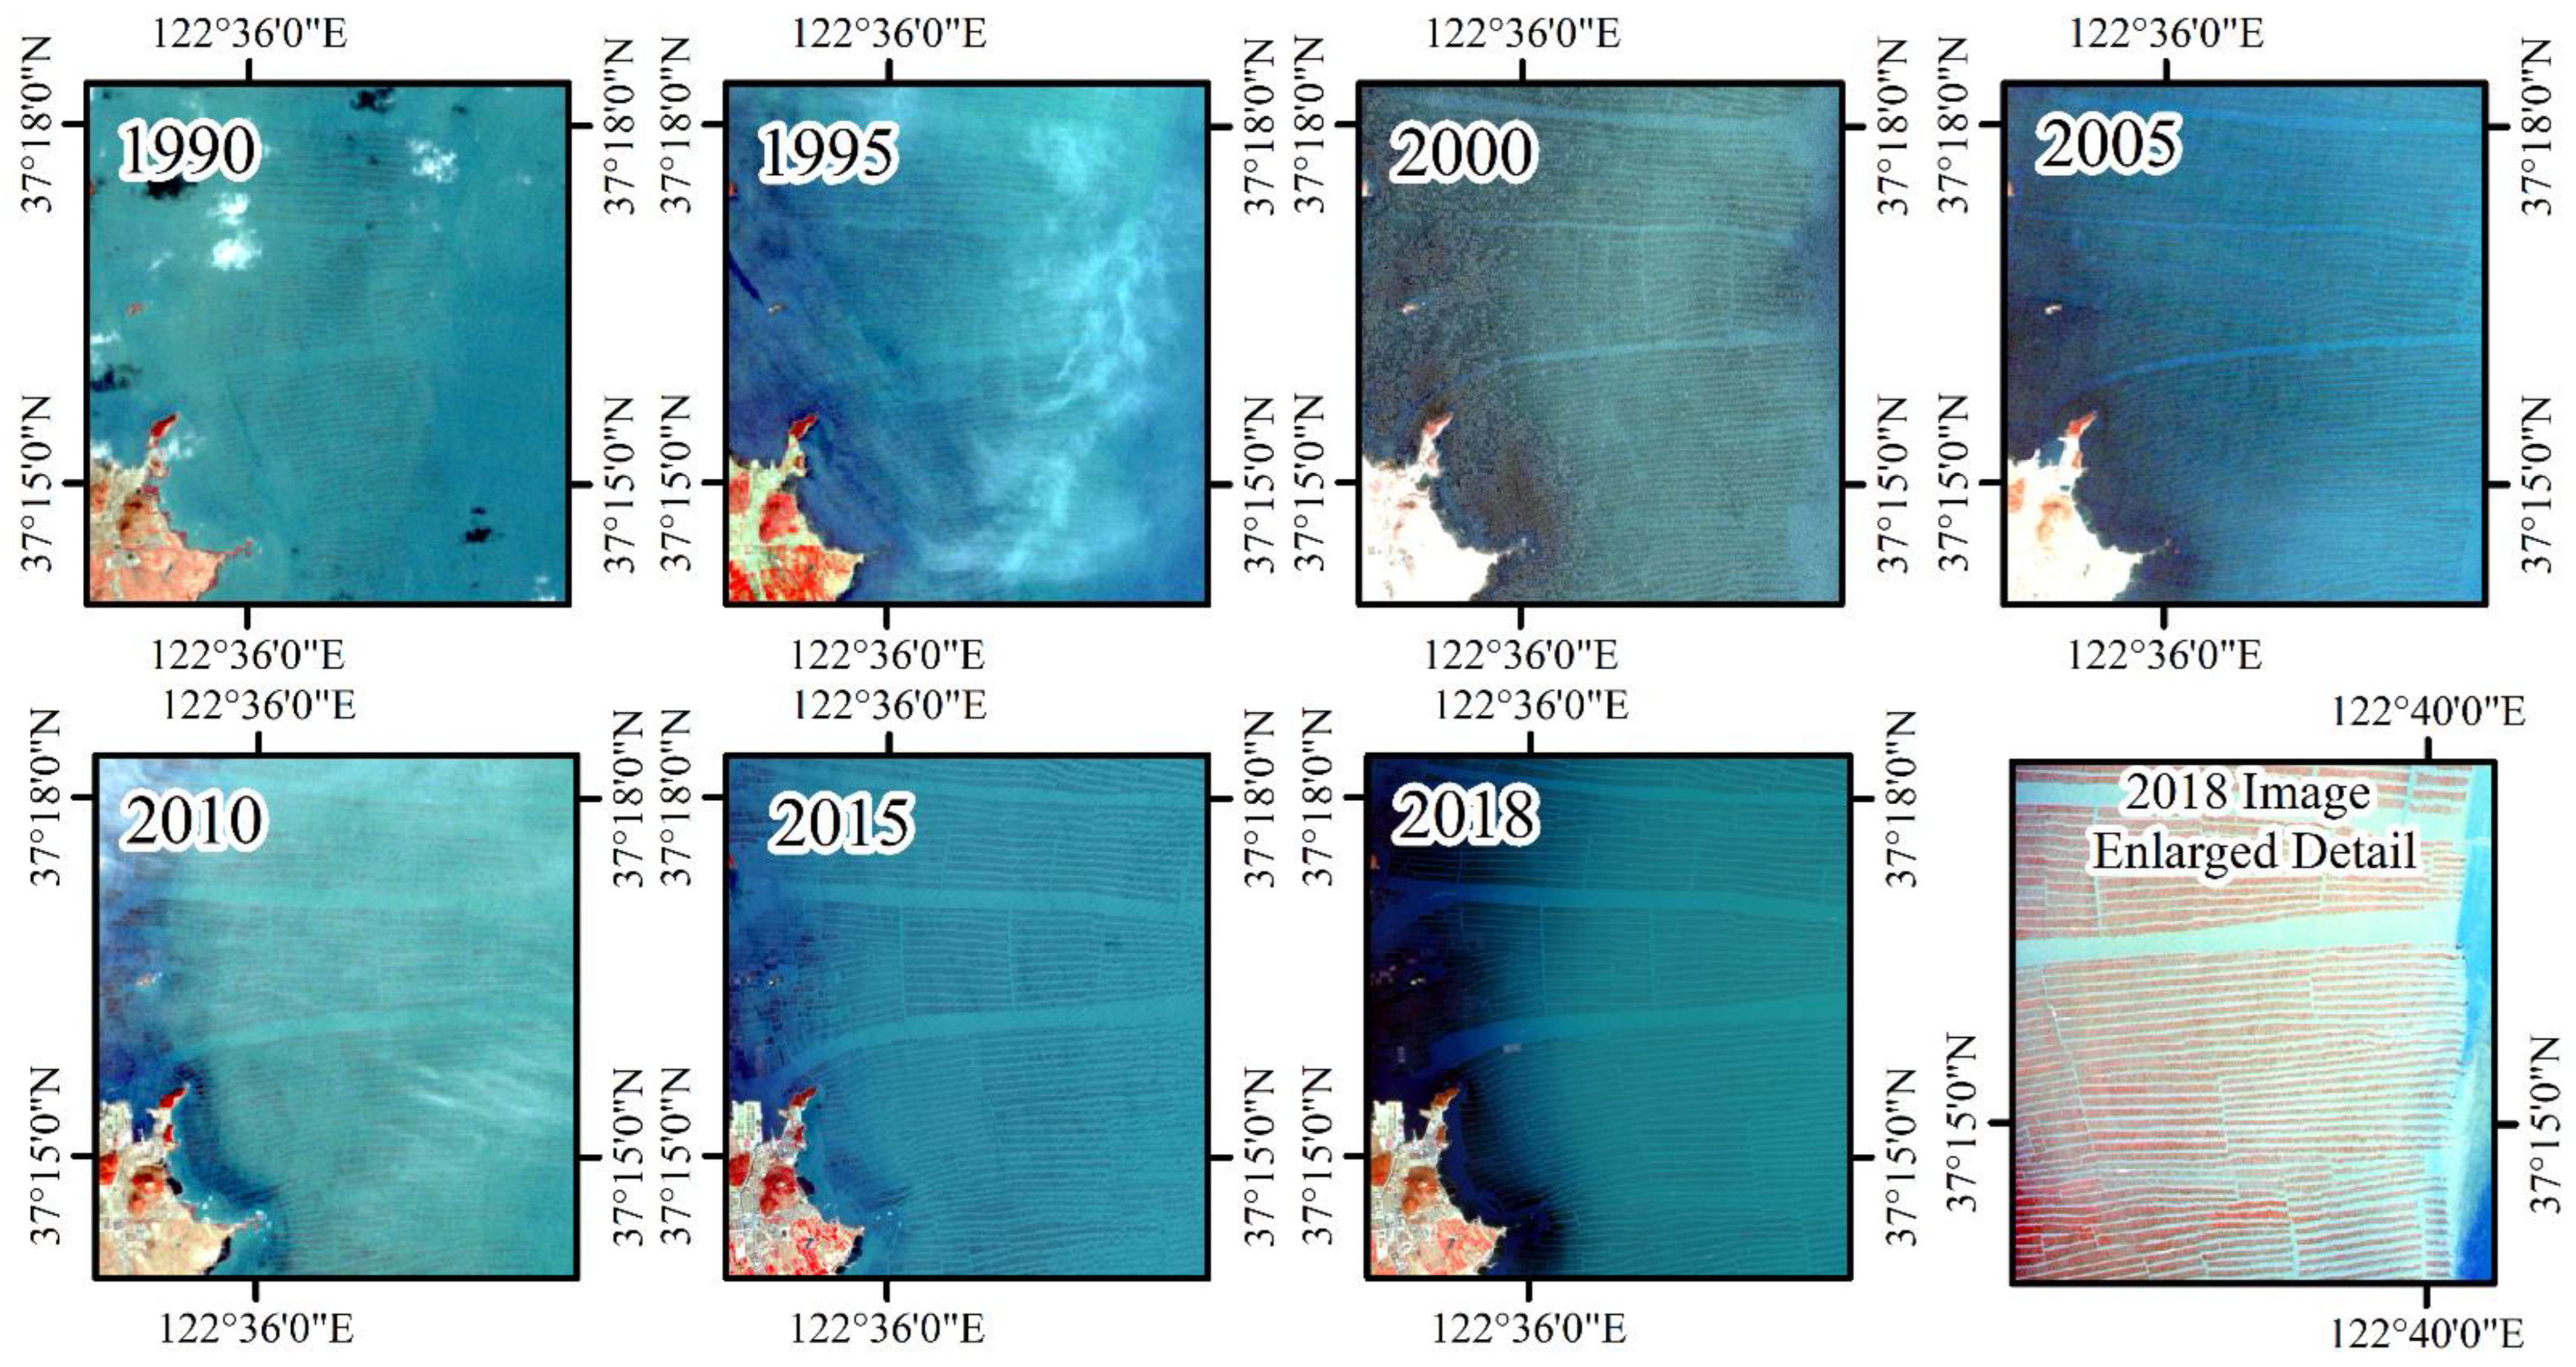
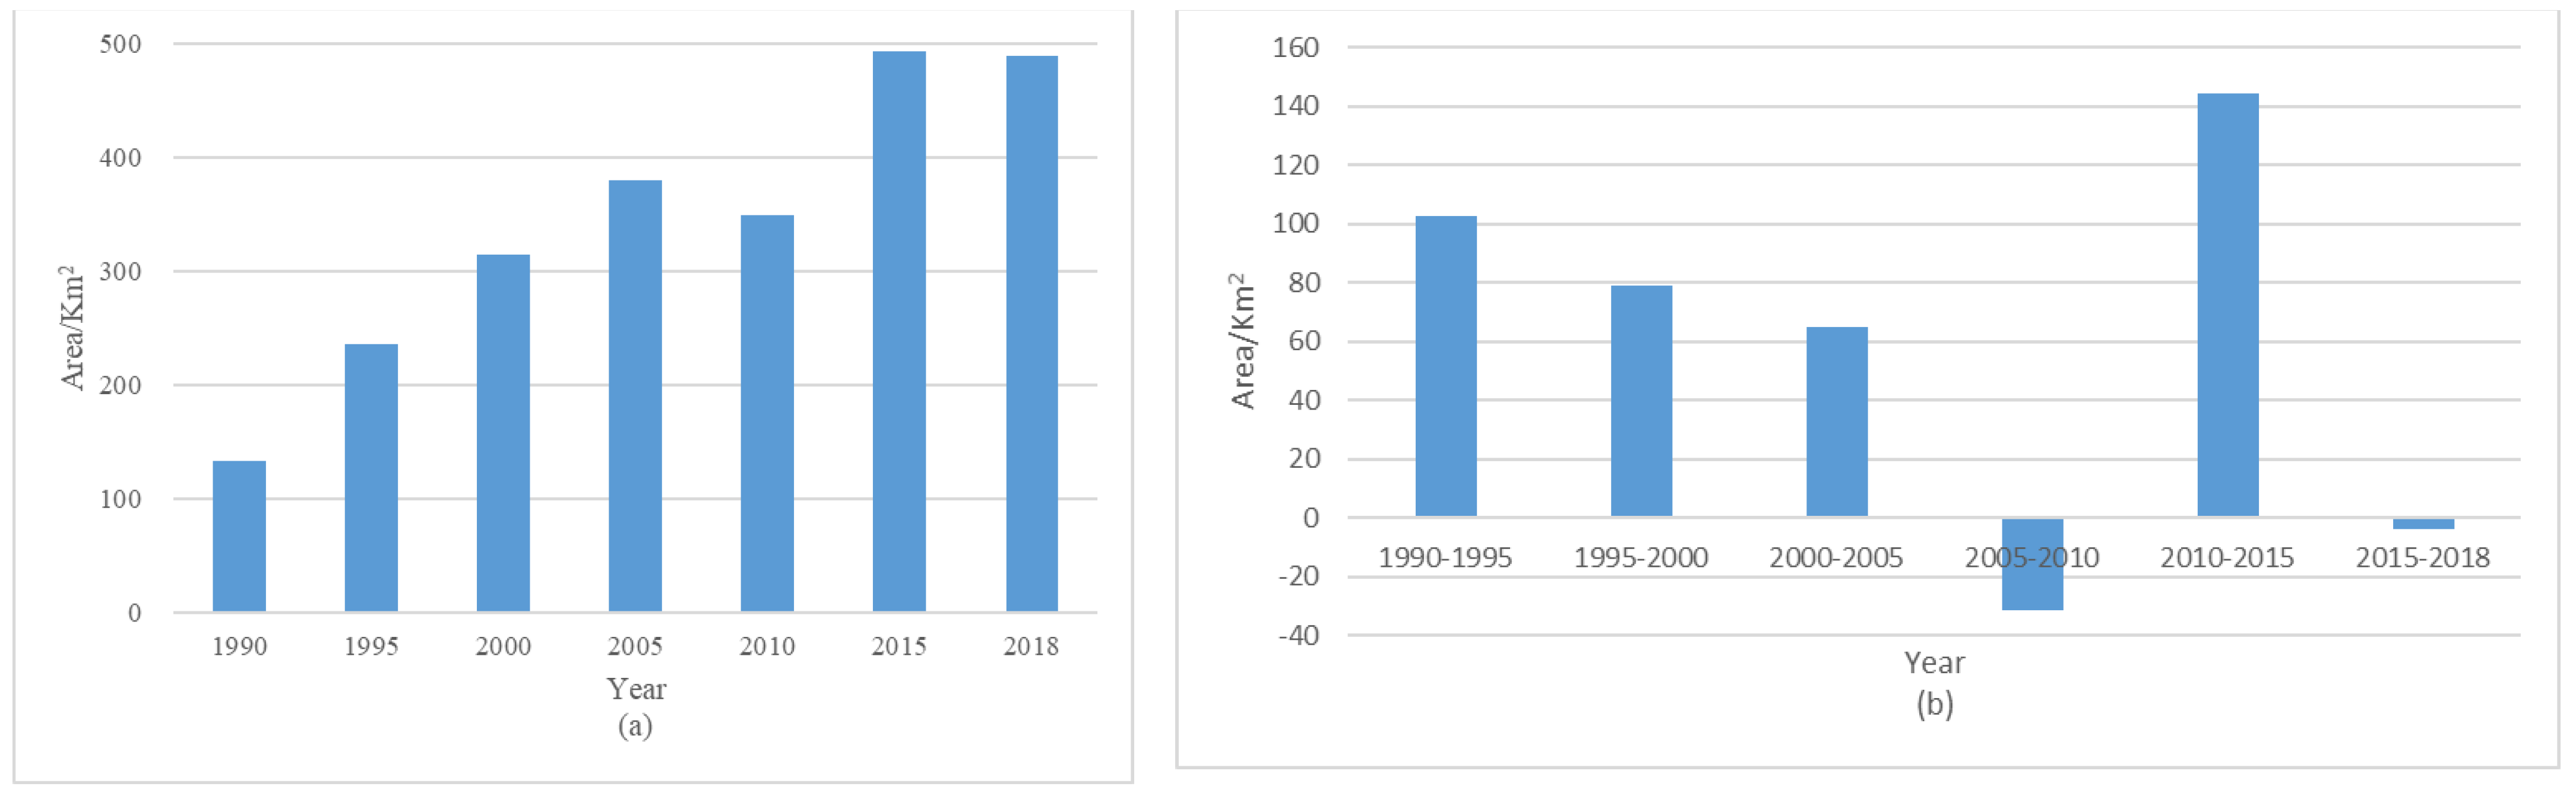
4.1.2. Marine Aquaculture Area Changes, 1990–2018

The overall marine aquaculture area showed a large and volatile fluctuation trend (Figure 8), but there were significant anomalies around 2010. The aquaculture area increased from 132.96 km2 in 1990 to 489.14 km2 in 2018, almost four times that of 1990. Between 1990 and 2005, the aquaculture area continued to increase, reaching a small peak of 379.58 km2 in 2005. However, remote sensing monitoring showed that, between 2005 and 2010, the aquaculture area did not rise but declined. In 2010, it was 348.46 km2, a decrease of 8.20%. After this, a process of substantial increase then took place. In 2015, the area increased by 144.72 km2, larger than the previous increase, reaching an astonishing 493.15 km2. However, this explosion did not continue, according to the remote sensing monitoring results in 2018, and area began to show a small decline again, although by only 4.04 km2.

4.1.3. Process of Variation in Marine Aquaculture Areas with Different Patch Grades

To fully understand the spatial distribution change pattern of aquaculture remote sensing, we classified and counted the patches according to their area. Because the repeated single raft row occupies approximately 100 pixels in the multi-spectral remote sensing image with a spatial resolution of 30 × 30 m, the minimum standard of our statistical scale started from 0.1 km2 (Table 4). In terms of the number of patches, except for small patches, the number of other types of patches is generally increasing. For example, middle-sized patches increased from 21 in 1990 to 45 in 2018, large patches increased from 8 in 1990 to 15 in 2018, and super-large patches increased from 4 in 1990 and to 11 in 2015, before falling to 8 in 2018 (Table 4). From the area of patches of various grades, a similar phenomenon also exists. This reflects the increase in the total aquaculture area in Shandong Province as a result of the expansion of various scales of aquaculture.
Super-large patches were the main bodies of aquaculture in terms of area ratio; they were all above 70% of the total aquaculture area, and were increasing. Large patches were an important part of the aquaculture area. However, the change in area ratio of super-large patches showed a decreasing trend, from 23.00% in 1995 to 7.15% in 2015. This showed that, despite the expansion in aquaculture of all sizes, there was a clear trend in large-scale development of marine aquaculture in the waters near Shandong from the perspective of composition structure.

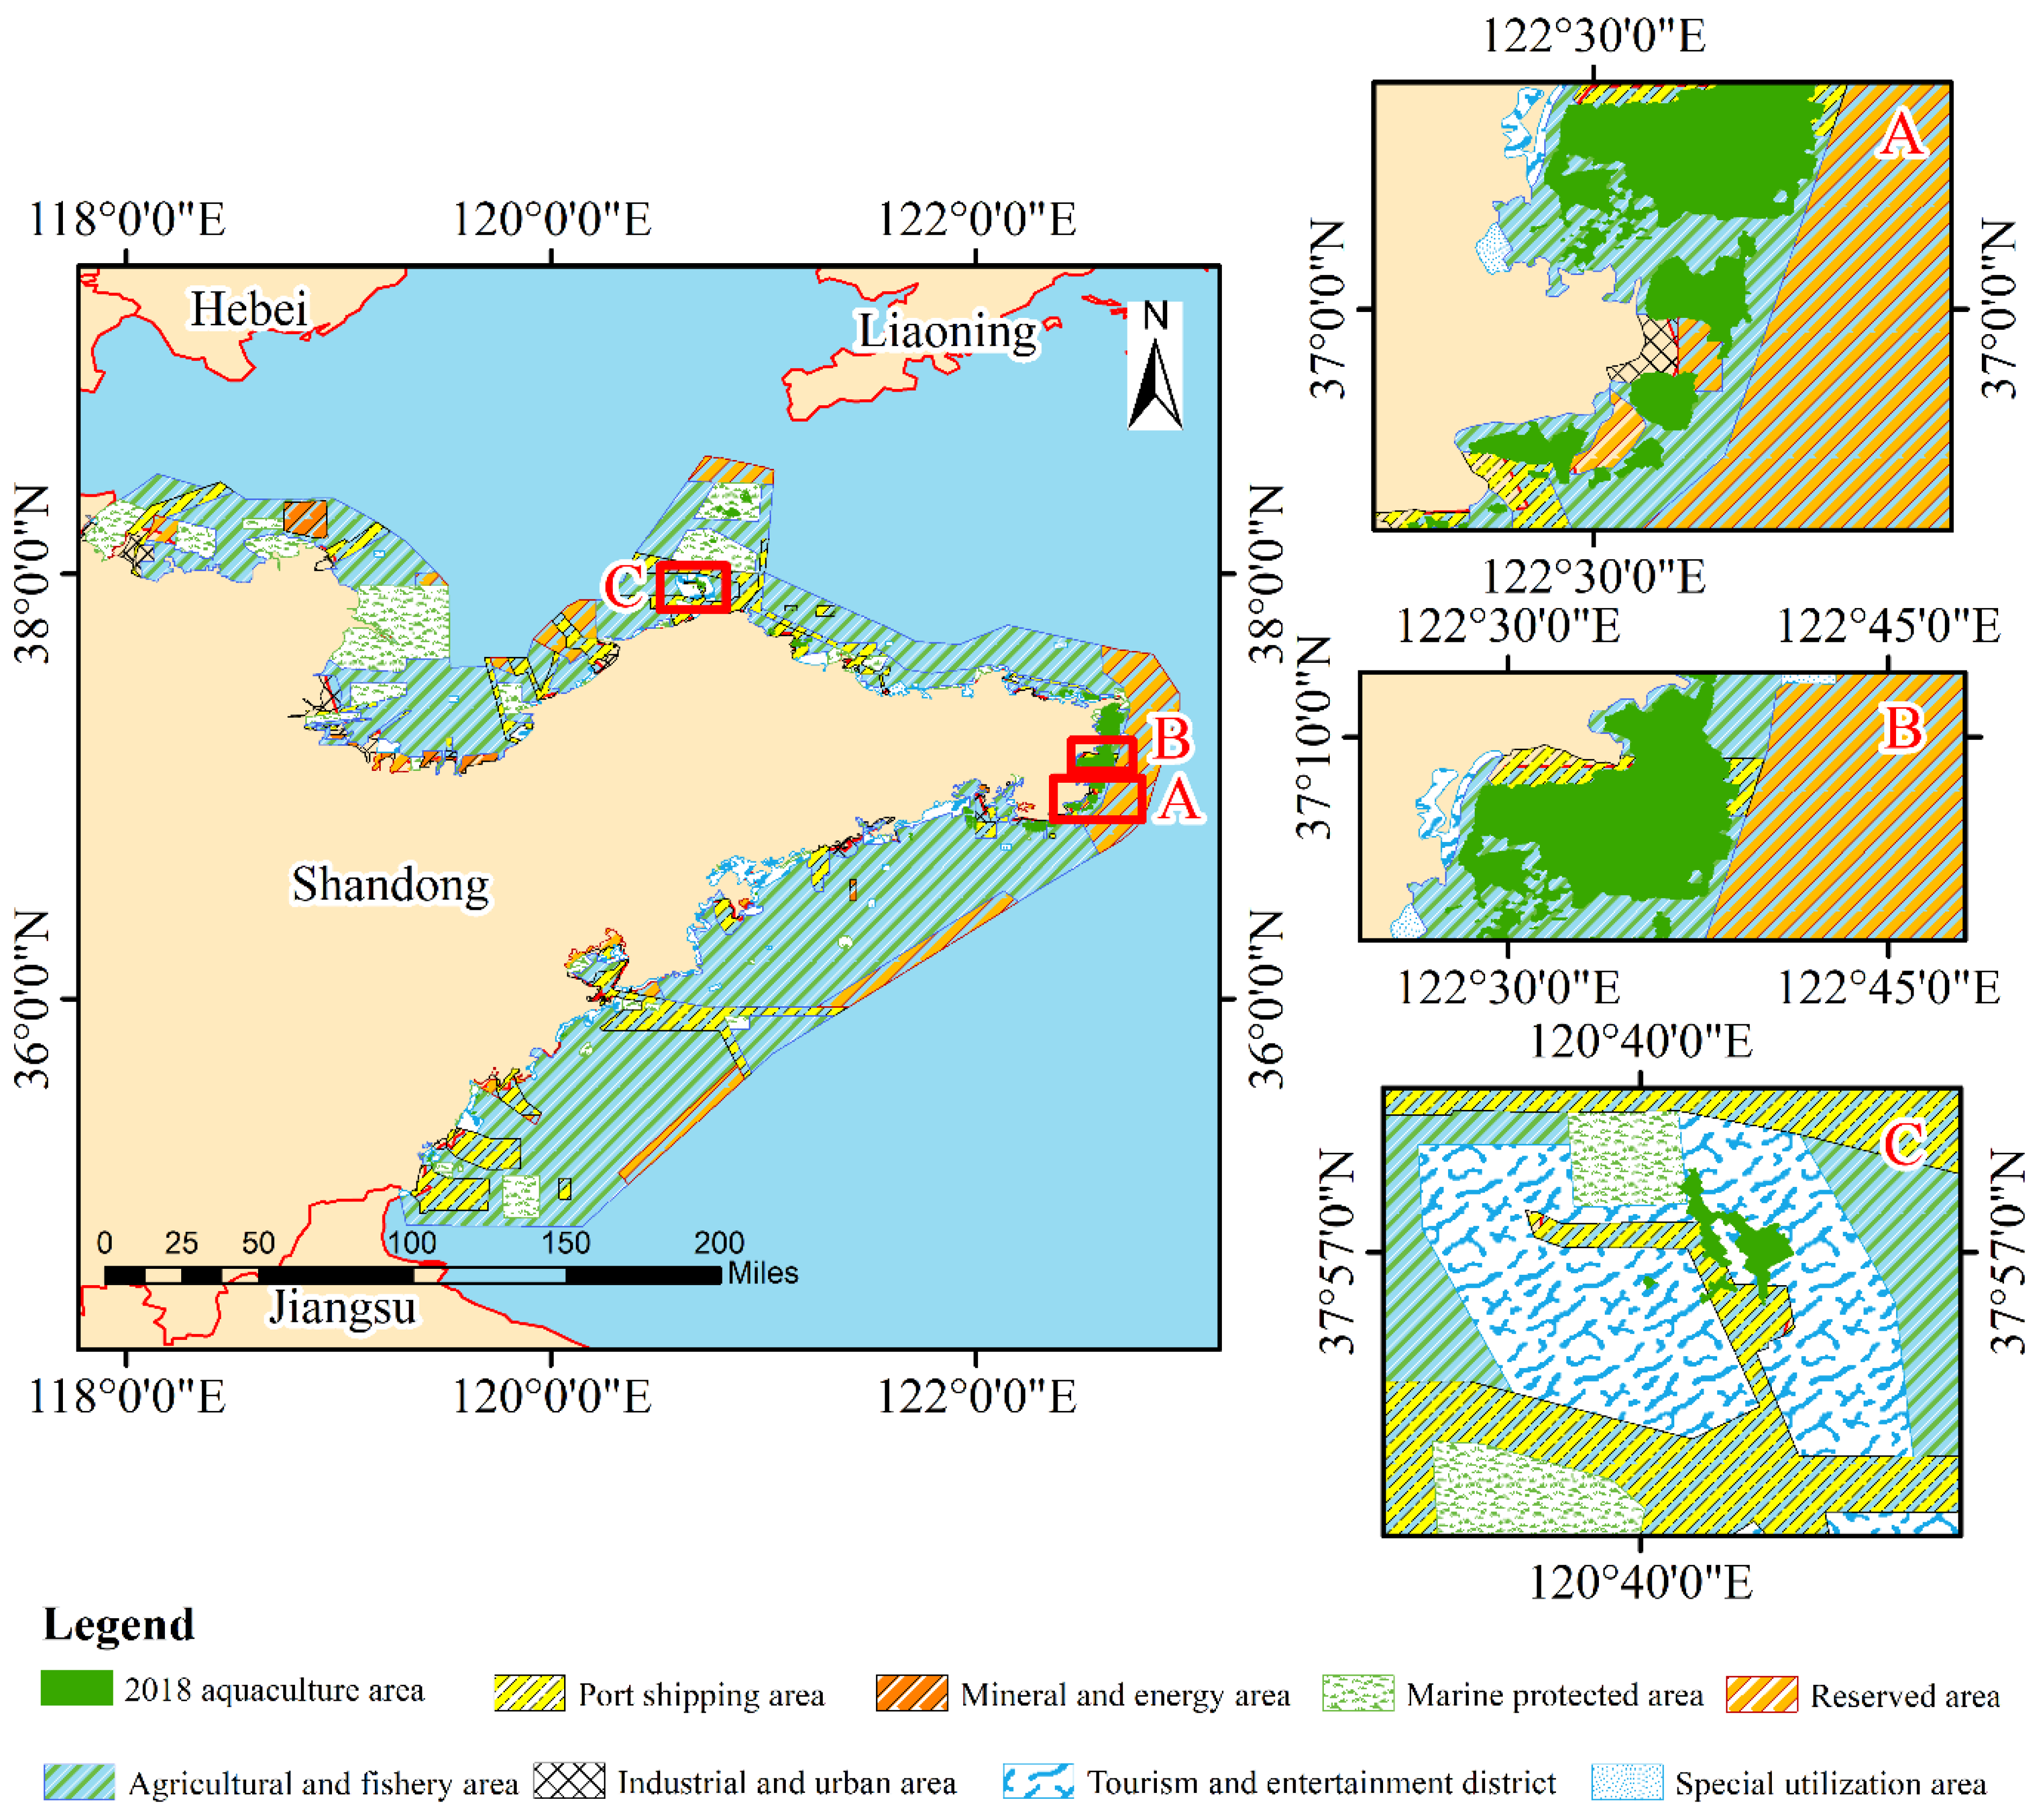
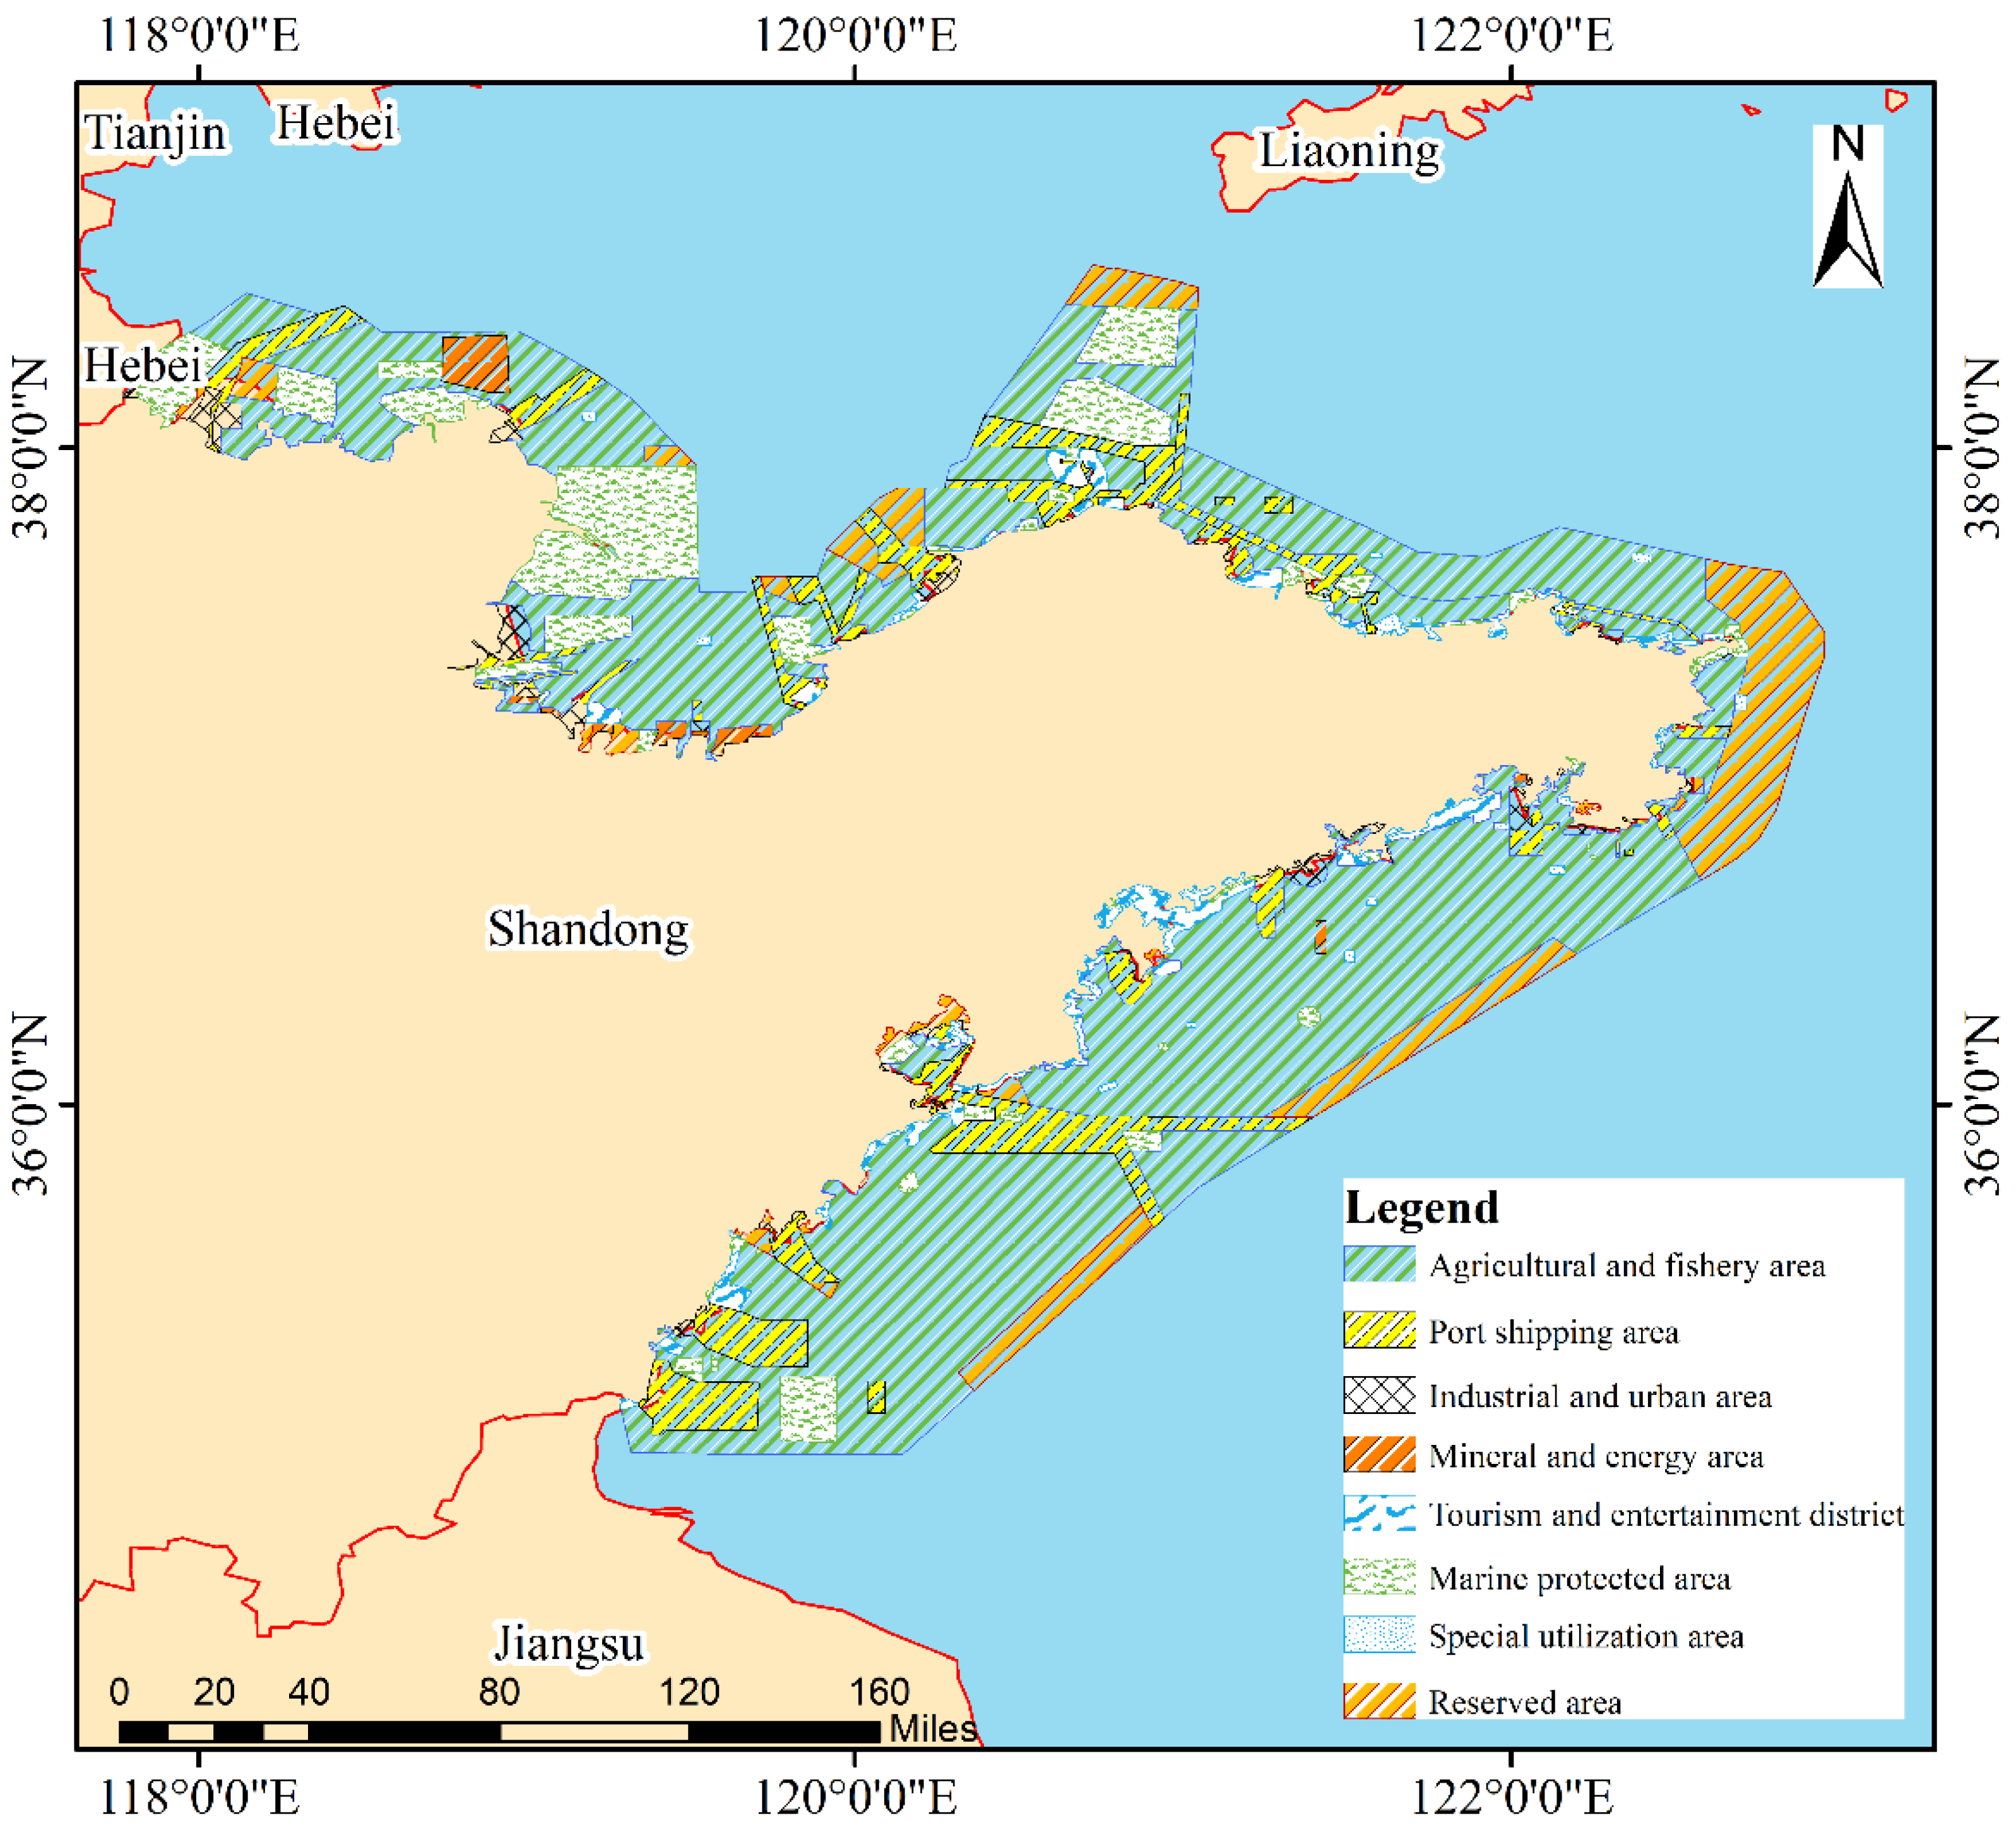
4.2. Superimposed Analysis Results of Marine Aquaculture and MFZ

From the perspective of the whole province, marine aquaculture in the agricultural and fishery area accounted for the main proportion of total aquaculture in the MFZ, and the proportion was gradually increasing (Figure 9). The statistical results (Table 5) show that the aquaculture area in the agricultural and fishery area was 83.72 km2 in 1990 and increased to 344.76 km2 in 2018. The largest increase in the agricultural and fishery areas was from 2010 to 2015, with an increase of nearly 108.04 km2. From the perspective of area ratio, marine aquaculture included in the agricultural and fishery area increased from 62.98% in 1990 to 70.48% in 2018.
However, our study also found that many marine aquaculture phenomena existed in non-agricultural fishery planning areas. Taking 2018 as an example, other functional areas within relatively large marine aquaculture areas were mainly concerned with ports and shipping (69.41 km2) and marine protection (52.13 km2), which together accounted for nearly 25% of the total marine aquaculture area. In addition, there was also a small amount of aquaculture in the tourist and entertainment area (7.75 km2), industrial and urban area (6.31 km2), special utilization area (4.95 km2), and reserved area (3.83 km2), accounting for nearly 5%. Only the planned mineral energy area (relating to gas or oil extraction) had not monitored aquaculture activities. From the time-series perspective, the proportion of aquaculture areas included in the port and shipping areas showed a significant downward trend, with a total decrease of about 10 percentage points (from 24.62% to 14.19%). Marine aquaculture activities in the marine protection zone mainly remained above 10%, compared with 11.15% in 1990, and accounted for 10.66% in 2018. Although the proportion of marine aquaculture in non-agricultural fishery areas decreased, the total area was still increasing. When comparing the data of 2010 and 2018 (before and after the implementation of the MFZ) we could see that the aquaculture of the port and shipping area, marine protected area, and tourist entertainment area still increased by 7.72 km2, 11.52 km2 and 5.73 km2, respectively.
The results showed that the area of marine aquaculture in Shandong Province had increased volatility, and that a critical fluctuation node appeared around 2010. The growth in marine aquaculture was mainly the result of the comprehensive expansion of aquaculture at various scales and the overall development trend toward scale. Among the MFZ, the agricultural and fishery areas were the main areas for aquaculture expansion, followed by the port and shipping areas, marine protected area, and tourism and entertainment area. Restraint and guidance, intended to be imposed on the expansion of aquaculture by the MFZ, was not obvious during the study period. Our dynamic monitoring of the marine aquaculture area suggested that there were a large number of marine aquaculture phenomena within the non-agricultural and fishery planning areas, and especially in the distribution of aquacultural activity in marine protected areas, indicating that there was a blind spot in the basic data used by MFZ.

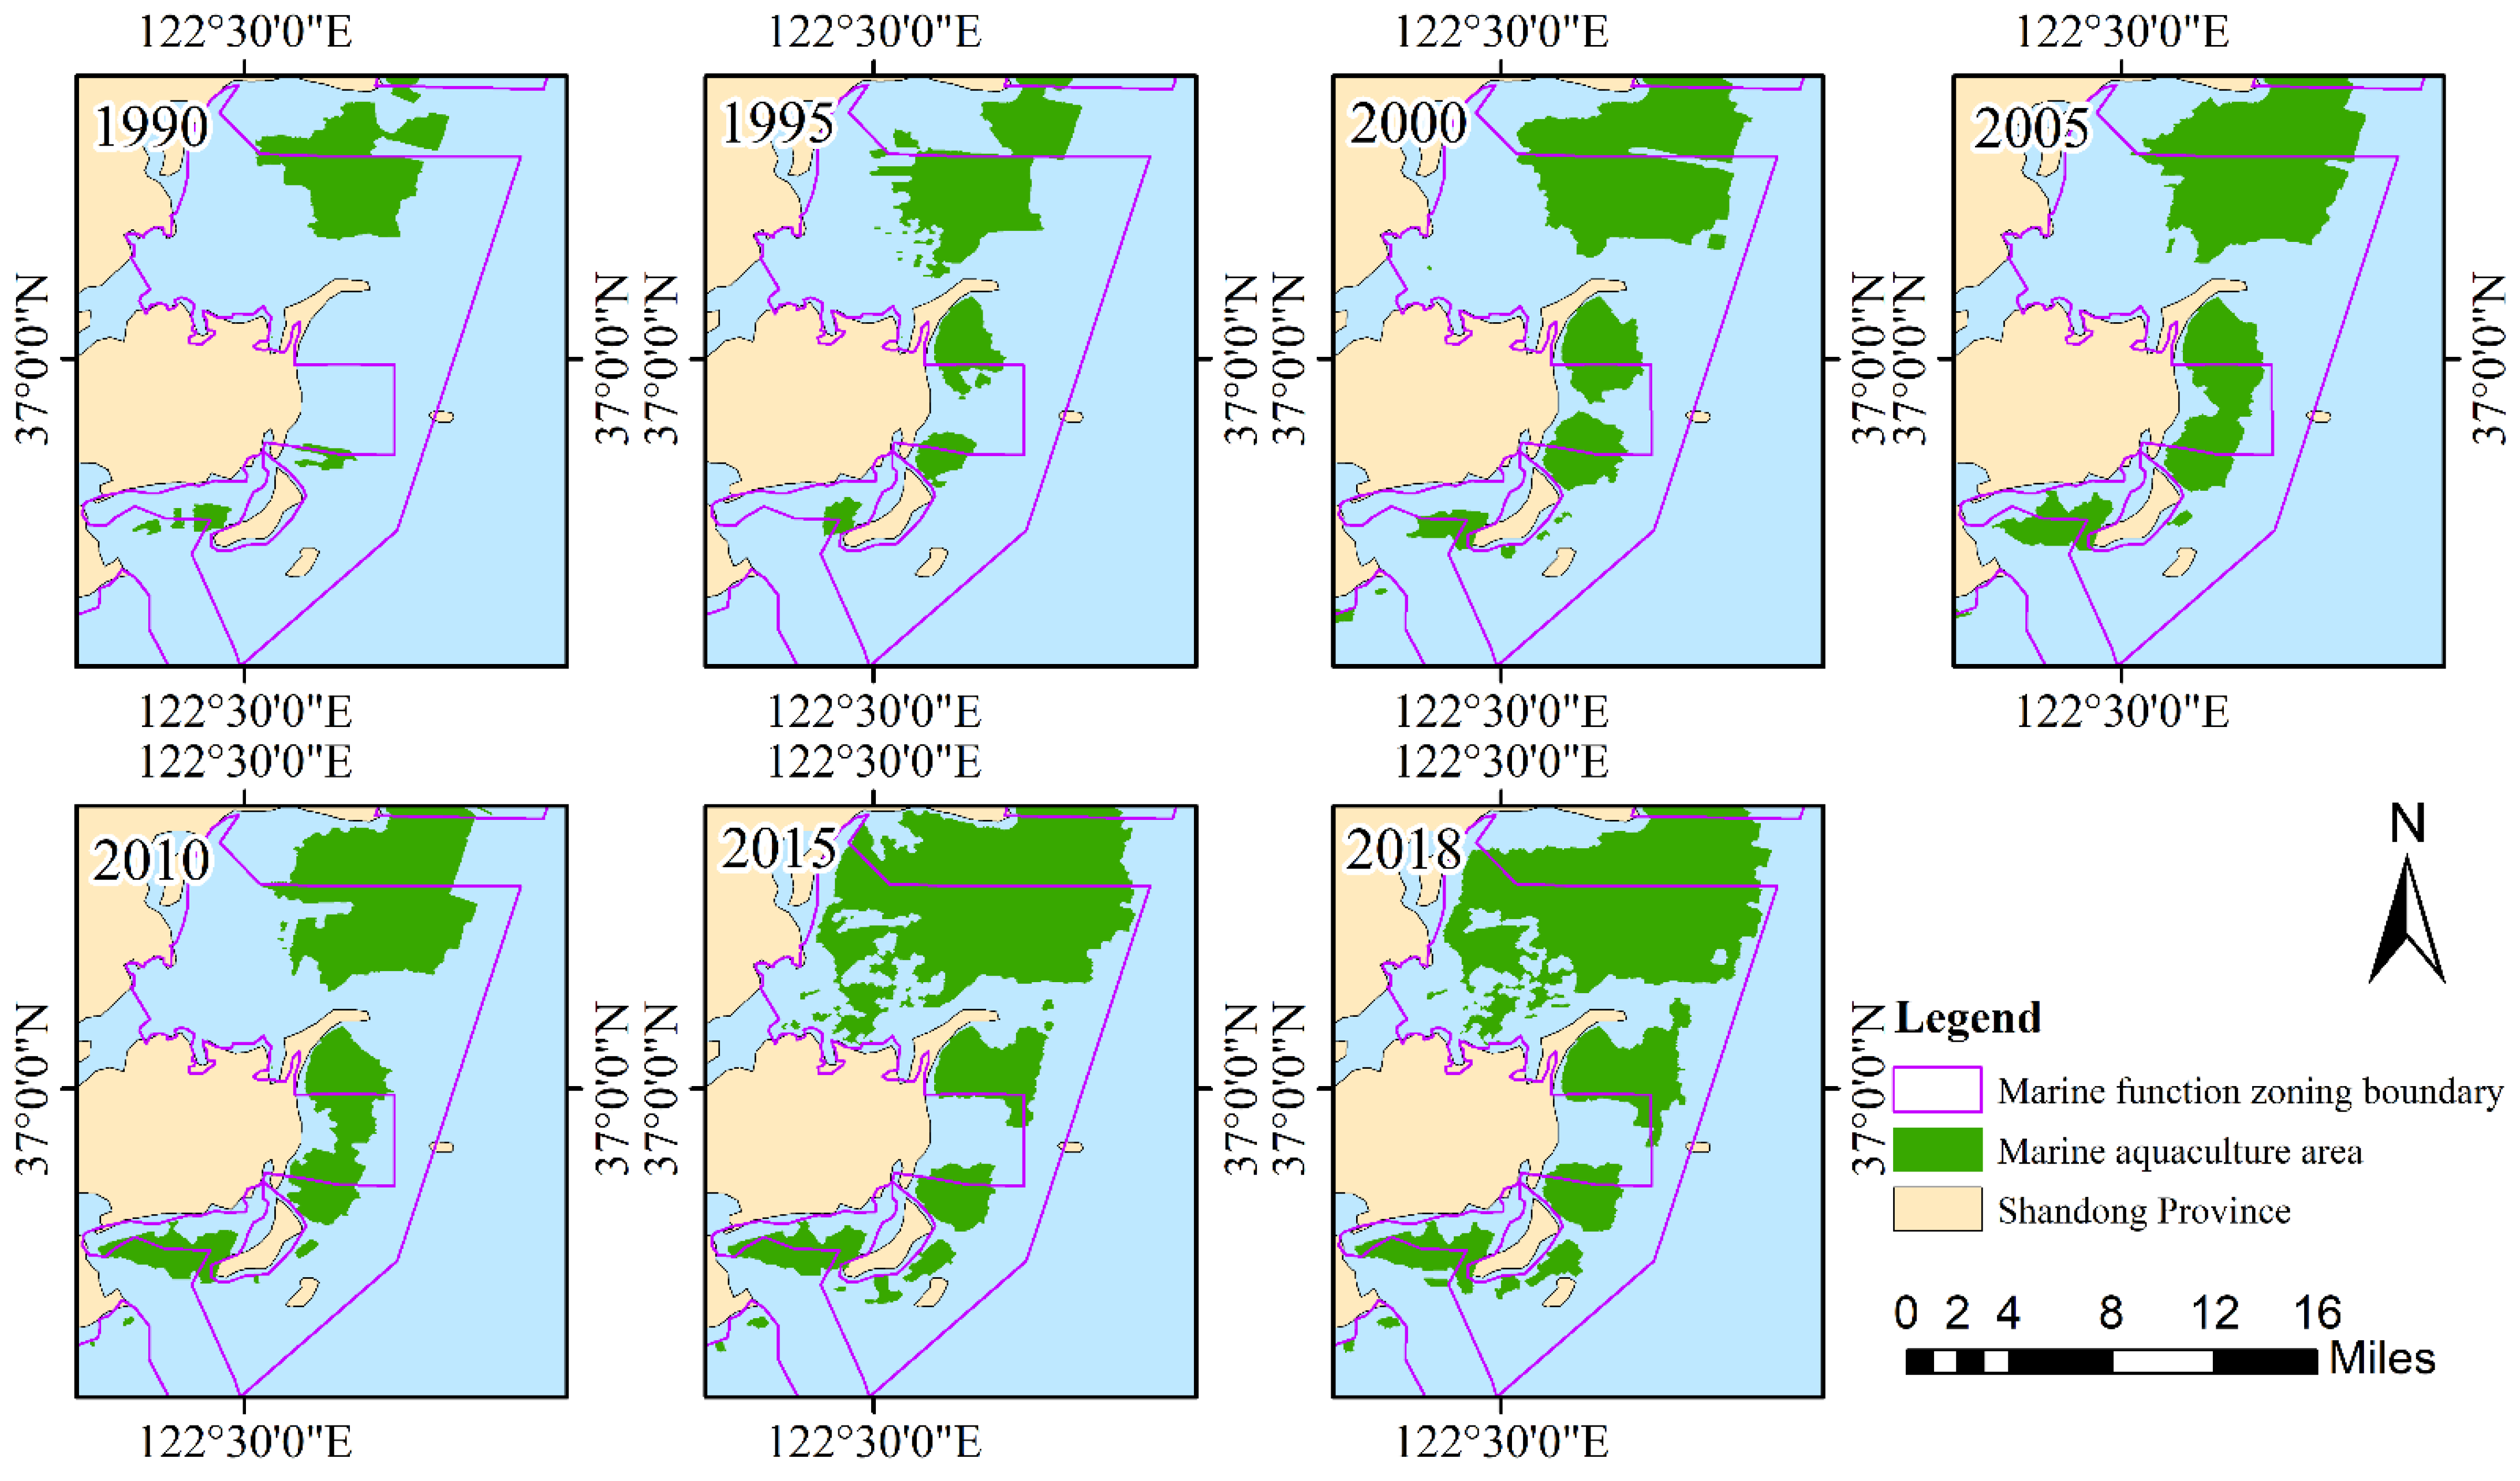
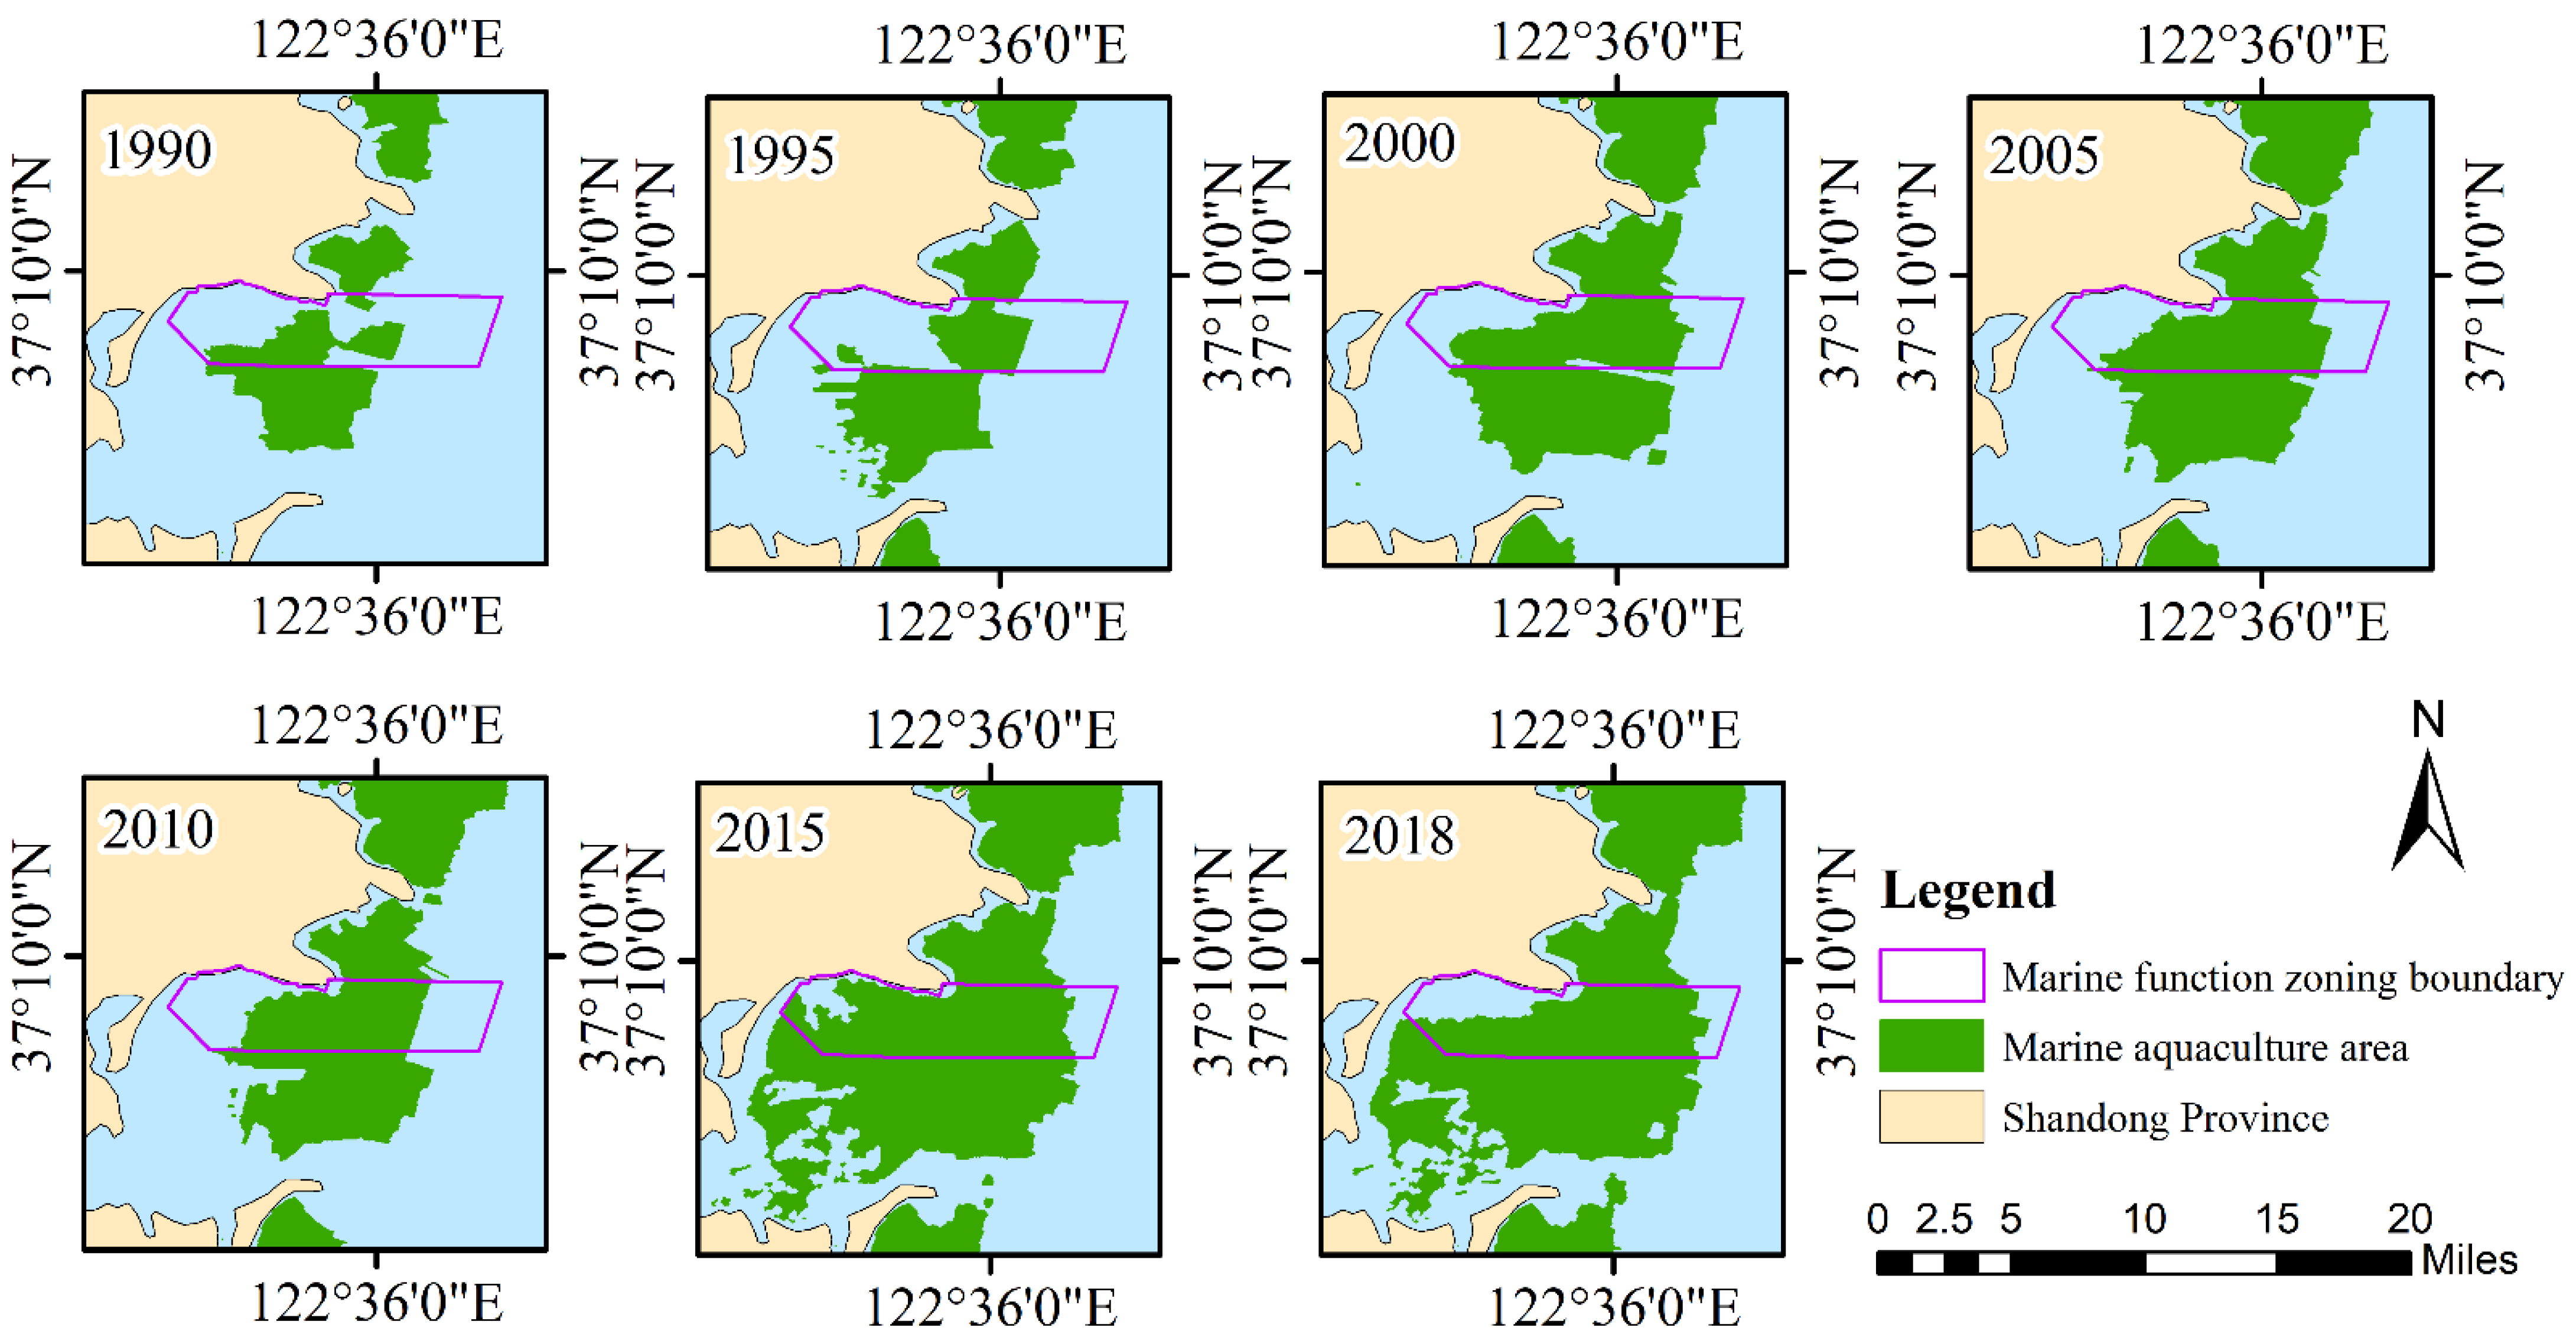
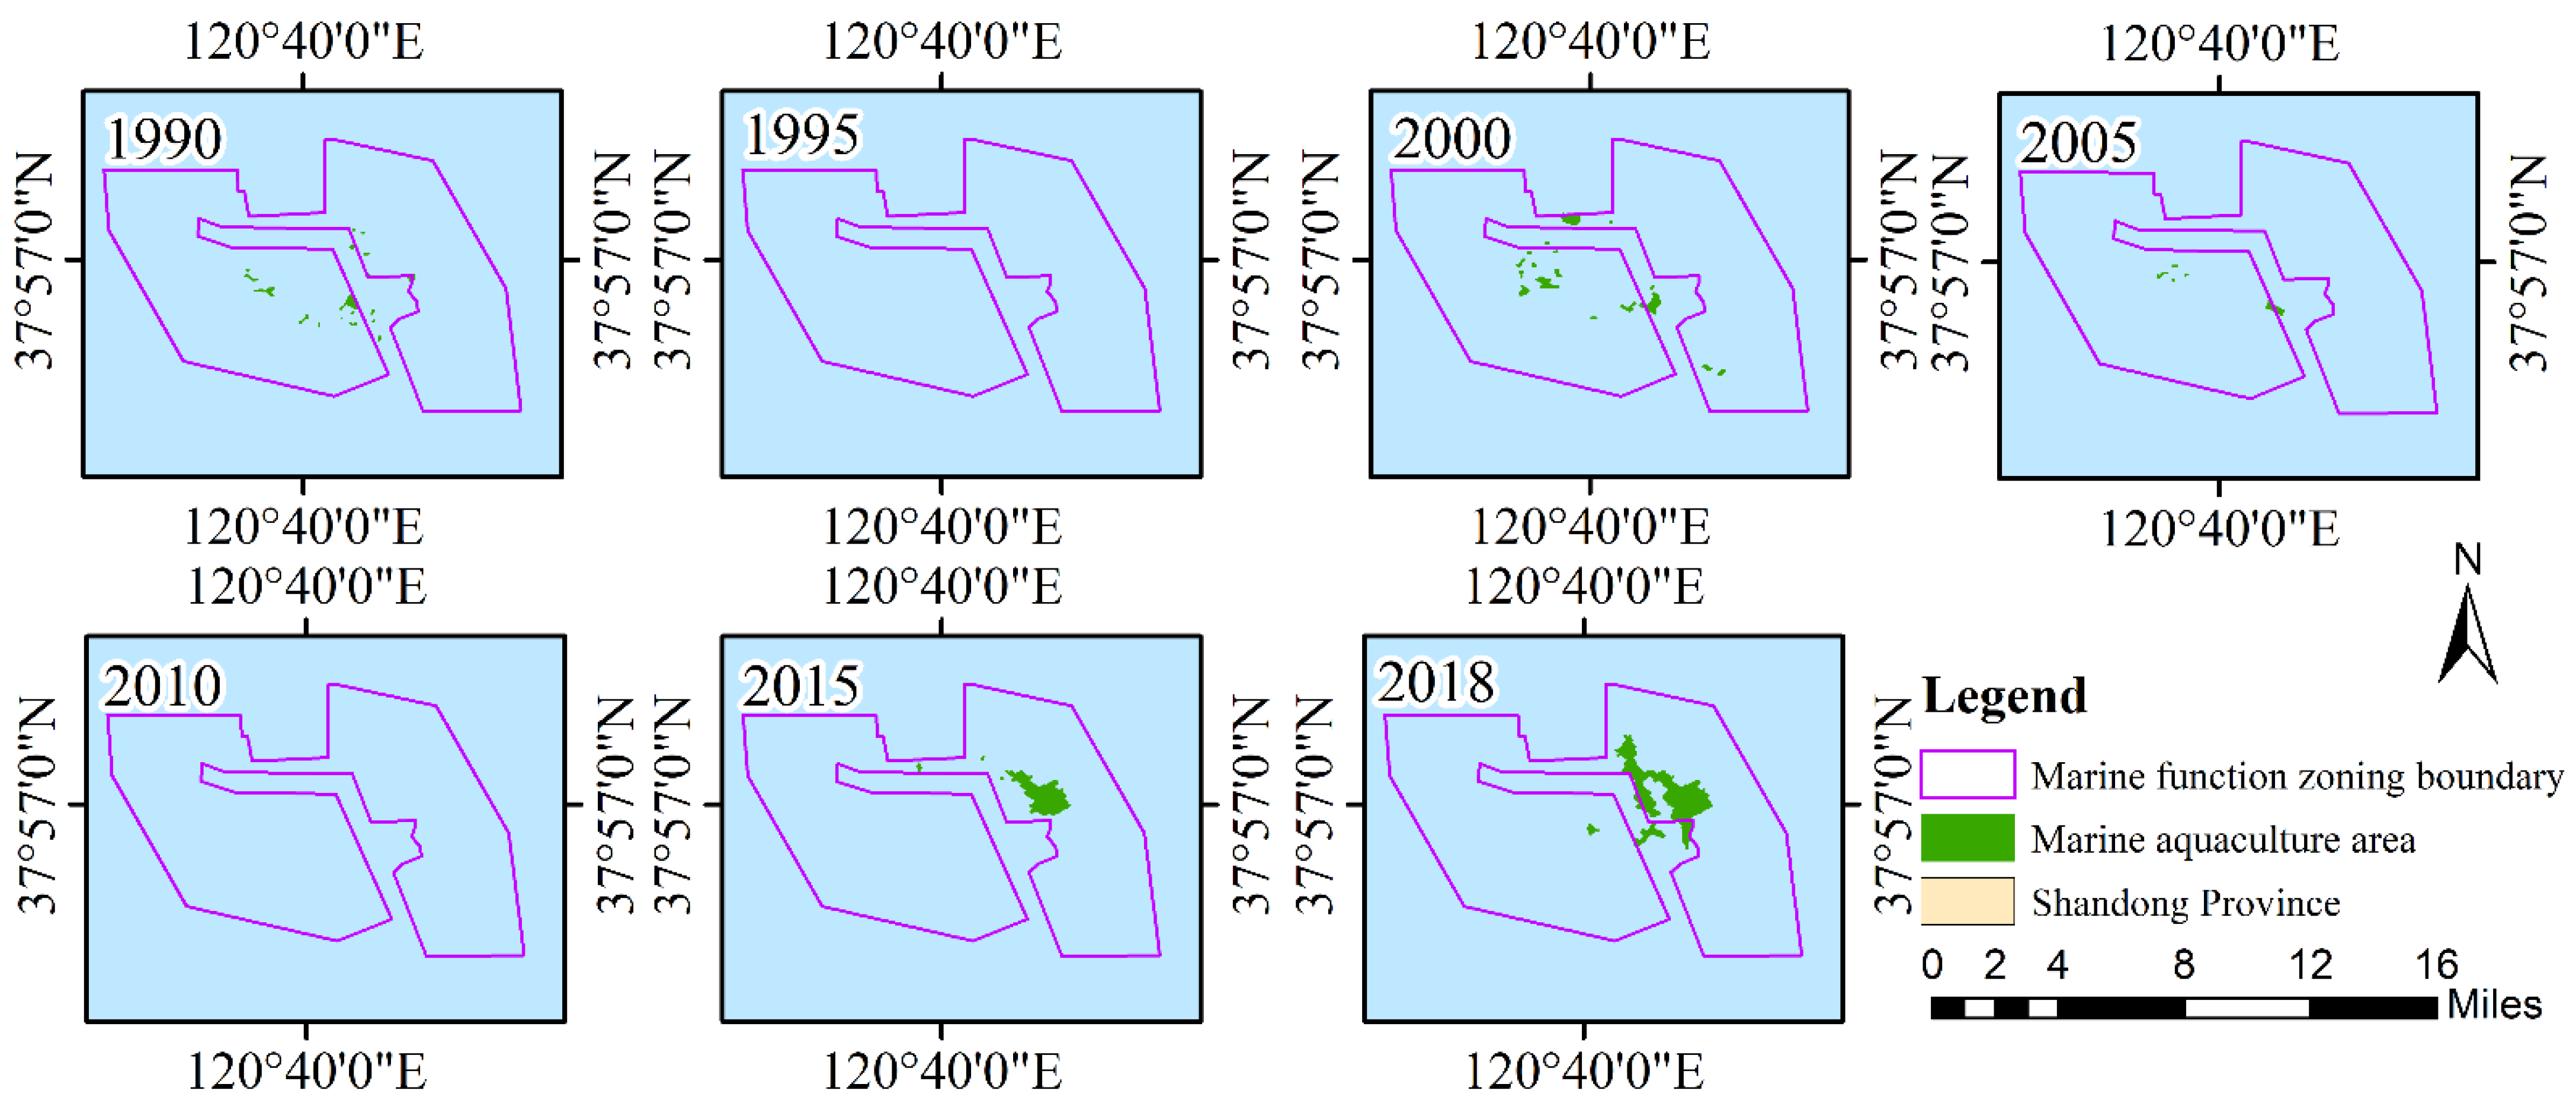
4.3. Superimposed Results of Marine Aquaculture and MFZ Analysis in Typical Regions

4.3.1. Superposition Analysis of Agricultural Fishery Area and Marine Aquaculture Area

The Sanggou Bay-Moye Island Agricultural and Fishery Area is a harbor in the easternmost part of China, and has a water depth of 5–10 m. It is a good bay area for the development of aquaculture areas. The total length of the shoreline in this planning area is 53.61 km, and the total planning area is 301.34 km2. A large area of 30.95 km2 was cultivated in 1990, according to the results of remote sensing extraction. From 1990 to 2000, the area increased by nearly 20 km2 every 5 years. However, from 2000 to 2010, the aquaculture area in this area generally remained at the level of about 69 km2. The latest round of MFZ was introduced in 2012, and by 2015 the aquaculture area had doubled, and increased by about 60 km2. Although the rate of increase rate fell in 2018, it still showed an increasing trend. The total aquaculture area rose to 130.87 km2, and the main growth area was within Sanggou Bay (Figure 10). The aquaculture area in this area (Sanggou Bay-Moye Island Agricultural and Fishery Area) occupied more than 26.76% of the total aquaculture area in Shandong Province.
This analysis showed that the agricultural and fishery functional planning area had become important for marine aquaculture in Shandong Province, and that it was continuing to increase. The positioning and implementation effects of this round of MFZ in agricultural and fishing areas can help to guide the development of marine aquaculture. However, we can clearly see from the data in the Figure 10 that there were still a large number of aquaculture areas surrounding the agricultural and fishing areas that were not within the planning area. This indicated it was difficult to obtain accurate and effective data of functional planning that encompassed the actual management and control requirements.

4.3.2. Superposition Analysis of Waterway Planning Area and Marine Aquaculture Area

The length of the Rongcheng Port Shipping Area coastline is 10.10 km, and the planned area was to be 65.67 km2 (Figure 11). This area was mainly designated for shipping heading to Rongcheng Lijiang Port. In 1992, Lijiang Port was approved as one of the first-class operational areas of Shidao Port (a national first-level port) to open. However, remote sensing monitoring and GIS spatial superposition statistical results indicated that, as early as 1990, the location of the planning area already had 16.74 km2 of aquaculture and showed a step growth. From 1990 to 2000, there was substantial growth in aquaculture area in the region; it reached 35.44 km2 and remained above 30 km2 from 2000 to 2010. In 2015, however, large-scale expansion led to the aquaculture area once again reaching 50.34 km2, accounting for 76.66% of the overall planned area of the shipping area. Although it decreased in 2018, it had still increased by 11.56 km2 compared with 2010.
The superimposed distribution feature of the high-density marine aquaculture area and the port shipping planning area seriously threatened the safety of shipping, and will also affect the future development of the shipping industry. At present, among the warning notices for ships entering and leaving Lijiang Port, is one that notifies the presence of aquaculture nets and some marine aquaculture products outside Lijiang Port, near the waterway and around the anchorage, and these aquaculture facilities are not easy to find. The unpredictable behavior of fishing vessels, such as suddenly moving across the bows of ships, will bring great risks to the normal and safe sailing of ships, and special attention must be paid (https://wenku.baidu.com/view/fea13a9a58f5f61fb73666ac.html, (accessed on 1 December 2018)). The large number of aquaculture activities in the port shipping functional planning area fully demonstrated that there was a significant lag in the current MFZ with respect to guiding the development of marine space. It lacked effective management and control methods, and could not effectively implement its own development goals.

4.3.3. Co-Development of Recreational Areas and Aquaculture

Long Island Leisure Tourism and Recreation Area, extending over 142.04 km2, was built for this functional area. In 1990, there was a small amount of aquaculture in the area, and this remained from 1995 to 2010 (Figure 12). The limited extent, however, meant that it was difficult to detect its presence in remote sensing images in 1995 and 2010. However, in 2015 and 2018, the aquaculture area began to expand significantly, from less than 1 km2 to 2.52 km2, and reached 4.79 km2 in 2018. Remote sensing monitoring revealed that the scale of aquaculture in 2015 and 2018 had also changed from the original decentralized aquaculture to centralized aquaculture.
The concentrated aquaculture that emerged in the leisure and entertainment area near Long Island differed from the initial positioning of the functional area. It also confirmed that the expansion of marine aquaculture areas appeared in different functional planning areas. The survey also found overlaps in the leisure tourism projects being developed in this marine aquaculture area, which became a typical marine composite development area. This fully illustrates the characteristics of the complex multi-functionality of marine land space. The current development orientation, which has a dominant function as the goal, lacks flexibility, and adaptation to the rapidly increasing demand for marine development becomes difficult.

5. Discussion

5.1. Feasibility of Dynamically Monitoring the Volatility of Fisheries Expansion by Remote Sensing

It is feasible to dynamically monitor changes in marine aquaculture with remote sensing data. There are uncertainties in the aquaculture data obtained by remote sensing. Nevertheless, according to our field investigation, and verification of interpretation accuracy, the use of mid-resolution remote sensing has an accuracy of more than 85%, and the error can be controlled. This indicates that remote sensing monitoring results can reflect real aquaculture changes with acceptable accuracy. The growth trend of marine aquaculture monitored by remote sensing in this study was very consistent with the development trend of China’s marine fish farming. According to FAO statistics [14], marine fish farming in China has shown a significant growth trend in recent years, and its total marine fish farming volume was greater than in all other countries. Marine aquaculture has expanded the scope of national land space, and significantly enhanced the status of marine land space in the food supply system. As the living standards of the Chinese people gradually improved, there was significant growth in sea products owing to their high levels of protein.
The fluctuations in marine aquaculture growth monitored by remote sensing had a certain correlation with the implementation of MFZ in Shandong Province. The zoning illustrated the increasing pressure on marine resources and the urgent need to strengthen the environmental protection of marine ecology. Land-based pollution is the main cause of coastal environmental pollution [53]. The pollution of local sea areas has increased, the quality of seawater has declined, and the living environment of some marine life has been destroyed, severely restricting the development and expansion of marine aquaculture. Formulation and implementation of MFZ has allowed the sea used for aquaculture to be been coordinated with other types of sea use. As the scale of marine aquaculture increases and technology improves, there is also a tendency to develop into the deep sea, which further increases the expansion of marine aquaculture. This was also the main reason for the large increase in the marine aquaculture area after a small reduction in 2010. A comparative analysis of dynamic monitoring data and statistical data of marine aquaculture in Shandong Province found that the identification and statistical analysis of marine aquaculture areas based on mid-resolution remote sensing images had a scientific basis, and provided a database for rational development and the protection of marine aquaculture. Furthermore, MFZ had a notable role in promoting the development and utilization of oceans, but the effects of ocean development management and control need further evaluation.
A number of other factors influence the outcome of aquaculture area classification using remote sensing techniques. For example, (1) owing to the phenomenon of “homology and heterogamy” attributable to differing growth conditions throughout the study area, it is difficult to identify and extract aquaculture areas. When aquaculture areas are located in deep-sea areas, greater human intervention is required owing to the inhomogeneity of the spectra. (2) Single-phase remote sensing images will cause omissions in the extraction of the aquaculture area. To compensate for this shortcoming, we will add multiple high-resolution optical and microwave images in the latter stages of the process to further ensure the reliability of the remote sensing extraction results. (3) Remote sensing technology is able to identify only aquaculture areas distributed in the surface seawater (e.g., rafts, cages, and ponds). It is not possible to implement effective monitoring of aquaculture patterns without surface targets (e.g., bottom-sown aquaculture), and further research might be needed using radar and/or other technologies.

5.2. Importance of the Role of MFZ in Marine Aquaculture

Since the new MFZ round in Shandong Province began in 2012, the area of marine aquaculture has developed greatly. It had begun to expand rapidly before 2010, and the trend of extensive development became clear. Its significant expansion often led to conflict with other functions, especially shipping. In addition, coastal land-source discharge brought about by rapid economic development, and the large-scale expansion of aquaculture, have also caused serious pollution offshore, which has greatly restricted the expansion of aquaculture. There were two main reasons for the decline in marine aquaculture area in 2010. Because functional planning takes into consideration the spatial coordination of the sea and the protection of the marine environment when it is formulated, it effectively relieves the contradiction between use of the sea for agricultural fisheries and for other purposes. It releases the development potential of agricultural fisheries. The fact that the proportion of aquaculture growth in the agricultural and fishery area has increased significantly since 2010 strongly supported the positive role of MFZ in aquaculture development.
The lag in the effectiveness of the implementation of MFZ showed that new technologies are needed to carry out the space management and control of marine land. The most direct evidence was that, although the proportion of aquaculture in non-agricultural fishery areas had decreased, the area of aquaculture in these areas was still increasing. Except for agricultural and fishery areas, the area of aquaculture areas included in port and shipping areas, marine protected areas, and tourism and entertainment areas with large aquaculture areas, increased since 2010. In the port and shipping area, especially, the aquaculture area increased from 69.69 km2 to 89.11 km2 from 2010 to 2015. The main reason for this was that the sea area originally suitable for the development of aquaculture and existing aquaculture had been planned into other functional zones. The inertia of the expansion of marine aquaculture meant that such areas still had a large number of aquaculture operations. Active development of deep-sea aquaculture technology that is more resistant to wind and waves may be an effective means to promote the realization of the initial goals of functional planning in aquaculture [54,55]. For example, the depth of the mooring system for cages and longlines increased from the 100 m limit used here to 150 m, and this will increase the appropriate area by 31% [56].

5.3. The Exploration of Marine Land Spatial Planning from the Perspective of Land and Sea Coordination

Overall, land and sea planning and management has become an important topic in the development and protection of the marine environment [57]. In spatial planning, national marine areas and terrestrial land are inseparable [58,59,60]. We used marine aquaculture monitoring to evaluate the layout and implementation of MFZ, and found that the current MFZ considers the marine spatial function and ignores the land spatial function. The functional layout of the marine space was constrained by the layout of the land space [61]. For example, the development of aquaculture often affected by the land-source input of high-density human activity areas along the coast. In addition, the MFZ also profoundly changed the direction of coastal land spatial function planning, and expanded the land grain planting space. In this way, it greatly improved the population-carrying capacity of coastal land space, and reduced the pressure on food supplies from cultivated land and land pond farming. From the perspective of land and sea coordination, marine land spatial planning has become an inseparable part of national land spatial planning, strengthening the strategic position of marine land, and providing policy support for better development and protection of marine land space.
The combination and variability of the spatial functions of marine territories are important in distinguishing the differences between land and sea space management and control technologies. Current ocean function planning emphasizes the single function of ocean space while ignoring the existence of the value of its compound function [62,63]. A classification system of planning areas that neglects the marine composite function makes it difficult to balance the dual goals of economic development and ecological protection in implementing policy. It also creates institutional obstacles in the practical application of marine spatial planning. Our field investigation found clearly diversified characteristics between the experiences of marine aquaculture fishermen, tourism and entertainment areas, and marine protected areas. One example is the marine, multi-functional development model featuring Yujiale. This is a leisure route organized by coastal or island fishermen for city dwellers, and allows them to appreciate the scenery of the island and eat local specialty seafood. Such schemes allow fisheries companies to obtain additional income from scenic spots based on existing aquaculture profits. It can also expand the value-added benefits of marine aquaculture and promote public supervision of the environmental protection activities of aquaculture companies, which is beneficial to the development and protection of the marine space.
Therefore, the spatial planning of marine land based on the overall planning of land and sea, while strengthening the rigid controls and constraints over space, cannot ignore the core feature: the diversity and variability of marine spatial functions. While strengthening overall management of marine land and sea space, it is necessary to allow areas for flexible development and joint use to further strengthen the particularity of marine spaces. To promote land–sea coordination, the coastal zone can be considered for spatial planning. Orderly coastal zone development and protection is of great significance in connecting land and ocean. To carry out marine spatial planning, macro-function orientation and effective local control mechanisms should be promoted, to enhance the integration of economic benefits and ecological effects.

5.4. Application of Spatial Information Technology in Marine Spatial Planning

Obtaining the spatial and temporal distribution of marine aquaculture data based on remote sensing data allowed us to dynamically monitor the use of marine space. The use of remote sensing and other technologies to achieve scientific and real-time assessment has become more reliable than use of traditional ground survey data. Even more commendable are some remote sensing data sources, such as the Landsat used in this study, which has rich historical archive data and is freely available. This made it possible for us to trace the spatial distribution data of historical aquaculture and to study the laws and effects of the dynamic changes in its total volume and spatial distribution. The spatial analysis function provided by GIS is very important in revealing the constraints of functional planning on aquaculture [64]. At present, the national land spatial planning information database and the one-picture technical solution are based on the organization of spatial data.
High-score remote sensing and comprehensive emergency response data acquisition and other technologies guarantee the implementation and monitoring of marine spatial planning. Rapidly developing high-resolution remote sensing satellites can provide remote sensing images with a resolution of about 1 m. In cloudy and rainy conditions, ordinary optical remote sensing images are difficult to obtain, and active SAR images that can penetrate clouds and fog can achieve all-weather impact acquisition [65,66,67]. Newly developed drones can obtain decimeter- or even centimeter-level accuracy at low cost and can maneuver quickly, free from the limitations of periodic acquisition from satellite orbits. Together with the current GIS and wireless network technologies, aquaculture emergency disaster assessment, real-time monitoring, and law enforcement can also be realized. Remote sensing can also be used to monitor changes in the aquaculture environment, such as nearshore land spatial patterns and sea water quality [68], which can provide accurate information for the development, monitoring, and evaluation of marine aquaculture activities, and even for overall land–sea planning information support.
Of course, there are certain limitations in the application of spatial information technology to marine spatial planning. For example, taking our study as an example, there are still significant deficiencies in terms of access to aquaculture types and yields. This is mainly because remote sensing often obtains surface information and, in reality, there are some bottom-bottom and deep-water, three-dimensional aquaculture activities. This also highlights the existence of a gap between ocean information remote sensing technology and the requirements of its actual application. There are still many technologies that could improve remote sensing and other spatial information services.

6. Conclusions

Using remote sensing and spatial information, we took the example of Shandong Province and dynamically monitored and discussed its aquaculture development from 1990 to 2018. In combination with the local MFZ, we evaluated the effect of implementing functional planning from the perspective of aquaculture development. We found that marine aquaculture in Shandong Province showed a volatile growth trend. This volatility was closely related to the formulation and implementation of MFZ, but there was a lag in implementation. In addition, the current MFZ overemphasizes single-function planning, while ignoring the planning of multiple functions. At the same time, it does not consider the overall coordination of land-based functional planning and MFZ in an adjacent coastal zone. In the future, space information technology can be fully integrated, and planning, monitoring, and evaluation can be carried out to combine the planning of main functions under constraints of space and overall land–sea planning.

Author Contributions

Conceptualization, J.W. and Z.W.; methodology, J.W.; software, J.W.; validation, J.W., X.Y. and Z.W.; formal analysis, J.W.; investigation, X.Y. and Z.W.; resources, J.W.; data curation, J.W.; writing—original draft preparation, J.W.; writing—review and editing, D.G. and Z.W.; visualization, J.W. and J.K.; supervision, X.Y. and D.G.; project administration, X.Y. and Z.W.; funding acquisition, X.Y. All authors have read and agreed to the published version of the manuscript.

Funding

This research was funded by the National Key R&D Program of China (Grant No. 2021YFB3900501) and the National Natural Science Foundation of China (Grant No. 41890854 and Grant No. 41901354).

Data Availability Statement

The data that support the findings of this study are openly available in zenodo at https://0-doi-org.brum.beds.ac.uk/10.5281/zenodo.5758480, accessed on 9 December 2021.

Conflicts of Interest

The authors declare no conflict of interest. The authors also declare this paper has not been published previously, that it is not under consideration for publication elsewhere, that its publication is approved by all authors, and tacitly or explicitly approved by the responsible authorities where the work was carried out.

References

  1. Smith, M.D.; Roheim, C.A.; Crowder, L.B.; Halpern, B.S.; Turnipseed, M.; Anderson, J.L.; Asche, F.; Bourillon, L.; Guttormsen, A.G.; Khan, A.; et al. Sustainability and global seafood. Science 2010, 327, 784–786. [Google Scholar] [CrossRef]
  2. Jay, S. Built at sea: Marine management and the construction of marine spatial planning. Town Plan. Rev. 2010, 81, 173–192. [Google Scholar] [CrossRef]
  3. Kidd, S.; Shaw, D. Reconceptualising territoriality and spatial planning: Insights from the sea. Plan. Theory Pract. 2013, 14, 180–197. [Google Scholar] [CrossRef]
  4. Lawrence, D.; Vandecar, K.L. Effects of tropical deforestation on climate and agriculture. Nat. Clim. Chang. 2015, 5, 27–36. [Google Scholar] [CrossRef]
  5. Foley, J.A.; Defries, R.S.; Asner, G.P.; Barford, C.C.; Bonan, G.B.; Carpenter, S.R.; Chapin, F.S.; Coe, M.T.; Daily, G.C.; Gibbs, H.K. Global consequences of land use. Science 2005, 309, 570–574. [Google Scholar] [CrossRef] [Green Version]
  6. Riitters, K.H.; Wickham, J.D.; Oneill, R.V.; Jones, K.B.; Smith, E.R. Global-scale patterns of forest fragmentation. Conserv. Ecol. 2000, 4, 3. [Google Scholar] [CrossRef]
  7. Curtis, P.G.; Slay, C.M.; Harris, N.L.; Tyukavina, A.; Hansen, M.C. Classifying drivers of global forest loss. Science 2018, 361, 1108–1111. [Google Scholar] [CrossRef]
  8. Turner, B.; Lambin, E.F.; Reenberg, A. The emergence of land change science for global environmental change and sustainability. Proc. Natl. Acad. Sci. USA 2007, 104, 20666–20671. [Google Scholar] [CrossRef] [Green Version]
  9. Quere, C.L.; Andrew, R.M.; Canadell, J.G.; Sitch, S.; Korsbakken, J.I.; Peters, G.P.; Manning, A.C.; Boden, T.A.; Tans, P.P.; Houghton, R.A. Global carbon budget 2016. Earth Syst. Sci. Data 2016, 8, 605–649. [Google Scholar] [CrossRef] [Green Version]
  10. Alkama, R.; Cescatti, A. Biophysical climate impacts of recent changes in global forest cover. Science 2016, 351, 600–604. [Google Scholar] [CrossRef] [Green Version]
  11. Gentry, R.R.; Froehlich, H.E.; Grimm, D.; Kareiva, P.; Parke, M.; Rust, M.; Gaines, S.D.; Halpern, B.S. Mapping the global potential for marine aquaculture. Nat. Ecol. Evol. 2017, 1, 1317–1324. [Google Scholar] [CrossRef]
  12. Duarte, C.M.; Marbá, N.; Holmer, M. Rapid domestication of marine species. Science 2007, 316, 382–383. [Google Scholar] [CrossRef] [PubMed]
  13. Naylor, R.L.; Goldburg, R.J.; Primavera, J.H.; Kautsky, N.; Beveridge, M.C.M.; Clay, J.; Folke, C.; Lubchenco, J.; Mooney, H.; Troell, M. Effect of aquaculture on world fish supplies. Nature 2000, 405, 1017–1024. [Google Scholar] [CrossRef] [Green Version]
  14. FAO. The State of World Fisheries and Aquaculture; FAO: Rome, Italy, 2016. [Google Scholar]
  15. Department, F.F. The state of world fisheries and aquaculture 2018. State World Fish. Aquac. 2018, 4, 40–41. [Google Scholar]
  16. Halpern, B.S.; Walbridge, S.; Selkoe, K.A.; Kappel, C.V.; Micheli, F.; Dagrosa, C.; Bruno, J.F.; Casey, K.S.; Ebert, C.; Fox, H.E. A global map of human impact on marine ecosystems. Science 2008, 319, 948–952. [Google Scholar] [CrossRef] [PubMed] [Green Version]
  17. Pauly, D.; Zeller, D. Comments on FAOs state of world fisheries and aquaculture (SOFIA 2016). Mar. Pol. 2017, 77, 176–181. [Google Scholar] [CrossRef]
  18. Gilliland, P.M.; Laffoley, D. Key elements and steps in the process of developing ecosystem-based marine spatial planning. Mar. Pol. 2008, 32, 787–796. [Google Scholar] [CrossRef]
  19. Ottinger, M.; Clauss, K.; Kuenzer, C. Opportunities and challenges for the estimation of aquaculture production based on Earth observation data. Remote Sens. 2018, 10, 1076. [Google Scholar] [CrossRef] [Green Version]
  20. Mialhe, F.; Gunnell, Y.; Mering, C.; Gaillard, J.C.; Coloma, J.G.; Dabbadie, L. The development of aquaculture on the northern coast of Manila Bay (Philippines): An analysis of long-term land-use changes and their causes. J. Land Use Sci. 2016, 11, 236–256. [Google Scholar] [CrossRef]
  21. Ottinger, M.; Clauss, K.; Kuenzer, C. Large-scale assessment of coastal aquaculture ponds with sentinel-1 time series data. Remote Sens. 2017, 9, 440. [Google Scholar] [CrossRef] [Green Version]
  22. Ren, C.Y.; Wang, Z.M.; Zhang, Y.Z.; Zhang, B.; Chen, L.; Xi, Y.B.; Xiao, X.M.; Doughty, R.B.; Liu, M.Y.; Jia, M.M.; et al. Rapid expansion of coastal aquaculture ponds in China from Landsat observations during 1984–2016. Int. J. Appl. Earth Obs. Geoinf. 2019, 82, 12. [Google Scholar] [CrossRef]
  23. Pattanaik, C.; Prasad, S.N. Assessment of aquaculture impact on mangroves of Mahanadi delta (Orissa), East coast of India using remote sensing and GIS. Ocean Coast. Manag. 2011, 54, 789–795. [Google Scholar] [CrossRef]
  24. Ottinger, M.; Clauss, K.; Kuenzer, C. Aquaculture: Relevance, distribution, impacts and spatial assessments—A review. Ocean Coast. Manag. 2016, 119, 244–266. [Google Scholar] [CrossRef]
  25. Gao, L.; Li, Y.; Zhong, S.; Luo, D. Remote sensing detected mariculture changes in Dongshan Bay. J. Mar. Sci. 2014, 32, 35–42. [Google Scholar]
  26. Xing, Q.; Tosi, L.; Braga, F.; Gao, X.; Gao, M. Interpreting the progressive eutrophication behind the world’s largest macroalgal blooms with water quality and ocean color data. Nat. Hazards 2015, 78, 7–21. [Google Scholar] [CrossRef] [Green Version]
  27. Prasad, K.A.; Ottinger, M.; Wei, C.; Leinenkugel, P. Assessment of coastal aquaculture for India from sentinel-1 SAR time series. Remote Sens. 2019, 11, 357. [Google Scholar] [CrossRef] [Green Version]
  28. Wang, M.; Cui, Q.; Wang, J.; Ming, D.; Lv, G. Raft cultivation area extraction from high resolution remote sensing imagery by fusing multi-scale region-line primitive association features. ISPRS J. Photogramm. Remote Sens. 2017, 123, 104–113. [Google Scholar] [CrossRef]
  29. Fu, Y.; Deng, J.; Ye, Z.; Gan, M.; Wang, K.; Wu, J.; Yang, W.; Xiao, G. Coastal aquaculture mapping from very high spatial resolution imagery by combining object-based neighbor features. Sustainability 2019, 11, 637. [Google Scholar] [CrossRef] [Green Version]
  30. Wang, Z.H.; Yang, X.M.; Liu, Y.M.; Lu, C. Extraction of coastal raft cultivation area with heterogeneous water background by thresholding object-based visually salient NDVI from high spatial resolution imagery. Remote Sens. Lett. 2018, 9, 839–846. [Google Scholar] [CrossRef]
  31. Wang, J.; Sui, L.C.; Yang, X.M.; Wang, Z.H.; Liu, Y.M.; Kang, J.M.; Lu, C.; Yang, F.S.; Liu, B. Extracting coastal raft aquaculture data from landsat 8 OLI imagery. Sensors 2019, 19, 1221. [Google Scholar] [CrossRef] [Green Version]
  32. Liu, Y.; Wang, Z.; Yang, X.; Zhang, Y.; Yang, F.; Liu, B.; Cai, P. Satellite-based monitoring and statistics for raft and cage aquaculture in China’s offshore waters. Int. J. Appl. Earth Obs. Geoinf. 2020, 91, 102118. [Google Scholar] [CrossRef]
  33. Douvere, F. The importance of marine spatial planning in advancing ecosystem-based sea use management. Mar. Pol. 2008, 32, 762–771. [Google Scholar] [CrossRef]
  34. Johnson, A.E.; Mcclintock, W.; Burton, O.; Burton, W.; Estep, A.J.; Mengerink, K.; Porter, R.; Tate, S. Marine spatial planning in Barbuda: A social, ecological, geographic, and legal case study. Mar. Pol. 2020, 113, 103793. [Google Scholar] [CrossRef]
  35. Day, J.C. Zoning—Lessons from the Great Barrier Reef marine park. Ocean Coast. Manag. 2002, 45, 139–156. [Google Scholar] [CrossRef] [Green Version]
  36. Douvere, F.; Maes, F.; Vanhulle, A.; Schrijvers, J. The role of marine spatial planning in sea use management: The Belgian case. Mar. Pol. 2007, 31, 182–191. [Google Scholar] [CrossRef]
  37. Olsen, S.; Mccann, J.; Fugate, G. The state of Rhode Island’s pioneering marine spatial plan. Mar. Pol. 2014, 45, 26–38. [Google Scholar] [CrossRef]
  38. Vince, J. Oceans governance and marine spatial planning in Australia. Aust. J. Marit. Ocean Aff. 2014, 6, 5–17. [Google Scholar] [CrossRef] [Green Version]
  39. Douvere, F.; Ehler, C.N. New perspectives on sea use management: Initial findings from European experience with marine spatial planning. J. Environ. Manag. 2009, 90, 77–88. [Google Scholar] [CrossRef]
  40. Hu, W.; Liu, J.; Ma, Z.; Wang, Y.; Zhang, D.; Yu, W.; Chen, B. China’s marine protected area system: Evolution, challenges, and new prospects. Mar. Pol. 2020, 115, 103780. [Google Scholar] [CrossRef]
  41. Halpern, B.S.; McLeod, K.L.; Rosenberg, A.A.; Crowder, L.B. Managing for cumulative impacts in ecosystem-based management through ocean zoning. Ocean Coast. Manag. 2008, 51, 203–211. [Google Scholar] [CrossRef]
  42. Wu, R. The environmental impact of marine fish culture: Towards a sustainable future. Mar. Pollut. Bull. 1995, 31, 159–166. [Google Scholar] [CrossRef]
  43. Liu, L.; Ge, M.; Zheng, X.; Tao, Z.; Zhou, S.; Wang, G. Investigation of Vibrio alginolyticus, V. harveyi, and V. parahaemolyticus in large yellow croaker, Pseudosciaena crocea (Richardson) reared in Xiangshan Bay, China. Aquacult. Rep. 2016, 3, 220–224. [Google Scholar] [CrossRef] [Green Version]
  44. Liu, D.; Keesing, J.K.; Dong, Z.; Zhen, Y.; Di, B.; Shi, Y.; Fearns, P.; Shi, P. Recurrence of the world’s largest green-tide in 2009 in Yellow Sea, China: Porphyra yezoensis aquaculture rafts confirmed as nursery for macroalgal blooms. Mar. Pollut. Bull. 2010, 60, 1423–1432. [Google Scholar] [CrossRef]
  45. China Fisheries Yearbook; Government, C.F.S: Beijing, China, 2019.
  46. Hu, C.M. A novel ocean color index to detect floating algae in the global oceans. Remote Sens. Environ. 2009, 113, 2118–2129. [Google Scholar] [CrossRef]
  47. Alexandridis, T.K.; Topaloglou, C.A.; Lazaridou, E.; Zalidis, G.C. The performance of satellite images in mapping aquacultures. Ocean Coast. Manag. 2008, 51, 638–644. [Google Scholar] [CrossRef]
  48. Kang, J.M.; Sui, L.C.; Yang, X.M.; Liu, Y.M.; Wang, Z.H.; Wang, J.; Yang, F.S.; Liu, B.; Ma, Y.Z. Sea surface-visible aquaculture spatial-temporal distribution remote sensing: A case study in Liaoning province, China from 2000 to 2018. Sustainability 2019, 11, 7186. [Google Scholar] [CrossRef] [Green Version]
  49. Xue, M.; Chen, Y.; Tian, X.; Yan, M.; Zhang, Z. Detection the expansion of marine aquaculture in Sansha Bay by remote sensing. In Proceedings of the IGARSS 2018-2018 IEEE International Geoscience and Remote Sensing Symposium, Valencia, Spain, 22–27 July 2018; pp. 7866–7869. [Google Scholar]
  50. Soille, P. Morphological image analysis: Principles and applications. Springer. Sens. Rev. 1999, 28, 800–801. [Google Scholar]
  51. Division of Marine Functions in Shandong Province; Government, S.P.P.s: Shandong, China, 2004.
  52. Liancheng, Z.; Jun, C.; Baojun, W.; Xiaojun, G. 1:250000 base map compilation for sea function division of Shandong province using remote sensing and gis technology as a tool. Mar. Geol. 2011, 27, 42–47. [Google Scholar]
  53. Lu, W.; Liu, J.; Xiang, X.; Song, W.; Mcilgorm, A. A comparison of marine spatial planning approaches in China: Marine functional zoning and the marine ecological red line. Mar. Pol. 2015, 62, 94–101. [Google Scholar] [CrossRef]
  54. Watson, R.; Nowara, G.B.; Hartmann, K.; Green, B.S.; Tracey, S.; Carter, C.G. Marine foods sourced from farther as their use of global ocean primary production increases. Nat. Commun. 2015, 6, 7365. [Google Scholar] [CrossRef]
  55. Hooper, T.; Austen, M. The co-location of offshore windfarms and decapod fisheries in the UK: Constraints and opportunities. Mar. Pol. 2014, 43, 295–300. [Google Scholar] [CrossRef]
  56. Kapetsky, J.M.; Aguilar-Manjarrez, J.; Jenness, J. A global assessment of offshore mariculture potential from a spatial perspective. FAO Fish. Aquac. Tech. Pap. 2013, I, 549. [Google Scholar]
  57. Teng, X.; Zhao, Q.; Zhang, P.; Liu, L.; Dong, Y.; Hu, H.; Yue, Q.; Ou, L.; Xu, W. Implementing marine functional zoning in China. Mar. Pol. 2021, 132, 103484. [Google Scholar] [CrossRef]
  58. Tallis, H.; Ferdana, Z.; Gray, E. Linking terrestrial and marine conservation planning and threats analysis. Conserv. Biol. 2008, 22, 120–130. [Google Scholar] [CrossRef]
  59. Stoms, D.M.; Davis, F.W.; Andelman, S.J.; Carr, M.H.; Gaines, S.D.; Halpern, B.S.; Hoenicke, R.; Leibowitz, S.G.; Leydecker, A.; Madin, E.M. Integrated coastal reserve planning: Making the land-sea connection. Front. Ecol. Environ. 2005, 3, 429–436. [Google Scholar]
  60. Jorge, G.; Pressey, R.L.; Ban, N.C.; Vanceborland, K.; Willer, C.; Klein, C.J.; Gaines, S.D. Integrated land-sea conservation planning: The missing links. Annu. Rev. Ecol. Evol. Syst. 2011, 42, 381–409. [Google Scholar]
  61. Kidd, S.; Ellis, G. From the land to sea and back again? Using terrestrial planning to understand the process of marine spatial planning. J. Environ. Policy Plan. 2012, 14, 49–66. [Google Scholar] [CrossRef]
  62. Rees, S.E.; Rodwell, L.D.; Attrill, M.J.; Austen, M.C.; Mangi, S.C. The value of marine biodiversity to the leisure and recreation industry and its application to marine spatial planning. Mar. Pol. 2010, 34, 868–875. [Google Scholar] [CrossRef]
  63. Van Riper, C.J.; Kyle, G.T.; Sherrouse, B.C.; Bagstad, K.J.; Sutton, S.G. Toward an integrated understanding of perceived biodiversity values and environmental conditions in a national park. Ecol. Indic. 2017, 72, 278–287. [Google Scholar] [CrossRef]
  64. Mulik, S.N. An introduction to geographical information systems. Iete Tech. Rev. 1999, 16, 419–424. [Google Scholar] [CrossRef]
  65. Anzidei, M.; Scicchitano, G.; Scardino, G.; Bignami, C.; Tolomei, C.; Vecchio, A.; Serpelloni, E.; De Santis, V.; Monaco, C.; Milella, M. Relative sea-level rise scenario for 2100 along the coast of South Eastern Sicily (Italy) by InSAR data, satellite images and high-resolution topography. Remote Sens. 2021, 13, 1108. [Google Scholar] [CrossRef]
  66. Reese, H.; Nyström, M.; Nordkvist, K.; Olsson, H. Combining airborne laser scanning data and optical satellite data for classification of alpine vegetation. Int. J. Appl. Earth Obs. Geoinf. 2014, 27, 81–90. [Google Scholar] [CrossRef]
  67. Ørka, H.O.; Wulder, M.A.; Gobakken, T.; Næsset, E. Subalpine zone delineation using LiDAR and Landsat imagery. Remote Sens. Environ. 2012, 119, 11–20. [Google Scholar] [CrossRef]
  68. Antonioli, F.; De Falco, G.; Lo Presti, V.; Moretti, L.; Scardino, G.; Anzidei, M.; Bonaldo, D.; Carniel, S.; Leoni, G.; Furlani, S. Relative sea-level rise and potential submersion risk for 2100 on 16 coastal plains of the Mediterranean sea. Water 2020, 12, 2173. [Google Scholar] [CrossRef]
Figure 1. Marine aquaculture area in Shandong Province, China. (A) Raft aquaculture areas; (B) Cage aquaculture areas. (Data source: https://glovis.usgs.gov/, (accessed on 1 August 2018)).
Remotesensing 14 00732 g001
Figure 2. Zoomed Landsat satellite images showing detail of marine aquaculture areas from 1990–2018 (data source: https://glovis.usgs.gov/, (accessed on 1 August 2018)).
Remotesensing 14 00732 g002
Figure 3. MFZ map of Shandong Province showing the geographic location of the areas shown in Figures 10–12.
Remotesensing 14 00732 g003
Figure 4. Flowchart of the procedures adopted in this study.
Remotesensing 14 00732 g004
Figure 5. Steps in the process of extraction of marine aquaculture areas.
Remotesensing 14 00732 g005
Figure 6. Detailed map of aquaculture areas, including channel areas.
Remotesensing 14 00732 g006
Figure 7. Landsat 8-OLI imagery and field research data, where rectangle (A) is the marine aquaculture area of Sanggou Bay and rectangle (B) is the marine aquaculture area of Wulei Island Bay. Enlarged detail maps of the extraction results and site inspection photos: (a) Sanggou Bay marine aquaculture area and (b) Wulei Island Bay marine aquaculture area.
Remotesensing 14 00732 g007
Figure 8. Marine aquaculture area and its dynamic changes in Shandong Province during 1990–2018: (a) aquaculture area changes and (b) dynamic degree changes.
Remotesensing 14 00732 g008
Figure 9. Overlay of MFZ (marine function zoning) and marine aquaculture.
Remotesensing 14 00732 g009
Figure 10. Changes in area A (Sanggou Bay-Moye Island Agricultural and Fishery Area) between aquaculture areas and non-aquaculture MFZ during 1990–2018.
Remotesensing 14 00732 g010
Figure 11. Changes in area B (Rongcheng Port Shipping Area) between aquaculture areas and non-aquaculture MFZ during 1990–2018.
Remotesensing 14 00732 g011
Figure 12. Changes in area C (Long Island Leisure Tourism and Recreation Area) between aquaculture areas and non-aquaculture MFZ during 1990–2018.
Remotesensing 14 00732 g012
Table 1. Basic information on Landsat satellite remote sensing data.
SensorAcquisition TimeImage Path/RowSensorAcquisition TimeImage Path/RowSensorAcquisition TimeAcquisition Time
OLI-TIRS2018/4/2811,934TM2010/4/1312,036ETM+2000/3/812,033
OLI-TIRS2018/4/2811,935TM2010/4/1312,034TM1995/5/1511,934
OLI-TIRS2018/4/1912,034TM2010/2/111,935TM1995/3/1912,035
OLI-TIRS2018/4/1912,035TM2010/4/2912,033TM1995/3/2612,134
OLI-TIRS2018/4/1912,036TM2005/3/2311,934TM1995/3/1912,036
OLI-TIRS2018/3/2512,134TM2005/2/2612,035TM1995/3/1912,034
OLI-TIRS2018/5/112,033TM2005/4/2212,134TM1995/5/1511,935
OLI-TIRS2015/3/1911,934TM2005/2/2612,036TM1995/4/2012,033
OLI-TIRS2015/3/1012,035TM2005/4/1512,034TM1990/2/2611,934
OLI-TIRS2015/3/112,134TM2005/3/2311,935TM1990/3/512,035
OLI-TIRS2015/3/1012,036TM2005/4/1512,033TM1990/3/1212,134
OLI-TIRS2015/3/2612,034ETM+2000/2/1411,934TM1990/3/512,036
OLI-TIRS2015/4/2011,935ETM+2000/3/812,035TM1990/3/512,034
OLI-TIRS2015/3/2612,033ETM+2000/2/2812,134TM1990/4/1511,935
TM2010/2/111,934ETM+2000/3/812,036TM1990/5/2412,033
TM2010/4/1312,035ETM+2000/3/812,034
TM2010/5/612,134ETM+2000/3/111,935
Note: ETM+, Enhanced Thematic Mapper Plus; OLI-TIRS, Operational Land Imager and Thermal InfraRed Sensor; TM, Thematic Mapper. ETM+ and OLI-TIRS have band resolution of 30 m in the multispectral and 15 m in the panchromatic band; the TM has band resolution of 30 m in the multispectral band.
Table 2. Aquaculture zone grade division.
GradeSmallMiddleLargeSuper-Large
Area, S/km2S < 0.10.1 ≤ S < 11 ≤ S < 10S ≥ 10
Table 3. Confusion matrix for accuracy evaluation.
Year1990199520002005201020152018
YNYYNYYNYYNYYNYYNYYNY
Y6510729114710820113271531416021
NY1221317211321471915391511711611108
F-measure (%)85.5384.7185.3984.7086.2690.7990.91
Note: Y, aquaculture area; NY, non-aquaculture area.
Table 4. Statistics of marine aquaculture areas of different sizes.
GradeSmallMiddleLargeSuper-Large
Area/km2S < 0.10.1 ≤ S < 11 ≤ S < 10S ≥ 10
YearNBARPTNBARPENBARPTNBARPT
1990490.870.65217.405.57822.9317.254101.7576.53
1995931.410.60299.824.171254.1723.004170.1472.23
2000641.700.54248.492.701032.2110.256271.9786.51
2005430.530.14206.981.841337.629.918334.4688.11
2010521.070.31217.602.18625.697.377314.0990.14
2015621.520.314515.823.211535.247.1511440.6189.34
2018861.100.224517.553.591561.7112.628408.7883.57
Note: NB, number of patches; AR, aquaculture area; PT, percentage of the total area of patches in the current grade to the total aquaculture area; unit is %.
Table 5. Statistics of total area devoted to various types of aquacultures.
Year1 2 3 4 5 6 7 8
ARPTARPTARPTARPTARPTARPTARPTARPT
199083.7262.9832.7324.620.850.64000.680.5114.8211.15000.130.10
1995165.0070.0535.1414.926.932.94002.571.0924.8910.57001.000.42
2000200.9963.9359.9919.088.822.81003.030.9636.2911.54005.261.67
2005238.5862.8580.4821.2015.274.02002.980.7933.728.88008.562.26
2010228.3365.5361.6917.708.952.57002.020.5840.6111.65006.851.97
2015336.3768.2189.1118.075.691.15008.361.7050.3810.22003.250.66
2018344.7670.4869.4114.196.311.29007.751.5852.1310.664.951.013.830.78
Note: 1, agricultural and fishery areas; 2, port and shipping areas; 3, industrial and urban areas; 4, mineral and energy areas; 5, tourism and entertainment areas; 6, marine protection areas; 7, special use areas; 8, reserved areas. AR, aquaculture area; unit is square kilometers. PT, percentage of the total aquaculture area; unit is %.
Publisher’s Note: MDPI stays neutral with regard to jurisdictional claims in published maps and institutional affiliations.

