Article

Attributions of Evapotranspiration and Gross Primary Production Changes in Semi-Arid Region: A Case Study in the Water Source Area of the Xiong’an New Area in North China

1
Chongqing Institute of Green and Intelligent Technology, Chinese Academy of Sciences, Chongqing 400714, China
2
Chongqing School, University of Chinese Academy of Sciences, Chongqing 400714, China
3
College of Resources and Environmental Science, South-Central Minzu University, Wuhan 430074, China
4
State Key Laboratory of Water Resources and Hydropower Engineering Science, Wuhan University, Wuhan 430072, China
*
Author to whom correspondence should be addressed.
Submission received: 21 January 2022 / Revised: 23 February 2022 / Accepted: 25 February 2022 / Published: 28 February 2022

Abstract

:
Investigating the attributions of evapotranspiration (ET) and gross primary production (GPP) changes is of great importance for regional, sustainable water resources and ecological management in semi-arid regions. Based on the simulation conducted during 2000–2019 by improving water-carbon coupling Distributed Time Variant Gain Model, the trends of ET and GPP were estimated and the driving factors were identified via 10 experimental scenarios in the water source area of the Xiong’an New Area in North China. The results show significant increases both in ET and GPP by 2.4 mm/a and 6.0 gC/m2/a in the region, respectively. At the annual scale, increasing precipitation dominates the ET uptrend. Air temperature, humidity and the interactive effects also contribute to the ET uptrend, and the contributions are 12.8%, 2.0% and 2.3%, respectively, while elevated atmospheric CO2 concentration (eCO2) and solar dimming lead to ET changes of about −7.2% and −12.4%, respectively. For the GPP changes, the increase in GPP is mainly caused by eCO2, increasing precipitation and rising temperature with the contributions of 56.7%, 34.8% and 27.8%, respectively. Solar dimming, humidity and windspeed contribute −6.8%, −4.8% and −3.5% of the GPP changes. Compared to climate change, land use and cover change has smaller effects on both ET and GPP for the few changes in land coverage. At the seasonal scale, ET and GPP increase to a greater extent during the growing season in spring and summer than in autumn and winter. Precipitation, temperature and eCO2 are generally the main causes for ET and GPP changes. Meanwhile, the decreasing humidity and rising temperature are dominant factors for ET and GPP increases, respectively, in winter. Furthermore, solar dimming has strong effects on ET reduction in autumn. The contribution of the interactive effects is much higher on a seasonal scale than annual scale, contributing to considerable decreases in ET and GPP in spring, increases in ET in autumn and winter, and an increase in GPP in winter. This study highlights the importance of considering water-carbon coupling on the attributions of ET and GPP changes and the differentiation of the effects by the abovementioned influential factors at annual and seasonal scales.

Graphical Abstract

1. Introduction

Terrestrial evapotranspiration (ET) and gross primary production (GPP) are the key variables in global water and carbon cycles, respectively [1]. ET has a strong effect on catchment runoff, soil water content and atmospheric moisture feedback [2,3,4]. GPP, the total amount of carbon dioxide fixed by vegetation through photosynthesis, is of great importance to regulate the terrestrial carbon sink in terrestrial ecosystems [5]. In semi-arid regions, ET is the major flux occurring in the water cycle and accounting for most of the precipitation; furthermore, GPP also plays an important role in the inter-annual variability of the global carbon sink [6]. Researches show that increased ET and GPP lead to decreased runoff, subsequently resulting in water shortages and drought aggravation in semi-arid region [7]. Droughts are very common in these regions [8]. Besides, ET and GPP have a strong coupling relationship with each other through the stomatal pathway controlling transpiration and photosynthesis [9], which makes the water and carbon changes more complex, posing challenges to drought control. Therefore, it is important to investigate the ET and GPP changes and their attributions in these regions for catchment water resources management.
Recently, researchers have shown that ET has increased globally by 10% between 2003 and 2019 and precipitation is increasingly classified as ET [10]. Meanwhile, GPP has also demonstrated an increment globally during the past years [11]. The estimated results also show that changes in ET and GPP vary between different regions in the semi-arid region [12,13]. These spatial heterogeneous patterns have been widely attributed to different climate variables [14], CO2 fertilization [15], land use and cover change (LUCC) [1]. The studies also show that the dominant factors on ET and GPP changes are always different from continental to regional scales at different timescales, considering one or two of the factors including different climate variables, elevated CO2 and land-use change [16,17,18,19]. In semi-arid ecosystems, water availability is the main limit for ecosystem productivity and water–carbon is strongly coupled in this region. Understanding the changing characteristics and the driving factors are of great importance for these regions. Besides, it is still unclear which climate variable or land-use change has positive effects or negative effects on ET and GPP changes due to previously inconsistent conclusions in different regions. Meanwhile, as we know, the causality between the factors and water–carbon fluxes at the relatively coarse spatiotemporal resolution may not reflect the substantial mechanisms in the sub-grid, which may be unable to provide sufficient support for the catchment water-resources management. Therefore, further investigation into the reasons behind ET and GPP changes in catchment scales at annual and high time resolution is still needed, considering multiple influence factors in semi-arid regions.
Nowadays, two kinds of models are commonly used to estimate ET and GPP and their attributions, i.e., the elastic-coefficient statistical-based model [20] and physical process-based model [21,22]. The elastic-coefficient statistical based model is usually based on regression analysis [23] or Budyko hypothesis [24]. The physical process-based model combined with remote sensing data is the most popular method and presents the advantages of providing a useful framework to incorporate specific responses to altered environmental conditions [25]. So far, because vegetation growth is not well considered in most traditional hydrological models, these models still have poor ET simulation [26]. In contrast, ecological models perform quite well in GPP simulation but always lack detailed hydrological processes. Subsequently, the attributions analysis in GPP and ET are mostly conducted without considering the water–carbon interactions. Ecohydrological models considering the water–carbon cycles alongside the rainfall-runoff relationship could well consider the interactions between vegetation dynamics and hydrological processes, which can be better used to quantify the effects of climate variables, CO2 enrichment and human activities on the changes in ET and GPP. Recently, several studies have focused on attribution analyses for both ET and GPP using ecohydrological models [27,28,29].
The Xiong’an New Area is located in the semi-arid region in North China, which is a typical over-utilized water resources region [30]. Investigating the hydrological and ecological changes and their driving factors is of significance for sustainable water-resources management in this region. So far, several studies have shown dramatic hydrological changes and quantified the effects of the two factors, i.e., climate variability and human activities, focusing on the streamflow reduction into the downstream [31,32]. Some studies analyze the effects of climate change and vegetation change on ET and concluded that it is mainly caused by climate change [33]. However, to our knowledge, there are still only a few studies conducted on the attributions of both ET and GPP changes considering multiple factors in this region.
In this study, the improved coupling water–carbon DTVGM ecohydrological model was used to simulate the ET and GPP in the six catchments of the water source area of the Xiong’an New Area and then the contributions of multiple influence factors including climate variables, eCO2 and underlying land cover change and their interactive effects on ET and GPP were quantified at annual and monthly timescales based on ten experimental scenarios. The specific objectives of this paper include: (1) evaluating the model applicability in the study region; (2) estimating the changes of ET and GPP in the catchments; and (3) investigating the dominant factors for the ET and GPP changes both at annual and monthly timescales.

2. Methods

2.1. Study Area

The water-source region of the Xiong’an New Area is located between 38°3′~40°4′ N and 113°39′~116°12′ E in the semi-arid region in North China, and covers an area of 3.12 × 10⁴ km2 with the mountainous areas in the northwest and plain area in the southeast (Figure 1). Because the mountainous areas contribute to more than 75% of the water-yield generation for the Xiong’an New Area, the major six catchments of the water-source region were selected as the study area, including the Baigouhe Catchment (BGC), Jumahe Catchment (JMC), Baishahe Catchment (BSC), Tanghe Catchment (THC), Dashahe Catchment (DSC) and Cihe Catchment (CHC), ordered from the northeast to southwest. Details of the six catchments are shown in Table 1. The region has a semi-arid continental monsoon climate, with a mean annual temperature of 8.4 °C and it increases gradually from southwest to northeast across the mountains. The annual precipitation is about 576 mm and is mainly concentrated in the summer season. The major land-cover types in the region are forest (42.8%), grassland (39.9%), cropland (12.0%) and the rest of the land types, including water area and urban land, are relatively small, only accounting for about 5.3%. The dominant land-use type in the northeastern part is forest (83%) in the BGC and the area of forest decreases gradually to 22% in the THC and then increases again to 47% in the southwestern part (CHC), while the grassland and cropland increases firstly and then decreases from northeast to southwest. The forest is a mix of temperate coniferous and broad-leaved, mainly composing of oak, hornbeam, Chinese pie, larch and poplar. The grassland consists of white grass, yellow back grass and artemisia, etc. The crops include grains, beans, tubers and oil crops, etc.

2.2. Dataset

In order to establish the ecohydrological DTVGM model, several datasets including the topographic and underlying surface data, climate forcing data and remotely-sensed based datasets were used. The topographic and underlying surface data were collected, including the SRTM 90 m Digital Elevation Database, the homogenized soil data at 1000 m resolution from FAO and land-use coverage data at 1000 m resolution from Resource and Environment Science and Data Center. The meteorological data includes the daily atmospheric pressure, precipitation, maximum and minimum temperature, windspeed, relative humidity and sunshine duration in seven meteorological stations obtained from the China Meteorological Data Sharing Service System and daily precipitation data in 28 rainfall gauges during 2000–2019. The daily precipitation data were interpolated to the catchments using both the rainfall and weather stations, while other climate variables were interpolated using the weather stations, both via the Inverse Distance Weighting method (The evaluation of this method is available in the supplementary file). The XCO2 products at Level 3 were used to obtain the carbon dioxide in the study region (https://cds.climate.copernicus.eu/, accessed on 8 October 2021). The remotely-sensed based ET and GPP data were used to calibrate and validate the DTVGM model from MOD16A and MOD17A (500 m resolution) at monthly and yearly timestep (https://lpdaac.usgs.gov/products/, accessed on 13 October 2021). Moreover, the annual ET data obtained from Global Land Evaporation Amsterdam Model (GLEAM v3) on a 0.25° × 0.25° grid are also used for annual ET evaluation (https://www.gleam.eu/, accessed on 15 November 2021).

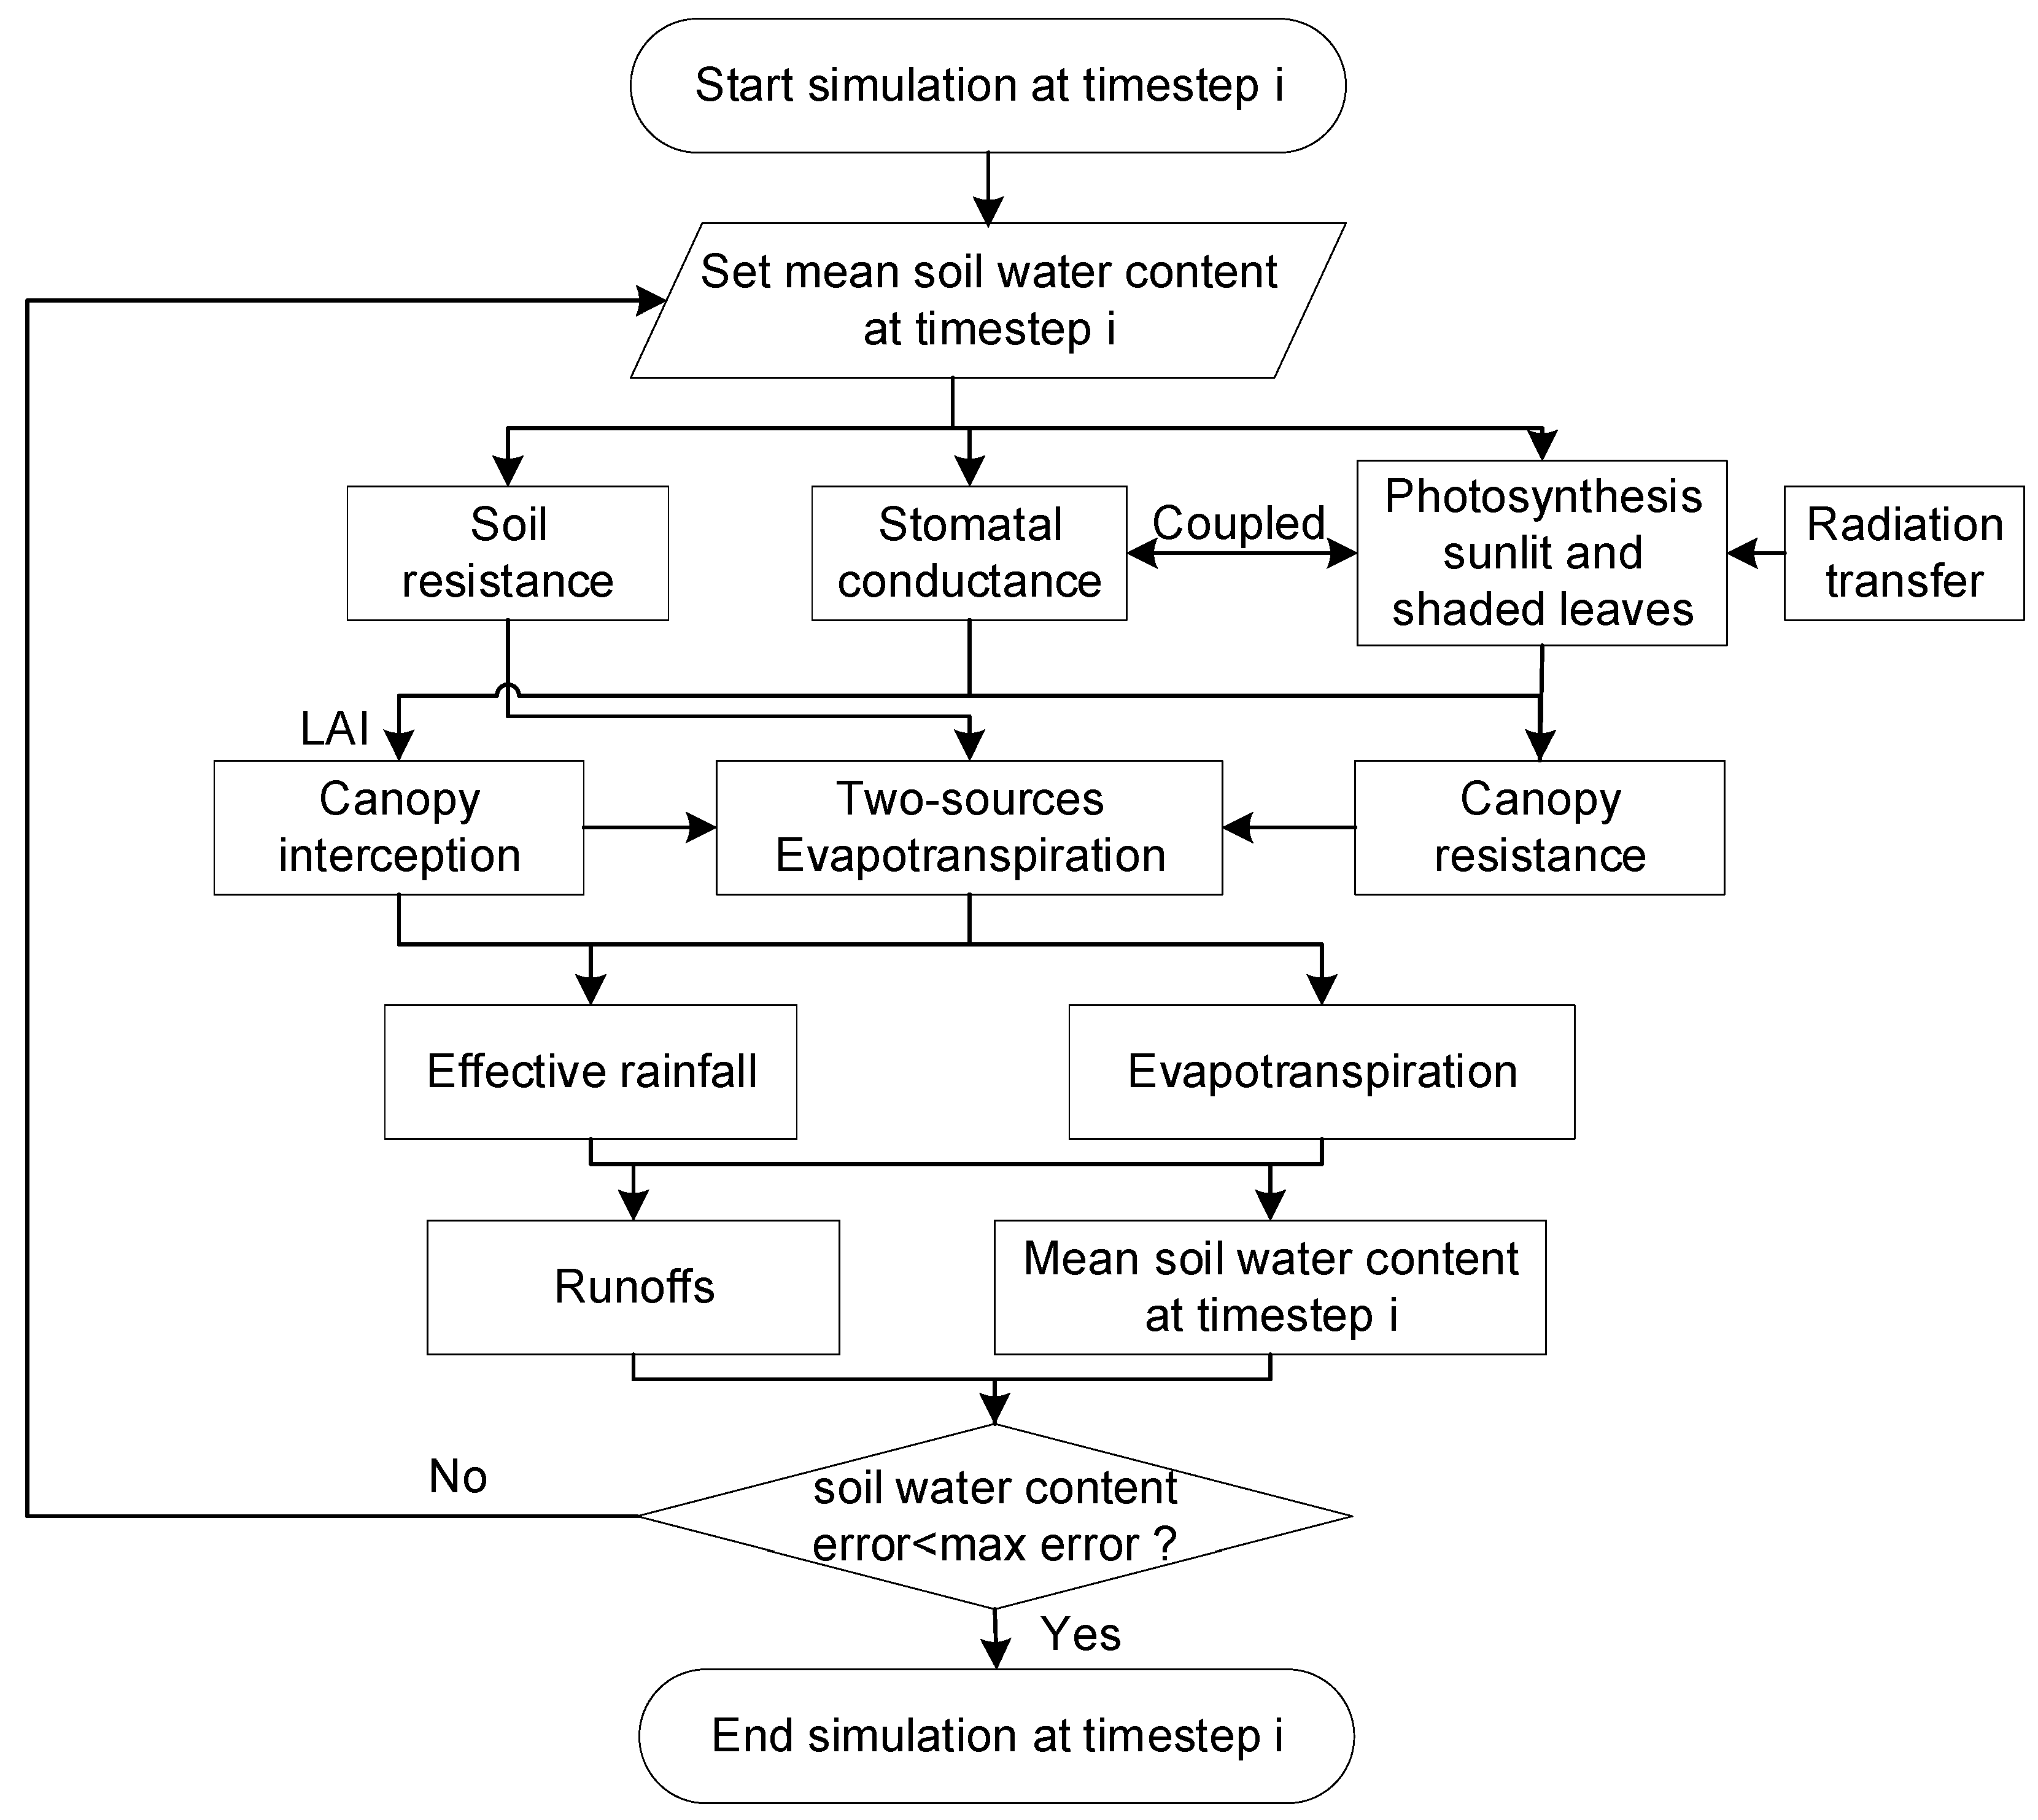
2.3. The Improved Water-Carbon Coupling DTVGM Ecohydrological Model

The Distributed Time Variant Gain Model (DTVGM) has been developed and successfully applied to many basins in China [34,35,36]. So far, it has been extended to simulating land-surface processes including water, energy and carbon fluxes by coupling with the CASACNP model [37]. The physically based coupled model could capture the mechanism of the interactions between vegetation dynamics and the water cycle quite well and could be used to investigate the responses of ecohydrological processes to changing climate and vegetation, and consequently the attributions of ET and GPP.
In this study, the DTVGM is further improved based on the coupled model by solving the ecohydrological processes iteratively according to the following equations to ensure water balance. At each daily time step, the water balance equation can be expressed as:
P i + A W i = A W i + 1 + R S i + E T i + R I i + R G i
The above equation could be solved using the Newton iteration method as follows:
f ( A W ) = 2 A W P A W i + R S i + R I i + R G i + E T i A W j + 1 = A W j f A W j f A W j
where P is the daily effective rainfall arriving at the ground surface, AW is the daily mean soil water content, ET is the daily actual evapotranspiration, RS, RI and RG are the daily surface runoff, interflow runoff and groundwater runoff, respectively. The subscripts i and i+1 represent the time steps. The superscript j is the iteration number. The evapotranspiration was calculated with three components including canopy-intercepted water evaporation in the wet leaves, transpiration in the dry leaves and soil evaporation based on the two-source method [37].
For gross primary production, the daily canopy photosynthesis model [38] is selected. The photosynthesis rate are calculated as follows:
A = min ( A c A j ) R d
where Ac and Aj are the Rubiso-limited and light-limited gross photosynthesis, Rd is the daytime leaf dark respiration. Details can be found in [38].
The major calculation procedure to iteratively solve of the ecohydrological processes are shown in Figure 2. Firstly, the initial mean soil water content was set to calculate the soil resistance. The stomatal conductance, photosynthesis and the canopy resistance were calculated, and were affected by soil moisture. Then, the ET with its three components and runoff could be estimated. After that, ET, effective rainfall and runoff were input to Equation (1) to solve the mean soil water content by comparing it with the initial mean soil water content until it converges using the Newton iteration. With these calculation steps, the mean soil moisture was iteratively calculated, and then the ET, GPP and other fluxes were estimated.

2.4. Quantification of the Effects on ET and GPP

For a given catchment, the changes of certain ecohydrological indicator Y (ET or GPP) can be affected by meteorological variables (M), elevated atmospheric carbon dioxide (eCO2, C), land cover change (L) and the interactive effects (I) between climate, eCO2 and land cover.
Y = f ( M , C , L )
According to [39], the changes in Y ( Δ Y ) at a catchment scale under changing environment can be expressed using Taylor approximation as follows:
Δ Y Δ t Δ Y M Δ t + Δ Y C Δ t + Δ Y L Δ t + Δ Y i n Δ t Δ Y M = f M Δ M + 1 2 ! 2 f M 2 Δ M 2 + + 1 n ! n f M n Δ M n Δ Y C = f C Δ C + 1 2 ! 2 f C 2 Δ C 2 + + 1 n ! n f C n Δ C n Δ Y L = f L Δ L + 1 2 ! 2 f L 2 Δ L 2 + + 1 n ! n f L n Δ L n
where Δ M , Δ C , Δ L are the changes of climate variables, eCO2 and land cover, Δ Y M , Δ Y C , Δ Y L , Δ Y I represent the changes in Y caused by climate change, eCO2, land cover changes and the interactive effects between the above three factors.
In order to quantify the contributions of climate change, eCO2 and land-use and cover change on GPP and ET in the six catchments from 2000 to 2019, ten experimental scenarios were designed, including the baseline (S0), climate variables detrend including atmospheric pressure-detrend (S1), temperature-detrend (S2), humidity-detrend (S3), precipitation-detrend (S4), windspeed-detrend (S5), solar radiation-detrend (S6), carbon dioxide-detrend (S7), land-use and cover changes (S8) and all factor changes scenario (S9). The details of the scenarios are shown in Table 2. The detrend of climate variables is based on the removal of the long-term linear trend during 2000 to 2019 as follows:
X Y i , d = [ X Y i a × ( Y i Y 0 ) X Y i ] × X Y i , d
where X Y i , d and X Y i , d denote the daily original and detrended climate variable at the d day in the year Yi; X Y i is the average values of the climate variable; a represents the linear trend of the values of the climate variable; Yi refers to the year from 2000 to 2019 and Y0 is the base year.
Each of the ten experimental scenarios were used to simulate the ecohydrological processes during 2000–2019 within the control variate method, i.e., only one influence factor is changed and others are fixed for S1 to S8. Furthermore, S9 denotes all the influence-factor changes. By comparing the simulated ET and GPP of the detrend experiment with the baseline, the contributions of each of the factors on ET and GPP could be quantified in the six catchments of the water-source region of the Xiong’an New Area.

3. Results

3.1. Model Performance

Prior to using the model for quantifying the contributions of different driving factors, the DTVGM model was evaluated in simulating the ET and GPP in the six catchments. The DTVGM simulated ET and GPP were evaluated using the remote sensing product. The model was then calibrated using the data during 2000–2006 and validated for 2007–2010 on a monthly scale. Figure 3 shows the monthly ET by the DTVGM model and the MODIS data from 2000 to 2010 in the six catchments. Generally, the evaluation shows that the seasonal patterns of the simulated ET are consistent with the MODIS data. Comparing to the MODIS data, the ET was found to be underestimated in the winter season. The relative error (RE) is below 7.0%, and the Pearson correlation coefficient (r) is above 0.73 except for the THC, and the root mean squares error (RMSE) is below 0.67 mm in the six catchments as shown in the statistical results in Table 3. Figure 4 displays the estimated monthly GPP by DTVGM and MODIS in the catchments. The results show that the simulated GPP captures the MODIS GPP patterns and magnitudes reasonably well. The RE values are almost all below 11.0% except for the BSC, the r values even reach up to 0.90 except for the BGC about 0.86, and the RMSE is below 1.24 g C/m2 (Table 3). Figure 5 shows the comparison of the annual simulated and remote-sensing based ET and GPP in the region. The least-squares linear fits to the simulated ET and GPP is near to the 1:1 line, while slightly underestimated, and the R2 value of linear goodness of fit test is about 0.51 and 0.71 for ET and GPP, respectively. Furthermore, the simulated annual ET was also compared with the GLEAM annual ET data. The results show that the RE is −4.3%, 4.1% −5.7%, −17.2%, −12.7% and −20.9% in the GBC, JMC, BSC, THC, DSC and CHC, respectively and the average RE is −8.7%. Figure 5c shows that the simulated annual ET by DTVGM is mostly between the values of MODIS and GLEAM. Overall, the results are acceptable for ET and GPP simulations in the region.

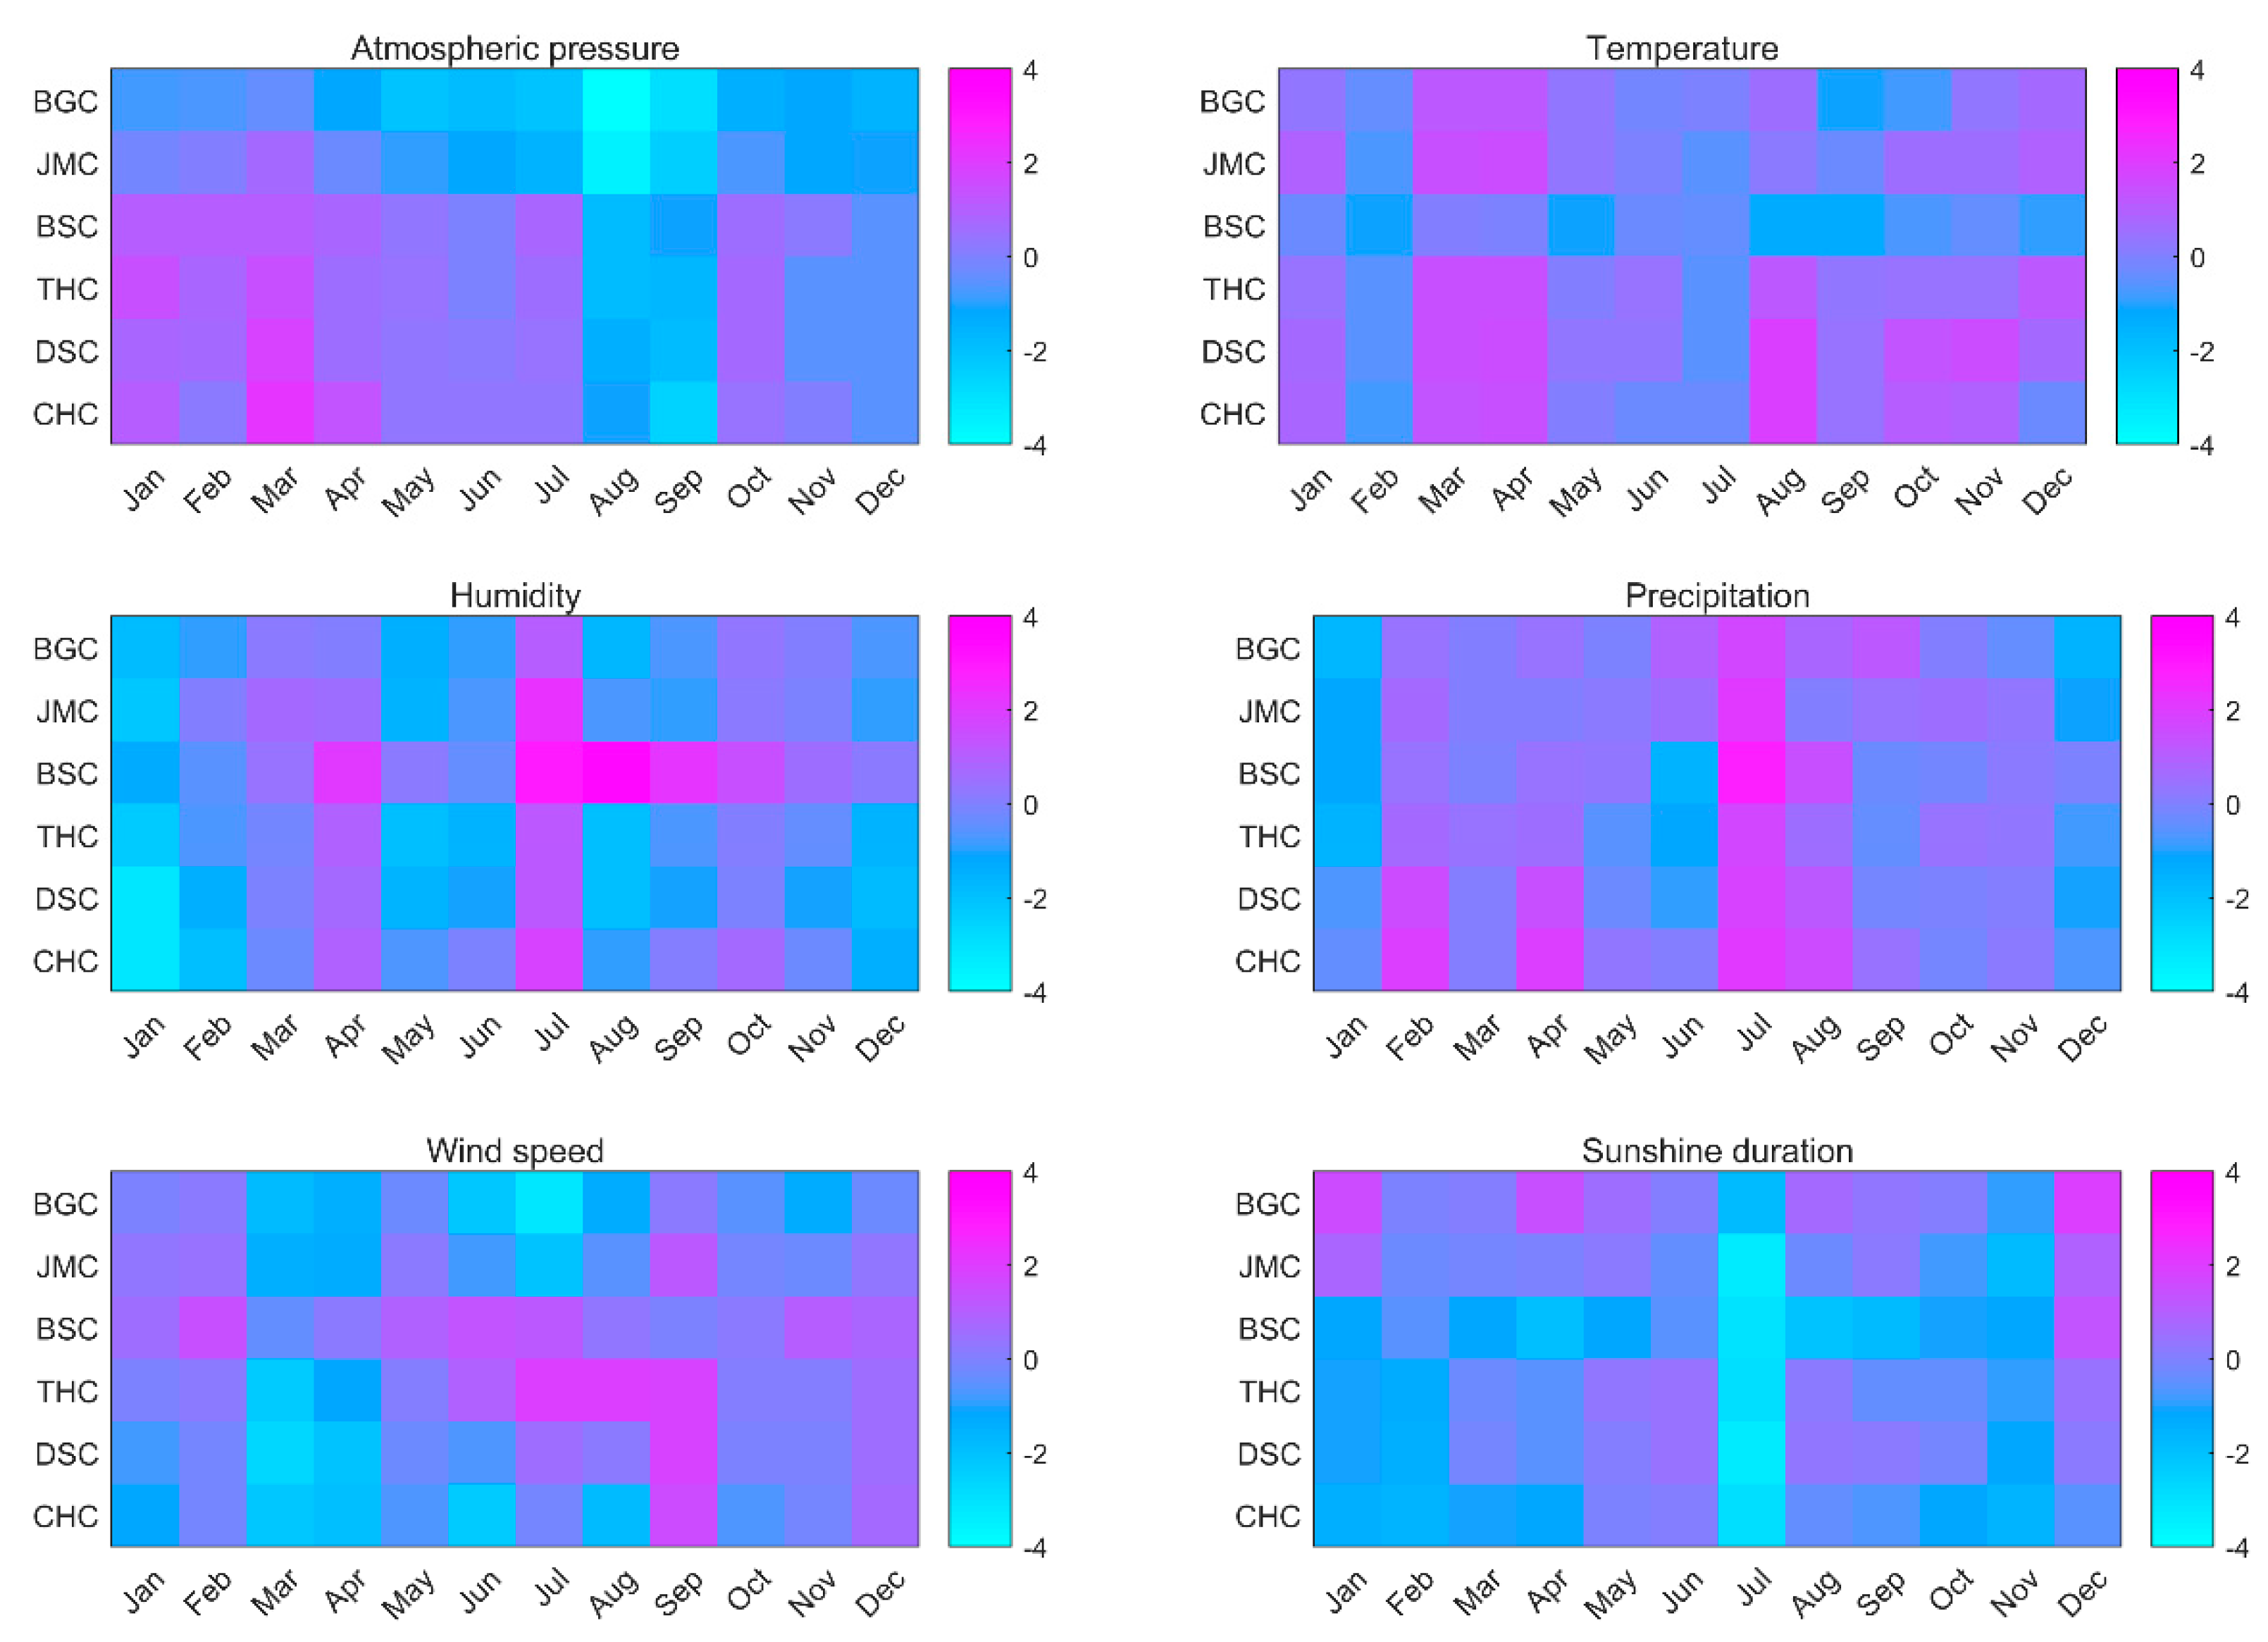
3.2. Changes in Climate Variables and Land Coverage

(1)
Changes in the climate variables
Climate variables are supposed to be the most important driving factors that affect hydrological processes, the vegetation dynamics and their interactions. Therefore, the changing trends of the climate variables, including atmospheric pressure, temperature, humidity, precipitation, windspeed, sunshine duration and carbon dioxide (CO2) were detected using the linear regression method and Mann–Kendall [40,41] test, which are both commonly used in the hydrometeorological trend detection. The monthly results in Table 4 show that the atmospheric pressure decreased slightly in the BGC and JMC but did not exceed the significance level, while it shows no obvious changing trends in the BSC, THC and DSC. The temperature increased significantly in the THC and DSC, while it decreased significantly in the BSC. The humidity decreased in five catchments except for the BSC and the decreasing trends are significant in the THC and DSC. The precipitation increased significantly in the five catchments except for the THC. The windspeed shows significant reduction in the BGC, DSC and CHC. The sunshine duration also displays a decreased trend, particularly in the BSC and CHC. The CO2 presents a significant increasing trend in the region within the slope of 2.24 ppmv/a.
The monthly Mann–Kendall changing trends of the climate variables in the six catchments are shown in Figure 6. The color bar indicates the changing trends in the variables. The atmospheric pressure displayed a significant decrease in summer and autumn, particularly in August and September. The humidity shows a dropping trend, particularly in January. The monthly precipitation increased mostly in February, April, July, August and October, particularly in the wet season, while it decreased in the dry season, especially in January, November and December. For the sunshine duration, it decreased almost throughout the year, especially for July. The windspeed decreased in most of the months, particularly during March, April, October and November. Unlike the changes of windspeed, the monthly temperature increased gradually in most of the months, and fell mostly in February and July.
(2)
Land-use and cover change
Land-use and cover change (LUCC) is recognized as important factors that influence evapotranspiration and vegetation carbon assimilation. Therefore, the land use changes were also investigated in the six catchments as shown in Figure 7. In the six catchments, the dominant land coverage is forest, grassland and cropland, covering almost nearly 95% of the whole basin. In the BGC, the major land cover is forest (83%) and grassland (9%). The forest decreases to 64% in the JMC and the rest are mainly grassland (22%), cropland (10%). While in the BSC, the main land cover is grassland (49%), the forest decreases to 36%, cropland is about 10%, respectively. In the THC, the grassland increases to 51% and the cropland increases to 21%, while the forest decreases to 22%. In the DSC, the chief land cover is still grassland (57%), while the cropland decreases to 7% and the forest increase to 32%. In the CHC, the main land covers are forest (48%), grassland (38%) and the cropland constitutes about 8%.
Figure 7 displays the land-coverage changes from 2000 to 2020 in the six catchments. Generally, the study area is a mountainous region with relatively few human activities, and the urban area increased by only 0.8% due to urbanization. A growth of 0.2% in the forest was found in the BGC. While in the JMC, the cropland and forest both decreased by 0.2% and the urban area increased by 0.4%. In the THC, the forest increased by 0.2%, the cropland and grassland area decreased by 0.5% and 0.7%, respectively. In the DSC, only the grassland was reduced by 2.3% and the cropland and forest both increased by 0.2%. In the CHC, the forest and grassland decreased by 1.5% and 0.6% as the result of urban expansion. Table 5 shows the changing trends of land coverage using the linear regression method and Mann–Kendall test. The result shows that most of the land-use and coverage changed slightly, except for urban land, during the past 20 years. However, it should be mentioned that the urban land covers small areas.

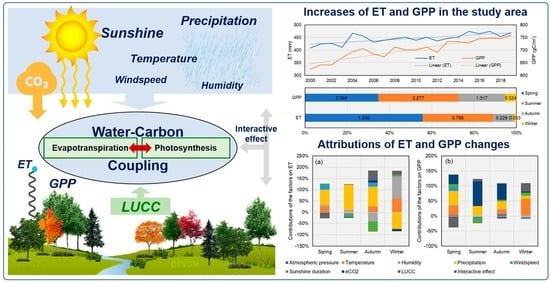
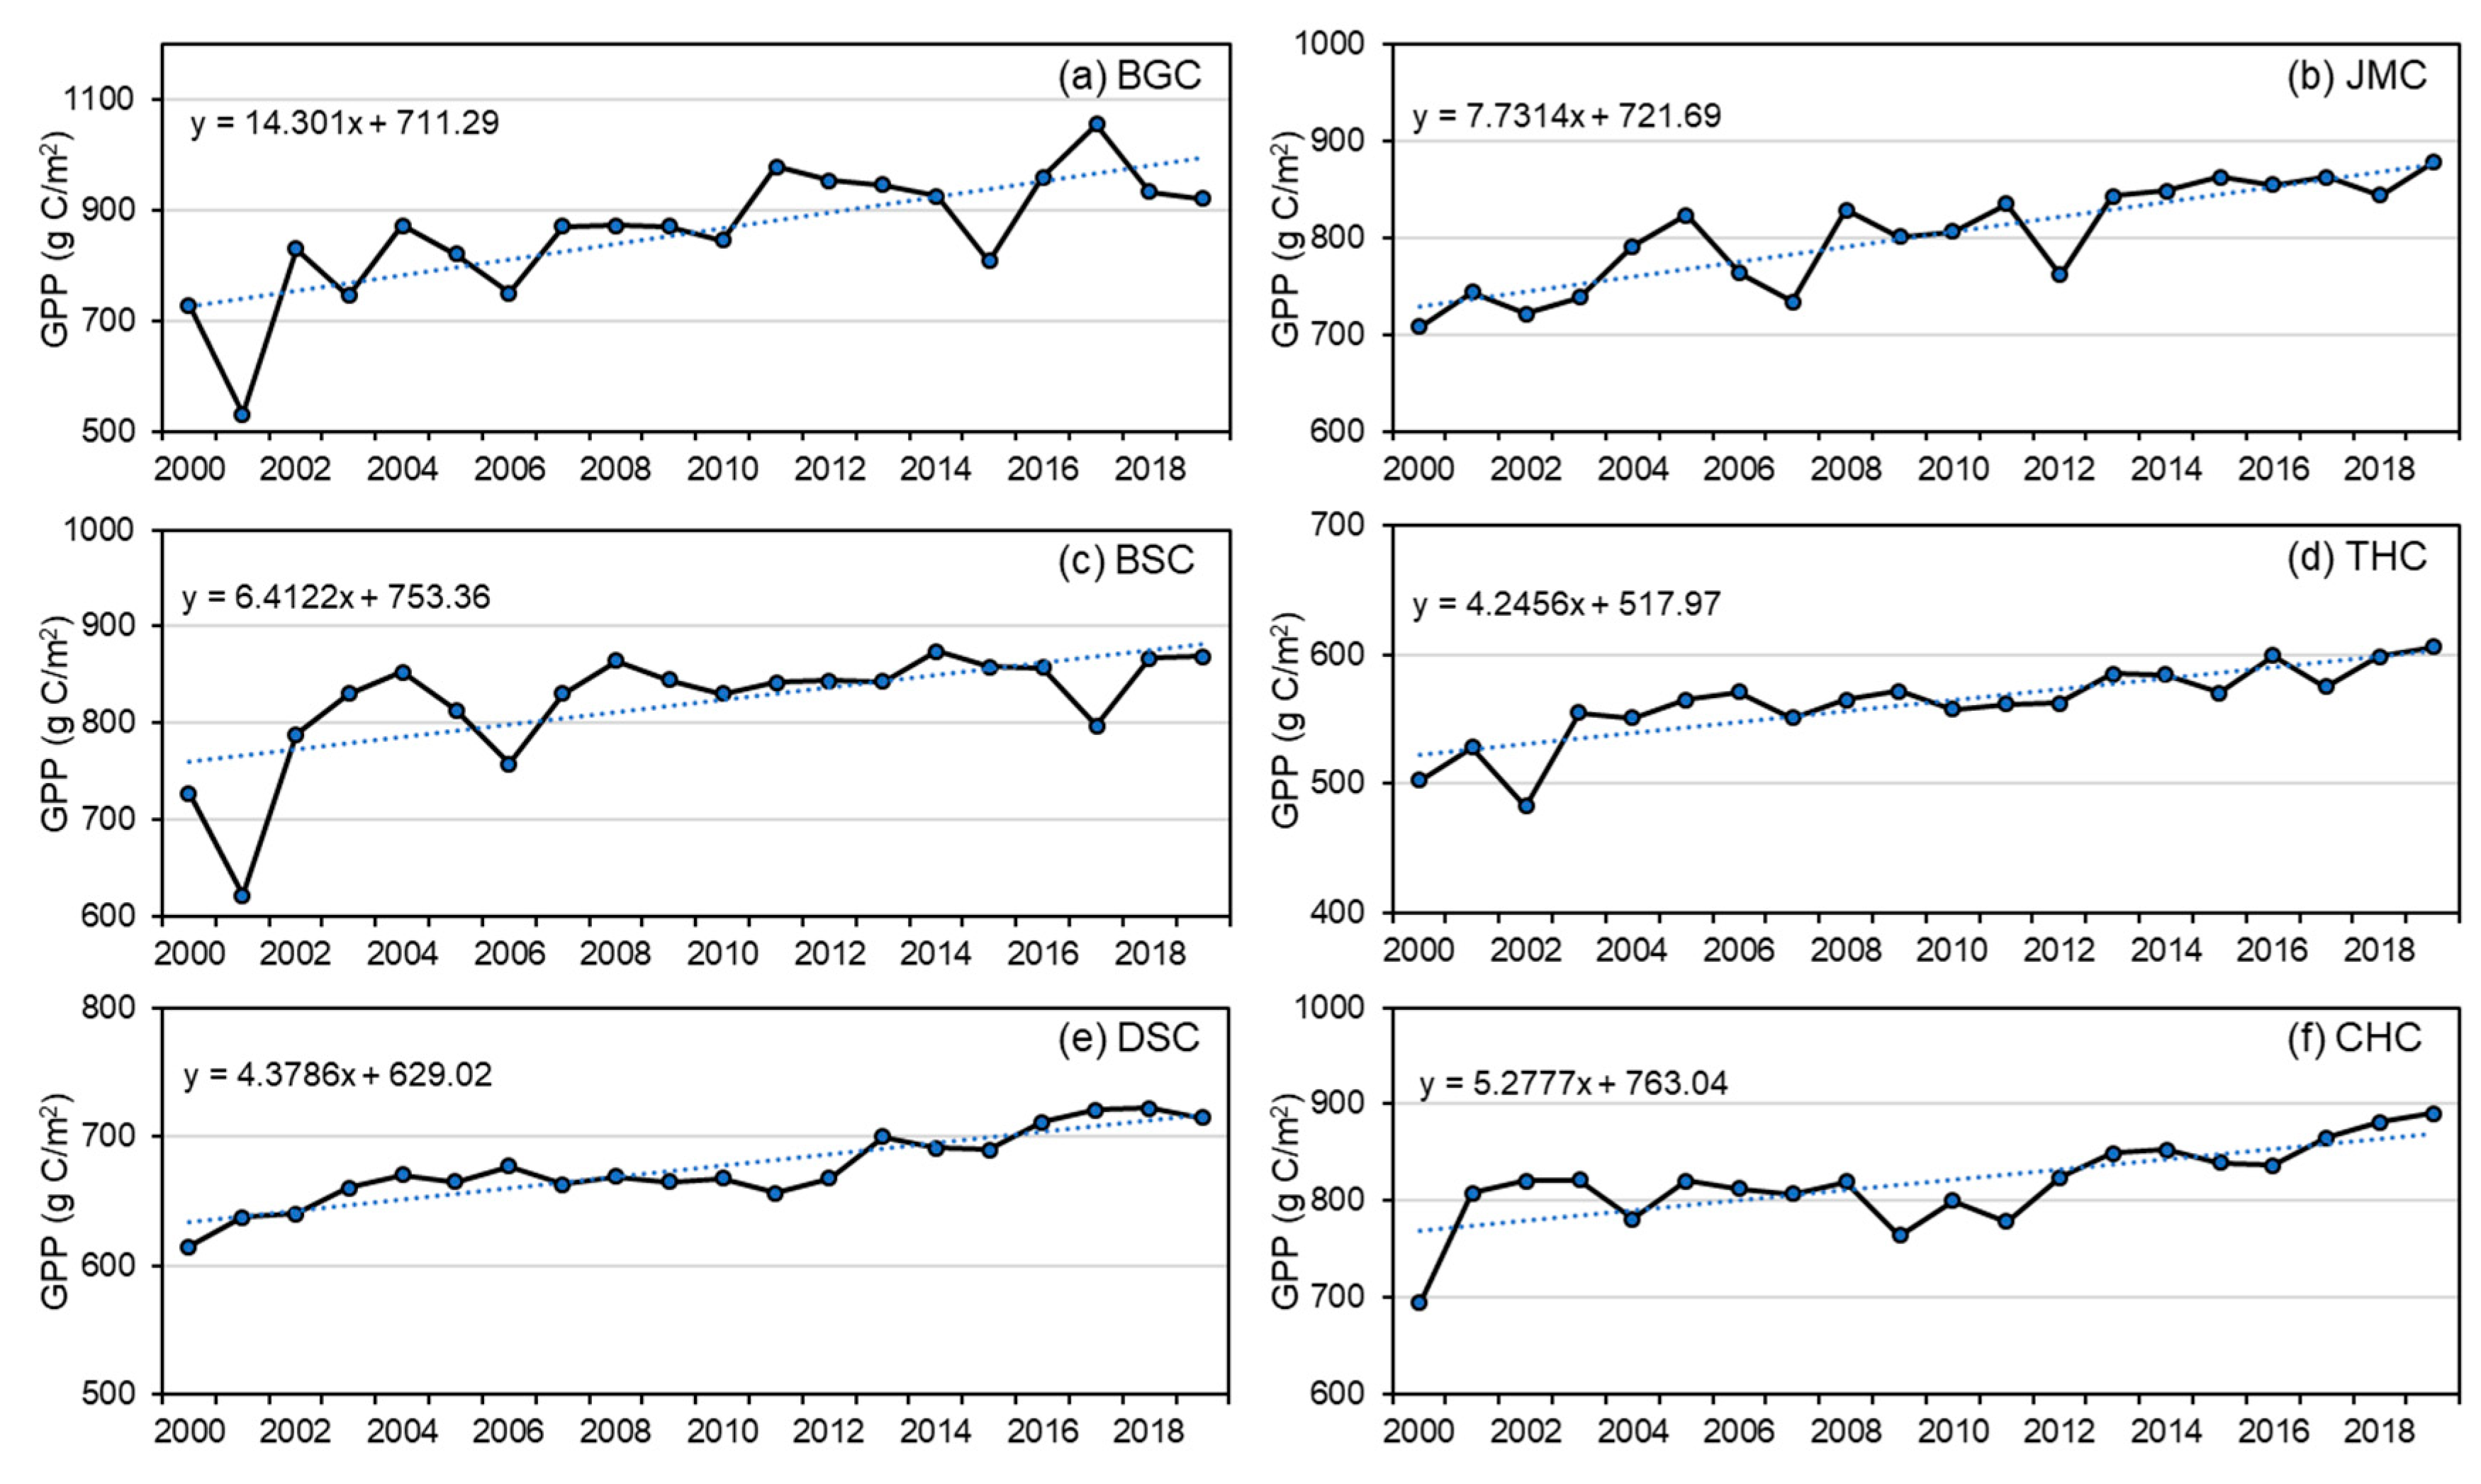
3.3. Changes in ET and GPP

The changes in ET and GPP were examined from 2000 to 2019 based on the DTVGM simulation using historical observations in the six catchments (Table 6). The ET and GPP in the region show a significant increase (α = 0.01) of 2.40 mm/a and 6.00 gC/m2/a, respectively. Figure 8 shows simulated annual ET in the six catchments during the past years. The ET increased at the rate of 6.92 mm/a, 3.49 mm/a, 0.44 mm/a, 1.59 mm/a, 1.54 mm/a and 1.20 mm/a for GBC, JMC, BSC, THC, DSC and CHC, respectively. The Mann–Kendall test reveals that the ET increased significantly in the BGC, JMC, DSC (α = 0.01) and THC (α = 0.05), while it is not obvious for the BSC and CHC. Figure 9 displays the modeled annual GPP in the six catchments. The GPP shows significant increasing trends in all of the six catchments at a significance level of 0.01. Additionally, the changing trends are 14.30 gC/m2/a, 7.73 gC/m2/a, 6.41 gC/m2/a, 4.25 gC/m2/a, 4.38 gC/m2/a, 5.28 gC/m2/a for GBC, JMC, BSC, THC, DSC and CHC, respectively.
Furthermore, the variations in ET within the year were investigated as shown in Figure 10a. In the BGC, the ET increases in all the months, especially in the spring and summer season from April to September. However, the ET shows decreasing trends in some months in the autumn and winter seasons and increased mostly in spring and summer seasons in the other five catchments. Particularly, the ET decreased from autumn to early spring in the following year in the BSC. Figure 10b displays the changing pattern in GPP within the year. The GPP increased in nearly all the months except for February. The major increase in monthly GPP mainly occurred in the spring and summer seasons, from April to September. Figure 10c summarizes the mean changes in ET and GPP in the water source region, and both ET and GPP increased mainly in spring and summer, while the uptrends were relatively smaller in autumn and winter.

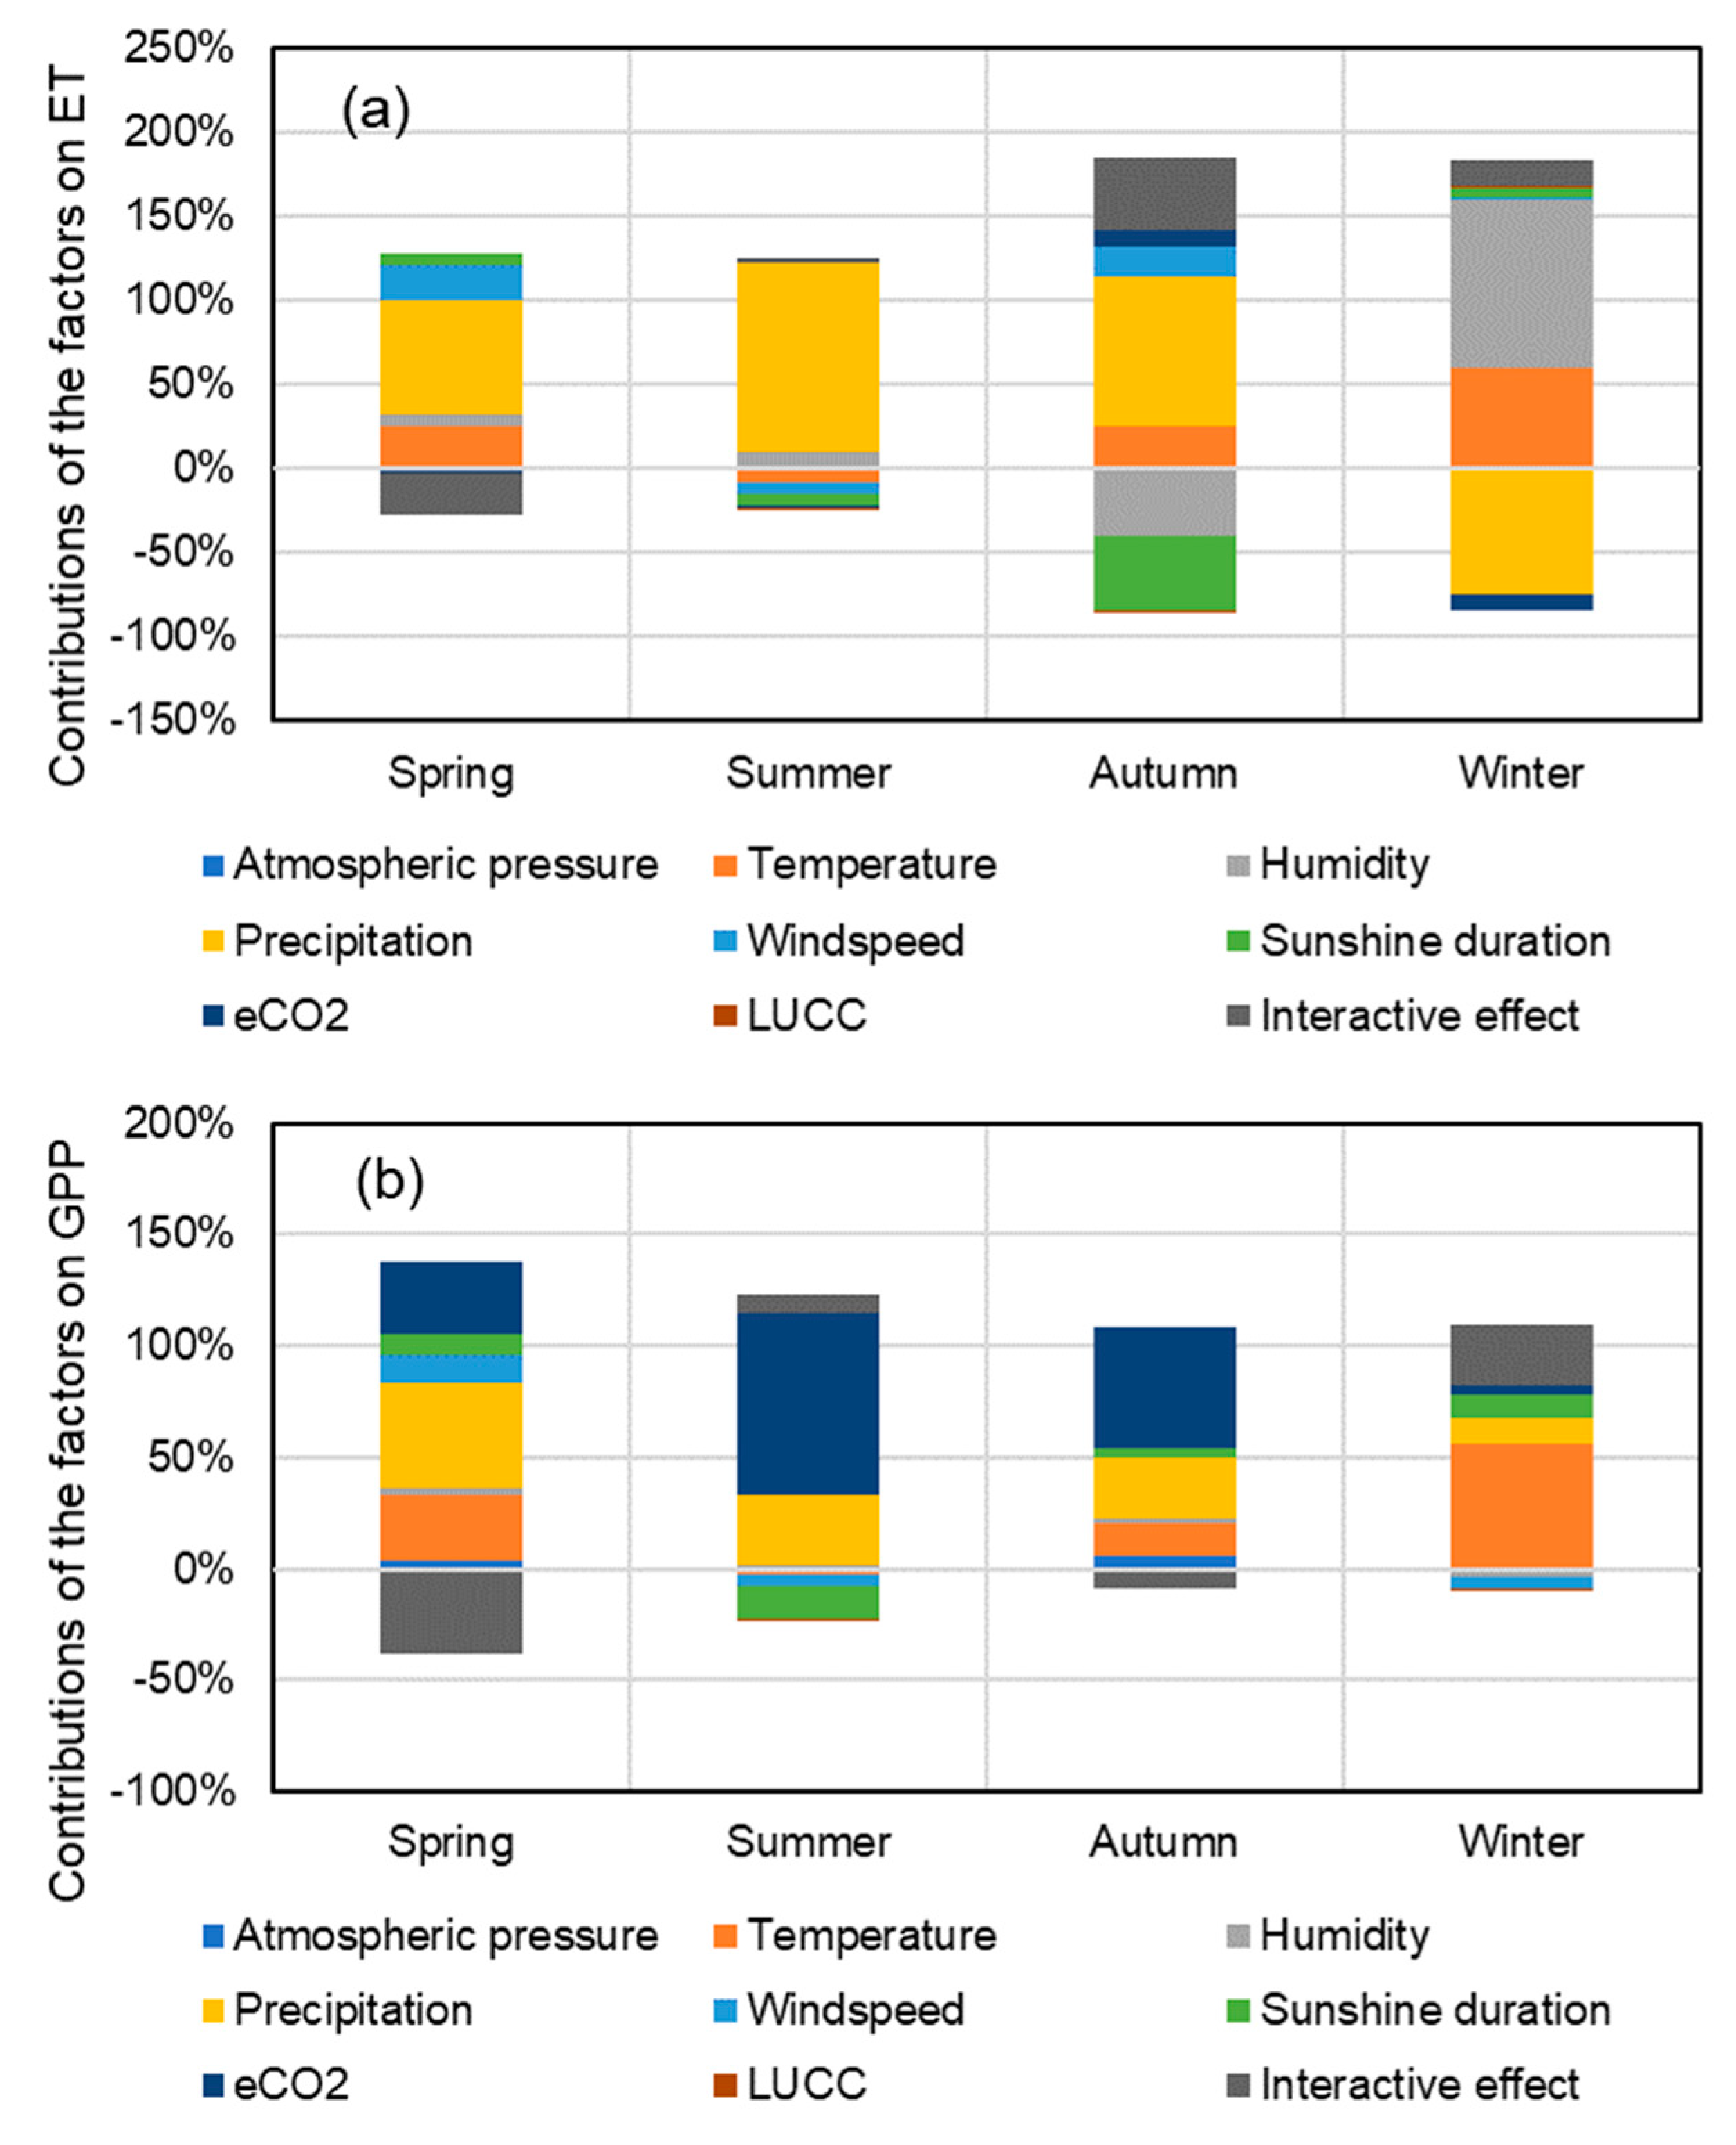
3.4. Attributing Changes in ET and GPP

(1)
Attributing changes in ET
To identify the dominant factors that affect the changes in ET and GPP, ten experimental scenarios including the baseline and the detrended scenarios were conducted. The contributions of the climate variables, land-use and cover change (LUCC), elevated atmospheric carbon dioxide (eCO2) and their interactive effects on ET are shown in Table 7. The results show that the contribution rate of precipitation to the growth ET in all the six catchments is the largest, with an average contribution of 104.8%. The contributions of the remaining influence factors are temperature (12.8%), solar dimming (−12.4%) and carbon dioxide (−7.2%), and then the interactive effects (2.3%), humidity (2.0%), atmospheric pressure (−1.3%), wind speed (−0.8%), and LUCC (−0.2%). In the BGC, the results show that precipitation, temperature, windspeed, atmospheric pressure, humidity and LUCC contributed positive effects, and the effects of sunshine duration, eCO2 and interactions were negative. However, in the JMC, only precipitation, temperature and interactive effects show positive effects and the other climate variables all contributed negative effects. It should be noticed that the interactive effects could reach up to 21.2% in the JMC, which contributes more than temperature and the other factors. In the BSC, the precipitation could affect the ET increase by up to 164.1%, and sunshine duration contributed to a considerable ET decrease, by 42.5%. In the THC and DSC, all the influence factors have similar contributions. The precipitation, temperature, humidity and windspeed had positive effects on the ET increase, while the sunshine duration, eCO2, LUCC, atmospheric pressure and interactions led to ET reductions. In the CHC, the precipitation, temperature and windspeed continue to contribute to the ET increase, while the interactions and atmospheric pressure also increase the ET, whereas humidity, sunshine duration, eCO2 and LUCC contribute negative effects.
Figure 11 and Figure 12a display the contributions of the factors on monthly and seasonal ET changes. Generally, precipitation is the dominant factor for ET changes. The positive effects of precipitation occur throughout the year except for the negative effects that occur in January and December in winter. The temperature has a negative effect on ET changes in summer, while it leads to an ET increase in other three seasons, particularly from November to January in winter. The effect of sunshine duration on ET changes is negative in summer and autumn, particularly from September to November, which is the opposite in winter and spring. The eCO2 contributes to ET increase in autumn and ET decrease in other seasons, especially in winter. The humidity leads to an ET decrease in autumn and ET increase in other seasons, particularly in January and December in winter and it is the dominant factor contributing to ET change in winter. The windspeed has a positive effect on ET increase in most of the months except for June to August in summer. The effects of LUCC and atmospheric pressure on ET are almost rare throughout the year. Additionally, the interactive effects lead to ET reduction, mostly in spring, and its increase in autumn and winter, particularly in September. Overall, precipitation is the dominant factor that increases ET in spring, summer and autumn and decrease ET in winter. In spring, the interactive effects contribute to most of the ET reduction. In autumn, the humidity and sunshine duration are the main factors that reduce ET. However, humidity and temperature are the major reasons for ET increase in winter.
(2)
Attributing changes in GPP
Based on the ten experimental scenarios, the effects of the climate variables, LUCC, eCO2 and their interactions on GPP are also quantified in Table 8. The results show that eCO2 contribute the largest GPP increases in most of region within average contribution about 56.7%. The precipitation and temperature also have significant influences on the increase in GPP with the effects of 34.8% and 27.8%, while the sunlight duration, humidity, wind speed, atmospheric pressure, LUCC and the interactive effects have negative effects on GPP growth with the contributions of −6.8%, −4.8%, −3.5%, −2.4%, −1.0% and −0.8%, respectively. We could also find that the effects of the influence factors on GPP changes are various from each catchment in the region. In the BGC and JMC, the precipitation contributes the largest GPP increase, and eCO2 and temperature also contribute significant increase in GPP. Meanwhile, the interactive effects (39.5%) should also be focused on in the JMC. The effects of atmospheric pressure, windspeed and LUCC are different in the two catchments. In the BSC, the eCO2 have a large effect increasing the GPP by 108.3%, the humidity and precipitation also have positive effects, while temperature, sunshine duration and the interactions have negative effects. In the THC and DSC, the dominant factor is eCO2 with the contributions of 66.2% and 73.8%, and the followed factors are temperature and precipitation. The interactive effects could reduce the GPP by 39.7% in the DSC. The effects of the other impact factors are generally small. In the CHC, the most important factors are eCO2 and temperature increasing the GPP by 66.8% and 45.7%, while precipitation has a negative effect of −6.6% which is different from the results in other catchments. Meanwhile, the sunshine duration make a large reduction on GPP by 21.3%. The LUCC have a larger negative effect about −4.9% in the CHC comparing to other catchments.
Figure 12b and Figure 13 presents the contributions of the factors on monthly and seasonal GPP changes. The eCO2 contribute a large GPP increase throughout the year except for small decrease in February. Additionally, the eCO2 is the dominant factor contributing to GPP increase in summer and autumn, specifically from June to October. Furthermore, precipitation has positive effect on GPP change in all months, and it is the dominant factor leading to an increased GPP in spring. The temperature increases the GPP during a year, particularly from January to March, while it has a slight negative effect in summer. The temperature is the most important factor that contributes to the GPP increase in winter and it also has a great contribution in spring. The windspeed increased the GPP in spring and autumn and leads to a slight decrease in the GPP in summer and winter. The sunshine duration has a negative effect in summer and positive effects in the other seasons. Generally, the effects of atmospheric pressure, humidity and LUCC are relatively small compared to the above influence factors. The effects of the interactions of the factors on GPP should be of concern, as they can lead to a considerable decrease in GPP in spring, from March to May, and an increase in winter, in January and February. Overall, in spring, the precipitation is the dominant factor that increases GPP, while the temperature and eCO2 also make great contributions, while the interactions have considerable effects on GPP reduction. The eCO2 has a dominant effect on GPP increases in summer and autumn, followed by precipitation. Conversely, in winter, the temperature is the major factor that increases GPP, and the interactions of the factors should also be considered.

4. Discussion

In this study, the improved water–carbon coupled DTVGM ecohydrological model was used to simulate the ET and GPP in the six catchments of the water-source region of the Xiong’an New Area. Overall, the model was able to capture the ET and GPP variations quite well in the simulation periods, with relatively error of mostly below 10.0% and a high correlation coefficient of up to around 0.9. Compared to the MODIS data, the DTVGM simulation results also show some underestimations in the dry season for ET, while GPP is underestimated in the wet season and overestimated in the dry season, which is relevant to the vegetation, runoff and soil parameterization. The simulated ET is also consistent with the GLEAM ET Product [42] with a relative error of about −8.7%, which further proved the reliability of the DTVGM results. Some researches show that the large seasonal amplitudes MODIS GPP data is overestimated in the wet season and low values are underestimated. The reason may be due to the artificially high values of MODIS FPAR and the MODIS light-use efficiency approach, which does not account for the saturation of canopy photosynthesis under clear sky conditions [43,44,45]. Based on the DTVGM simulation, ET decreases from northeast to southwest and ranges from around 400 mm/year to 500 mm/year, with an average value of 446.67 mm/year. GPP ranges from around 600 gCm2/year to 800 gCm2/year from northeast to southwest, with a mean value of 702.57 gCm2/year. These results also agreed with previous studies that included ET [18] and GPP simulations in this region [28,46]. Overall, we suppose that the DTVGM ecohydrological model could provide reasonable simulations for ET and GPP in the experimental scenario analysis to identify the dominant impact factors.
The attributions of ET and GPP changes were evaluated based on ten experimental scenarios. At the annual scale, ET increased by about 2.4 mm/a in the region. The increasing precipitation dominated the ET uptrend absolutely, probably on account of the water limit in the semi-arid region [47]. Additionally, similar results were also found in other semi-arid regions [48]. Meanwhile, rising air temperature and decreasing humidity also contribute to the ET uptrend by increasing the vapor-pressure deficit and then accelerating ET [49]. The elevated atmospheric CO2 concentration (eCO2) and solar dimming are the main causes for the decrease in ET, which is similar to the findings in [19]. It has been widely recognized that eCO2 tends to induce the stomatal closure, resulting in a decrease in transpiration [50]. Additionally, solar dimming reduces the solar radiation on the land surface and limits the available energy allocation to the latent heat. The decreasing windspeed also contribute to a small decrease in ET. The GPP increases to about 6.0 gC/m2/a in the region. The eCO2, increasing precipitation and rising temperature are responsible for the GPP increases, while solar dimming, decreasing humidity and windspeed contribute to decreases in GPP. These results are also supported in previous studies [21,51]. The eCO2 and rising temperature may directly lead to increasing carboxylation rates and GPP. Increasing precipitation promotes the available water resources for plant growth and also contributes to a GPP increase with a sigmoid relationship [52]. Meanwhile, decreasing humidity leads to vapor-pressure deficit increase, which would result in stomatal conductance declines and a slowing of photosynthesis [53]. Besides the negative effects of solar dimming on ET, it would also reduce the photosynthetically active radiation for carbon fix [54]. The results also show that the effects of LUCC on both ET and GPP are slightly negative, at about −0.2% and −1.0%, respectively. This may be related to the slight land-use change, less urbanization and human activities in the mountainous regions.
On the seasonal scale, the increases in ET and GPP mainly occur in spring and summer and the increases are relatively small particularly in winter. Similar results are also found in the northeastern part of China [55]. The major reason for the increase in ET and GPP in spring and summer is obvious rising temperature and increasing precipitation in the two seasons, which may be due to the availability of more accumulated temperature and water during the growing season. In autumn, significant solar dimming should lead to lower ET and GPP uptrends, while the humidity decreases significantly and lower increases in precipitation and temperature cause little ET and GPP increase in winter. Besides, the interactive effects of the climate variables, eCO2 and LUCC are significant in spring and winter, and have positive effects on the ET (16.2%) and GPP (27.8%) uptrend in spring and negative effects on the ET (−24.4%) and GPP (−38.0%) uptrend in winter. Meanwhile, the interactive effects are also significant in autumn in ET increase (42.9%). This finding is consistent with the conclusion that interactive effects are important in water-limited catchments, whereby the ecosystem structure and function are mainly constrained by water [39,56]. Additionally, this may be related to the strategy mechanism of the ecosystem in adapting to changing circumstances.
The ET and GPP increase in the water-source region of the Xiong’an New Area, and increase more during the growing season from April to September, which can cause adverse impacts more easily on agriculture and the ecosystem [57,58]. As we know, water resources were relatively scarce in semi-arid area, the increased GPP was helpful for regional-vegetation recovery and more water consumption may have led to runoff reduction under global climate change in this region, subsequently resulting in a water shortage for social-economic usage and river environmental requirements. Besides, the increased ET mainly caused by increased transpiration will lead to more soil water-consumption of the soil layer and intensify the drought, resulting in high ecological sensitivity and serious vulnerability in water-limited zones [6]. The attributions of ET and GPP changes reveal that the multitude of factors dominating water and carbon fluxes are different in the region over different time scales. Precipitation is responsible for both ET and GPP changes, which proved the determination of the vegetation by water in the semi-arid region. Rising temperature and eCO2 also contribute greatly to both ET and GPP changes. Increasing precipitation, rising temperature and eCO2 lead to greater GPP and ET for vegetation. Meanwhile, more precipitation may lead to greater water availability and fewer droughts, but a warmer temperature could enhance evaporation from the soil, producing more droughts [59]. The complex mechanisms of ET and GPP changes may bring more uncertainties of the drought in future and pose challenges to drought management.
The attributions of ET and GPP changes are quantified in this study by considering climate variables, eCO2 and LUCC, at both annual and seasonal timescales using the water–carbon coupling DTVGM ecohydrological model. We consider the water–carbon interactions by better capturing the mechanisms of ET and GPP changes, and it could especially reflect the interactive effects of hydrological processes on GPP by the climate forces and the vegetation dynamics on ET by the elevated atmospheric carbon dioxide, which cannot be well understood by the ecological model or rainfall–runoff relationship based on hydrological model. Besides, as global climate change may increase drought frequency and intensity in the future [60], more effective models to evaluate ET and GPP are needed considering anthropogenic influences such as irrigation [61]. The improved DTVGM ecohydrological model in this study could characterize the ET and GPP variations reasonably, providing a useful tool to study drought prediction and also the drought effects on vegetation carbon-uptake. However, it should also be further improved by considering human activities and more studies should be focused on the model parameterization and deeper insights into the spatiotemporal patterns. Furthermore, future work should also continue to assess the driving factors.

5. Conclusions

In this study, the attributions of the evapotranspiration (ET) and gross primary production (GPP) changes including climate variables, elevated atmospheric carbon dioxide (eCO2), land-use and coverage change (LUCC) were quantified in the six catchments in the water source region of the Xiong’an New Area using the improved water–carbon coupled DTVGM ecohydrological model. The ecohydrological model could capture the ET and GPP variations reasonably in the study area. The modelling experimental scenarios show that annual ET and GPP increased significantly, particularly in the spring and summer seasons. At the annual scale, increasing precipitation dominated the ET uptrend absolutely and air temperature also contributed to the ET uptrend. The eCO2 concentration and solar dimming were found to be the main causes for the ET decrease. For the GPP changes, eCO2, increasing precipitation and rising temperature dominant the GPP increases. Compared to climate change, the LUCC has small effects on both ET and GPP in terms of the few changes in land coverage. At the seasonal scale, the modelling results show different effects in the four seasons. Overall, precipitation, temperature and eCO2 are the main causes for ET and GPP changes. However, the decreasing humidity was found to be the dominant factor for ET increase in winter, while solar dimming imparts strong effects on ET decreases in autumn. It should also be noted that the contribution of the interactive effects cannot be neglected at the seasonal scale, particularly in terms of the considerable decreases in ET and GPP in spring, increases in ET in autumn and winter and increase in GPP in winter. This study highlights the importance of considering water–carbon coupling on the attribution of ET and GPP and the differentiation of the effects by the abovementioned influence factors at the annual and seasonal scales.

Supplementary Materials

The following supporting information can be downloaded at: https://0-www-mdpi-com.brum.beds.ac.uk/article/10.3390/rs14051187/s1.

Author Contributions

S.Z.: Formal analysis, Investigation, Methodology, Writing—original draft. H.D.: Conceptualization, Methodology, Writing—review and editing. J.X.: Conceptualization, Writing—review and editing. J.W.: Investigation, Visualization. L.Y.: Data Curation. All authors have read and agreed to the published version of the manuscript.

Funding

This study was supported by the National Natural Science Foundation of China (No.51809008), Youth Innovation Promotion Association, CAS (2021385) and the Central Guidance on Local Science and Technology Development Fund of Chongqing City (No.2021000069).

Institutional Review Board Statement

Not applicable.

Informed Consent Statement

Not applicable.

Data Availability Statement

The data presented in this study are openly available through the Resource and Environment Science and Data Center, China Meteorological Data Sharing Service System and Global Land Evaporation Amsterdam Model Datasets.

Acknowledgments

We thank the anonymous reviewers for their constructive feedback.

Conflicts of Interest

The authors declare no conflict of interest.

References

  1. Li, C.; Zhang, Y.; Shen, Y.; Kong, D.; Zhou, X. LUCC-Driven Changes in Gross Primary Production and Actual Evapotranspiration in Northern China. J. Geophys. Res. Atmos. 2020, 125, e2019JD031705. [Google Scholar] [CrossRef]
  2. Lu, N.; Chen, S.; Wilske, B.; Sun, G.; Chen, J. Evapotranspiration and soil water relationships in a range of disturbed and undisturbed ecosystems in the semi-arid Inner Mongolia, China. J. Plant Ecol. 2011, 4, 49–60. [Google Scholar] [CrossRef] [Green Version]
  3. Wang, Y.; Zhang, Y.; Yu, X.; Jia, G.; Liu, Z.; Sun, L.; Zheng, P.; Zhu, X. Grassland soil moisture fluctuation and its relationship with evapotranspiration. Ecol. Indic. 2021, 131, 108196. [Google Scholar] [CrossRef]
  4. Zhou, S.; Williams, A.P.; Lintner, B.R.; Berg, A.M.; Zhang, Y.; Keenan, T.F.; Cook, B.I.; Hagemann, S.; Seneviratne, S.I.; Gentine, P. Soil moisture–atmosphere feedbacks mitigate declining water availability in drylands. Nat. Clim. Chang. 2021, 11, 38–44. [Google Scholar] [CrossRef]
  5. Yuan, W.; Liu, S.; Yu, G.; Bonnefond, J.-M.; Chen, J.; Davis, K.; Desai, A.R.; Goldstein, A.H.; Gianelle, D.; Rossi, F.; et al. Global estimates of evapotranspiration and gross primary production based on MODIS and global meteorology data. Remote Sens. Environ. 2010, 114, 1416–1431. [Google Scholar] [CrossRef] [Green Version]
  6. Zhang, X.; Liu, K.; Li, X.; Wang, S.; Wang, J. Vulnerability assessment and its driving forces in terms of NDVI and GPP over the Loess Plateau, China. Phys. Chem. Earth Parts A/B/C 2022, 125, 103106. [Google Scholar] [CrossRef]
  7. Feng, X.; Fu, B.; Piao, S.; Wang, S.; Ciais, P.; Zeng, Z.; Lü, Y.; Zeng, Y.; Li, Y.; Jiang, X.; et al. Revegetation in China’s Loess Plateau is approaching sustainable water resource limits. Nat. Clim. Chang. 2016, 6, 1019–1022. [Google Scholar] [CrossRef]
  8. Wolf, S.; Keenan, T.F.; Fisher, J.B.; Baldocchi, D.D.; Desai, A.R.; Richardson, A.D.; Scott, R.L.; Law, B.E.; Litvak, M.E.; Brunsell, N.A.; et al. Warm spring reduced carbon cycle impact of the 2012 US summer drought. Proc. Natl. Acad. Sci. USA 2016, 113, 5880–5885. [Google Scholar] [CrossRef] [Green Version]
  9. Gentine, P.; Green, J.K.; Guérin, M.; Humphrey, V.; Seneviratne, S.I.; Zhang, Y.; Zhou, S. Coupling between the terrestrial carbon and water cycles—A review. Environ. Res. Lett. 2019, 14, 83003. [Google Scholar] [CrossRef]
  10. Pascolini-Campbell, M.; Reager, J.T.; Chandanpurkar, H.A.; Rodell, M. A 10 per cent increase in global land evapotranspiration from 2003 to 2019. Nature 2021, 593, 543–547. [Google Scholar] [CrossRef]
  11. Madani, N.; Parazoo, N.C.; Kimball, J.S.; Ballantyne, A.P.; Reichle, R.H.; Maneta, M.; Saatchi, S.; Palmer, P.I.; Liu, Z.; Tagesson, T. Recent Amplified Global Gross Primary Productivity Due to Temperature Increase Is Offset by Reduced Productivity Due to Water Constraints. AGU Adv. 2020, 1, e2020AV000180. [Google Scholar] [CrossRef]
  12. Zhan, S.; Song, C.; Wang, J.; Sheng, Y.; Quan, J. A Global Assessment of Terrestrial Evapotranspiration Increase Due to Surface Water Area Change. Earth’s Future 2019, 7, 266–282. [Google Scholar] [CrossRef] [PubMed] [Green Version]
  13. Zheng, Y.; Shen, R.; Wang, Y.; Li, X.; Liu, S.; Liang, S.; Chen, J.M.; Ju, W.; Zhang, L.; Yuan, W. Improved estimate of global gross primary production for reproducing its long-term variation, 1982–2017. Earth Syst. Sci. Data 2020, 12, 2725–2746. [Google Scholar] [CrossRef]
  14. Sakalli, A.; Cescatti, A.; Dosio, A.; Gücel, M.U. Impacts of 2 °C global warming on primary production and soil carbon storage capacity at pan-European level. Clim. Serv. 2017, 7, 64–77. [Google Scholar] [CrossRef]
  15. Swann, A.L.S.; Hoffman, F.M.; Koven, C.D.; Randerson, J.T. Plant responses to increasing CO 2 reduce estimates of climate impacts on drought severity. Proc. Natl. Acad. Sci. USA 2016, 113, 10019–10024. [Google Scholar] [CrossRef] [Green Version]
  16. Zhang, D.; Liu, X.; Zhang, L.; Zhang, Q.; Gan, R.; Li, X. Attribution of Evapotranspiration Changes in Humid Regions of China from 1982 to 2016. J. Geophys. Res. Atmos. 2020, 125, e2020JD032404. [Google Scholar] [CrossRef]
  17. Hu, S.; Mo, X. Attribution of Long-Term Evapotranspiration Trends in the Mekong River Basin with a Remote Sensing-Based Process Model. Remote Sens. 2021, 13, 303. [Google Scholar] [CrossRef]
  18. Li, S.; Wang, G.; Sun, S.; Fiifi Tawia Hagan, D.; Chen, T.; Dolman, H.; Liu, Y. Long-term changes in evapotranspiration over China and attribution to climatic drivers during 1980–2010. J. Hydrol. 2021, 595, 126037. [Google Scholar] [CrossRef]
  19. Liu, W.; Mo, X.; Liu, S.; Lin, Z.; Lv, C. Attributing the changes of grass growth, water consumed and water use efficiency over the Tibetan Plateau. J. Hydrol. 2021, 598, 126464. [Google Scholar] [CrossRef]
  20. Wang, L.; Li, M.; Wang, J.; Li, X.; Wang, L. An analytical reductionist framework to separate the effects of climate change and human activities on variation in water use efficiency. Sci. Total Environ. 2020, 727, 138306. [Google Scholar] [CrossRef]
  21. Dass, P.; Rawlins, M.A.; Kimball, J.S.; Kim, Y. Environmental controls on the increasing GPP of terrestrial vegetation across northern Eurasia. Biogeosciences 2016, 13, 45–62. [Google Scholar] [CrossRef] [Green Version]
  22. Xie, S.; Mo, X.; Hu, S.; Liu, S. Contributions of climate change, elevated atmospheric CO2 and human activities to ET and GPP trends in the Three-North Region of China. Agric. For. Meteorol. 2020, 295, 108183. [Google Scholar] [CrossRef]
  23. Li, Y.; Zhang, Y.; Lv, J. Interannual variations in GPP in forest ecosystems in Southwest China and regional differences in the climatic contributions. Ecol. Inform. 2022, 69, 101591. [Google Scholar] [CrossRef]
  24. He, G.; Zhao, Y.; Wang, J.; Gao, X.; He, F.; Li, H.; Zhai, J.; Wang, Q.; Zhu, Y. Attribution analysis based on Budyko hypothesis for land evapotranspiration change in the Loess Plateau, China. J. Arid Land 2019, 11, 939–953. [Google Scholar] [CrossRef] [Green Version]
  25. Cuddington, K.; Fortin, M.-J.; Gerber, L.R.; Hastings, A.; Liebhold, A.; O’Connor, M.; Ray, C. Process-based models are required to manage ecological systems in a changing world. Ecosphere 2013, 4, 1–12. [Google Scholar] [CrossRef]
  26. Zhang, Y.; Chiew, F.H.S.; Liu, C.; Tang, Q.; Xia, J.; Tian, J.; Kong, D.; Li, C. Can Remotely Sensed Actual Evapotranspiration Facilitate Hydrological Prediction in Ungauged Regions Without Runoff Calibration? Water Resour. Res. 2020, 56, e2019WR026236. [Google Scholar] [CrossRef]
  27. Mo, X.; Liu, S.; Chen, X.; Hu, S. Variability, tendencies, and climate controls of terrestrial evapotranspiration and gross primary productivity in the recent decade over China. Ecohydrology 2018, 11, e1951. [Google Scholar] [CrossRef]
  28. Liu, Y.; Mo, X.; Hu, S.; Chen, X.; Liu, S. Attribution analyses of evapotranspiration and gross primary productivity changes in Ziya-Daqing basins, China during 2001–2015. Theor. Appl. Climatol. 2020, 139, 1175–1189. [Google Scholar] [CrossRef]
  29. Kim, D.; Baik, J.; Umair, M.; Choi, M. Water use efficiency in terrestrial ecosystem over East Asia: Effects of climate regimes and land cover types. Sci. Total Environ. 2021, 773, 145519. [Google Scholar] [CrossRef]
  30. Ye, L.; Cheng, L.; Liu, P.; Liu, D.; Zhang, L.; Qin, S.; Xia, J. Management of vegetative land for more water yield under future climate conditions in the over-utilized water resources regions: A case study in the Xiong’an New area. J. Hydrol. 2021, 600, 126563. [Google Scholar] [CrossRef]
  31. Moiwo, J.P.; Yang, Y.; Li, H.; Han, S.; Yang, Y. Impact of water resource exploitation on the hydrology and water storage in Baiyangdian Lake. Hydrol. Process. 2010, 24, 3026–3039. [Google Scholar] [CrossRef]
  32. Hu, S.; Liu, C.; Zheng, H.; Wang, Z.; Yu, J. Assessing the impacts of climate variability and human activities on streamflow in the water source area of Baiyangdian Lake. J. Geogr. Sci. 2012, 22, 895–905. [Google Scholar] [CrossRef]
  33. Wang, H.; Lv, X.; Zhang, M. Sensitivity and attribution analysis of vegetation changes on evapotranspiration with the Budyko framework in the Baiyangdian catchment, China. Ecol. Indic. 2021, 120, 106963. [Google Scholar] [CrossRef]
  34. Xia, J.; Wang, G.; Tan, G.; Ye, A.; Huang, G.H. Development of distributed time-variant gain model for nonlinear hydrological systems. Sci. China Ser. D Earth Sci. 2005, 48, 713–723. [Google Scholar] [CrossRef]
  35. Wang, G.; Xia, J.; Chen, J. Quantification of effects of climate variations and human activities on runoff by a monthly water balance model: A case study of the Chaobai River basin in northern China. Water Resour. Res. 2009, 45, W00A11. [Google Scholar] [CrossRef] [Green Version]
  36. Zhan, C.; Song, X.; Xia, J.; Tong, C. An efficient integrated approach for global sensitivity analysis of hydrological model parameters. Environ. Model. Softw. 2013, 41, 39–52. [Google Scholar] [CrossRef]
  37. Zeng, S.; Xia, J.; Chen, X.; Zou, L.; Du, H.; She, D. Integrated land-surface hydrological and biogeochemical processes in simulating water, energy and carbon fluxes over two different ecosystems. J. Hydrol. 2020, 582, 124390. [Google Scholar] [CrossRef]
  38. Chen, J.; Liu, J.; Cihlar, J.; Goulden, M. Daily canopy photosynthesis model through temporal and spatial scaling for remote sensing applications. Ecol. Model. 1999, 124, 99–119. [Google Scholar] [CrossRef] [Green Version]
  39. Cheng, L.; Zhang, L.; Wang, Y.-P.; Yu, Q.; Eamus, D.; O’Grady, A. Impacts of elevated CO2, climate change and their interactions on water budgets in four different catchments in Australia. J. Hydrol. 2014, 519, 1350–1361. [Google Scholar] [CrossRef]
  40. Mann, H.B. Nonparametric Tests against Trend. Econometrica 1945, 13, 245. [Google Scholar] [CrossRef]
  41. Kendall, M.G. Rank Correlation Methods; Griffin: London, UK, 1975. [Google Scholar]
  42. Martens, B.; Miralles, D.G.; Lievens, H.; van der Schalie, R.; de Jeu, R.A.M.; Fernández-Prieto, D.; Beck, H.E.; Dorigo, W.A.; Verhoest, N.E.C. GLEAM v3: Satellite-based land evaporation and root-zone soil moisture. Geosci. Model Dev. 2017, 10, 1903–1925. [Google Scholar] [CrossRef] [Green Version]
  43. Turner, D.P.; Ritts, W.D.; Cohen, W.B.; Gower, S.T.; Running, S.W.; Zhao, M.; Costa, M.H.; Kirschbaum, A.A.; Ham, J.M.; Saleska, S.R.; et al. Evaluation of MODIS NPP and GPP products across multiple biomes. Remote Sens. Environ. 2006, 102, 282–292. [Google Scholar] [CrossRef]
  44. Propastin, P.; Ibrom, A.; Knohl, A.; Erasmi, S. Effects of canopy photosynthesis saturation on the estimation of gross primary productivity from MODIS data in a tropical forest. Remote Sens. Environ. 2012, 121, 252–260. [Google Scholar] [CrossRef]
  45. Shim, C.; Hong, J.; Hong, J.; Kim, Y.; Kang, M.; Malla Thakuri, B.; Kim, Y.; Chun, J. Evaluation of MODIS GPP over a complex ecosystem in East Asia: A case study at Gwangneung flux tower in Korea. Adv. Space Res. 2014, 54, 2296–2308. [Google Scholar] [CrossRef] [Green Version]
  46. Ma, J.; Xiao, X.; Miao, R.; Li, Y.; Chen, B.; Zhang, Y.; Zhao, B. Trends and controls of terrestrial gross primary productivity of China during 2000–2016. Environ. Res. Lett. 2019, 14, 84032. [Google Scholar] [CrossRef] [Green Version]
  47. Yang, D.; Sun, F.; Liu, Z.; Cong, Z.; Lei, Z. Interpreting the complementary relationship in non-humid environments based on the Budyko and Penman hypotheses. Geophys. Res. Lett. 2006, 33, L18402. [Google Scholar] [CrossRef]
  48. Moiwo, J.P.; Tao, F. Contributions of precipitation, irrigation and soil water to evapotranspiration in (semi)-arid regions. Int. J. Climatol. 2015, 35, 1079–1089. [Google Scholar] [CrossRef]
  49. Helbig, M.; Waddington, J.M.; Alekseychik, P.; Amiro, B.D.; Aurela, M.; Barr, A.G.; Black, T.A.; Blanken, P.D.; Carey, S.K.; Chen, J.; et al. Increasing contribution of peatlands to boreal evapotranspiration in a warming climate. Nat. Clim. Chang. 2020, 10, 555–560. [Google Scholar] [CrossRef]
  50. Jarvis, A.J.; Mansfield, T.A.; Davies, W.J. Stomatal behaviour, photosynthesis and transpiration under rising CO2. Plant Cell Environ. 1999, 22, 639–648. [Google Scholar] [CrossRef]
  51. Sun, Z.; Wang, X.; Yamamoto, H.; Tani, H.; Zhong, G.; Yin, S.; Guo, E. Spatial pattern of GPP variations in terrestrial ecosystems and its drivers: Climatic factors, CO2 concentration and land-cover change, 1982–2015. Ecol. Inform. 2018, 46, 156–165. [Google Scholar] [CrossRef]
  52. Chen, Z.; Yu, G.; Ge, J.; Sun, X.; Hirano, T.; Saigusa, N.; Wang, Q.; Zhu, X.; Zhang, Y.; Zhang, J.; et al. Temperature and precipitation control of the spatial variation of terrestrial ecosystem carbon exchange in the Asian region. Agric. For. Meteorol. 2013, 182–183, 266–276. [Google Scholar] [CrossRef]
  53. Yuan, W.; Zheng, Y.; Piao, S.; Ciais, P.; Lombardozzi, D.; Wang, Y.; Ryu, Y.; Chen, G.; Dong, W.; Hu, Z.; et al. Increased atmospheric vapor pressure deficit reduces global vegetation growth. Sci. Adv. 2019, 5, eaax1396. [Google Scholar] [CrossRef] [PubMed] [Green Version]
  54. Yan, H.; Wang, S.Q.; Wang, J.B.; Shugart, H.H. Changes of Light Components and Impacts on Interannual Variations of Photosynthesis in China Over 2000–2017 by Using a Two-Leaf Light Use Efficiency Model. J. Geophys. Res. Biogeosci. 2020, 125, e2020JG005735. [Google Scholar] [CrossRef]
  55. Hu, L.; Fan, W.; Ren, H.; Liu, S.; Cui, Y.; Zhao, P. Spatiotemporal Dynamics in Vegetation GPP over the Great Khingan Mountains Using GLASS Products from 1982 to 2015. Remote Sens. 2018, 10, 488. [Google Scholar] [CrossRef] [Green Version]
  56. Eamus, D.; Hatton, T.; Cook, P.; Colvin, C. Ecohydrology; CSIRO Publishing: Clayton, Australia, 2006; ISBN 9780643094093. [Google Scholar]
  57. Zscheischler, J.; Fischer, E.M. The record-breaking compound hot and dry 2018 growing season in Germany. Weather Clim. Extrem. 2020, 29, 100270. [Google Scholar] [CrossRef]
  58. Li, J.; Wang, Z.; Wu, X.; Zscheischler, J.; Guo, S.; Chen, X. A standardized index for assessing sub-monthly compound dry and hot conditions with application in China. Hydrol. Earth Syst. Sci. 2021, 25, 1587–1601. [Google Scholar] [CrossRef]
  59. Li, W.; Pan, R.; Jiang, Z.; Chen, Y.; Li, L.; Luo, J.-J.; Zhai, P.; Shen, Y.; Yu, J. Future changes in the frequency of extreme droughts over China based on two large ensemble simulations. J. Clim. 2021, 1, 6023–6025. [Google Scholar] [CrossRef]
  60. Klein, T.; Yakir, D.; Buchmann, N.; Grünzweig, J.M. Towards an advanced assessment of the hydrological vulnerability of forests to climate change-induced drought. New Phytol. 2014, 201, 712–716. [Google Scholar] [CrossRef]
  61. Chen, S.; Huang, Y.; Wang, G. Detecting drought-induced GPP spatiotemporal variabilities with sun-induced chlorophyll fluorescence during the 2009/2010 droughts in China. Ecol. Indic. 2021, 121, 107092. [Google Scholar] [CrossRef]
Figure 1. The location of the water source area of the Xiong’an New Area in North China.
Remotesensing 14 01187 g001
Figure 2. The major calculation procedure of the simulation.
Remotesensing 14 01187 g002
Figure 3. Comparison of seasonal dynamics between DTVGM simulated and MODIS ET in the six catchments BGC (a), JMC (b), BSC (c), THC (d), DSC (e), CHC (f).
Remotesensing 14 01187 g003
Figure 4. Comparison of seasonal dynamics between DTVGM simulated and MODIS GPP in the six catchments BGC (a), JMC (b), BSC (c), THC (d), DSC (e), CHC (f).
Remotesensing 14 01187 g004
Figure 5. Comparison of the MODIS and simulated annual ET (a) and GPP (b) by DTVGM and the simulated annual ET by DTVGM with MODIS and GLEAM (c). The dashed line indicates the 1:1 line and the black line is the least-squares linear fit to the data.
Remotesensing 14 01187 g005
Figure 6. Mann–Kendall trends in the climate variables in the six catchments.
Remotesensing 14 01187 g006
Figure 7. Land use and cover change in the six catchments(af).
Remotesensing 14 01187 g007
Figure 8. Annual changes in ET in the six catchments (af).
Remotesensing 14 01187 g008
Figure 9. Annual changes in GPP in the six catchments(af).
Remotesensing 14 01187 g009
Figure 10. Monthly changes in ET (a) and GPP (b) in the six catchments and mean seasonal changes (c) in the water source region of the Xiong’an New Area.
Remotesensing 14 01187 g010
Figure 11. Attributions of monthly ET changes in the six catchments.
Remotesensing 14 01187 g011
Figure 12. Mean attributions of seasonal ET and GPP changes in the water source region of the Xiong’an New Area (a,b).
Remotesensing 14 01187 g012
Figure 13. Attributions of monthly GPP changes in the six catchments.
Remotesensing 14 01187 g013
Table 1. The area and dominant land cover of the six catchments in the study area.
CatchmentDominant Land CoverArea (km2)
ForestGrasslandCropland
Baigouhe83%9%2%641.17
Jumahe64%22%10%4801.27
Baishahe36%49%10%493.67
Tanghe22%50%21%4257.41
Dashahe32%55%7%3688.61
Cihe47%38%8%483.51
Table 2. Details of the ten experimental scenarios settings.
ScenariosScenario NameDescriptions
S0BaselineAll the driving factors including historical meteorological variables, CO2 and land coverage are used to drive the model.
S1Atmospheric pressure-detrendThe atmospheric pressure is detrended using historical records.
S2Temperature-detrendThe temperature is detrended using historical records.
S3Humidity-detrendThe relative humidity is detrended using historical records.
S4Precipitation-detrendThe precipitation is detrended using historical records.
S5Windspeed-detrendThe windspeed is detrended using historical records.
S6Solar radiation-detrendThe sunshine duration is detrended using historical records.
S7Carbon dioxide-detrendThe carbon dioxide is detrended using historical records.
S8Land use and cover changesThe land use is set at 2000 using historical records.
S9All-detrend and no land use changeAll the meteorological variables and CO2 are detrended and the land use is set at 2000.
Table 3. Model performance in monthly ET and GPP simulation comparing to MODIS data.
CatchmentETGPP
RErRMSE (mm)RErRMSE
(g C/m2)
BGC0.6%0.800.626.1%0.861.20
JMC5.9%0.790.677.9%0.941.17
BSC5.9%0.730.6717.8%0.901.24
THC6.0%0.660.604.3%0.930.91
DSC3.5%0.740.5910.1%0.950.90
CHC6.8%0.760.6111.0%0.941.01
Table 4. Annual changes of the climate variables and CO2 in the six catchments.
CatchmentAtmospheric PressureTemperatureHumidityPrecipitationWindspeedSunshine DurationCO2
Slope
(kP/a)
ZcSlope
(°C/a)
ZcSlope
(%/a)
ZcSlope
(mm/a)
ZcSlope
(m/s/a)
ZcSlope
(hour/a)
ZcSlope
(ppmv/a)
Zc
BGC−0.01−1.30.010.75−0.13−1.2710.512.37 ***−0.01−2.11 **0.010.292.246.13 ***
JMC−0.01−1.20.021.27−0.08−0.687.542.24 **0.00−0.68−0.01−1.332.246.13 ***
BSC0.000.88−0.04−1.72 *0.201.5211.152.17 **0.010.36−0.05−2.89 ***2.246.13 ***
THC0.000.230.031.78 *−0.25−2.24 **5.361.520.000.1−0.02−1.142.246.13 ***
DSC0.000.750.041.98 **−0.27−2.43 ***8.442.43 ***−0.01−1.98 **−0.02−1.332.246.13 ***
CHC0.001.40.031.4−0.12−0.8811.982.37 ***−0.03−2.43 ***−0.04−2.76 ***2.246.13 ***
In a two-side test, when Zc < −Z1−α/2, it indicates a decreasing trend, and when Zc > Z1−α/2 it indicates an increasing trend, α is the significance level. In this study, α was set to be 0.01, 0.05 and 0.1 indicating the changing trend is extreme strong, strong and obvious, respectively. The corresponding value of Z1-α/2 is 2.32, 1.96 and 1.64 for the three levels, respectively, while the value was below 1.64, indicating no obvious changing trend. ***, ** and * indicate significance levels of 0.01, 0.05 and 0.1, respectively.
Table 5. Trends of land use and cover change in the six catchments.
CatchmentCroplandForestGrasslandWater Urban
Slope
(km2/a)
ZcSlope
(km2/a)
ZcSlope
(km2/a)
ZcSlope
(km2/a)
ZcSlope
(km2/a)
Zc
BGC0.000.000.040.750.000.000.000.00−0.04−0.75
JMC−0.52−2.00 **−0.56−2.00 **−0.10−1.000.000.001.182.00 **
BSC0.000.000.000.000.000.000.000.000.000.00
THC−1.00−1.500.321.50−1.18−1.25−0.080.001.942.25 **
DSC0.280.600.340.70−3.76−2.00 **−0.04−0.753.182.00 **
CHC0.000.00−0.44−0.75−0.12−1.500.000.000.561.50
** indicate significance levels of 0.05.
Table 6. Annual changes of the ET and GPP in the six catchments.
CatchmentETGPP
Annual ET (mm)Slope (mm/a)ZcAnnual GPP (gC/m2)Slope (gC/m2/a)Zc
BGC506.646.923.15 ***861.4514.303.15 ***
JMC516.663.493.15 ***802.877.734.51 ***
BSC460.440.440.55820.696.413.28 ***
THC390.011.592.30 **562.554.254.32 ***
DSC415.011.542.37 ***675.004.384.25 ***
CHC398.591.201.14818.465.283.21 ***
Mean446.672.402.50 ***702.576.004.24 ***
*** and ** indicate significance levels of 0.01, 0.05, respectively.
Table 7. Attributions of annual ET changes in the six catchments.
CatchmentAtmospheric PressureTemperatureHumidityPrecipitationWindspeedSunshine DurationCO2LUCCInteract
BGC3.5%10.5%0.4%90.7%7.9%−0.8%−5.2%0.2%−7.2%
JMC−4.3%19.4%−7.4%106.0%−7.9%−16.0%−10.8%−0.3%21.2%
BSC0.9%−5.0%−12.8%164.1%−0.9%−42.5%−2.9%0.0%−0.8%
THC−0.2%8.5%8.9%104.9%0.5%−10.2%−6.4%−0.1%−5.9%
DSC−0.1%11.8%9.2%97.5%4.7%−7.5%−4.1%−0.1%−11.5%
CHC0.2%13.0%−3.0%104.3%4.7%−17.2%−9.7%−0.6%8.4%
Mean−1.3%12.8%2.0%104.8%−0.8%−12.4%−7.2%−0.2%2.3%
Table 8. Attributions of annual GPP changes.
CatchmentAtmospheric PressureTemperatureHumidityPrecipitationWindspeedSunshine DurationCO2LUCCInteract
BGC4.9%15.9%−6.3%57.7%6.1%−4.8%25.3%0.3%0.8%
JMC−8.1%26.3%−13.7%49.8%−15.2%−11.2%33.1%−0.6%39.5%
BSC3.7%−9.2%35.4%20.9%4.9%−39.5%108.3%0.0%−24.4%
THC−0.4%21.3%−5.2%31.3%−1.2%0.4%66.2%−0.5%−11.9%
DSC0.0%41.9%1.2%22.5%5.5%−3.4%73.8%−1.9%−39.7%
CHC1.1%45.7%2.0%−6.6%1.0%−21.3%66.8%−4.9%16.1%
Mean−2.4%27.8%−4.8%34.8%−3.5%−6.8%56.7%−1.0%−0.8%
Publisher’s Note: MDPI stays neutral with regard to jurisdictional claims in published maps and institutional affiliations.

