
Estimating Long-Term Average Carbon Emissions from Fires in Non-Forest Ecosystems in the Temperate Belt


Abstract
:
1. Introduction
2. Materials and Methods
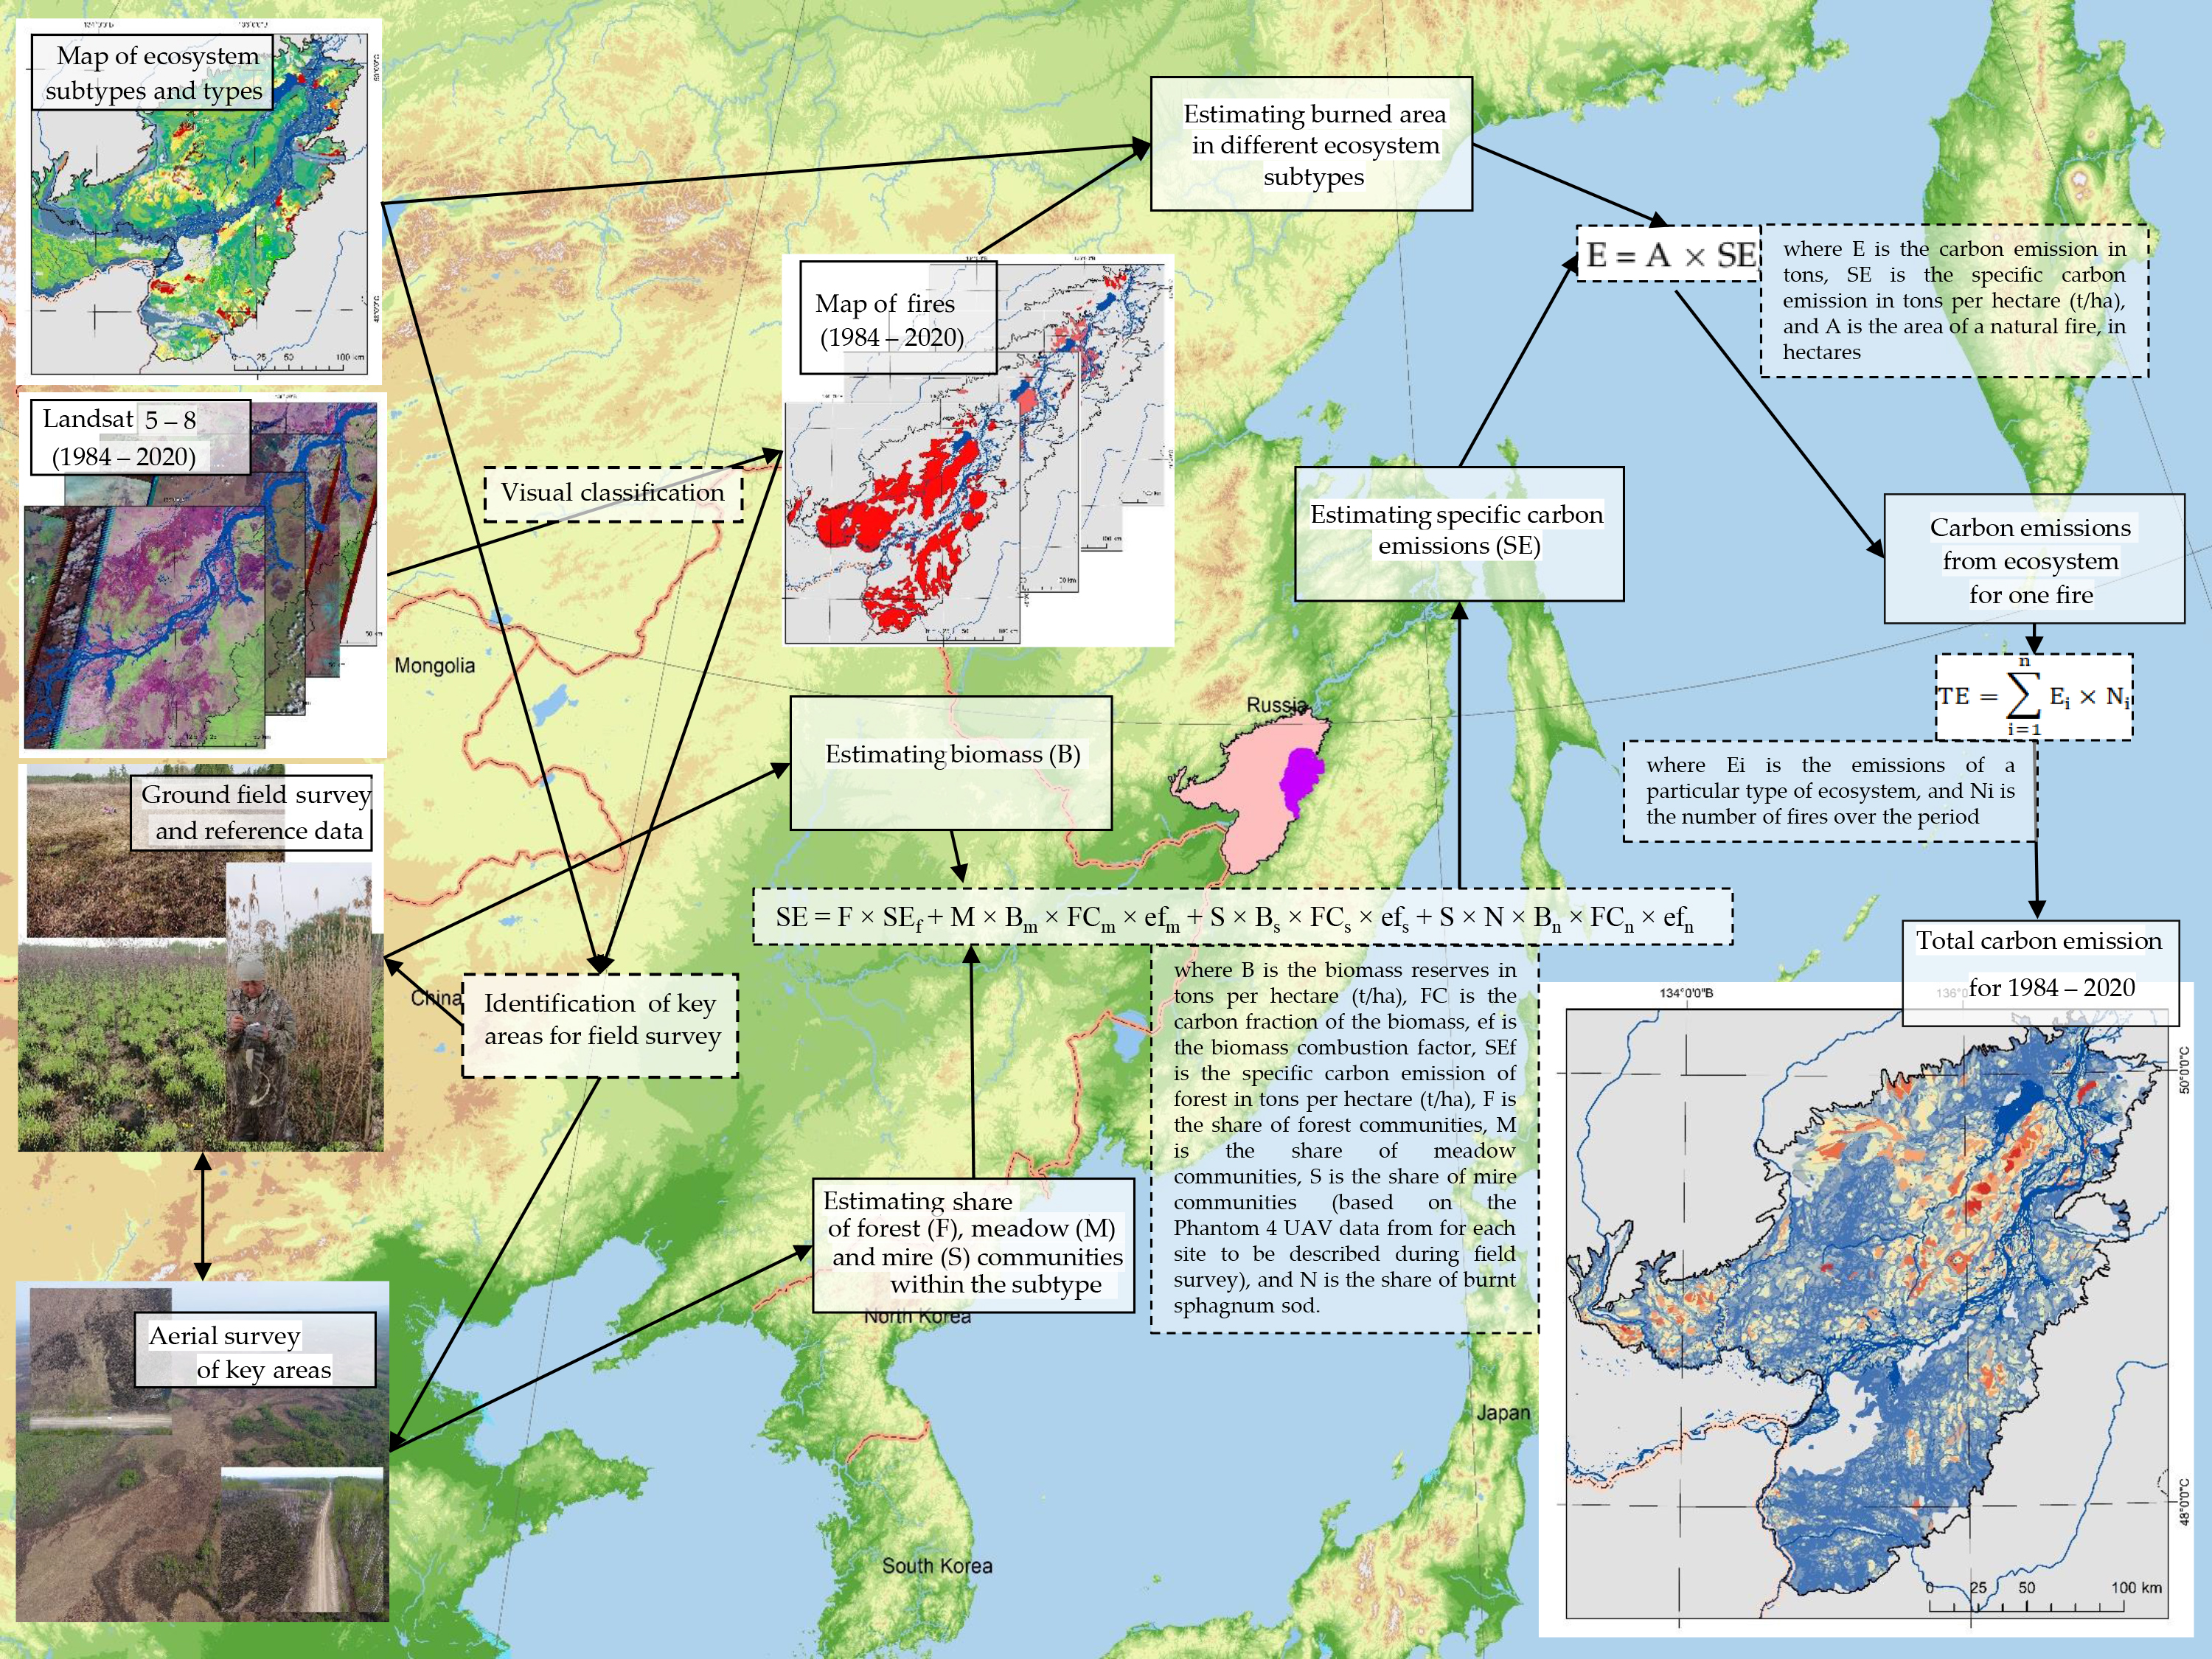
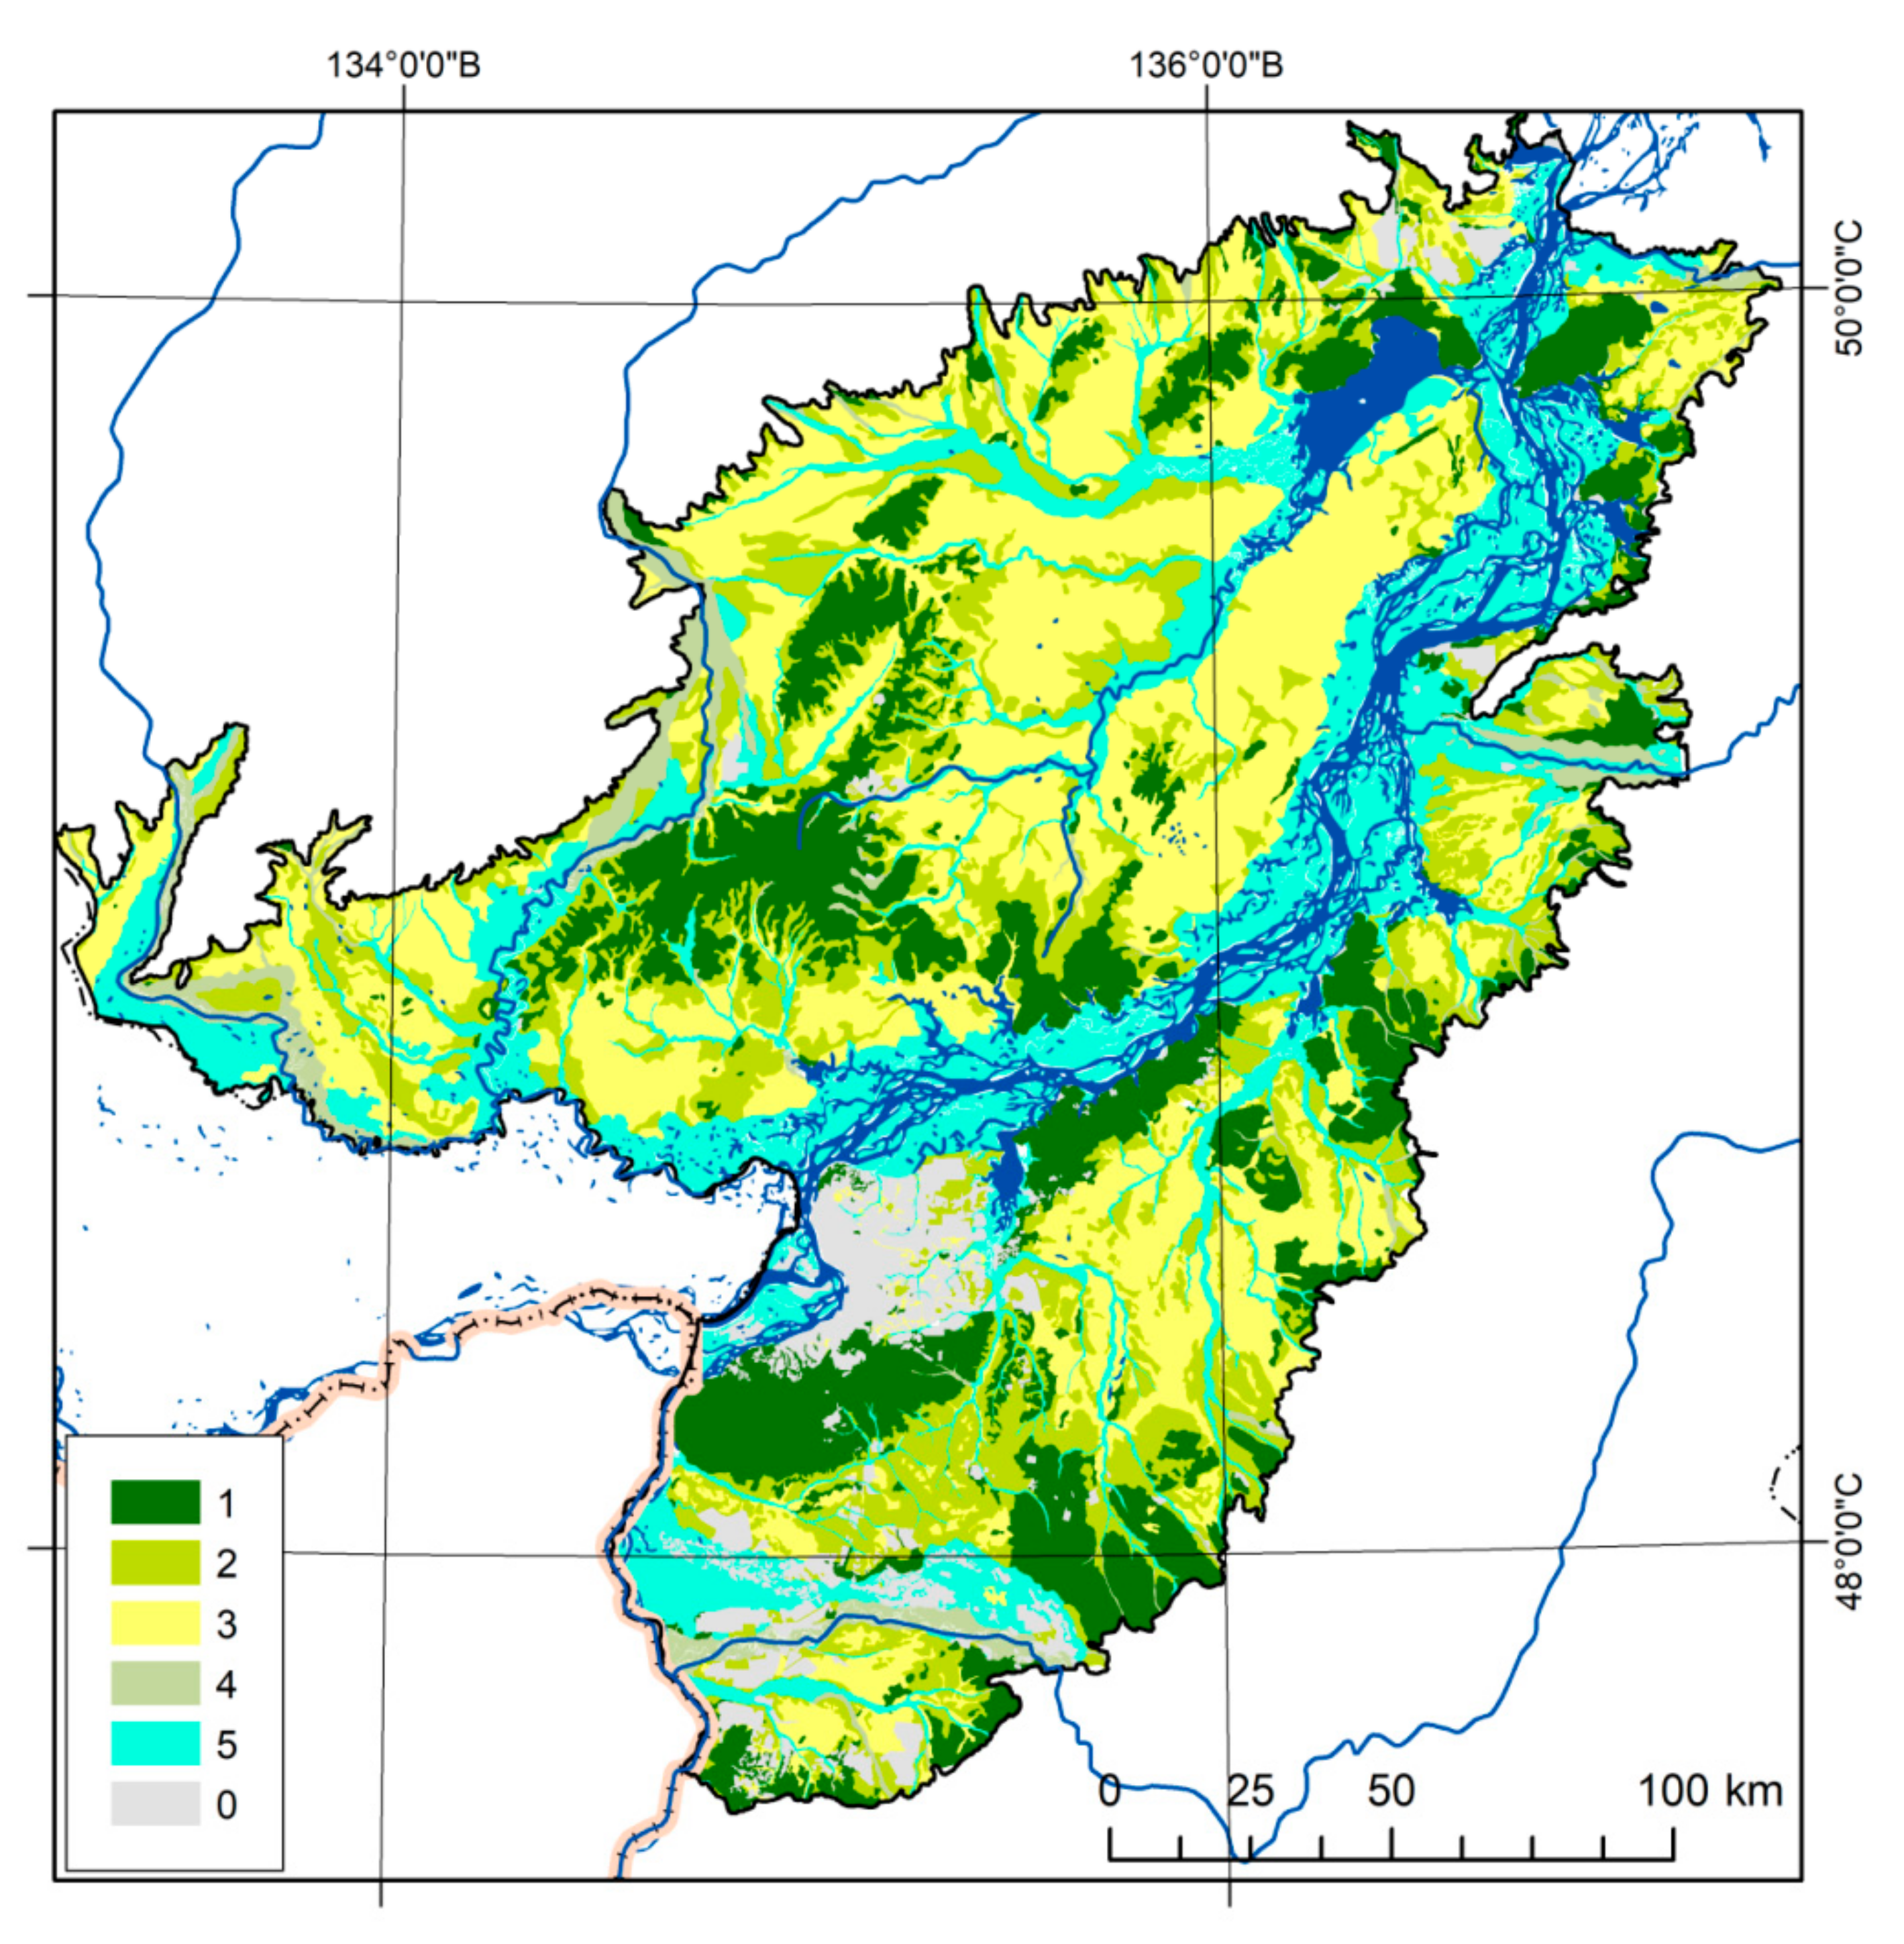
2.1. Characteristics of the Study Area
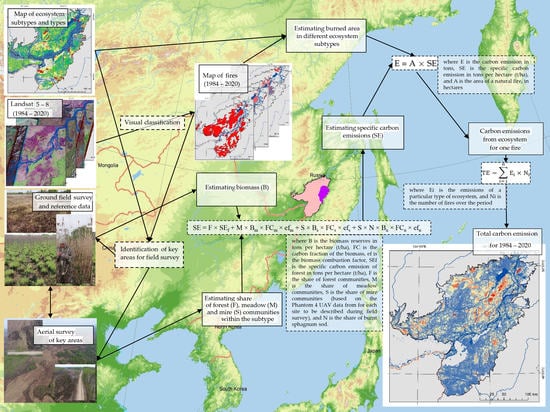
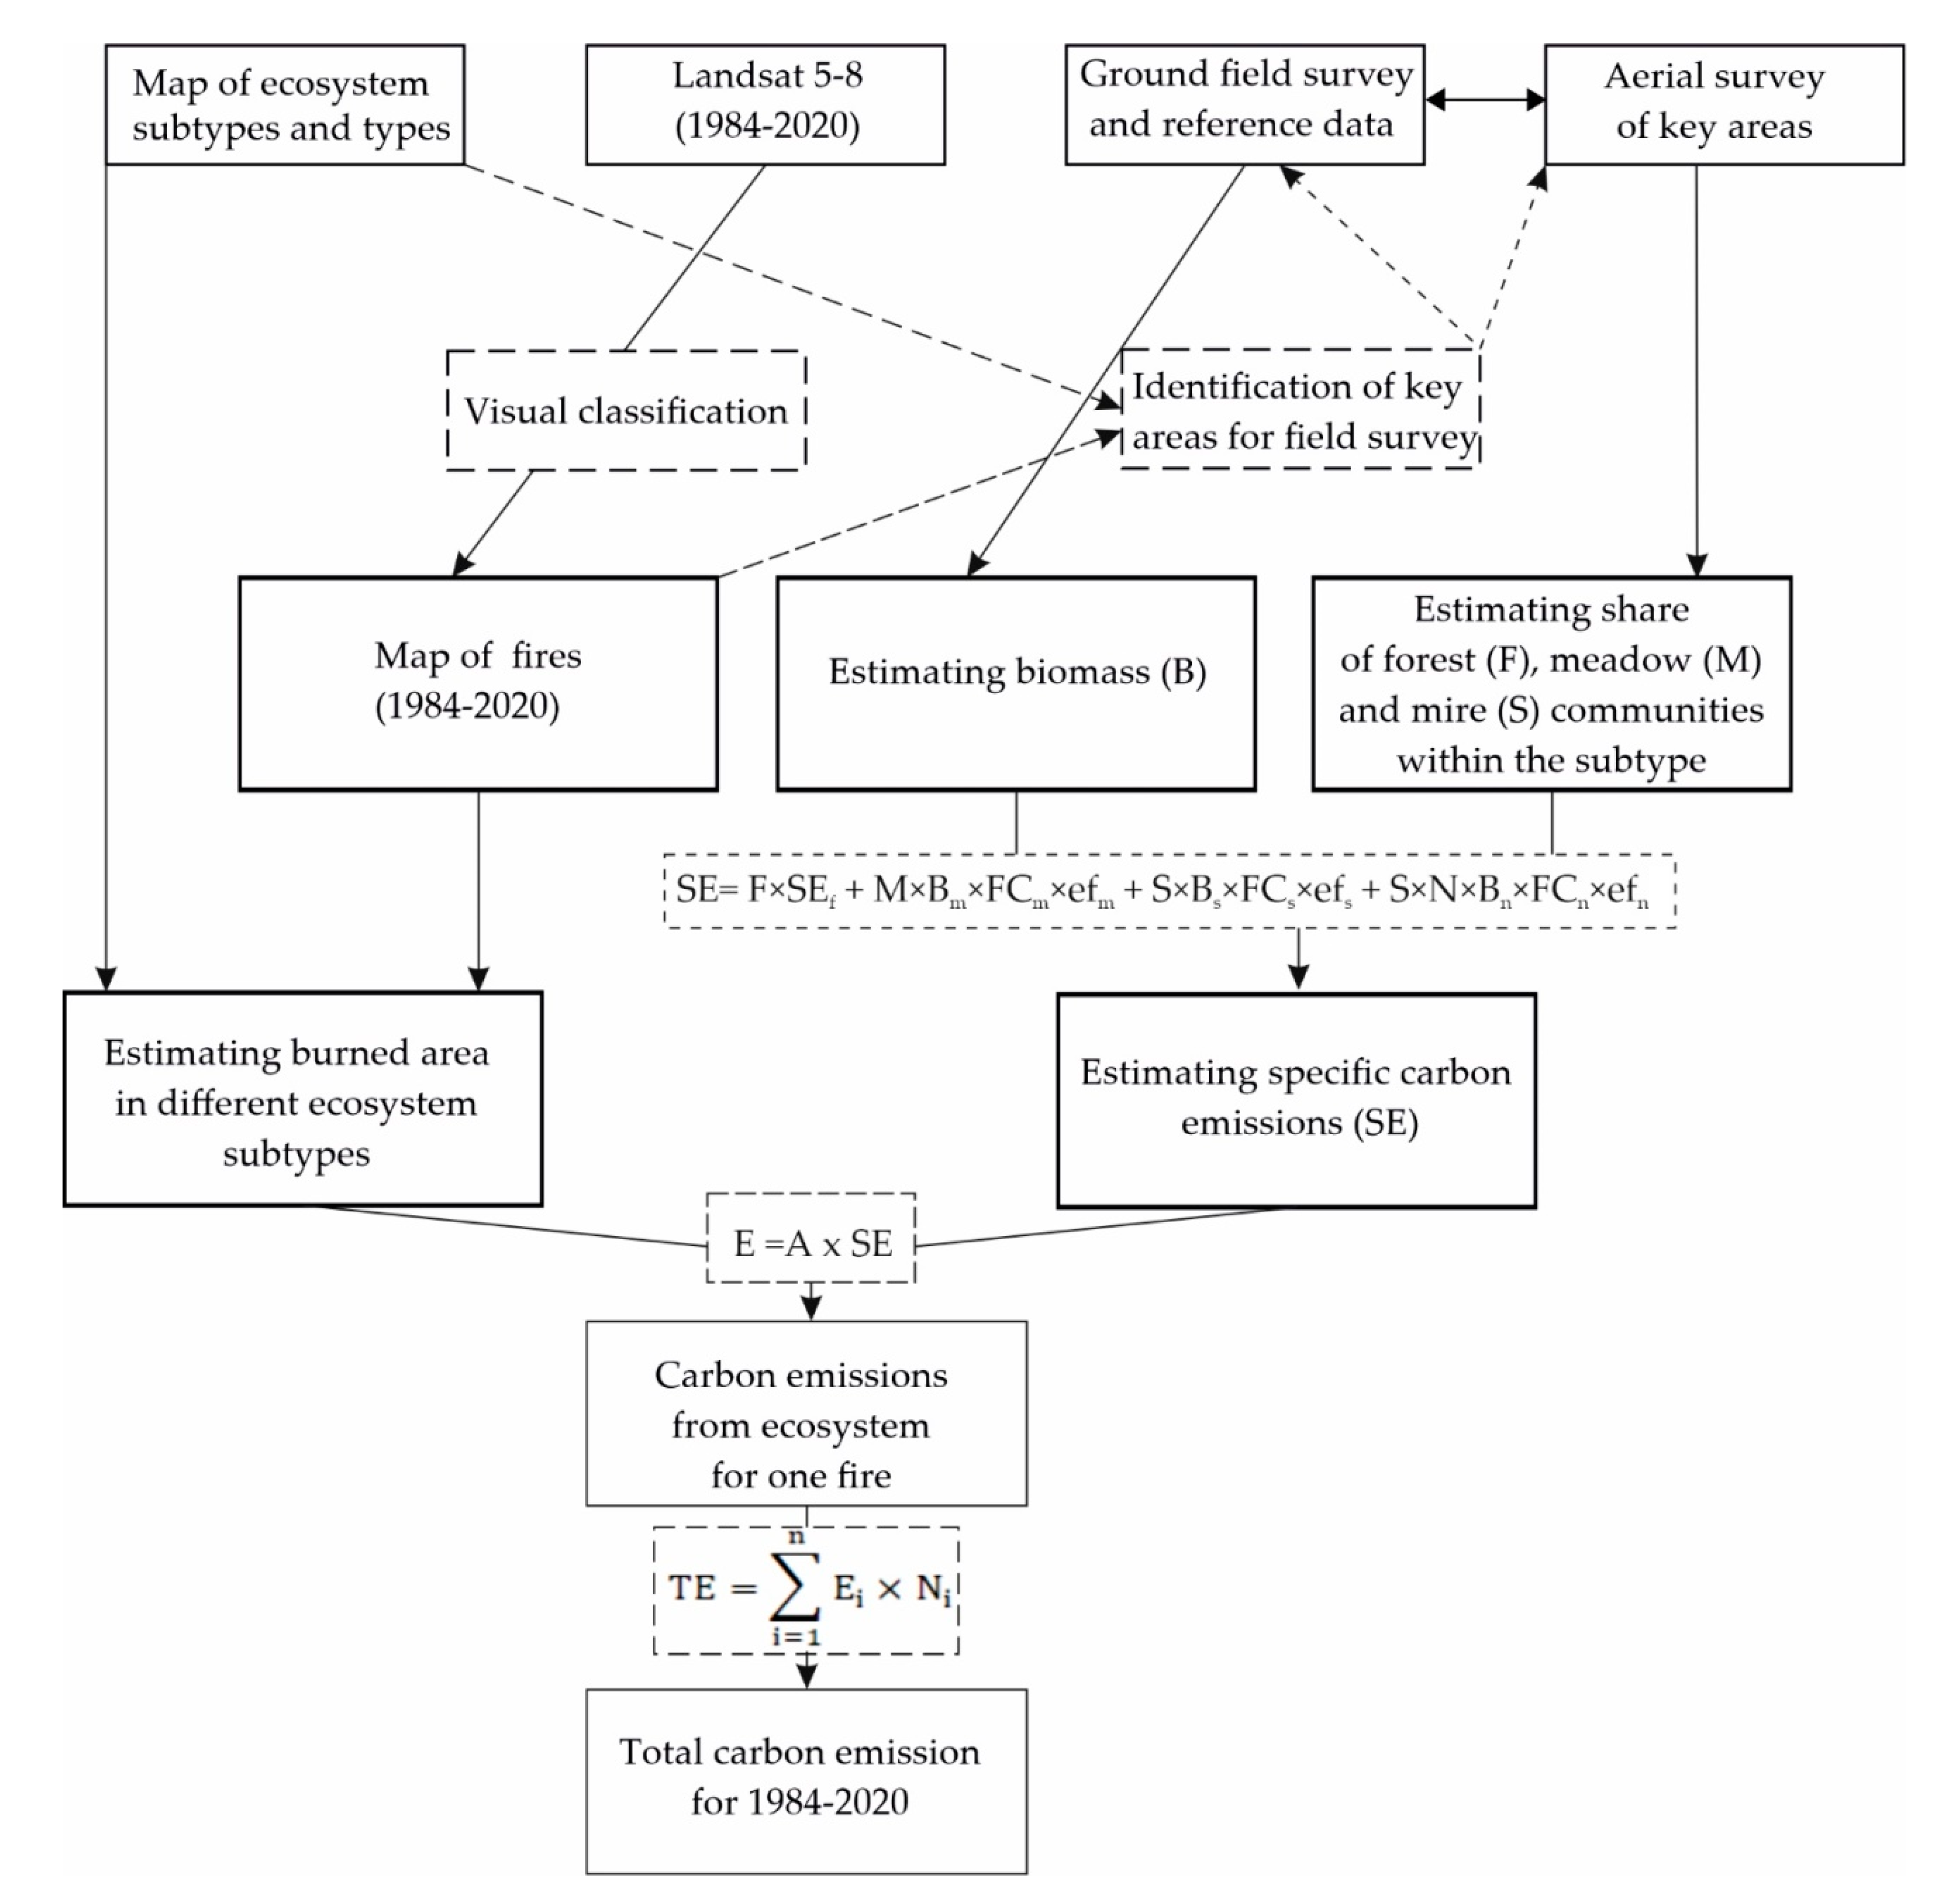
2.2. Estimating Carbon Emissions
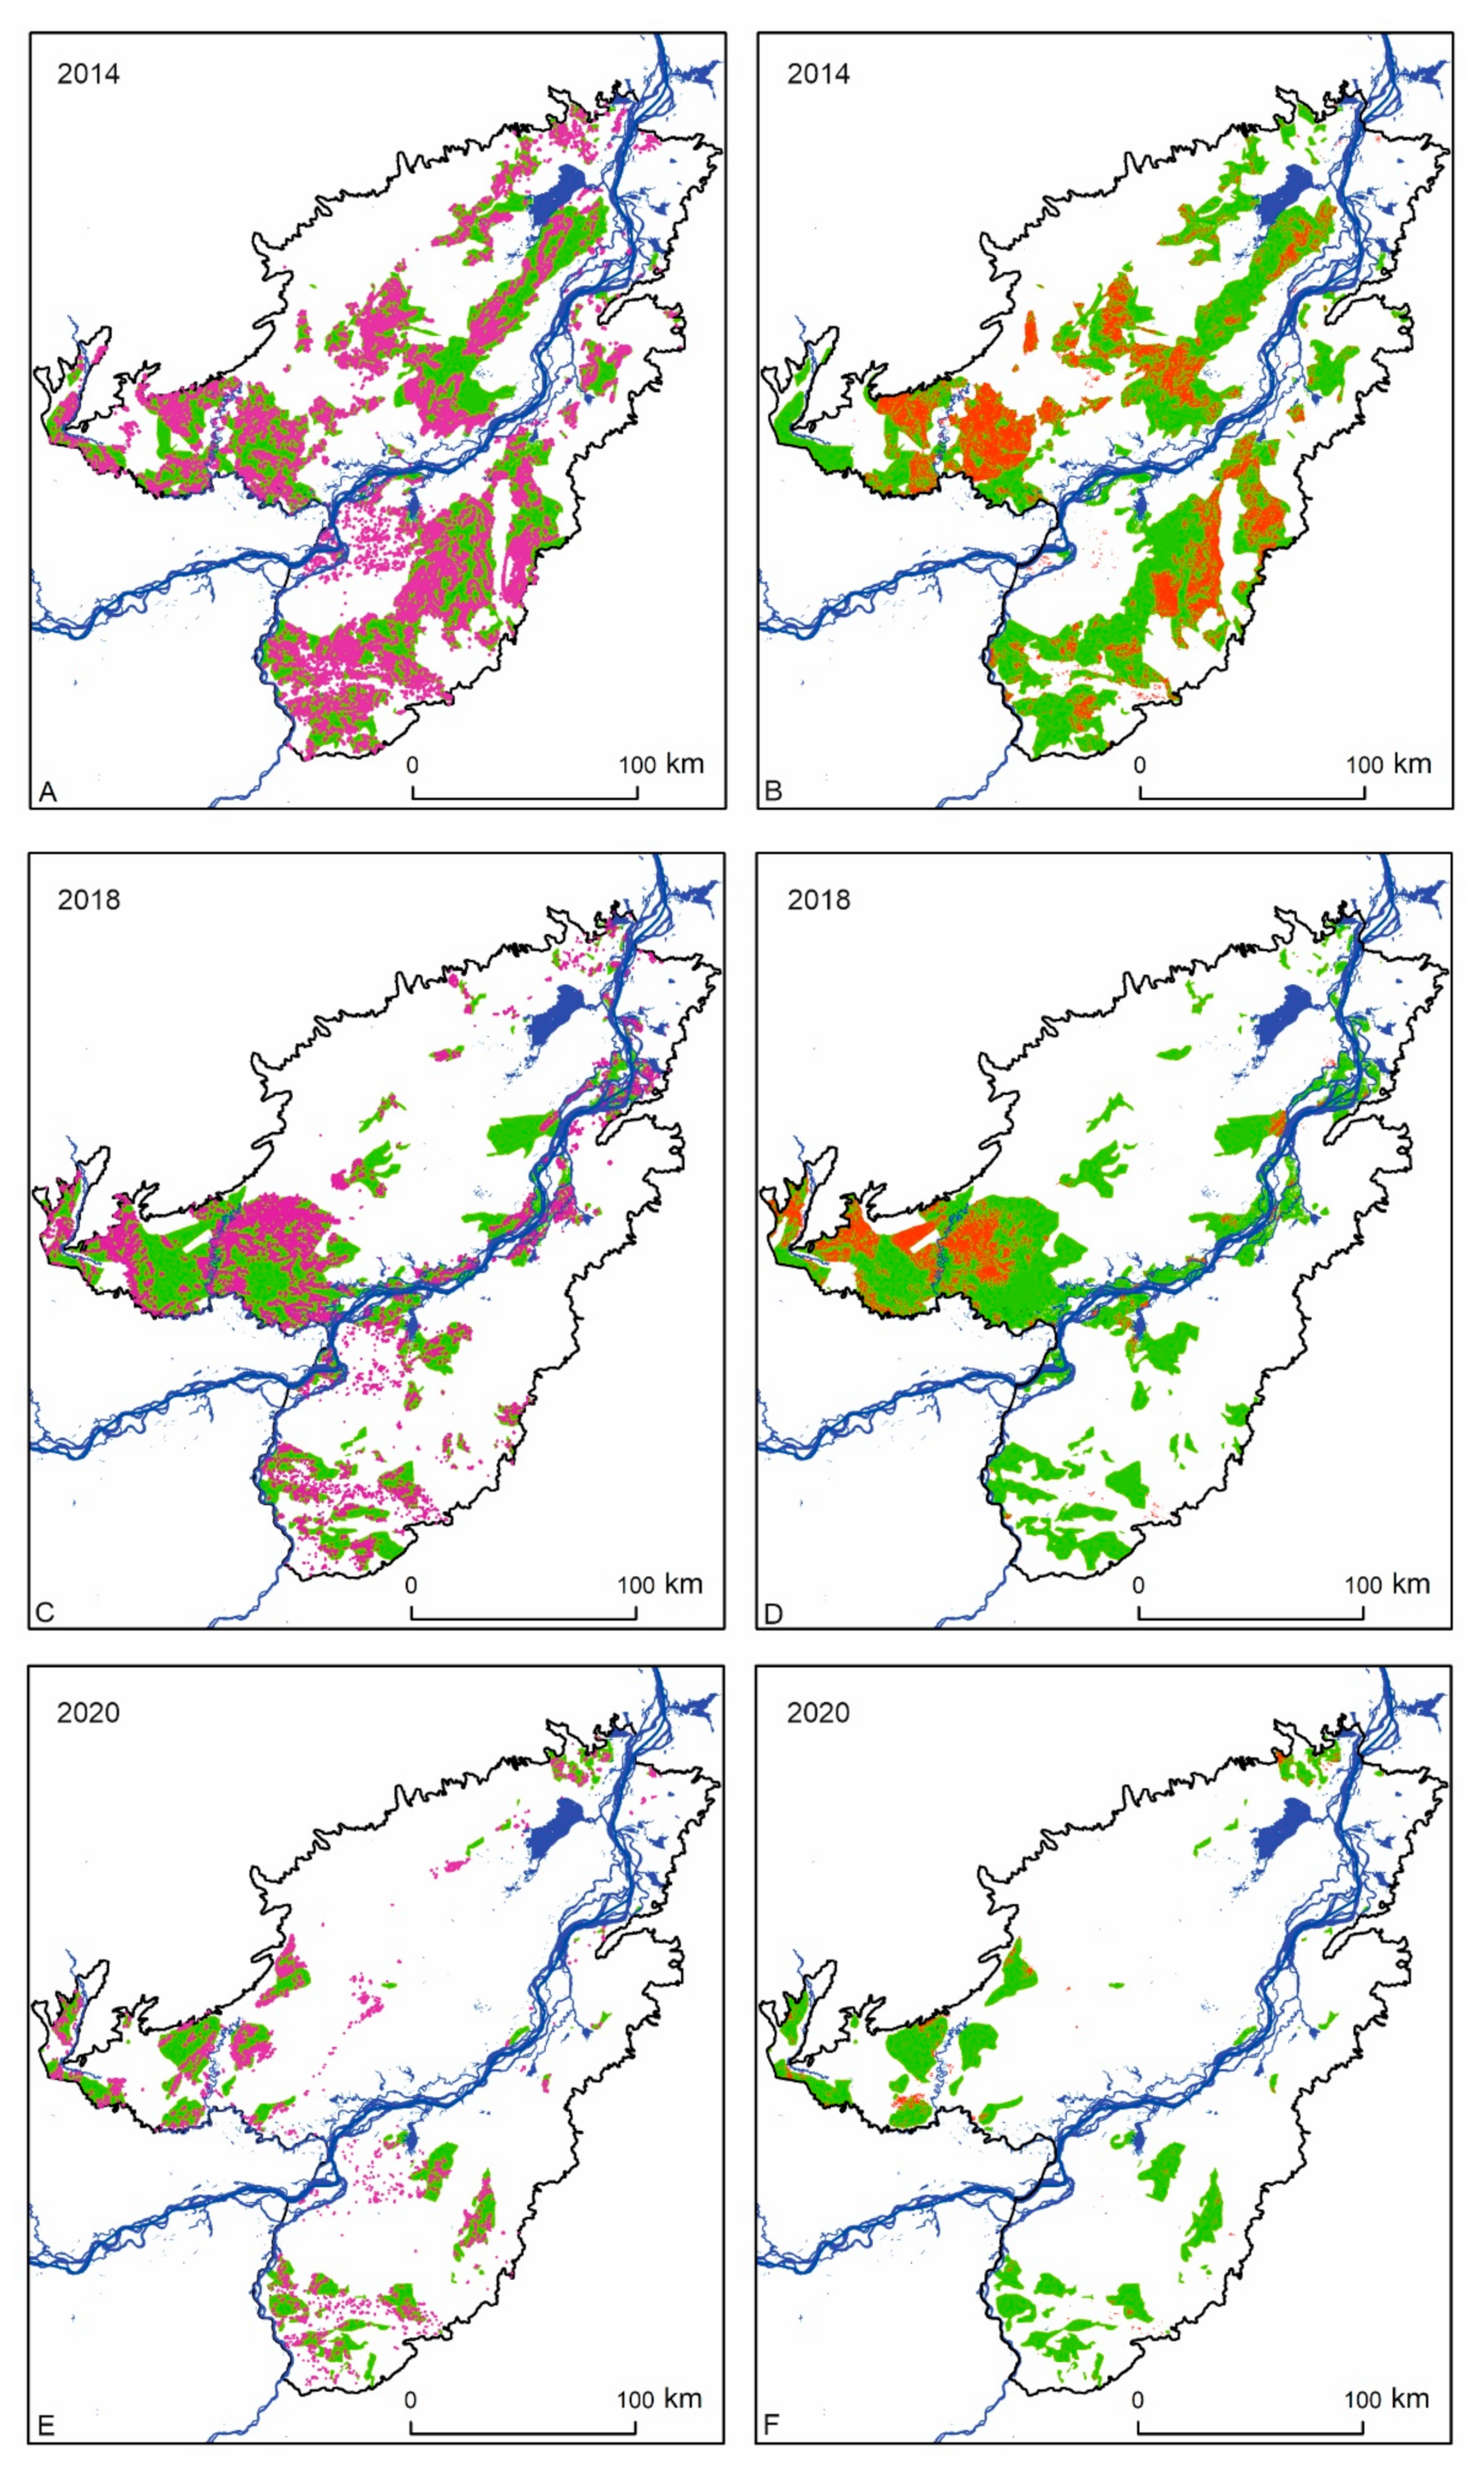
2.3. Estimating the Burned Area
3. Results
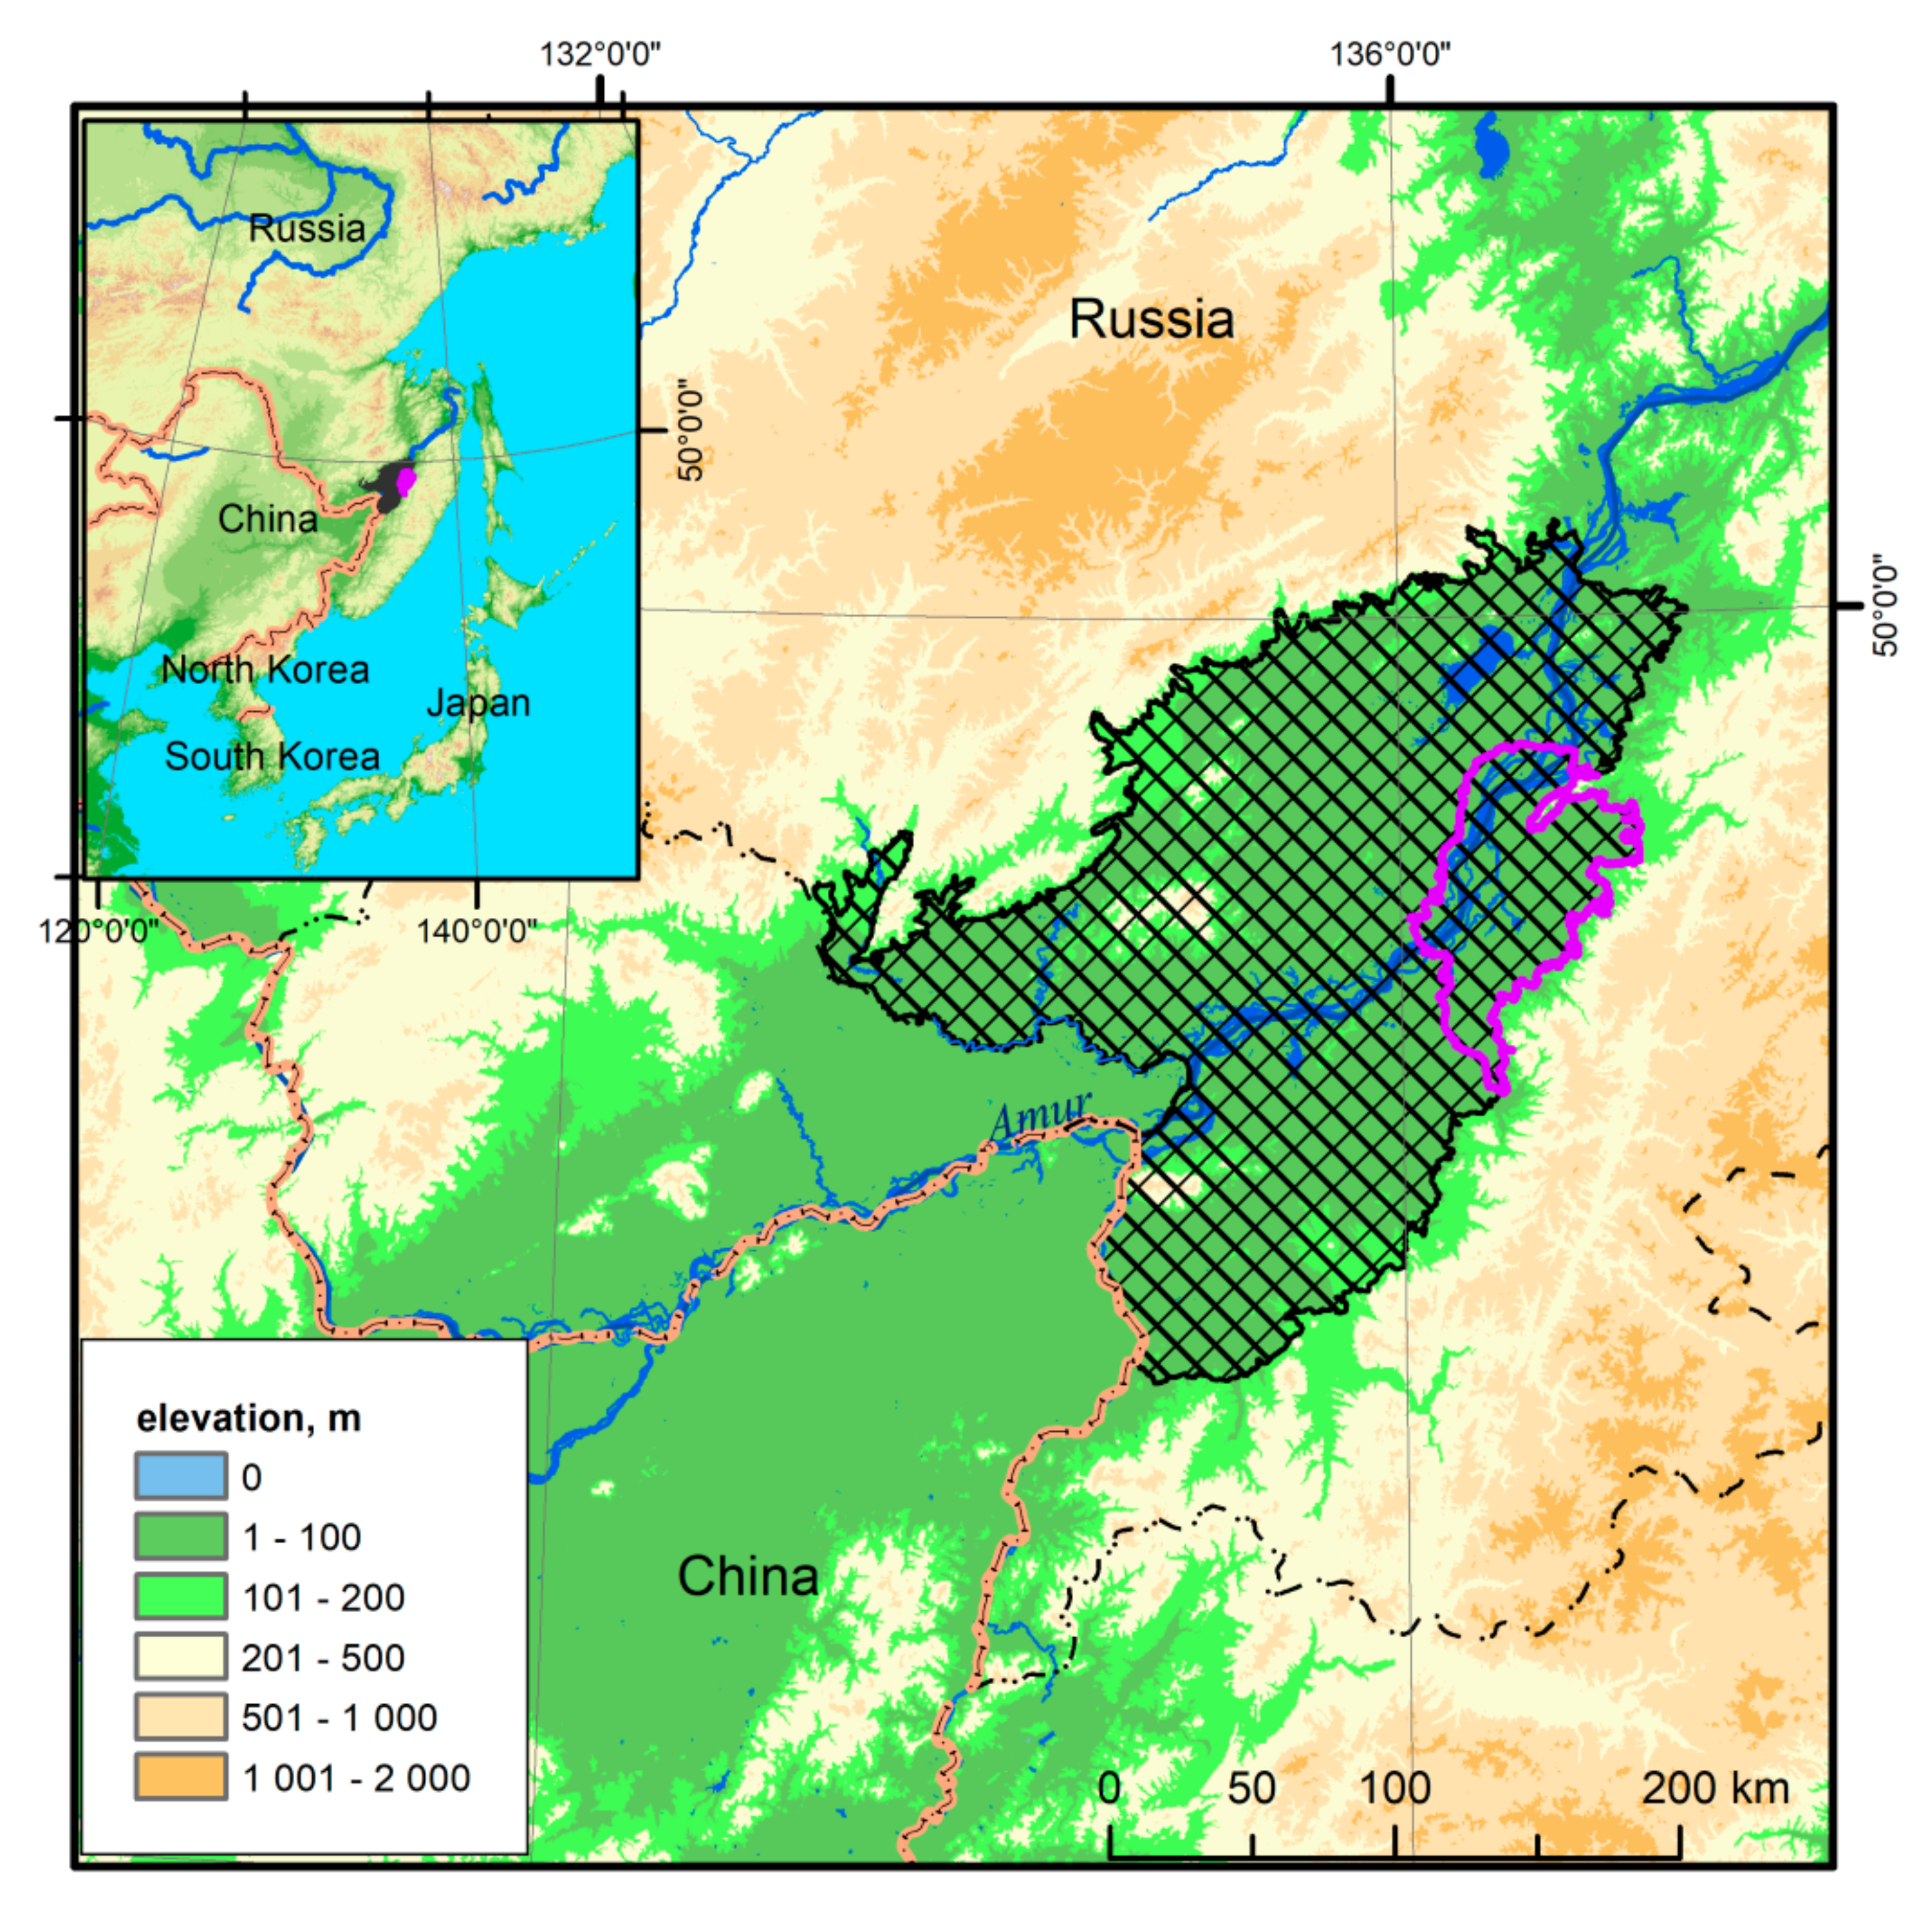
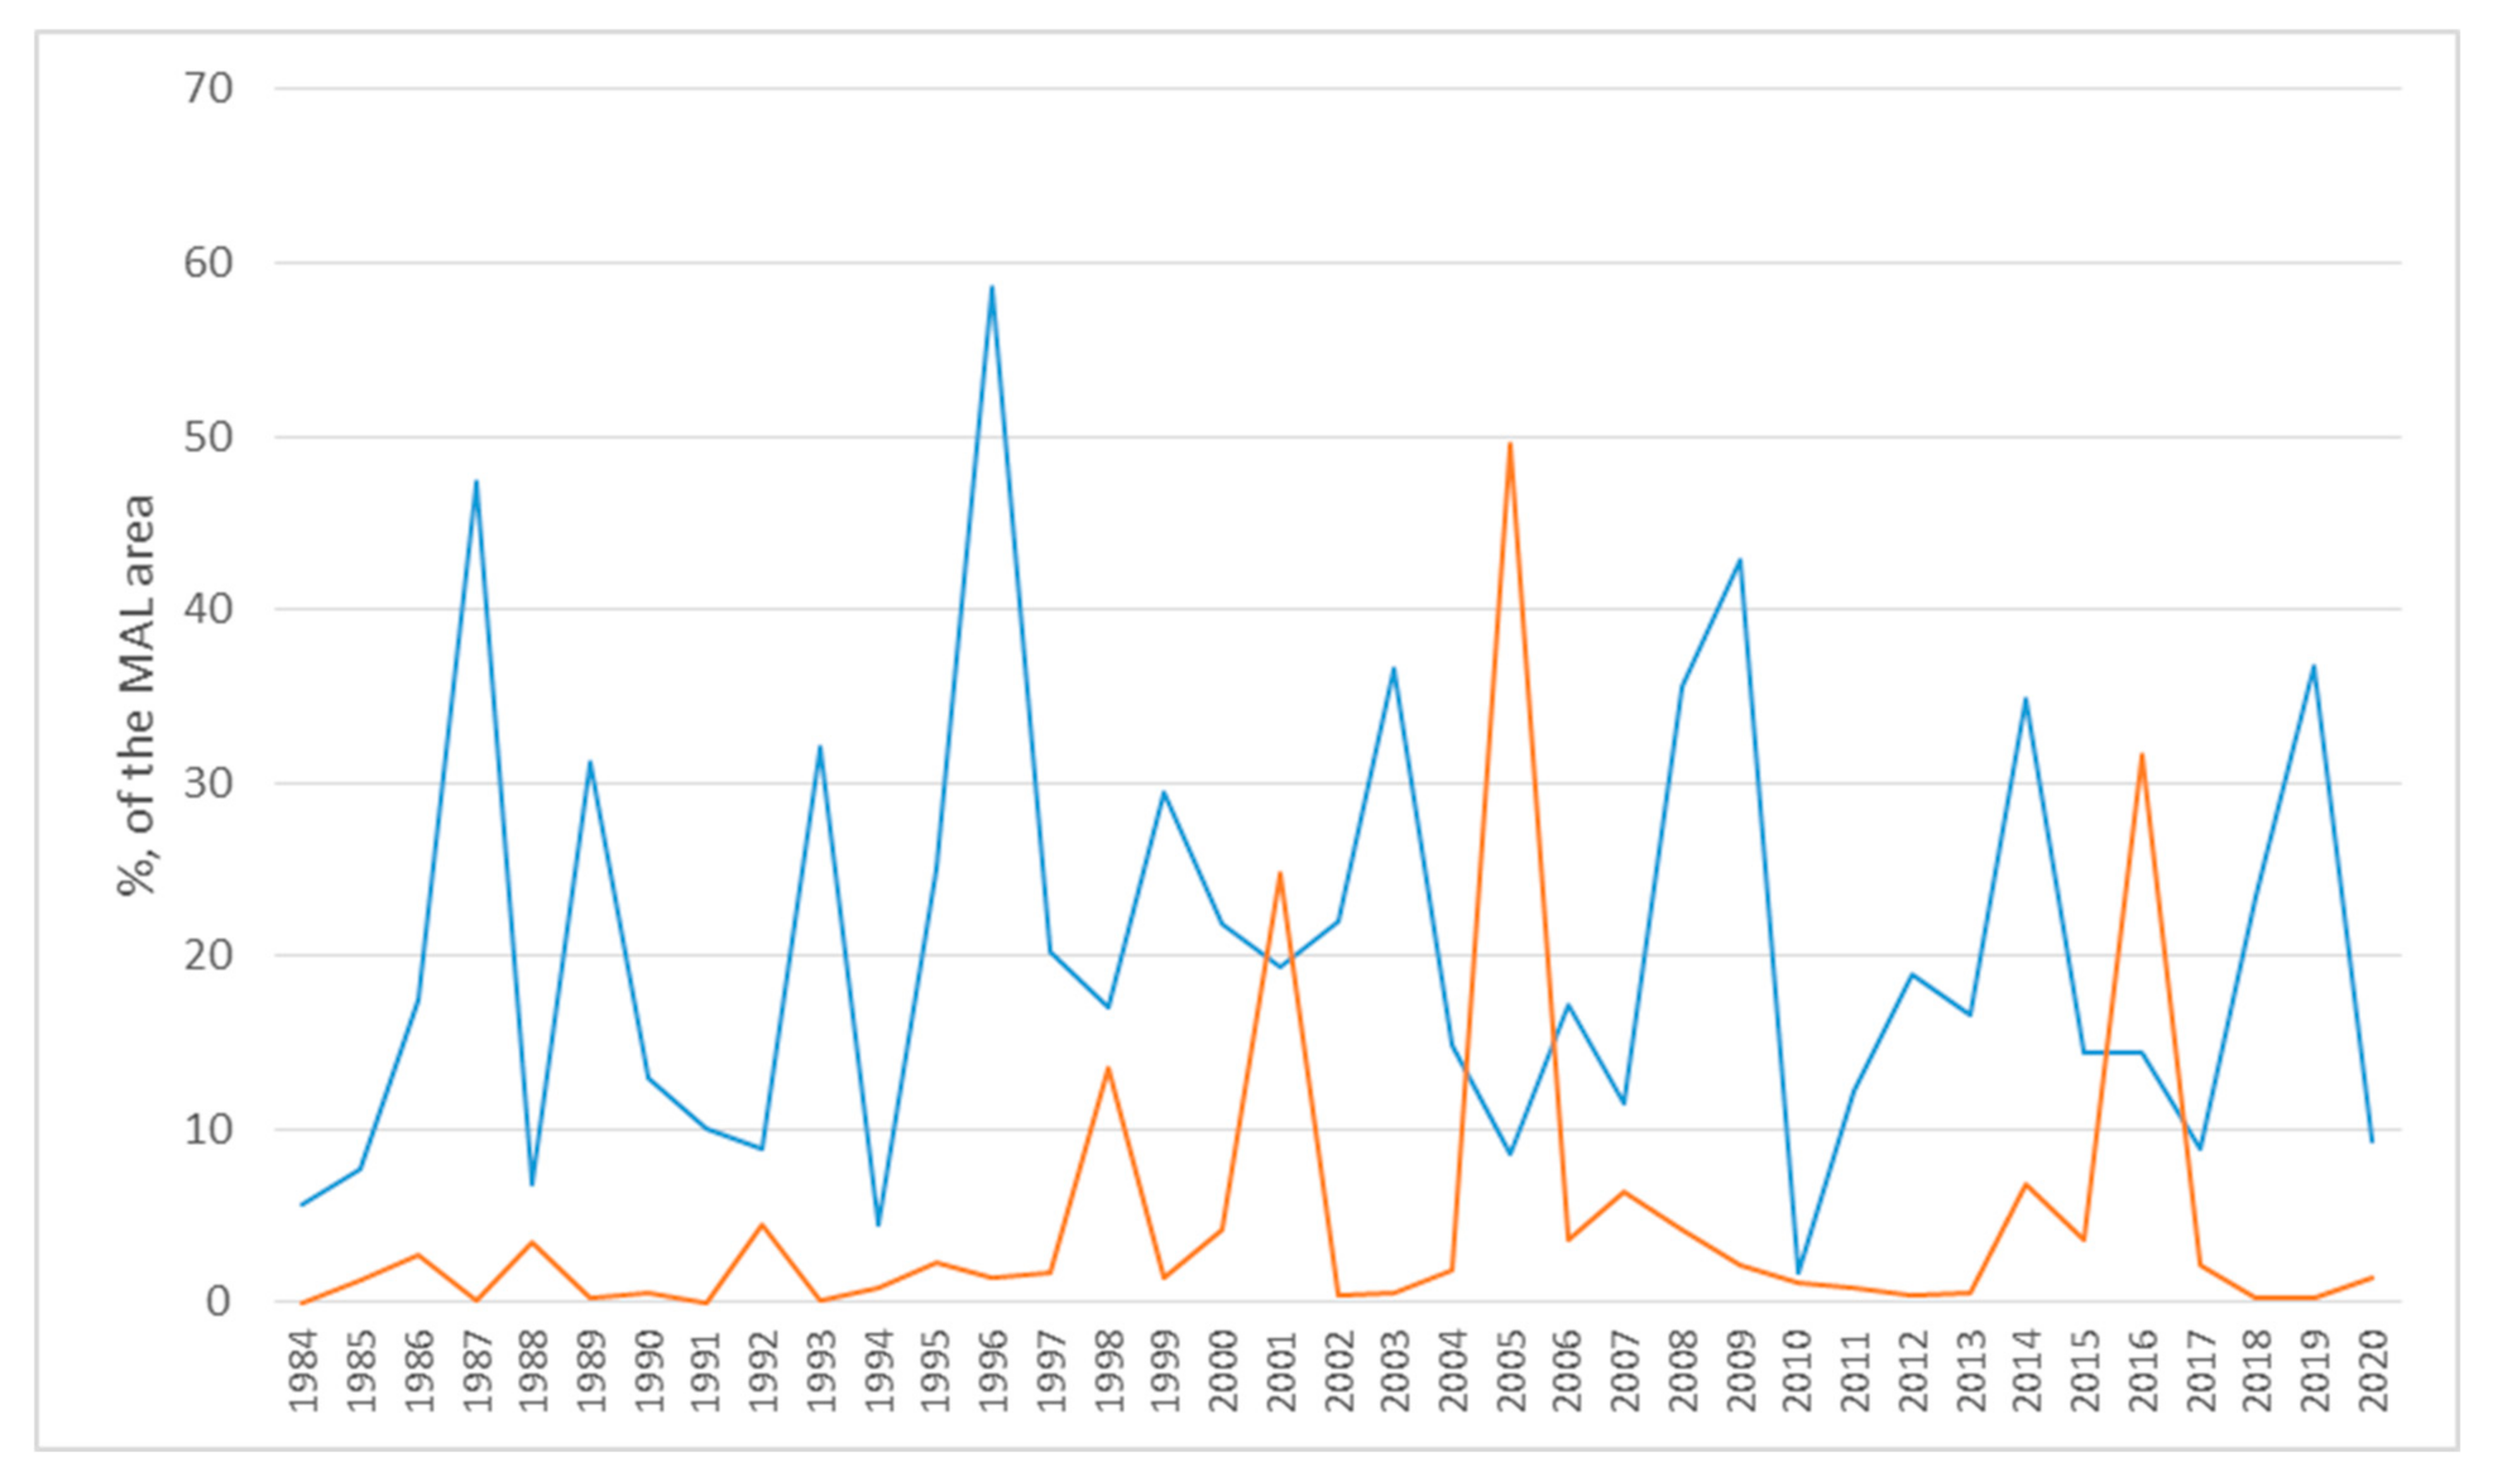
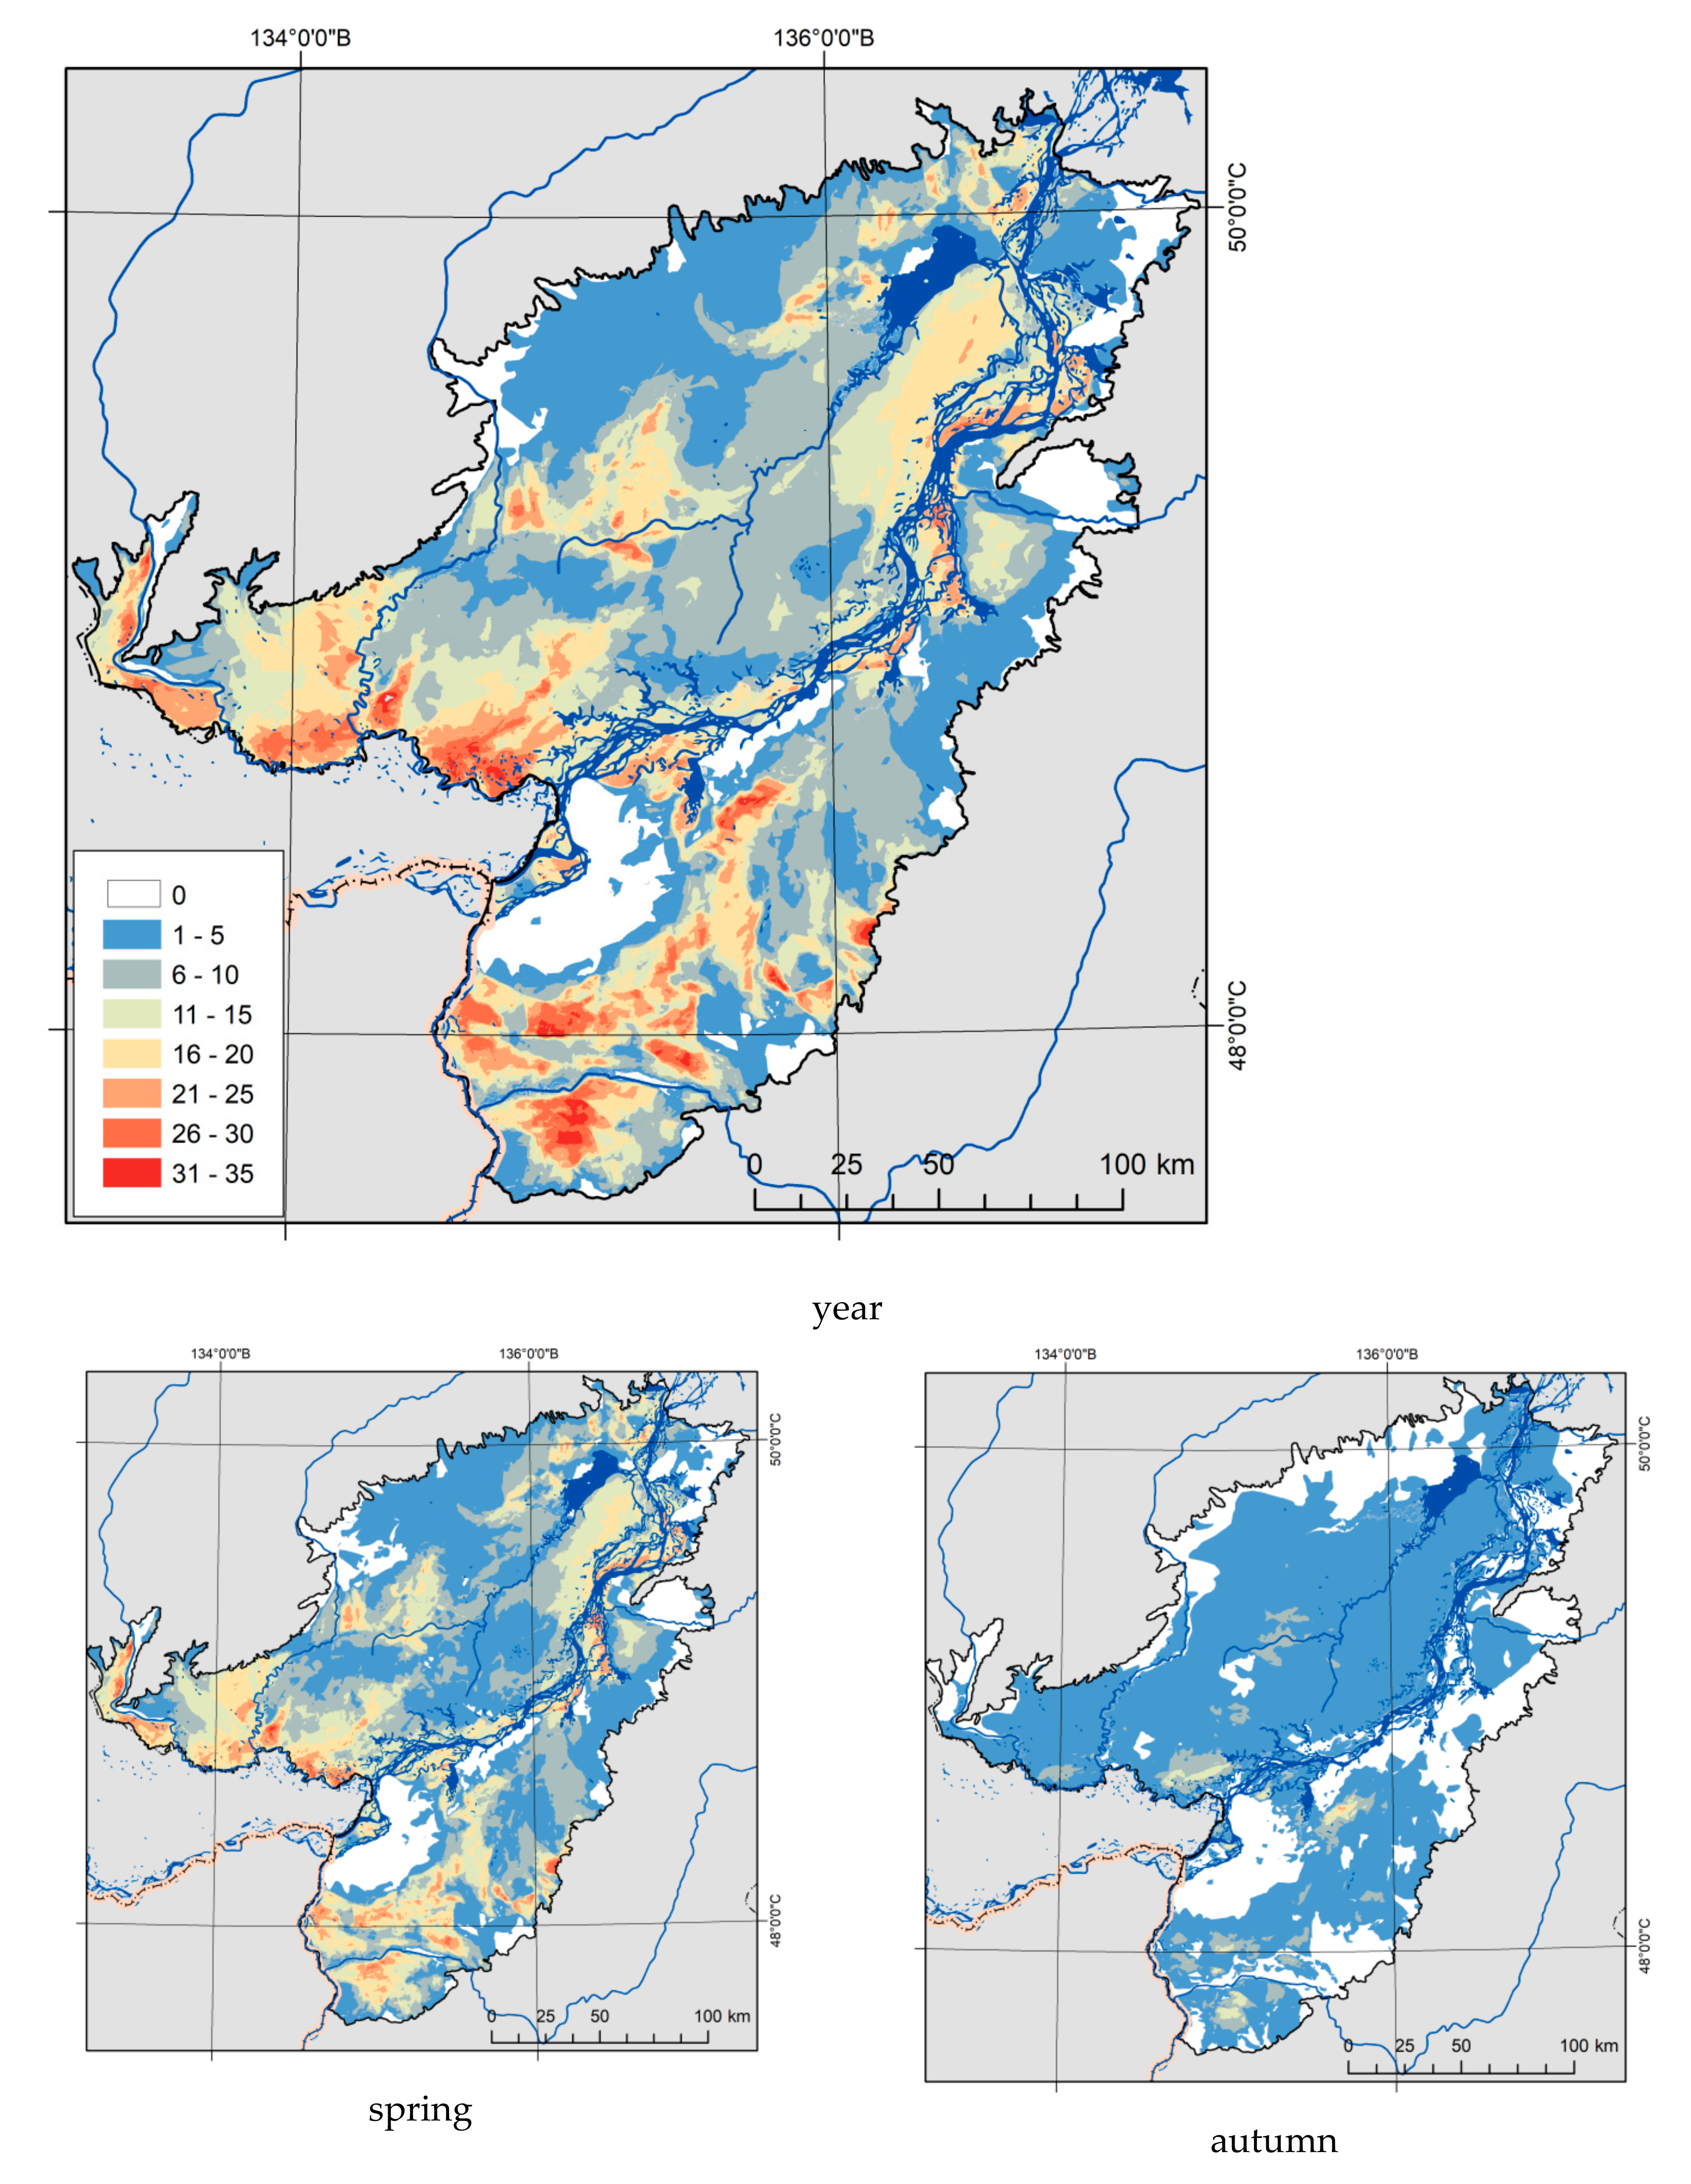
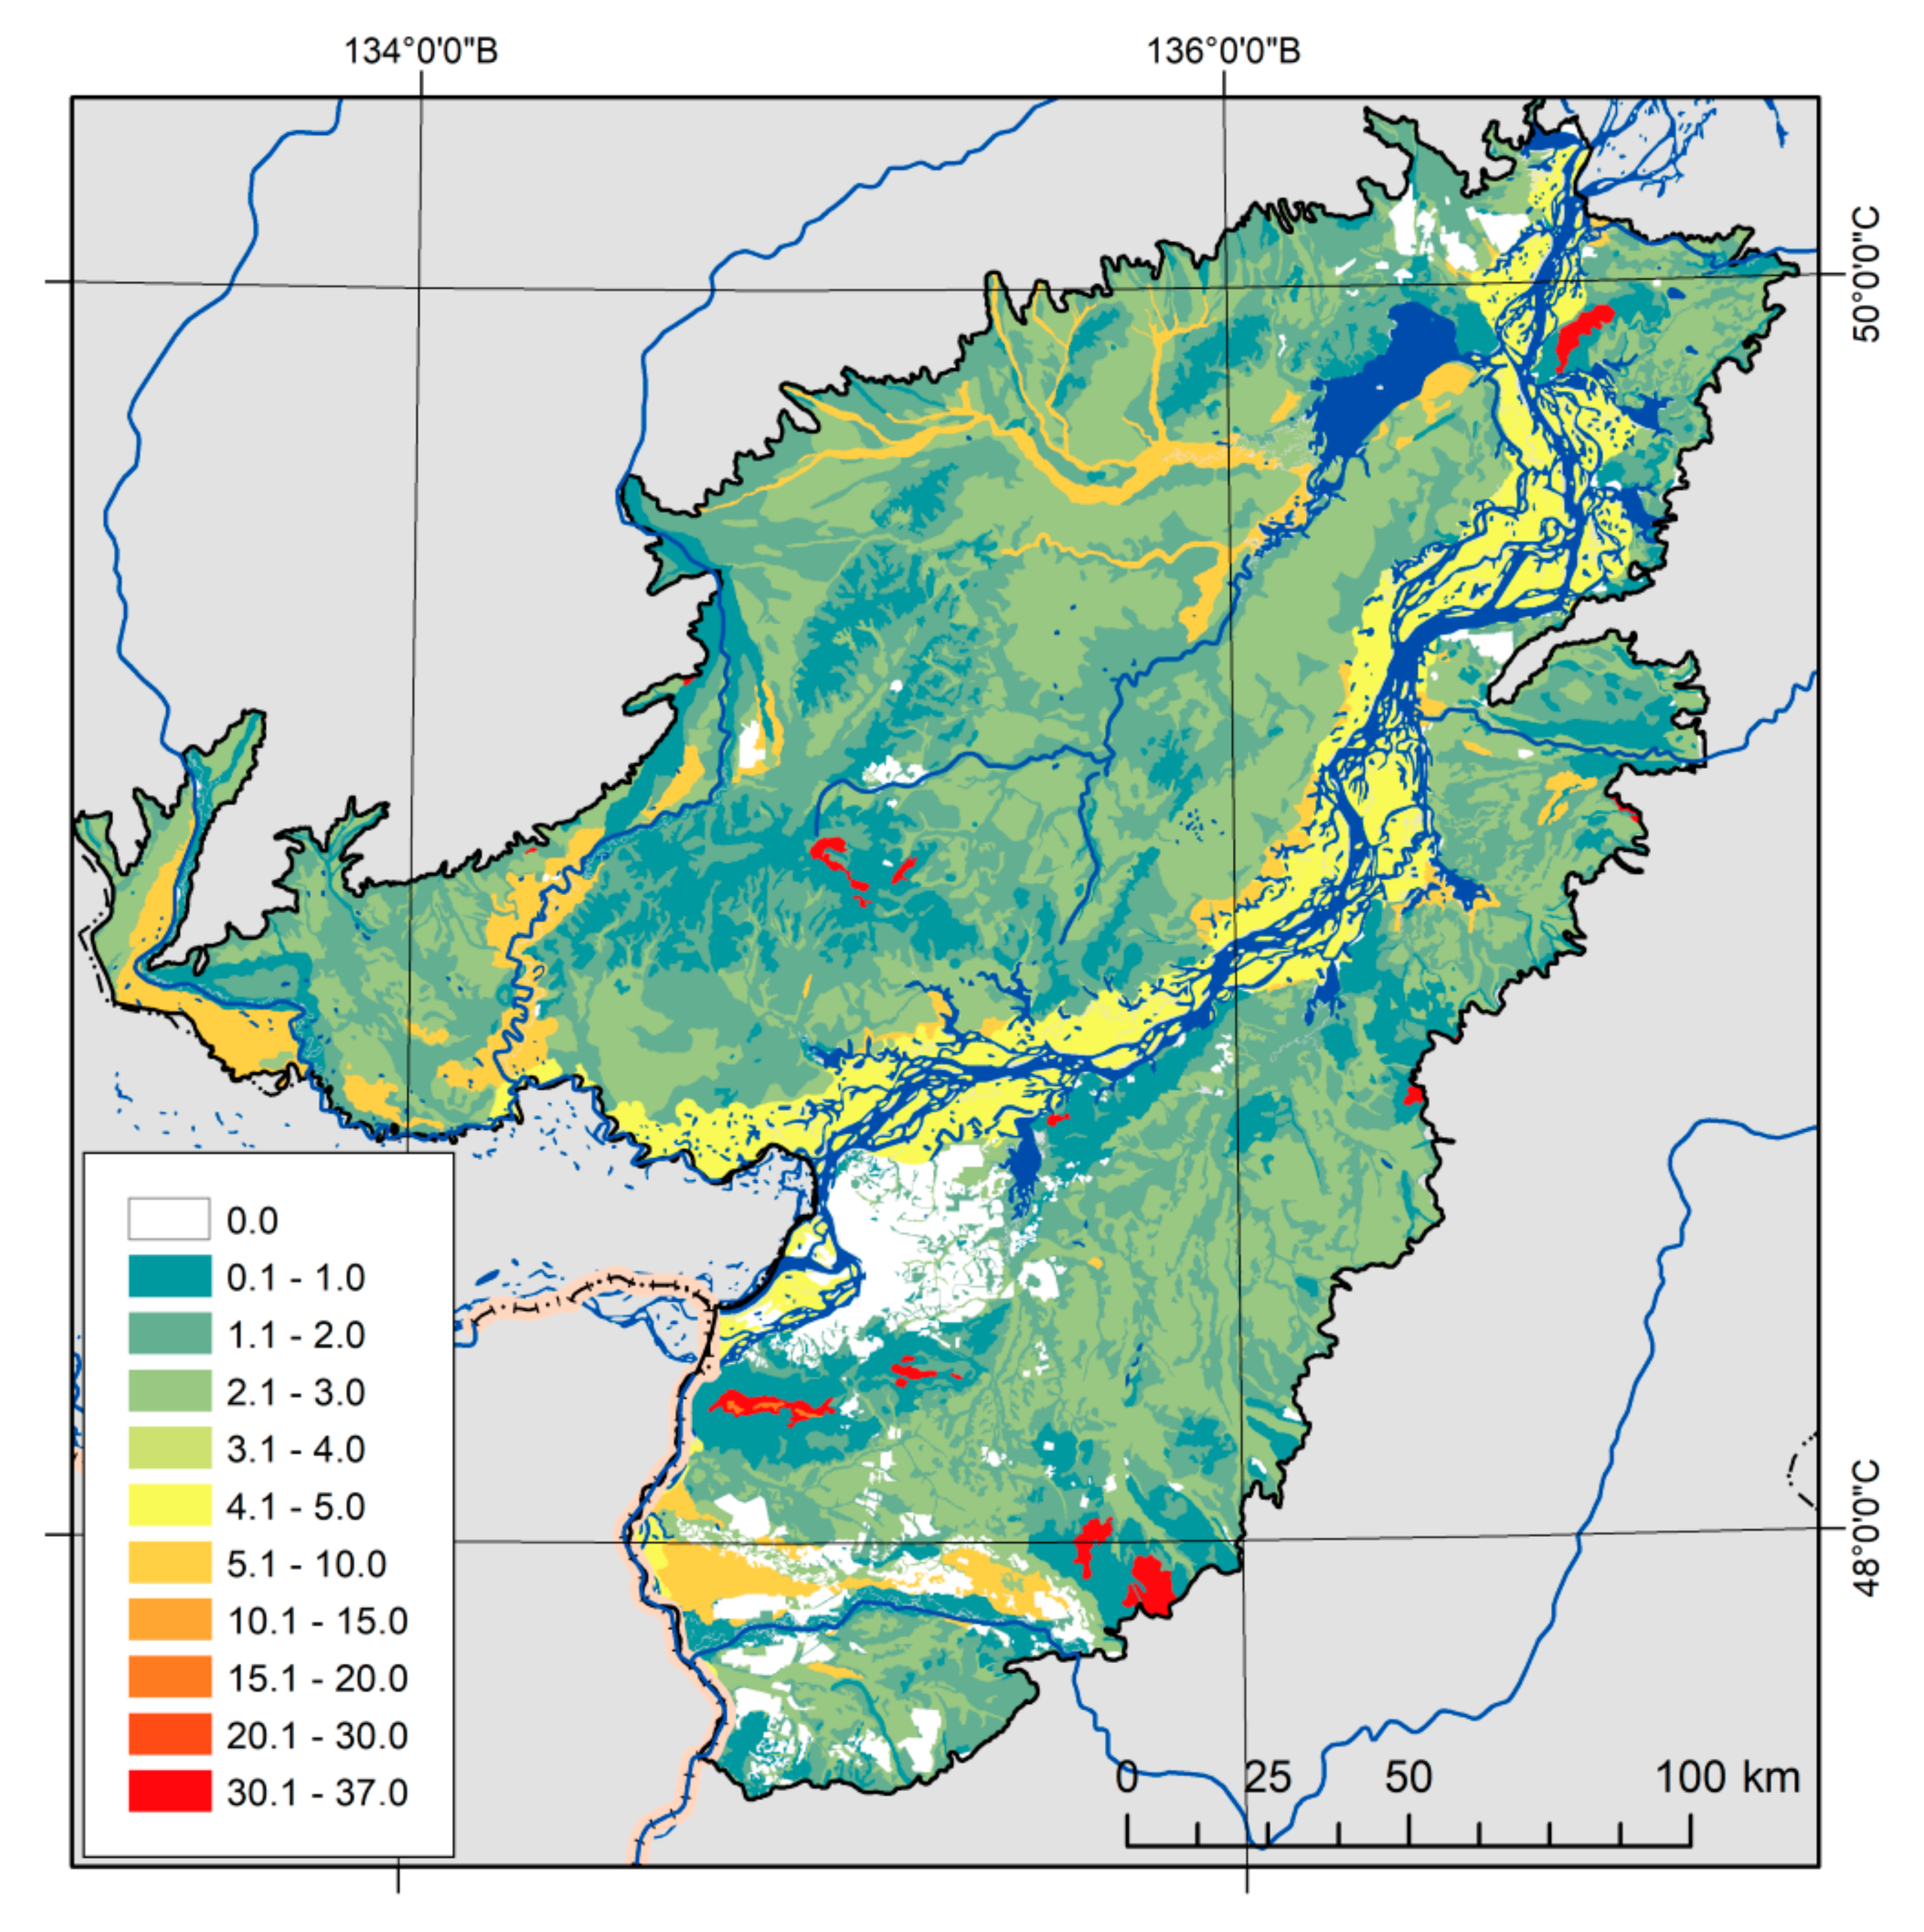
3.1. Estimating the Wildfire-Impacted Land Area in the Middle Amur Lowland
3.2. Estimating Carbon Emissions
4. Discussion
4.1. Estimating the Burned Area
- Rapid regeneration and growth of herbaceous vegetation in the spring, reducing the radiation in the infrared channel and making it difficult to automatically classify burns [59];
- Heterogeneity of the land cover leading to a large range of background temperatures and complicating the selection of hotspots [29].
4.2. Estimating Carbon Emissions
5. Conclusions
Author Contributions
Funding
Data Availability Statement
Conflicts of Interest
References
- Bolin, B.; Sukumar, R.; Ciais, P.; Cramer, W.; Jarvis, P.; Kheshgi, H.; Dokken, D.J. Global Perspective in Land Use, Land-Use Change, and Forestry—A Special Report of the IPCC; Cambridge University Press: Cambridge, UK, 2000; pp. 23–52. [Google Scholar]
- Canadell, J.G.; Pataki, D.E.; Pitelka, L.F. (Eds.) Terrestrial Ecosystems in a Changing World; Springer Science & Business Media: Berlin, Germany, 2007; pp. 139–146. [Google Scholar]
- Seitzinger, S.P.; Gaffney, O.; Brasseur, G.; Broadgate, W.; Ciais, P.; Claussen, M.; Erisman, J.W.; Kiefer, T.; Lancelot, C.; Monks, P.S.; et al. International Geosphere–Biosphere Programme and Earth system science: Three decades of co-evolution. Anthropocene 2015, 12, 3–16. [Google Scholar] [CrossRef]
- Ciais, P.; Sabine, C.; Bala, G.; Bopp, L.; Brovkin, V.; Canadell, J.; Thornton, P. Carbon and other biogeochemical cycles. In Climate Change 2013: The Physical Science Basis; Contribution of Working Group I to the Fifth Assessment Report of the Intergovernmental Panel on Climate Change; Cambridge University Press: Cambridge, UK, 2014; pp. 465–570. [Google Scholar]
- Andreae, M.O.; Merlet, P. Emission of trace gases and aerosols from biomass burning. Glob. Biogeochem. Cycles 2001, 15, 955–966. [Google Scholar] [CrossRef] [Green Version]
- Conard, S.G.; Ivanova, G.A. Wildfire in Russian boreal forests–Potential impacts of fire regime characteristics on emissions and global carbon balance estimates. Envir. Pollut. 1997, 98, 305–313. [Google Scholar] [CrossRef]
- Langmann, B.; Duncan, B.; Textor, C.; Trentmann, J.; van der Werfe, G.R. Vegetation fire emissions and their impact on air pollution and climate. Atmos. Environ. 2009, 43, 107–116. [Google Scholar] [CrossRef]
- Loehmana, R.A.; Reinhardt, E.; Riley, K.L. Wildland fire emissions, carbon, and climate: Seeing the forest and the trees—A cross-scale assessment of wildfire and carbon dynamics in fire-prone, forested ecosystems. For. Ecol. Manag. 2014, 317, 9–19. [Google Scholar] [CrossRef]
- Seiler, W.; Crutzen, P.J. Estiamates of gross and net fluxes of carbon between the biosphere and atmosphere from biomass burning. Clim. Change 1980, 2, 207–247. [Google Scholar] [CrossRef]
- Vivchar, A.V.; Moiseenko, K.B.; Pankratova, N.V. Estimates of carbon monoxide emissions from wildfires in Northern Eurasia for air quality assessment and climate modeling. Izv. Atmos. Ocean. Phys. 2010, 46, 281–293. [Google Scholar] [CrossRef]
- Wiedinmyer, C.; Neff, J.C. Estimates of CO2 from fires in the United States: Implications for carbon management. Carbon Balance Manag. 2007, 2, 10. [Google Scholar] [CrossRef] [Green Version]
- Wang, Q.; Jacob, D.J.; Fisher, J.A.; Mao, J.; Leibensperger, E.M.; Carouge, C.C.; Le Sager, P.; Kondo, Y.; Jimenez, J.L.; Cubison, M.J.; et al. Sources of carbonaceous aerosols and deposited black carbon in the Arctic in winter-spring: Implications for radiative forcing. Atmos. Chem. Phys. 2011, 11, 12453–12473. [Google Scholar] [CrossRef] [Green Version]
- Conard, S.G.; Sukhinin, A.; Stocks, B.; Cahoon, D.; Davidenko, E.; Ivanova, G. Determining effects of area burned and fire severity on carbon cycling and emissions in Siberia. Clim. Change 2002, 55, 197–211. [Google Scholar] [CrossRef]
- Hu, H.; Guo, Q.; Lv, X.; Sun, L. Estimating carbon emissions from forest fires during 1980 to 1999 in Daxing’an Mountain, China. Afr. J. Biotech. 2011, 10, 8046–8053. [Google Scholar]
- Yokelson, R.J.; Burling, I.R.; Urbanski, S.P.; Atlas, E.L.; Adachi, K.; Buseck, P.R.; Wiedinmyer, C.; Akagi, S.K.; Toohey, D.W.; Wold, C.E. Trace gas and particle emissions from open biomass burning in Mexico. Atmos. Chem. Phys. 2011, 11, 6787–6808. [Google Scholar] [CrossRef] [Green Version]
- Sannigrahi, S.; Pilla, F.; Basu, B.; Basu, A.S.; Sarkar, K.; Chakraborti, S.; Joshi, P.K.; Zhang, Q.; Wang, Y.; Bhatt, S.; et al. Examining the effects of forest fire on terrestrial carbon emission and ecosystem production in India using remote sensing approaches. Sci. Total Environ. 2020, 725, 138331. [Google Scholar] [CrossRef] [PubMed]
- Bartalev, S.A.; Egorov, V.A.; Loupian, E.A.; Uvarov, I. Multiyear circumpolar assessment of the area burnt in boreal ecosystems using SPOT-VEGETATION. Intern. J. Remote Sens. 2007, 28, 1397–1404. [Google Scholar] [CrossRef]
- Potter, C. Ecosystem carbon emissions from 2015 forest fires in interior Alaska. Carbon Balance Manag. 2018, 13, 2. [Google Scholar] [CrossRef] [PubMed] [Green Version]
- Sheingauz, A. The role of fire in forest cover, structure, and dynamics in the Russian Far East. In Fire in Ecosystems of Boreal Eurasia; Forestry Sciences; Goldammer, I.G., Furyaev, V.V., Eds.; Kluwer Academic Publishers: Dodrecht-Boston-London, UK, 1996; Volume 48, pp. 186–190. [Google Scholar]
- Soja, A.J.; Cofer, W.R.; Shugart, H.H.; Sukhinin, A.I.; Stackhouse, P.W., Jr.; McRae, D.J.; Conard, S.G. Estimating fire emissions and disparities in boreal Siberia (1998–2002). J. Geophys. Res. 2004, 109, D14S06. [Google Scholar] [CrossRef]
- Zhou, Y.; Xing, X.; Lang, J.; Chen, D.; Cheng, S.; Wei, L.; Wei, X.; Liu, C. A comprehensive biomass burning emission inventory with high spatial and temporal resolution in China. Atmos. Chem. Phys. 2017, 17, 2839–2864. [Google Scholar] [CrossRef] [Green Version]
- Hoffa, E.A.; Ward, D.E.; Hao, W.M.; Susott, R.A.; Wakimoto, R.H. Seasonality of carbon emissions from biomass burning in a Zambian savanna. J. Geophys. Res. 1999, 104, 13841–13853. [Google Scholar] [CrossRef]
- Lehsten, V.; Tansey, K.; Balzter, H.; Thonicke, K.; Spessa, A.; Weber, U.; Smith, B.; Arneth, A. Estimating carbon emissions from African wildfires. Biogeoscience 2009, 6, 349–360. [Google Scholar] [CrossRef] [Green Version]
- Kusangaya, S.; Sithole, V.B. Remote sensing-based fire frequency mapping in a savannah rangeland. S. Afr. J. Geomat. 2015, 4, 1. [Google Scholar] [CrossRef] [Green Version]
- Pitman, A.J.; Narisma, G.T.; McAneney, J. The impact of climate change on the risk of forest and grassland fires in Australia. Clim. Change 2007, 84, 383–401. [Google Scholar] [CrossRef]
- Argañaraz, J.; Gavier-Pizarro, G.; Zak, M.; Bellis, L. Fire regime, climate, and vegetation in the Sierras de Córdoba, Argentina. Fire Ecol. 2015, 11, 55–73. [Google Scholar] [CrossRef]
- Stavi, I. Wildfires in grasslands and scrublands: A review of impacts on vegetation, soil, hydrology, and geomorphology. Water 2019, 11, 1042. [Google Scholar] [CrossRef] [Green Version]
- Tan, Z.; Tieszen, L.L.; Zhu, Z.; Liu, S.; Howard, S.M. An estimate of carbon emissions from 2004 wildfires across Alaskan Yukon River Basin. Carbon Balance Manag. 2007, 2, 12. [Google Scholar] [CrossRef] [Green Version]
- Hawbaker, T.J.; Radeloff, V.C.; Syphard, A.D.; Zhu, Z.; Stewart, S.I. Detection rates of the MODIS active fire product in the United States. Remote Sens. Environ. 2008, 112, 2656–2664. [Google Scholar] [CrossRef]
- Isaev, A.S.; Korovin, G.N.; Bartalev, S.A.; Ershov, D.V.; Janetos, A.; Kasischke, E.S.; Shugart, H.H.; French, N.H.; Orlick, B.E.; Murphy, T.L. Using remote sensing to assess Russian forest fire carbon emissions. Clim. Change 2002, 55, 235–249. [Google Scholar] [CrossRef]
- Kukavskaya, E.A.; Soja, A.J.; Petkov, A.P.; Ponomarev, E.I.; Ivanova, G.A.; Conard, S.G. Fire emissions estimates in Siberia: Evaluation of uncertainties in area burned, land cover, and fuel consumption. Can. J. For. Res. 2012, 43, 493–506. [Google Scholar] [CrossRef]
- Poulter, B.; Christensen, N.L.; Halpin, P.N. Carbon emissions from a temperate peat fire and its relevance to interannual variability of trace atmospheric greenhouse gases. J. Geophys. Res. 2006, 111, D06301. [Google Scholar] [CrossRef]
- Ribeiro, K.; Pacheco, F.S.; Ferreira, J.W.; de Sousa-Neto, E.R.; Hastie, A.; Krieger, F.G.C.; Alvalá, P.C.; Forti, M.C.; Ometto, J.P. Tropical peatlands and their contribution to the global carbon cycle and climate change. Glob. Chang. Biol. 2021, 27, 489–505. [Google Scholar] [CrossRef]
- Korontzi, S.; McCarty, J.; Loboda, T.; Kumar, S.; Justice, C. Global distribution of agricultural fires in croplands from 3 years of Moderate Resolution Imaging Spectroradiometer (MODIS) data. Glob. Biogeochem. Cycles 2006, 20, GB2021. [Google Scholar] [CrossRef]
- Hall, J.V.; Loboda, T.V.; Giglio, L.; McCarty, G.W. A MODIS-based burned area assessment for Russian croplands: Mapping requirements and challenges. Remote Sens. Environ. 2016, 184, 506–521. [Google Scholar] [CrossRef] [Green Version]
- McCarty, J.; Krylov, A.; Prishchepov, A.; Banach, D.; Tyukavina, A.; Potapov, P.; Turubanova, S. Agricultural fires in European Russia, Belarus, and Lithuania and their impact on air quality, 2002–2012. In Land-Cover and Land-Use Changes in Eastern Europe after the Collapse of the Soviet Union in 1991; Gutman, G., Radeloff, V., Eds.; Springer International Publishing: Cham, Switzerland, 2017; pp. 193–221. [Google Scholar] [CrossRef]
- Romanenkov, V.; Rukhovich, D.; Koroleva, P.; McCarty, J. Estimating black carbon emissions from agricultural burning. In Novel Measurement and Assessment Tools for Monitoring and Management of Land and Water Resources in Agricultural Landscapes of Central Asia; Environmental Science and Engineering; Mueller, L., Saparov, A., Lischeid, G., Eds.; Springer International Publishing: Cham, Switzerland, 2014. [Google Scholar] [CrossRef]
- Li, J.; Li, Y.; Bo, Y.; Xie, S. High-resolution historical emission inventories of crop residue burning in fields in China for the period 1990–2013. Atmos. Environ. 2016, 138, 152–161. [Google Scholar] [CrossRef]
- Tishkov, A.A. Fires in Steppes and Savannas. In Natural Disasters–Volume II. Encyclopedia of Life Support Systems; Kotlyakov, V.M., Ed.; EOLSS Publications: Oxford, UK, 2010; pp. 144–158. [Google Scholar]
- Ostroukhov, A.V.; Klimina, E.M. Survey of Middle Amur lowland terrain transformations based on remote sensing data. In Proceedings of the Joint Symposium on Tropical Peatland Restoration 2018. Responsible Management of Tropical Peatland following up to The Jakarta Declaration, Jakarta, Indonesia, 22 February 2018; IKAPI: Bogor, Indonesia, 2018; pp. 123–129. [Google Scholar]
- Novorotsky, P.V. Long-term changes in air temperature and precipitation in the Lower Amur basin. Meteorol. Hydrol. 2001, 10, 16–23. (In Russian) [Google Scholar]
- Mayorova, L.P.; Sadykov, A.I.; Sych, Y.I. Assessment of pollutant emissions and carbon dioxide emissions during forest fires (on the example of the Khabarovsk Territory). Sci. Notes Pac. Natl. Univ. 2013, 4, 4. Available online: http://ejournal.khstu.ru/media/2013/TGU_4_27.pdf (accessed on 20 May 2021). (In Russian).
- Glagolev, V.A.; Zubareva, A.M.; Grigorieva, E.A. Grassfire forecast at agricultural lands in Jewish Autonomous Region. Reg. Prob. 2018, 21, 93–97. [Google Scholar] [CrossRef]
- Bazarova, V.B.; Razzhigaeva, N.G.; Ganzei, L.A.; Kopoteva, T.A.; Mokhova, L.M.; Panichev, A.M.; Klimin, M.A. Pyrogenic events in the south of the Far East in the Late Pleistocene–Holocene. Geogr. Nat. Resour. 2017, 4, 122–132. (In Russian) [Google Scholar]
- Kopoteva, T.A.; Kuptsova, V.A. Pyrogenic factor in the haze bogs of the Amur region. Bull. North-East. Res. Center FEB RAS. 2011, 3, 37–41. (In Russian) [Google Scholar]
- Information System for Remote Monitoring of the Federal Forestry Agency of Russia. 2021. Available online: https://nffc.aviales.ru/main_pages/index.shtml (accessed on 19 October 2021).
- The land cover of Northern Eurasia. 2000. Available online: http://smiswww.iki.rssi.ru/files/maps/northern_eurasia.jpg (accessed on 15 May 2021).
- State Geological Map of the Russian Federation. Geomorphological Map of the USSR at a Scale of 1:2,500,000; Head Office of Geodesy and Cartography: Moscow, Russia, 1985; p. 16. (In Russian)
- State Geological Map of the Russian Federation. Quaternary Deposits Map of a Scale 1:1,000,000. Pre-Quaternary Deposits Map of a Scale 1:1,000,000. State Geological Map of the Russian Federation. Scale 1: 1 000 000 (third generation). Far Eastern Series. Sheet M-53. Khabarovsk; Explanatory note; Map-making organization of VSEGEI: St. Petersburg, Russia, 2009; p. 376. (In Russian) [Google Scholar]
- Burenina, T.A. Changes in the stocks of the aboveground phytomass and carbon emissions during fires in the forest mire complexes of the Sakhalin Island. Bull. NE Res. Cent. FEB RAS 2006, 2, 75–85. (In Russian) [Google Scholar]
- Ivanova, G.; Conard, S.; Kukavskaya, E.; McRae, D. Fire impact on carbon storage in light conifer forests of the Lower Angara region, Siberia. Environ. Res. Lett. 2011, 6, 045203. [Google Scholar] [CrossRef]
- Wiedinmyer, C.; Quayle, B.; Geron, C.; Belote, A.; McKenzie, D.; Zhang, X.Y.; ONeill, S.; Wynne, K.K. Estimating emissions from fires in North America for air quality modeling. Atmos. Environ. 2006, 40, 3419–3432. [Google Scholar] [CrossRef]
- Westlake, D.F. Comparisons of plant productivity. Biol. Rev. 1963, 38, 385–425. [Google Scholar] [CrossRef]
- Titlyanova, A.A.; Kudryashova, S.Y.; Kosykh, N.P.; Shibareva, S.V. Biological carbon cycle and its change under the influence of human activities in the territory of Southern Siberia. Soil Sci. 2005, 1, 1240–1250. [Google Scholar]
- Eggleston, S.; Buendia, L.; Miwa, K.; Ngara, T.; Tanabe, K. (Eds.) IPCC Guidelines for National Greenhouse Gas Inventories; IGES: Hayama, Japan, 2006. [Google Scholar]
- Tyuremnov, S.N. Peat Deposits; Nedra: Moscow, Russia, 1976. [Google Scholar]
- Rakovsky, V.E.; Pigulevskaya, L.V. Chemistry and Genesis of Peat; Nedra: Moscow, Russia, 1978. [Google Scholar]
- Fu, Y.; Li, R.; Wang, X.; Bergeron, Y.; Valeria, O.; Chavardès, R.D.; Wang, Y.; Hu, J. Fire detection and fire radiative power in forests and low-biomass lands in Northeast Asia: MODIS versus VIIRS Fire Products. Remote Sens. 2020, 12, 2870. [Google Scholar] [CrossRef]
- Long, T.; Zhang, Z.; He, G.; Jiao, W.; Tang, C.; Wu, B.; Zhang, X.; Wang, G.; Yin, R. 30 m resolution global annual burned area mapping based on Landsat images and Google Earth engine. Remote Sens. 2019, 11, 489. [Google Scholar] [CrossRef] [Green Version]
- Oliva, P.; Martín, P.; Chuvieco, E. Burned area mapping with MERIS post-fire image. Int. J. Remote Sens. 2011, 32, 4175–4201. [Google Scholar] [CrossRef]
- Salvoldi, M.; Siaki, G.; Sprintsin, M.; Karnieli, A. Burned area mapping using multi-temporal Sentinel-2 data by applying the relative differenced aerosol-free vegetation index (RdAFRI). Remote Sens. 2020, 12, 2753. [Google Scholar] [CrossRef]
- Ageenko, A.S. Forests of the Far East; Forest Industry: Moscow, Russia, 1969; p. 392. (In Russian) [Google Scholar]
- Project for Mapping landscape Fires of the Russian Federation in 2020. Greenpeace, 2021. Available online: https://greenpeace.ru/news/2021/04/06/greenpeace-podschital-ploshhad-vseh-landshaftnyh-pozharov-v-rossii-v-2020-godu/ (accessed on 20 May 2021).
- FIRMS. Fire Information for Resource Management System. 2021. Available online: https://firms.modaps.eosdis.nasa.gov/download/ (accessed on 20 May 2021).
- Bartalev, S.A.; Egorov, V.A.; Efremov, V.Y.; Loupian, E.A.; Stytsenko, F.V.; Flitman, E.V. Integrated burnt area assessment based on combine use of multi-resolution MODIS and Landsat-TM/ETM+ satellite data. Curr. Probl. Remote Sens. Earth Space 2012, 9, 9–26. [Google Scholar]
- Fraser, R.; Liu, H.; Cihlar, J. Hotspot and NDVI Differencing Synergy (HANDS): A new technique for burned area mapping over boreal forest. Rem. Sens. Environ. 2000, 74, 362–376. [Google Scholar] [CrossRef]
- García-Lázaro, J.R.; Moreno-Ruiz, J.A.; Riaño, D.; Arbelo, M. Estimation of burned area in the northeastern Siberian boreal forest from a Long-Term Data Record (LTDR) 1982–2015 time series. Remote Sens. 2018, 10, 940. [Google Scholar] [CrossRef] [Green Version]
- Ying, L.; Shen, Z.; Yang, M.; Piao, S. Wildfire detection probability of MODIS fire products under the constraint of environmental factors: A study based on confirmed ground wildfire records. Remote Sens. 2019, 11, 3031. [Google Scholar] [CrossRef] [Green Version]
- Korontzi, S.; McCarty, J.; Justice, C. Monitoring agricultural burning in the Mississippi River valley region from the Moderate Resolution Imaging Spectroradiometer (MODIS). J. Air Waste Manag. Assoc. 2008, 58, 1235–1239. [Google Scholar] [CrossRef] [PubMed] [Green Version]
- State Geological Map of the Russian Federation. Scale 1:1,000,000 (Third Generation). Sheet M-53. Khabarovsk. Digital Materials Set According to Sheet M-53 of the State Geomap-1000/3 of the Russian Federation; MNR of Russia, Federal Subsoil Use Agency, FSUE A.P. Karpinsky Russian Geological Research Institute (VSEGEI), FSUE Dalgeophysics: Moscow, Russia, 2006. (In Russian) [Google Scholar]
- Hoelzemann, J.J.; Schultz, M.G.; Brasseur, G.P.; Granier, C. Global Wildland Fire Emission Model (GWEM): Evaluating the use of global area burnt satellite data. J. Geophys. Res. 2004, 109, D14S04. [Google Scholar] [CrossRef]
- Ershov, D.V.; Sochilova, E.N. Assessment of direct pyrogenic carbon emissions in forests of Russia for 2020 according to remote monitoring data. For. Sci. Iss. 2020, 3, 1–8. [Google Scholar] [CrossRef]
- Li, X.; Xie, F.; Wang, X.; Kong, F. Human intervened post-fire forest restoration in the Northern Great Hing’an Mountains: A review. Landscape Ecol. Eng. 2006, 2, 129–137. [Google Scholar] [CrossRef]


| Year | Landsat-5 | Landsat-7 | Landsat-8 | Year | Landsat-5 | Landsat-7 | Landsat-8 | Year | Landsat-5 | Landsat-7 | Landsat-8 |
|---|---|---|---|---|---|---|---|---|---|---|---|
| 1984 | 7 | – | – | 1997 | 23 | – | – | 2010 | 11 | 17 | – |
| 1985 | 11 | – | – | 1998 | 18 | – | – | 2011 | 8 | 19 | – |
| 1986 | 10 | – | – | 1999 | 15 | – | – | 2012 | – | 23 | – |
| 1987 | 20 | – | – | 2000 | 14 | 18 | – | 2013 | – | 23 | 24 |
| 1988 | 16 | – | – | 2001 | 22 | 17 | – | 2014 | – | 28 | 27 |
| 1989 | 19 | – | – | 2002 | 11 | 12 | – | 2015 | – | 16 | 16 |
| 1990 | 19 | – | – | 2003 | 15 | 8 | – | 2016 | – | 21 | 19 |
| 1991 | 14 | – | – | 2004 | 18 | 14 | – | 2017 | – | 1 | 25 |
| 1992 | 23 | – | – | 2005 | 12 | 18 | – | 2018 | – | – | 27 |
| 1993 | 17 | – | – | 2006 | 19 | 19 | – | 2019 | – | 13 | 28 |
| 1994 | 22 | – | – | 2007 | 22 | 18 | – | 2020 | – | – | 23 |
| 1995 | 17 | – | – | 2008 | 23 | 19 | – | ||||
| 1996 | 23 | – | – | 2009 | 26 | 24 | – | Total | 475 | 328 | 189 |
| Year | Area, Thousand ha | Share of the Total Area, % | Year | Area, Thousand ha | Share of the Total Area, % | ||||
|---|---|---|---|---|---|---|---|---|---|
| Spring | Autumn | Total | Spring | Autumn | Total | ||||
| 1984 | 221.23 | 5.7 | 0.0 | 5.7 | 2003 | 1445.17 | 36.6 | 0.5 | 37.1 |
| 1985 | 354.14 | 7.7 | 1.4 | 9.1 | 2004 | 650.75 | 14.9 | 1.8 | 16.7 |
| 1986 | 789.80 | 17.5 | 2.7 | 20.3 | 2005 | 2262.88 | 8.5 | 49.6 | 58.1 |
| 1987 | 1849.10 | 47.4 | 0.1 | 47.5 | 2006 | 807.33 | 17.1 | 3.6 | 20.7 |
| 1988 | 402.72 | 6.8 | 3.5 | 10.3 | 2007 | 697.98 | 11.5 | 6.5 | 17.9 |
| 1989 | 1224.59 | 31.2 | 0.3 | 31.4 | 2008 | 1547.11 | 35.5 | 4.2 | 39.7 |
| 1990 | 527.20 | 13.0 | 0.6 | 13.5 | 2009 | 1754.71 | 42.9 | 2.2 | 45.1 |
| 1991 | 389.19 | 10.0 | 0.0 | 10.0 | 2010 | 110.96 | 1.7 | 1.1 | 2.8 |
| 1992 | 521.39 | 8.9 | 4.5 | 13.4 | 2011 | 508.61 | 12.2 | 0.9 | 13.1 |
| 1993 | 1252.84 | 32.0 | 0.2 | 32.2 | 2012 | 752.91 | 19.0 | 0.4 | 19.3 |
| 1994 | 205.16 | 4.5 | 0.8 | 5.3 | 2013 | 670.58 | 16.7 | 0.6 | 17.2 |
| 1995 | 1070.77 | 25.1 | 2.4 | 27.5 | 2014 | 1625.70 | 34.9 | 6.9 | 41.7 |
| 1996 | 2335.10 | 58.6 | 1.4 | 60.0 | 2015 | 704.13 | 14.4 | 3.7 | 18.1 |
| 1997 | 854.52 | 20.2 | 1.7 | 21.9 | 2016 | 1790.69 | 14.4 | 31.6 | 46.0 |
| 1998 | 1190.61 | 17.1 | 13.5 | 30.6 | 2017 | 426.15 | 8.8 | 2.1 | 10.9 |
| 1999 | 1202.35 | 29.5 | 1.4 | 30.9 | 2018 | 926.45 | 23.5 | 0.3 | 23.8 |
| 2000 | 1016.17 | 21.9 | 4.2 | 26.1 | 2019 | 1444.55 | 36.8 | 0.3 | 37.1 |
| 2001 | 1719.17 | 19.4 | 24.7 | 44.1 | 2020 | 419.32 | 9.4 | 1.4 | 10.8 |
| 2002 | 872.33 | 22.0 | 0.4 | 22.4 | Mean | 987.68 | 20.5 | 4.9 | 25.4 |
| Eco-System Type 1 | Ecosystem Area | Share of Ecosystem not Affected by Fires, % | Burnt Forest Area | Share of Spring Fires, % | Average Annual Burnt Forest Area | |||
|---|---|---|---|---|---|---|---|---|
| Total, Thousand ha | % of the MAL Area | Total, Thousand ha | % of the Ecosystem Area | Total, Thousand ha | % of the Ecosystem Area | |||
| 1 | 717.49 | 18.5 | 22.82 | 3194.09 | 445.17 | 76.86 | 86.33 | 12.03 |
| 2 | 754.06 | 19.4 | 5.46 | 7967.6 | 1056.62 | 78.50 | 215.34 | 28.56 |
| 3 | 1165.98 | 30.1 | 4.09 | 11,659.86 | 1000.00 | 77.30 | 315.13 | 27.03 |
| 4 | 165.00 | 4.3 | 36.75 | 732.08 | 443.68 | 85.33 | 19.79 | 11.99 |
| 5 | 881.86 | 22.7 | 2.72 | 11,617.5 | 1317.39 | 85.67 | 313.97 | 35.61 |
| ∑ | 3894.25 | 100.0 | 10.20 | 36,542.73 | 938.38 | 80.67 | 987.64 | 25.36 |
| Eco -System Type 1 | Area, ha | Area,% of the MAL | SE 2 for 1 Fire, t/ha | Range of SE Values for one Fire, t/ha | E 3 for 1984–2020, t | E 3 for 1984–2020, % of total | E 3 Spring for 1984–2020, % of the Total | Average Long-Term SE 2 from 1 ha, t/ha | Range of Mean Long-Term SE 2 Values from Each Ecosystem per Year, t/ha |
|---|---|---|---|---|---|---|---|---|---|
| 1 | 717,497.26 | 18.5 | 1.21 | 0.5–37 | 4,069,594.67 | 4.5 | 76.5 | 0.15 | 0–3.34 |
| 2 | 754,063.06 | 19.4 | 1.68 | 1.1–2.8 | 12,225,227.30 | 13.4 | 79.0 | 0.44 | 0.17–0.93 |
| 3 | 1,165,982.94 | 30.1 | 2.20 | 1.1–2.8 | 26,796,268.70 | 29.4 | 77.6 | 0.62 | 0.02–0.89 |
| 4 | 165,003.37 | 4.3 | 0.61 | 0.3–1.5 | 566,417.39 | 0.6 | 84.5 | 0.09 | 0.02–0.68 |
| 5 | 881,856.97 | 22.7 | 3.66 | 1.4–6.0 | 47,508,857.41 | 52.1 | 86.5 | 1.46 | 0.39–2.51 |
| ∑ | 3,894,246.50 | 100.0 | 2.25 | 0.4–6.0 | 91,166,365.47 | 100.0 | 82.4 | 0.63 | 0–2.51 |
| Region | Burnt Forest Area, 106 ha | Total Carbon Emission, TgC | Carbon Emission, tC/ha | ||
|---|---|---|---|---|---|
| Grasslands | Woodlands | Forests | |||
| North America | 7.0 | 196.1 | 4.3 | 16.7 | 29.2 |
| Central America | 2.0 | 43.7 | 1.8 | 6.6 | 27.6 |
| South America | 12.7 | 126.5 | 2.4 | 9.2 | 39.1 |
| North Africa | 60.4 | 408.7 | 1.4 | 7.6 | 34.6 |
| South Africa | 57.7 | 472.6 | 1.5 | 7.4 | 41.1 |
| Western Europe | 0.3 | 3.5 | 3.8 | 13.8 | 17.8 |
| Eastern Europe | 1.0 | 11.9 | 6.2 | 25.1 | 24.5 |
| North and Central Asia | 8.8 | 321.6 | 9.1 | 35.0 | 41.3 |
| Middle East Asia | 0.8 | 5.4 | 2.6 | 8.7 | 23.3 |
| East Asia | 0.0 | 0.1 | 2.3 | 12.2 | 22.1 |
| South Asia | 3.6 | 99.7 | 4.7 | 15.7 | 57.3 |
| Oceania | 17.8 | 51.6 | 1.0 | 3.8 | 30.0 |
| Middle Amur Lowland (MAL) | 1.0 | 2.68 | 1.1–6.0 | 1.1–2.8 | 0.5–37.0 |
| Ecosystems | Ecosystem Area | Fire Area | Specific Emission (SE), t/ha | Emission, t | |||
|---|---|---|---|---|---|---|---|
| ha | % of the Total Area | ha | % of the Total Area | % of the Ecosystem Area | |||
| Forest | 774,096,314 | 45.66 | 10,328,466 | 40.2 | 1.33 | 5.663 | 58,459,119 3 |
| Shrubs | 32,253,309 | 1.90 | 329,085 | 1.3 | 1.02 | ||
| Needle-leaf evergreen shrubs | 25,155,249 | 1.48 | 193,547 | 0.8 | 0.77 | ||
| Broadleaf deciduous shrubs | 7,098,060 | 0.42 | 135,538 | 0.5 | 1.91 | 1.09 2 | 147,736 2 |
| Wetlands | 70,184,473 | 4.14 | 588,852 | 2.3 | 0.84 | 1,422,333 2 | |
| Bogs and marches | 56,032,970 | 3.31 | 425,793 | 1.7 | 0.76 | 2.20 2 | 936,744 2 |
| Palsa bogs | 14,151,503 | 0.83 | 139,839 | 0.5 | 0.99 | 2.79 2 | 390,151 2 |
| Riparian | 7,888,022 | 0.47 | 23,221 | 0.1 | 0.29 | 4.11 2 | 95,438 2 |
| Herbaceous | 69,496,750 | 4.10 | 4,848,795 | 18.9 | 6.98 | ||
| Humid grasslands | 44,641,280 | 2.63 | 4,059,132 | 15.8 | 9.09 | 2.44 2 | 9,904,282 2 |
| Steppe | 24,855,469 | 1.47 | 789,664 | 3.1 | 3.18 | ||
| Tundra | 321,834,343 | 18.98 | 1,070,629 | 4.2 | 0.33 | ||
| Sedge tundra | 73,639,133 | 4.34 | 388,771 | 1.5 | 0.53 | ||
| Shrub tundra | 158,263,028 | 9.34 | 609,292 | 2.4 | 0.38 | ||
| Prostrate shrub tundra | 89,932,183 | 5.30 | 72,567 | 0.3 | 0.08 | ||
| Complexes | 208,418,307 | 12.29 | 7,283,982 | 28.3 | 3.49 | ||
| Recent burns | 12,506,668 | 0.74 | 229,698 | 0.9 | 1.84 | ||
| Croplands | 107,894,078 | 6.36 | 3,829,982 | 14.9 | 3.55 | ||
| Forest–Natural Vegetation complexes | 22,644,624 | 1.34 | 305,637 | 1.2 | 1.35 | ||
| Forest–Cropland complexes | 22,867,109 | 1.35 | 744,608 | 2.9 | 3.26 | 1.68 2 | 1,250,941 2 |
| Cropland–Grassland complexes | 42,505,828 | 2.51 | 2,174,056 | 8.5 | 5.11 | ||
| Total | 1,695,368,583 | 100.0 | 25,716,122 | 100 | 1.52 | ||
Publisher’s Note: MDPI stays neutral with regard to jurisdictional claims in published maps and institutional affiliations. |
© 2022 by the authors. Licensee MDPI, Basel, Switzerland. This article is an open access article distributed under the terms and conditions of the Creative Commons Attribution (CC BY) license (https://creativecommons.org/licenses/by/4.0/).
Share and Cite
Ostroukhov, A.; Klimina, E.; Kuptsova, V.; Naito, D. Estimating Long-Term Average Carbon Emissions from Fires in Non-Forest Ecosystems in the Temperate Belt. Remote Sens. 2022, 14, 1197. https://0-doi-org.brum.beds.ac.uk/10.3390/rs14051197
Ostroukhov A, Klimina E, Kuptsova V, Naito D. Estimating Long-Term Average Carbon Emissions from Fires in Non-Forest Ecosystems in the Temperate Belt. Remote Sensing. 2022; 14(5):1197. https://0-doi-org.brum.beds.ac.uk/10.3390/rs14051197
Chicago/Turabian StyleOstroukhov, Andrey, Elena Klimina, Viktoriya Kuptsova, and Daisuke Naito. 2022. "Estimating Long-Term Average Carbon Emissions from Fires in Non-Forest Ecosystems in the Temperate Belt" Remote Sensing 14, no. 5: 1197. https://0-doi-org.brum.beds.ac.uk/10.3390/rs14051197