
Developing Hyperspectral Indices for Assessing Seasonal Variations in the Ratio of Chlorophyll to Carotenoid in Deciduous Forests

1
Graduate School of Science and Technology, Shizuoka University, Shizuoka 422-8529, Japan
2
Faculty of Agriculture, Shizuoka University, Shizuoka 422-8529, Japan
*
Author to whom correspondence should be addressed.
Remote Sens. 2022, 14(6), 1324; https://0-doi-org.brum.beds.ac.uk/10.3390/rs14061324
Submission received: 26 January 2022
/
Revised: 27 February 2022
/
Accepted: 7 March 2022
/
Published: 9 March 2022
(This article belongs to the Special Issue Hyperspectral Remote Sensing of Vegetation Functions)
Abstract
:Leaf pigments are sensitive to various stress conditions and senescent stages. Variation in the ratio of chlorophyll to carotenoid content provides valuable insights into the understanding of the physiological and phenological status of plants in deciduous forests. While the use of spectral indices to assess this ratio has been attempted previously, almost all indices were derived indirectly from those developed for chlorophyll and carotenoid contents. Furthermore, there has been little focus on the seasonal dynamics of the ratio, which is a good proxy for leaf senescence, resulting in only a few studies ever being carried out on tracing the ratio over an entire growing season by using spectral indices. In this study, we developed a novel hyperspectral index for tracing seasonal variations of the ratio in deciduous forests, based on a composite dataset of two field measurement datasets from Japan and one publicly available dataset (Angers). Various spectral transformations were employed during this process in order to identify the most robust hyperspectral index. The results show that the wavelength difference (D) type index, using wavelengths of 540 and 1396 nm (calculated from the transformed spectra that were preprocessed by the combination of extended multiplicative scatter correction (EMSC) and first-order derivative), exhibited the highest accuracy for the estimation of the chlorophyll/carotenoid ratio (R2 = 0.57, RPD = 1.52). Further evaluation revealed that the index maintained a good performance at different seasonal stages and can be considered a useful proxy for the ratio in deciduous species. These findings provide a basis for the usage of hyperspectral information in the assessment of vegetation functions. Although promising, extensive evaluations of the proposed index are still required for other functional types of plants.
1. Introduction
Plant pigments are crucial determinants in driving plant photosynthesis through light capture and conversion [1,2,3] and are involved in a series of physiological and biochemical processes necessary for plant growth [4,5,6]. Investigations into quantifying the amount of leaf pigments, including chlorophyll and carotenoid, have been conducted extensively, both in the field and via modeling studies [7,8,9]; however, the proportions between the two have been less studied. A number of previous studies have indicated that knowledge of the proportion of the leaf chlorophyll and carotenoid content can be more beneficial than the amount of individual pigments in determining plants’ physiological status, since it has become a good indicator for evaluating plant senescence and stress [10,11,12]. Thus, the ratio provides critical information for quantifying the functioning of terrestrial ecosystems [13,14,15,16].
The ratio of chlorophyll to carotenoid content varies for different environments [17,18,19,20], particularly with light conditions, which have been extensively demonstrated in different species [21,22,23,24]. Generally, the chlorophyll/carotenoid ratio in leaves with high light irradiance is lower when compared to leaves with low light irradiance [25,26]. It is also notable that the ratio varies between different species [27,28]. For example, Villa et al. [28] indicated that the chlorophyll/carotenoid ratio diverges strongly at species level across macrophyte species. What is more, considerable seasonal variations in the ratio of chlorophyll to carotenoid have been reported in deciduous forests. Yang et al. [29] demonstrated that the ratio of chlorophyll to carotenoid increased during the early seasons and then steadily declined in two temperate deciduous forests; such seasonal variations in the chlorophyll/carotenoid ratio were also detected in other forest types [30,31,32].
Traditional destructive sampling approaches do not satisfy the high frequency required to keep pace with the dynamics and variability of the ratio. Alternatively, non-destructive estimations of the wide variations in chlorophyll and carotenoid content using spectroscopic techniques have become feasible due to the well-known absorption features of chlorophyll and carotenoid in the visible regions [33,34]. Accordingly, numerous studies have demonstrated the retrieval of chlorophyll and carotenoid content via a large number of remote sensing methods, ranging from the empirical relationships between pigments and reflectance to radiative transfer models [35,36,37]. Among these, a common and successfully used approach is the use of remotely-sensed spectral indices, which employ multiple bands inside the visible and near-infrared spectral regions [38,39,40,41,42]. For instance, Main et al. [43] found that the vegetation indices based on red-edge derivatives had the strongest correlation with leaf chlorophyll content, while Hernández-Clemente et al. [44] found that the indices using a simple ratio type are sensitive to carotenoid content. These studies clearly demonstrated the feasibility of estimating different pigments with spectral indices. Thus, non-destructive methods that remotely quantify the proportion of leaf chlorophyll and carotenoid may enhance our understanding of plant functions across different temporal and spatial scales.
However, despite the successful application of spectral indices for retrieving both chlorophyll and carotenoids, very few studies have been conducted on the estimation of the ratio of chlorophyll to carotenoid using empirical spectral indices. All of the currently available studies naturally begin with the spectral indices of chlorophyll and carotenoids, in order to assess the ratio. For instance, Peñuelas et al. [45] proposed a normalized pigment chlorophyll ratio index (NPCI) to estimate the ratio of total pigments to chlorophyll in nitrogen and water-limited sunflower leaves. Peñuelas et al. [46] further observed the structure insensitive pigment index (SIPI) at the wavelengths of 445 and 680 nm, which could be employed for the estimation of the carotenoids/chlorophyll a. Merzlyak et al. [10] indicated that the plant senescence reflectance index (PSRI) using the wavelengths of 678, 500, and 750 nm is sensitive to the ratio of carotenoid to chlorophyll content and could be used as an important indicator of leaf senescence. In addition, Zhou et al. [47] proposed a new spectral index through the combination of the carotenoid index (CARI) [48] and the red-edge chlorophyll index (CIred-edge) [49], to assess the ratio of carotenoid to chlorophyll content, thereby monitoring a crop’s physiological and phenological status. Such studies have advanced the possibility of estimating the ratio between carotenoid and chlorophyll content from spectral indices. On the other hand, several other studies found a correlation between the photochemical reflectance index (PRI), an indicator of photosynthetic efficiency, and the carotenoid/chlorophyll ratio [37,50,51]. In particular, Gitelson et al. [52] found that PRI is better correlated with the carotenoid/chlorophyll ratio than with total chlorophyll and carotenoid content, suggesting that the ratio should, rather, be assessed independently. Furthermore, almost all of these studies focused on specific periods and the feasibility of using hyperspectral indices for tracking the dynamics of the ratio at different phenological stages has not yet been assessed.
Deciduous forest is one of the major vegetation types in Japan and can be characterized by the profound plant phenological stages of expansion, maturation, and senescence [53,54,55], which determine the potential photosynthetic carbon uptake in the growing season of a given ecosystem [56,57,58]. A leaf’s biophysical, biochemical, and physiological characteristics (as well as its spectral properties in this type of forest) vary considerably throughout the seasons [59,60], especially its pigments. Chlorophyll degradation is accompanied by an increase in carotenoids during leaf senescence [61,62], which leads to the ratio being the proxy for tracking leaf senescence [10]. However, to the best of our knowledge, very few studies have treated the ratio independently to date, and directly pursued a remote sensing index using hyperspectral information. Consequently, developing a new spectral index that is able to quantify the ratio accurately and robustly, and more importantly, is able to trace its seasonal dynamics, is in demand.
Developing an index from hyperspectral information has often been carried out from the various biophysical and biochemical parameters of leaves [63,64]. In this study, we followed the methodology demonstrated in Jin et al. [65] for developing new types of indices. Furthermore, since spectral transformations of hyperspectral reflectance have been commonly applied when estimating vegetation characteristics from spectral information [65,66], we have explored those representative transformations explicitly in order to identify the best-performing indices. Among them, the spectral derivatives transform is the most commonly used, due to its potential for removing baseline effects and eliminating the influences of background information on the spectral characteristics of targets, thereby amplifying absorption features and obviously enhancing the correlations between the spectral reflectance and target variables [67,68,69]. In addition, standard normal variate (SNV), multiplicative scatter correction (MSC), and extended multiplicative scatter correction (EMSC) have been reported to be capable of removing the effects caused by light scattering and baseline shift in the spectra [70,71,72]. Besides the aforementioned individual transformations, we have also examined the combinations of different transformation techniques.
Hence, the specific objectives of this study are (1) to evaluate the performance of previously reported spectral indices in estimating the chlorophyll/carotenoid ratio; (2) to explore the effects of pre-processing and transformations of spectra for developing a new hyperspectral index; and (3) to develop a robust spectral index that is able to trace the seasonal dynamics of the ratio of chlorophyll to carotenoid, and thus provide a quick approach for assessing vegetation functions.
2. Materials and Methods
2.1. The Composite Dataset
This study has combined the field measurement data obtained from two cool temperate deciduous forests (Naeba Mountain and Nakakawane) in Japan. The full descriptions of these two sites can be found in the studies of Wang et al. [55] and Jin et al. [65], respectively. Briefly, synchronized data pairs of leaf pigments (chlorophyll and carotenoid content) and reflectance collected in 2008 and 2009 from the dominant species of Fagus crenata Blume in Naeba, and from several species (Acer shirasawanum Koidz, Betula grossa Siebold & Zucc., Stewartia pseudocamellia Maxim., Stewartia monadelpha Siebold & Zucc., Carpinus tschonoskii Maxim., and Fagus crenata Blume) in 2017, 2018, and 2019 in Nakakawane were used in this study. These two datasets contain the data covering the entire growing season, which generally runs from May to October, thus enabling investigations across different phenological stages [55,73]. In this study, only fully sunlit portions of the uppermost tree crowns (a total of 243 samples) were used for further analysis. Leaf reflectance from 350–2500 nm was measured with the ASD FieldSpec spectroradiometers (Analytical Spectral Devices Inc., Boulder, CO, USA) equipped with the leaf clip, while the chlorophyll and carotenoid contents of each leaf were taken for spectral analysis, which was determined using a dual-beam scanning ultraviolet-visible spectrophotometer (Ultrospec 3300 pro, Amersham Biosciences, Piscataway, NJ, USA). However, the carotenoid in the Naeba dataset was measured using an HPLC system (Shimazu, Japan). The ratio of chlorophyll (Chl) to carotenoid (Car) content (Chl/Car) was then calculated.
In addition to field-based datasets, the publicly available Angers dataset (http://opticleaf.ipgp.fr/, last accessed on 21 December 2021), which contains simultaneously measured leaf-level chlorophyll, carotenoid, and spectral reflectance from temperate plants in 2003, was also used in this study. In this dataset, the reflectance spectra were measured from 400 nm to 2450 nm using ASD FieldSpec instruments with a sampling resolution of 1.4 nm (for the region 400 to 1050 nm) and 2 nm (for the region 1000 to 2450 nm). The leaf chlorophyll a, chlorophyll b, and carotenoid for each sample was determined according to the methods of Lichtenthaler [74]. More information on the Angers dataset is provided by Féret et al. [75]. In this study, deciduous tree species were selected from the dataset and a total of 204 samples were adopted for further analysis.
2.2. Spectral Preprocessing Transformations
The marginal ranges of 350–399 nm and 2401–2500 nm were removed from each spectrum, to reduce the noise effects in the original reflectance, leaving the reflectance spectra in the region of 400–2400 nm for further analysis. With the aim of determining the best index for estimating the ratio of chlorophyll to carotenoid, various spectral preprocessing transformations (standard normal variate transformation (SNV), multiplicative scatter correction (MSC), and extended multiplicative scatter correction (EMSC)) were calculated [72,76,77] to correct for scattering effects. Furthermore, the original reflectance spectra (OR) were converted into apparent absorption spectra (Log) using the formula of log (1/OR) for reducing nonlinearities [67]. In addition, the first-order (1st) and second-order (2nd) derivatives transform were also applied in this study and their specific formulas can be found in Wang et al. [54].
2.3. Published Spectral Indices
The capabilities of previously published Chl/Car (or Car/Chl) indices were examined in this study. The selected spectral indices include the photochemical reflectance index (PRI), the normalized pigment chlorophyll ratio index (NPCI), the structure insensitive pigment index (SIPI), the plant senescence reflectance index (PSRI), the carotenoid/chlorophyll ratio index (CCRI), the chlorophyll/carotenoid index (CCI), and the normalized difference vegetation index (NDVI). The details regarding these published spectral indices are shown in Table 1.
2.4. Development of New Hyperspectral Indices
Besides the previously reported vegetation indices, new types of hyperspectral indices were developed to estimate the ratio of Chl to Car. The index types adopted in this study included the reflectance at a given wavelength (R), simple ratio (SR), wavelength difference (D), normalized difference (ND), inverse difference (ID), and double difference (DDn) [66]. Besides this, several modified types of indices were also included in this study, namely, the modified simple ratio 1 (mSR1), modified simple ratio 2 (mSR2), modified normalized difference (mND), and the modified inverse difference (mID) [65]. Their formulas are presented in Table 2. All possible combinations of the wavelengths within the entire wavelength domain for a given index type were examined for their performance based on linear regression analysis.
2.5. Statistical Criteria
Linear regression analysis was used for revealing the relationships between the Chl/Car ratio and spectral indices. The performances of the spectral indices were evaluated based on the statistical criteria of the coefficient of determination (R2), root mean square error (RMSE), and the ratio of performance to deviation (RPD). When RPD < 1.40, the index was recognized as having performed poorly [79].
3. Results
3.1. Leaf Chlorophyll/Carotenoid Ratio of the Composite Dataset
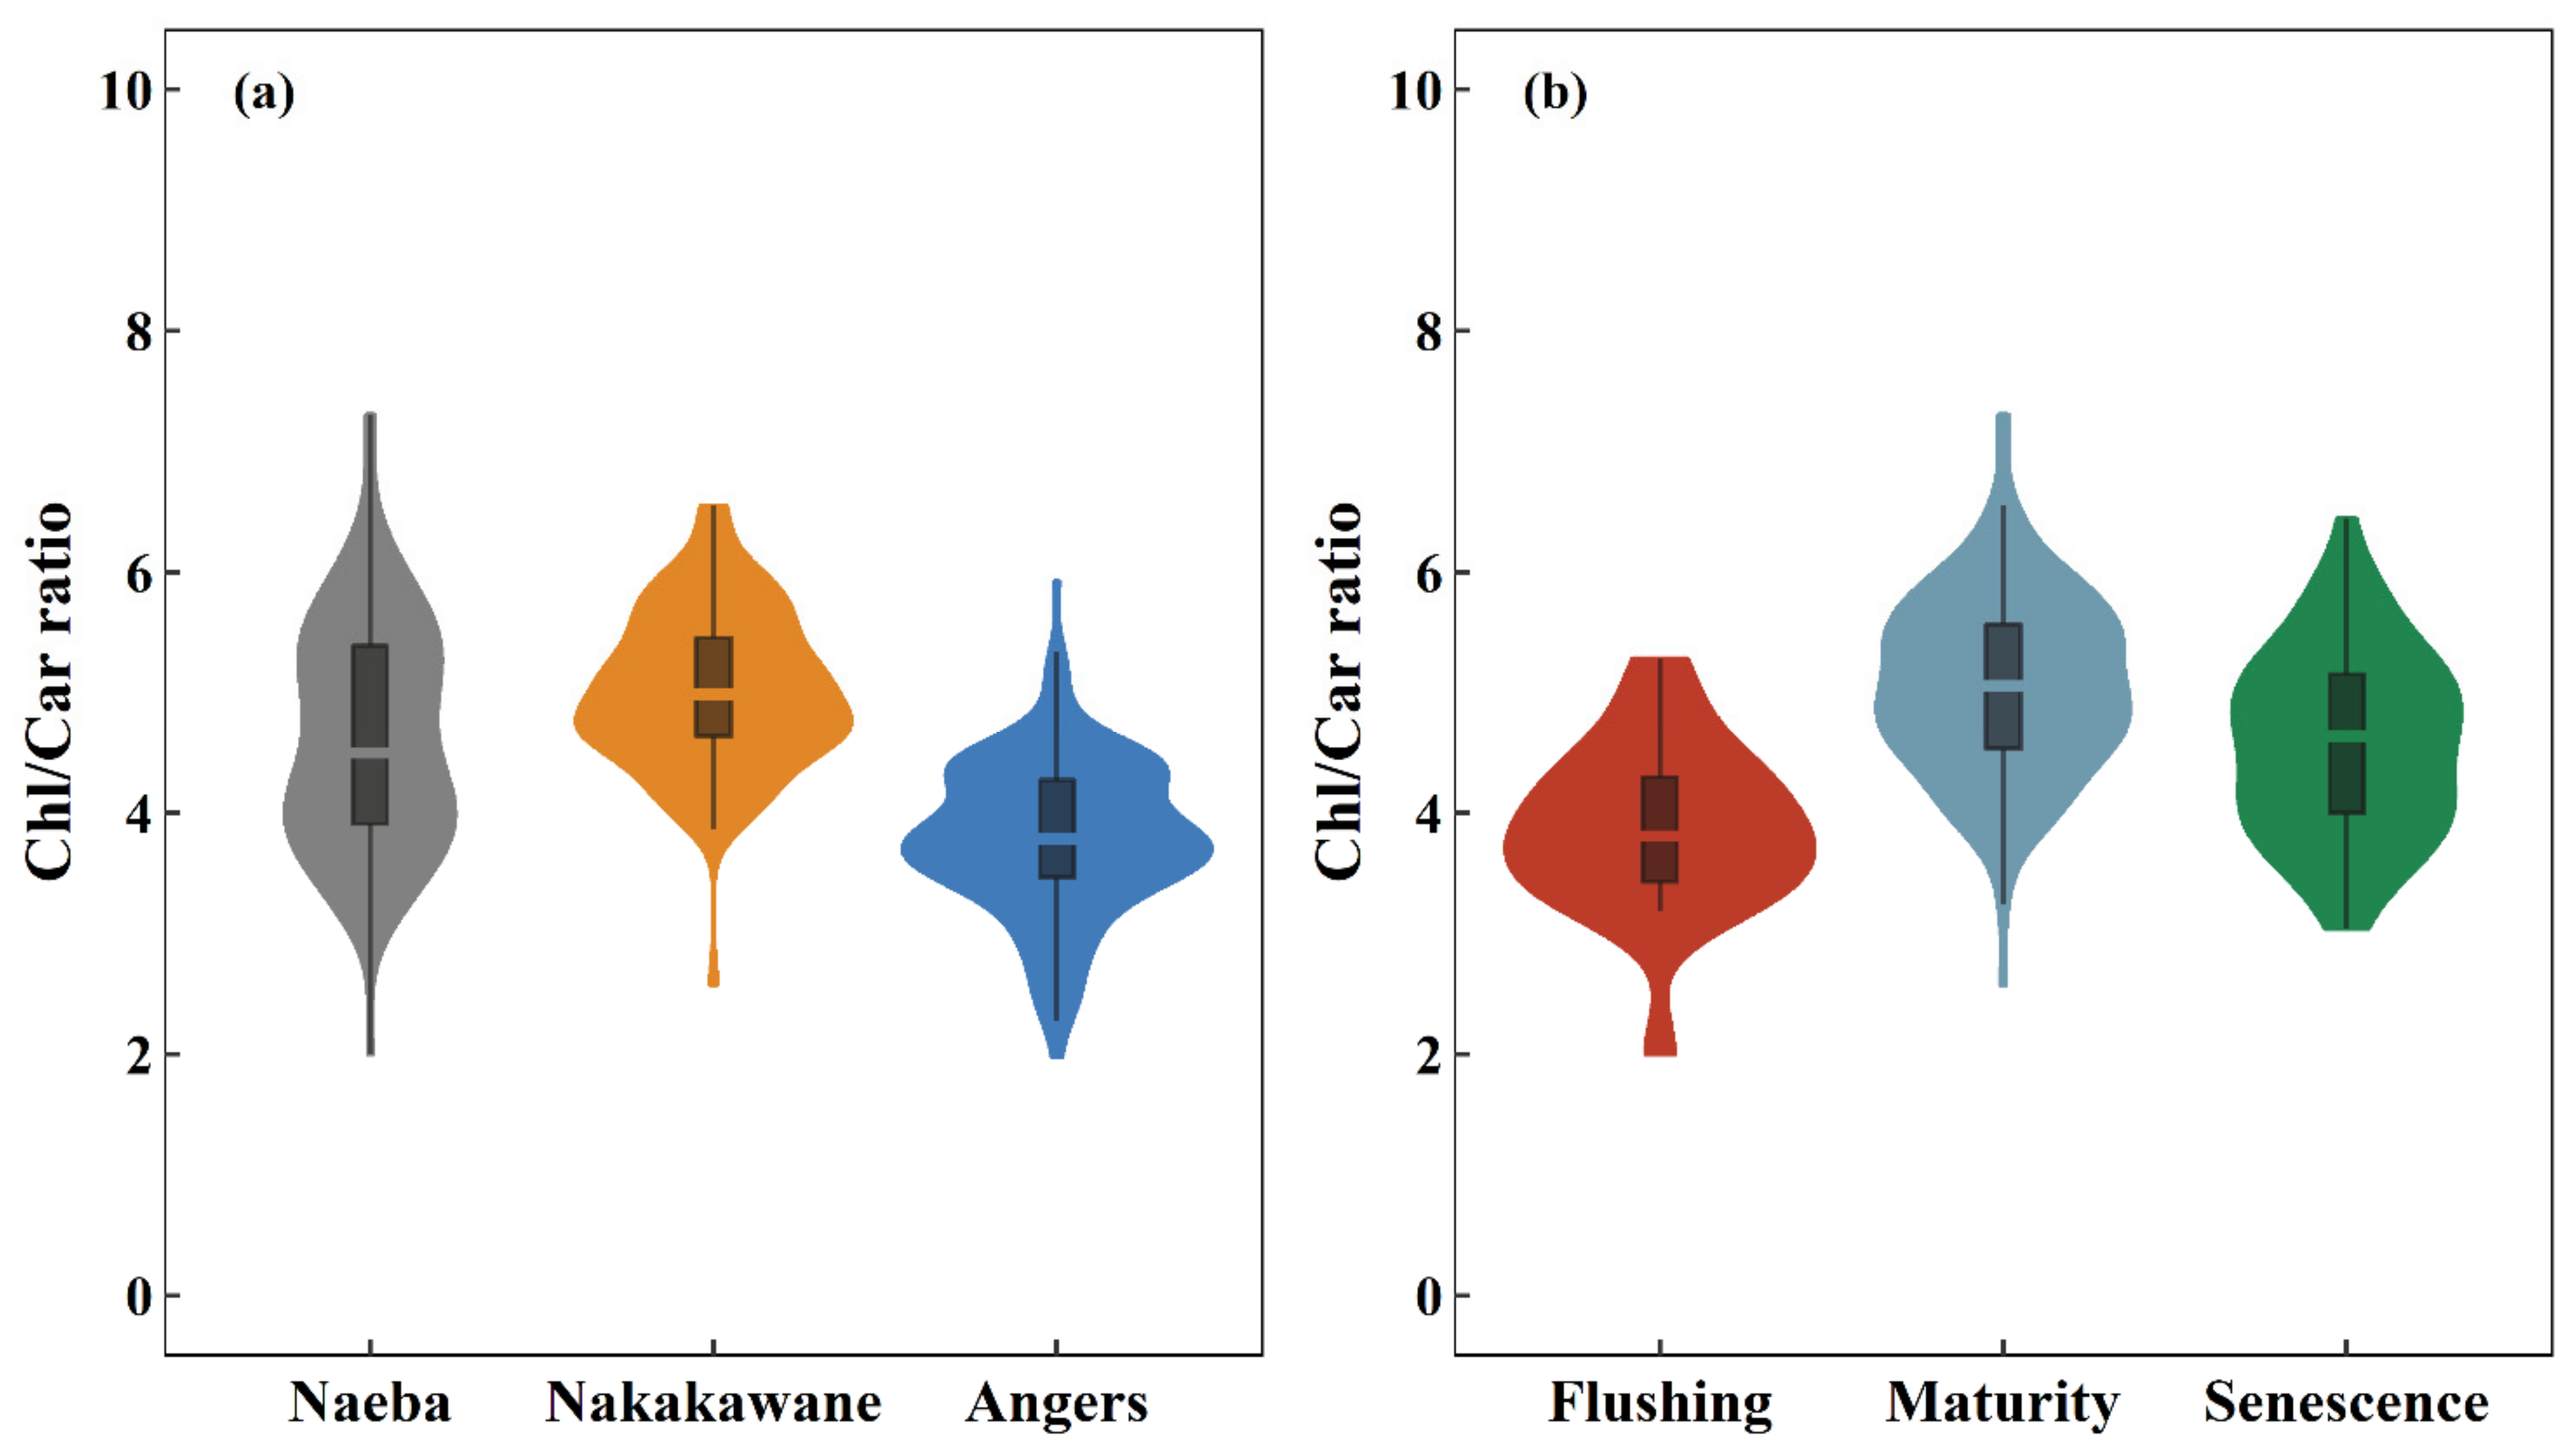
The distribution of the chlorophyll (Chl)/carotenoid (Car) ratio in the two field datasets (Naeba and Nakakawane) and the public dataset (Angers) are presented in Figure 1a. The Chl/Car ratio ranged from 2.00 to 7.31 (mean ± standard deviation (SD): 4.63 ± 0.94) for the Naeba dataset, from 2.58 to 6.55 (mean ± SD: 5.02 ± 0.65) for the Nakakawane dataset, and from 1.98 to 5.92 (mean ± SD: 3.80 ± 0.63) for the Angers dataset. The coefficient of variation (CV, the ratio of the standard deviation to the mean) of these three datasets was 20.21%, 12.93%, and 16.59%, respectively. Furthermore, for the composite dataset, the Chl/Car ratio varied from 1.98 to 7.31 with a mean of 4.35, an SD of 0.90, and a CV of 20.71%. In addition, the Chl/Car ratio during different phenological stages in the two field measurement datasets was also explored (Figure 1b). The Chl/Car ratio reached its highest value in the leaf maturity period (mean ± SD: 5.06 ± 0.75), followed by leaf senescence (mean ± SD: 4.58 ± 0.76) and flushing periods (mean ± SD: 3.87 ± 0.69), with corresponding CV values of 14.74%, 16.59%, and 17.91%, respectively.
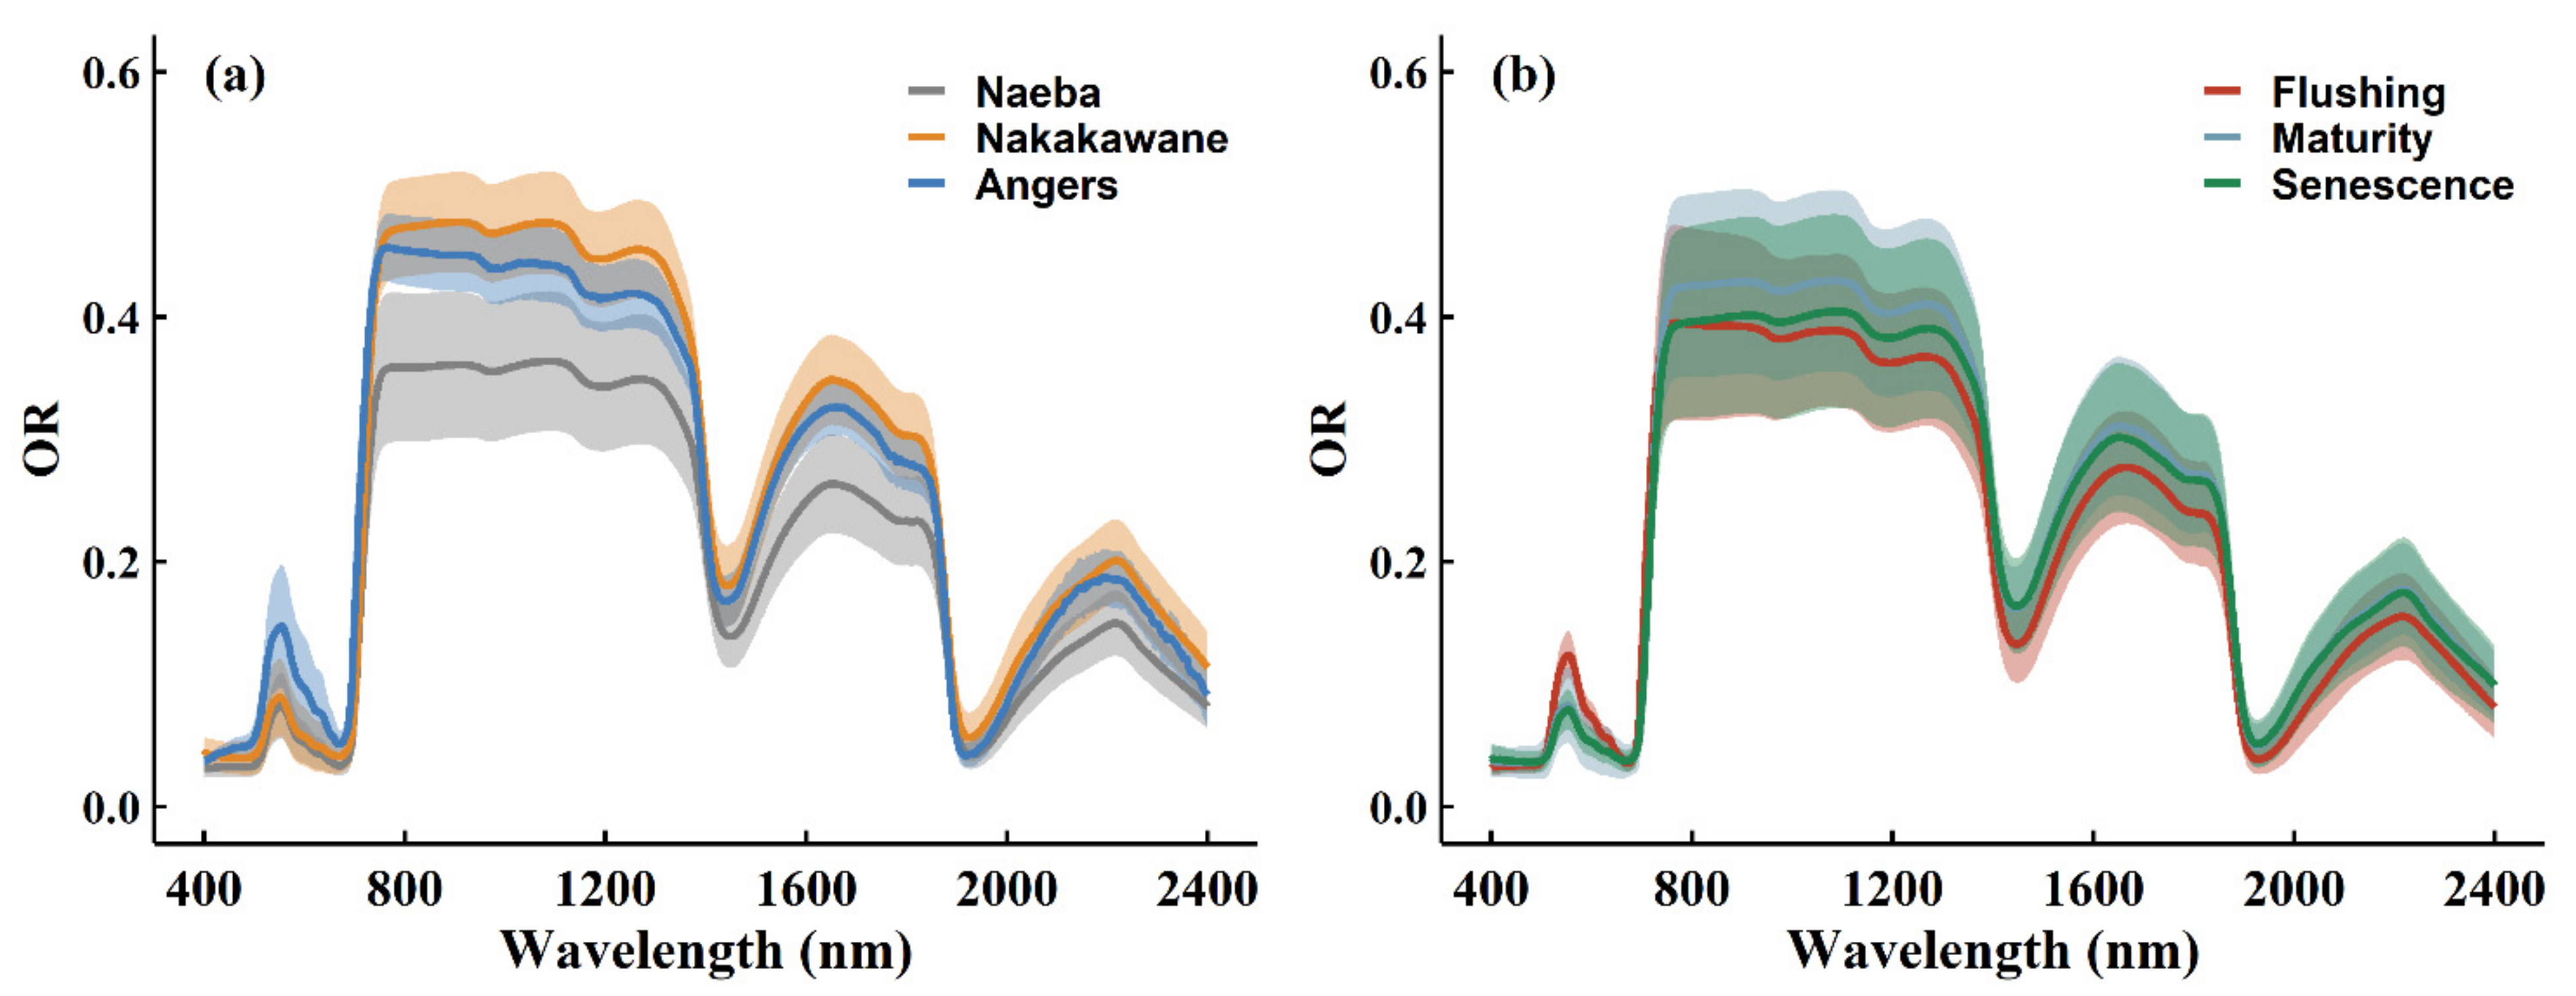
On the other hand, the mean and SD of the corresponding original reflectance (OR) data in these three datasets, and during different phenological stages, are shown in Figure 2. Obvious variations were found over the entire spectral domain, especially the near-infrared spectral regions in the OR data. The mean values of Nakakawane and Angers datasets were higher than that of the Naeba dataset from 780 to 1700 nm. Meanwhile, the reflectance also varied in the leaf flushing, maturity, and senescence stages. The OR data in the flushing stage had higher mean values than the other two stages (approximately 550 nm).
3.2. Evaluation of the Reported Spectral Indices Using the Composite Dataset
The ability of previously published spectral indices (PRI, PSRI, SIPI, NPCI, CCRI, CCI, and NDVI) to quantify the ratio of Chl to Car was investigated in this study, and their performance is shown in Table 3. All of the reported spectral indices performed poorly for individual datasets, the Nakakawane dataset in particular (R2: 0.00–0.13, RPD: 1.00–1.08). Their performance on the Angers dataset (R2: 0.14–0.45, RPD: 1.08–1.35) was relatively better than the Naeba dataset (R2: 0.00–0.43, RPD: 1.01–1.33). The best reported spectral indices for the Chl/Car ratio differed with different datasets: they were CCRI, PRI, and NDVI for the Naeba, Nakakawane, and Angers datasets, respectively. For the combined dataset, all reported spectral indices exhibited relatively poor performances, with the R2 values ranging from 0.01 to 0.36, RMSE ranging from 0.72 to 0.90, and RPD values varying from 1.00 to 1.25. Among the reported indices, CCI had the lowest R2 (0.01) and RPD (1.00) values, while having the highest RMSE value (0.90). Even though the CCRI was more accurate (R2 = 0.36, RMSE = 0.72, and RPD = 1.25) than other indices, it cannot be used to estimate Chl/Car ratio because of its low RPD value (RPD < 1.40).
3.3. Establishment of New Spectral Indices
New types of indices for quantifying the Chl/Car ratio using the leaf reflectance, calculated from different spectral transformations (OR, SNV, MSC, EMSC, Log, 1st derivative, and 2nd derivative), have been developed in this study (Table 4). Among the indices developed using the OR data, the ND had the strongest correlation to the Chl/Car ratio, with an R2 of 0.53, an RMSE of 0.61, and an RPD of 1.47. In comparison, when using the 1st derivative spectra, the best index type was D, which had a slightly higher R2 (0.54) and the same RPD (1.47) values. Furthermore, the accuracy of the estimation of the Chl/Car ratio was relatively lower when the indices were developed from other spectral transformations.
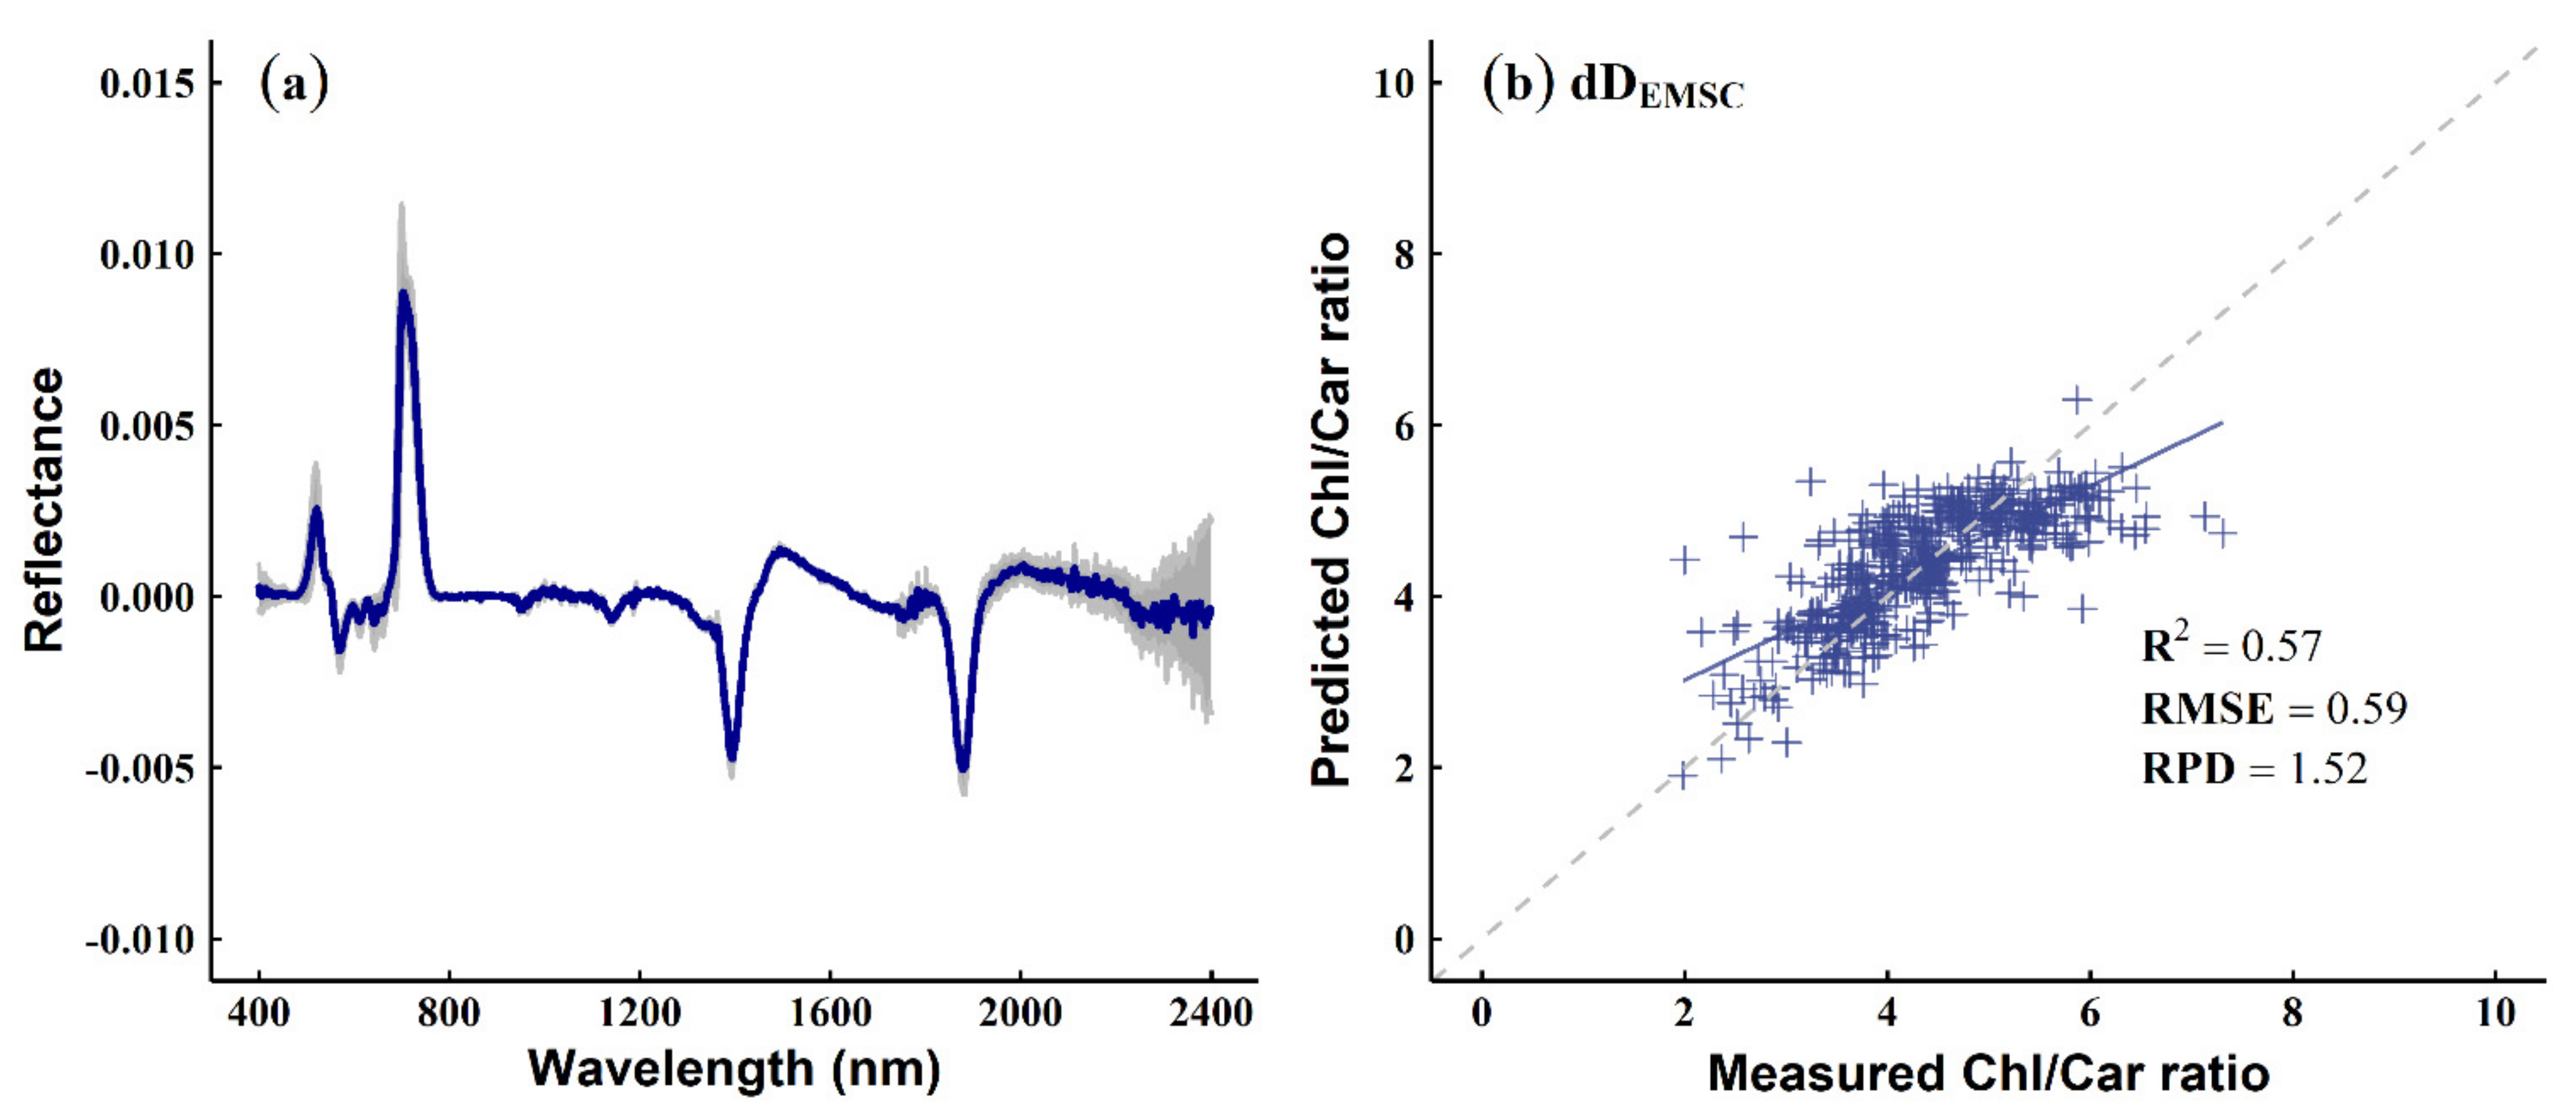
Further combinations of various spectral transformations were attempted during data preprocessing, in order to explore the best index for the Chl/Car ratio. Among all the combinations, the D-type index (dDEMSC), based on the spectral data transformed by the combination of EMSC and 1st derivative (Figure 3a), performed the best, with an R2 of 0.57, RMSE of 0.59, and RPD of 1.52 (Figure 3b). The wavelengths adopted in this index were 540 nm and 1396 nm, respectively.
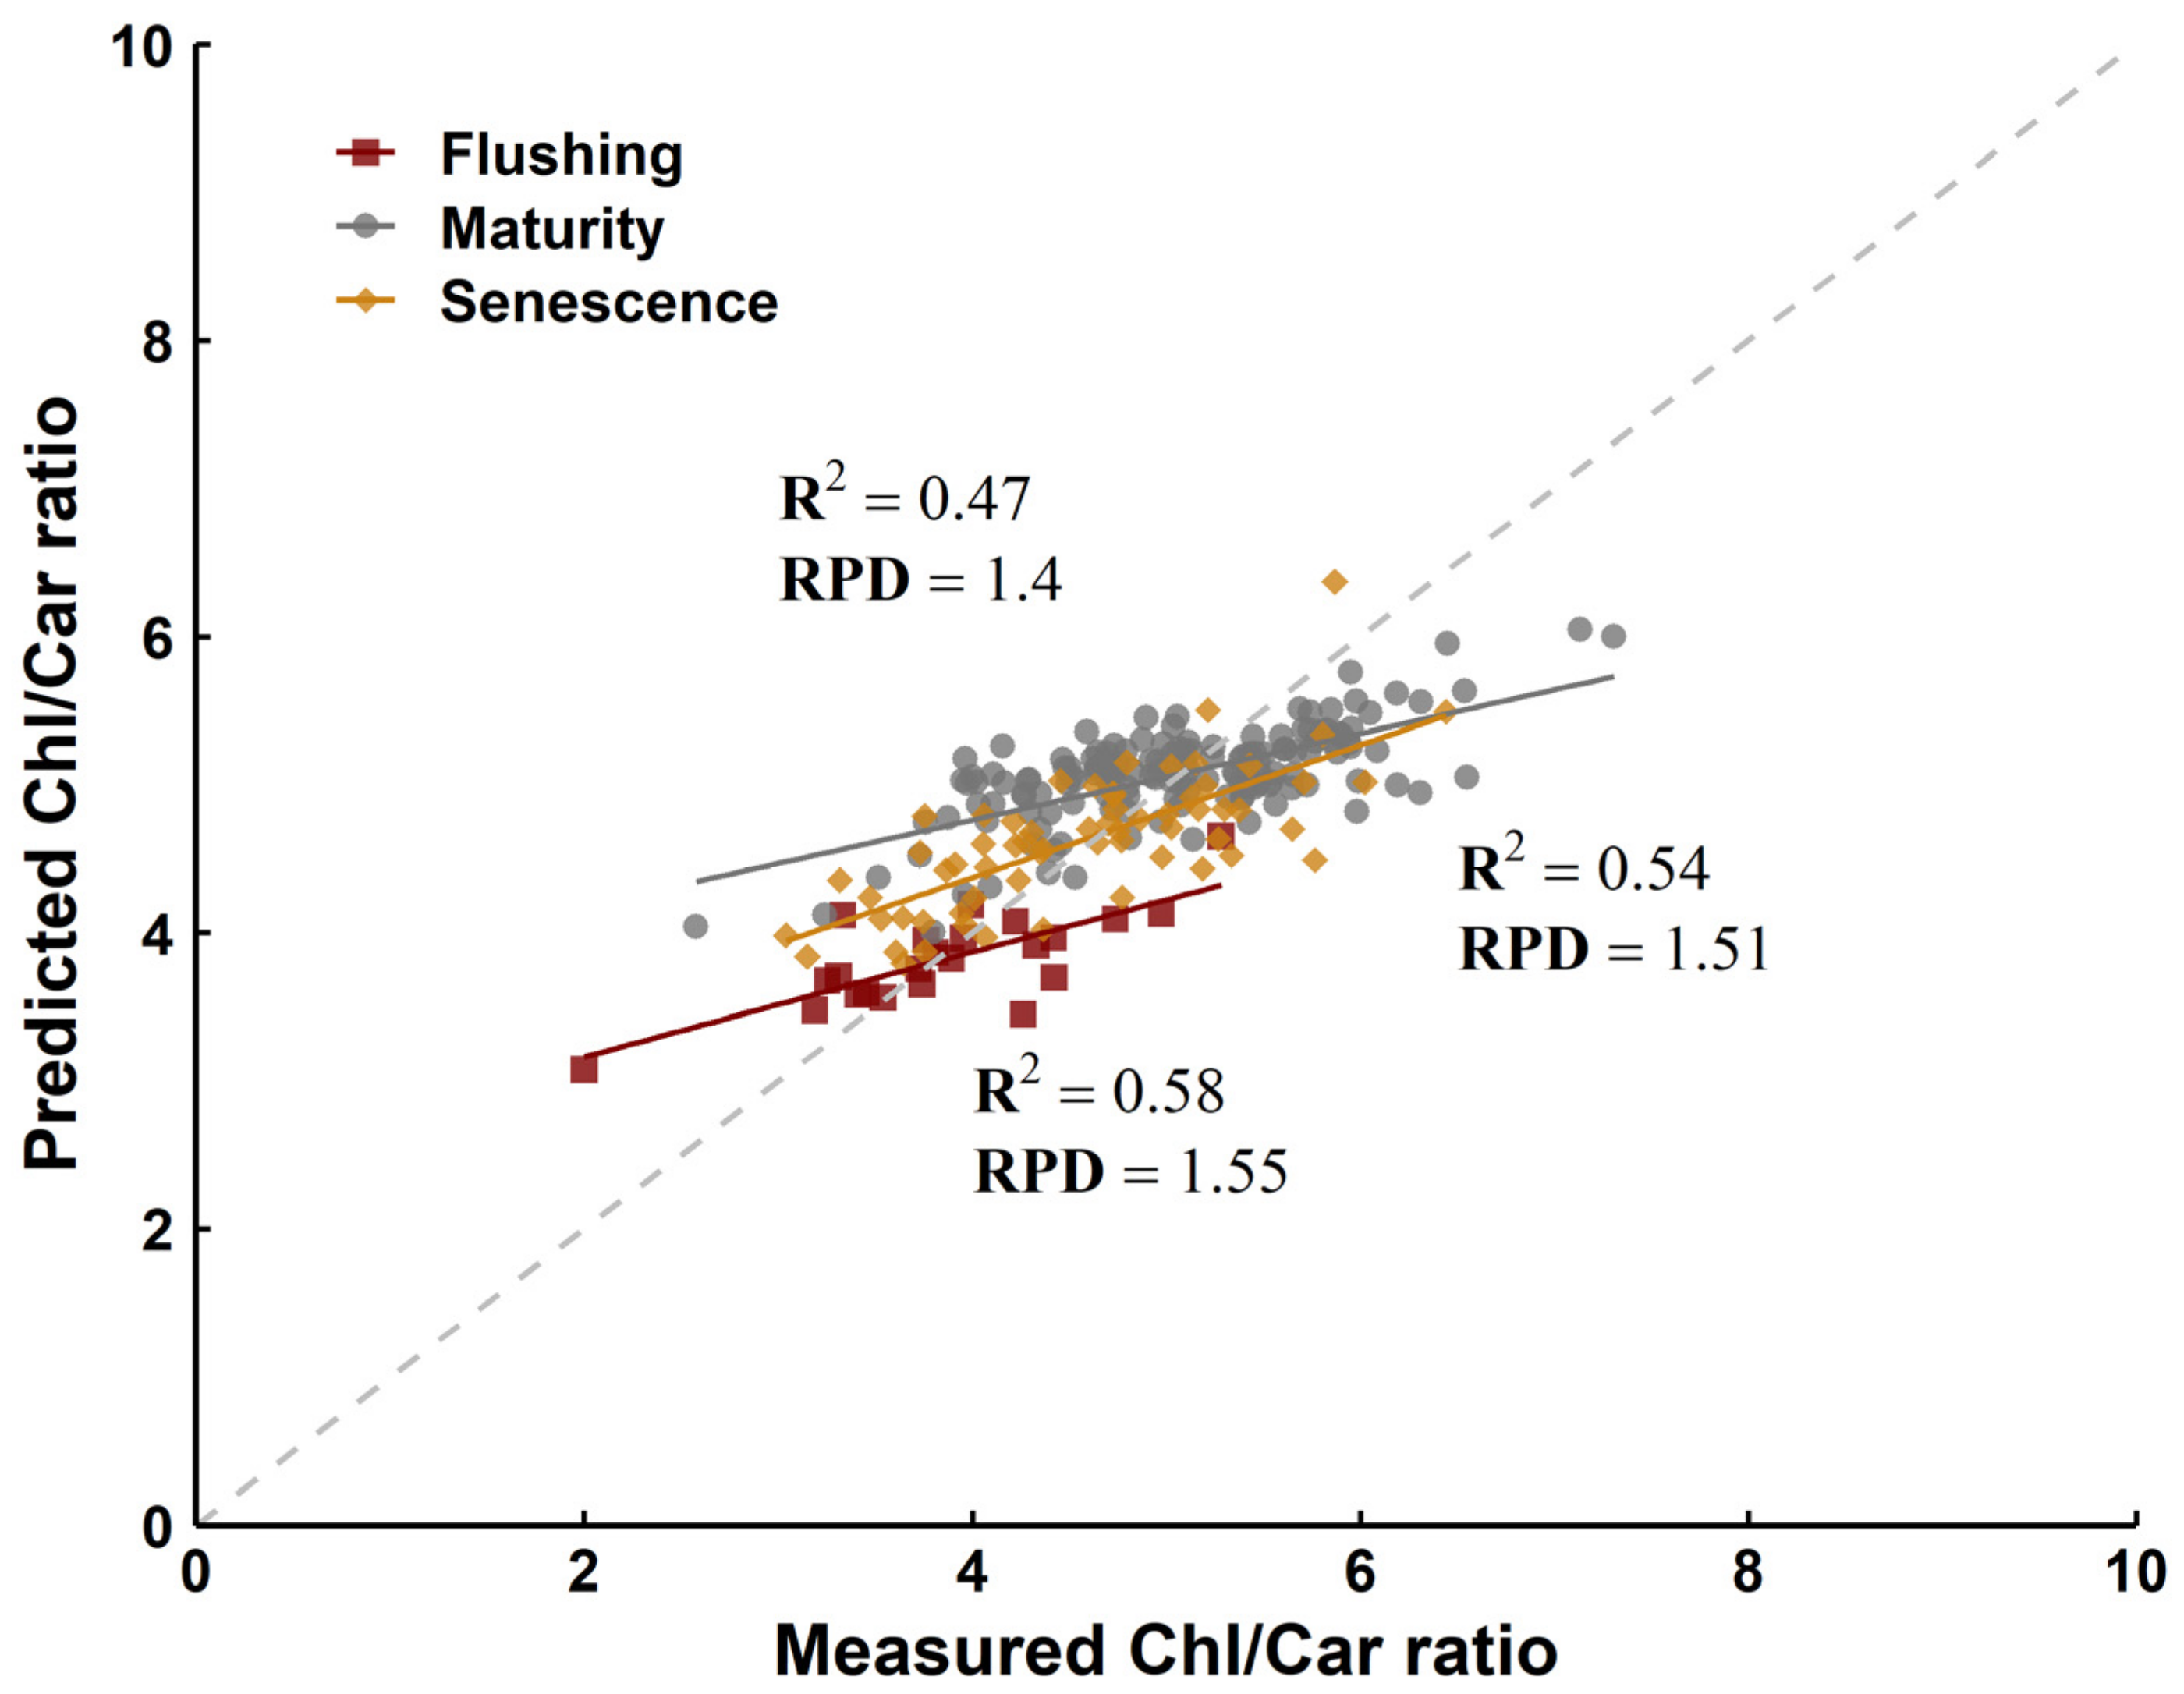
Moreover, this index was further validated by the two field-measured datasets in Japan, which contained various phenological stages, and showed a fair performance (R2 = 0.52, RPD = 1.47). Interestingly, this index exhibited a relatively consistent performance for tracing the Chl/Car ratio in different phenological stages, with R2 values ranging from 0.47 to 0.58 and RPD ranging from 1.40 to 1.55 (Figure 4). Obviously, the highest accuracy for this index in tracing the Chl/Car ratio occurred at the leaf flushing stage (R2 = 0.58, RPD = 1.55), followed by the leaf senescence stage (R2 = 0.54, RPD = 1.51). The lowest tracing accuracy was found during the leaf maturity stage, which had an R2 of 0.47 and an RPD of 1.40. Although not good, the index is still applicable if judged by the RPD value (≥1.40).
4. Discussion
4.1. Inapplicability of Published Indices Suggest the Ratio Should Be Investigated Independently
In this study, the feasibility of using previously reported spectral indices to estimate the Chl/Car ratio using a composite dataset of field measurements in two cool temperate deciduous forests and the public Angers dataset, has been validated. Notably, none of the published spectral indices performed well in our study; even the best one (CCRI) only achieved a low R2 (0.36) and a low RPD (1.25). This index was proposed by Zhou et al. [47] and it combines the carotenoid index and the red-edge chlorophyll index, which were specifically proposed for carotenoid and chlorophyll assessment, respectively, to estimate the ratio of carotenoid to chlorophyll content in crops. The inapplicability of this index might, at least to some extent, be attributed to the fact that it was not developed directly for this function. but indirectly through the combination of biochemicals. The differences in functional plant types may be another reason. Additionally, the PSRI (another published index for estimating the ratio of carotenoid to chlorophyll, used to track the onset and stage of leaf senescence [10]) similarly showed very poor predictivity. These findings are consistent with those reported in a previous study [47], indicating that the PSRI shows unstable assessment predictivity for the ratio between carotenoid and chlorophyll in various tree species.
As demonstrated in previous studies, the ratio between leaf chlorophyll and carotenoid can be considered as a proxy to track the physiological and phenological status of vegetation [11,46]. However, until now, few studies have ever attempted to develop spectral indices directly for this ratio, primarily due to its non-obvious absorption features in the visible spectral regions. Nevertheless, a few of the studies showed a close relationship between PRI and the ratio [52,80,81], since the changes in the ratio associated with the leaf ages or stress are critical to the changing PRI signal [37,82]. Wong et al. [83] observed that the changes in PRI across the seasons are clearly driven by the variation of carotenoid/chlorophyll ratio rather than the xanthophyll cycle conversion in evergreen conifers, and the PRI could serve as an optical indicator of varying photosynthetic activity [78,84,85]. Unfortunately, our results indicated that the PRI only had a weak correlation with the ratio of Chl to Car. The discrepancy can partly be explained by the role of the ratio between chlorophyll and carotenoid in driving PRI, which should be varied across a wide range of vegetation types, conditions, and time scales [86]. Furthermore, the variations in the de-epoxidation state of the xanthophyll cycle may have an ignorable effect on the correlation between PRI and chlorophyll/carotenoid ratio [50]. Accordingly, the PRI should be applied with caution when estimating the chlorophyll/carotenoid ratio or further assessing photosynthetic efficiency.
Overall, this study proved that the reported spectral indices are not applicable to the estimation of the ratio of chlorophyll to carotenoid, suggesting that a new spectral index is highly desirable. The ratio of chlorophyll to carotenoid is a proxy for leaf senescence, which should be investigated independently by considering the biological behaviors involved more explicitly.
4.2. Evaluations of Developed Indices for Quantifying and Tracking the Ratio of Chlorophyll to Carotenoid
Based on the composite dataset, we developed a new spectral index (dDEMSC) using the combination of EMSC and first-order derivative transformed spectra, which obtained good results for assessing the ratio of chlorophyll to carotenoid. The R2 and RMSE values were 0.57 and 0.59, respectively, and the RPD reached 1.52. Such results indicate that this index is applicable for assessing the chlorophyll/carotenoid ratio in cool temperate deciduous forests. The band combination of this index includes the first wavelength of 540 nm and the second wavelength of 1396 nm. As demonstrated by previous studies, the changes in reflectance of the spectral regions around 540 nm have been shown to be associated with variations in pigments, such as anthocyanins, chlorophyll, and carotenoids [87,88,89]. The wavelength around 1396 nm is characterized as a water-absorption band, providing information on plant water status, and this has been demonstrated in previous studies [90,91]. Varying pigments and water content have been linked to stress or senescence [10,43,92]; this partially explains the feasibility of the index for estimating the chlorophyll/carotenoid ratio and tracking leaf senescence.
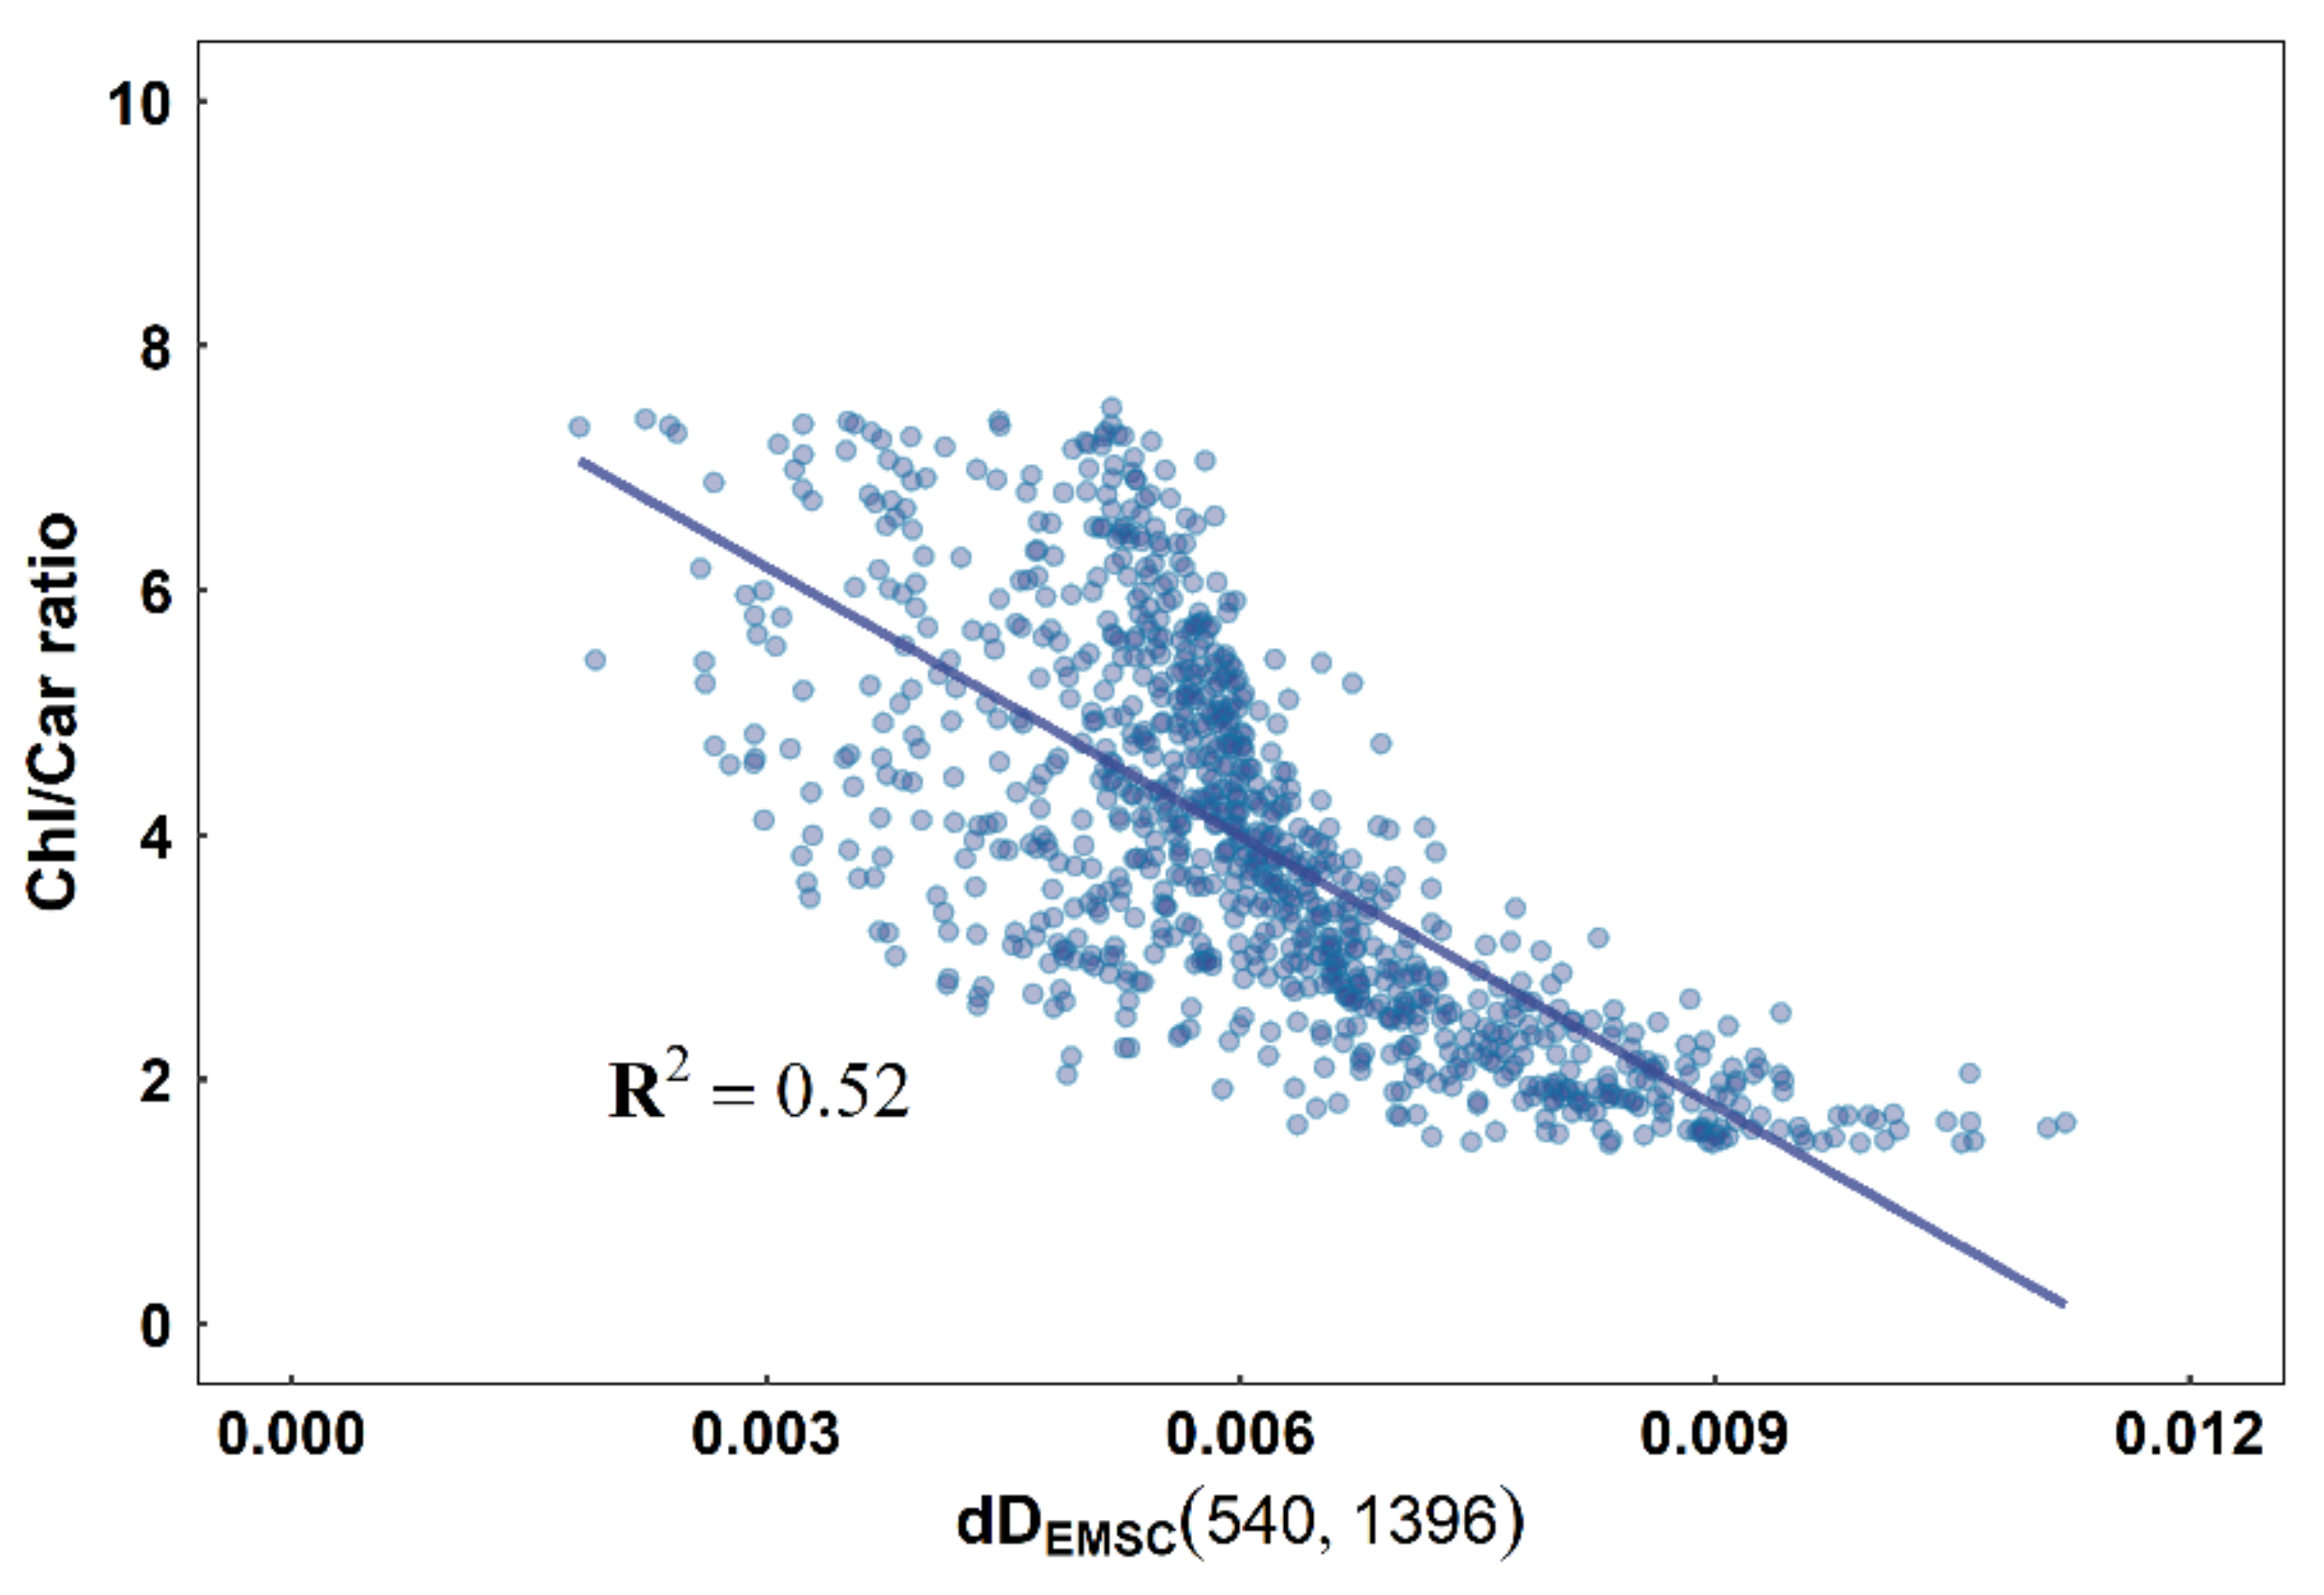
The best index identified for the assessment of chlorophyll/carotenoid ratio was further validated using a simulated dataset generated by PROSPECT 5 [75] (Figure 5). The range of the Chl/Car ratio was set within the average values ± 3 standard deviations in this study. The Chl/Car ratio showed a good linear correlation (R2 = 0.52) with the dDEMSC (540, 1396), which further confirmed the applicability of the index. Overall, on the basis of all the results obtained with the measured and simulated data, the spectral indices have great potential for the assessment of the ratio between chlorophyll and carotenoid content in deciduous species.
4.3. Performance of Different Preprocessing and Transformations for Tracing the Ratio of Chlorophyll to Carotenoid
The combination of EMSC and the first-order derivative proved to be effective for identifying the best spectral indices for assessing the ratio of chlorophyll to carotenoid. As reviewed by Rinnan et al. [70], the EMSC is extended on the basis of MSC, with more elaborate augmentations, and includes prior knowledge about the chemical constituents, thus avoiding loss in using information from the measured spectra [93,94]. For example, Sharma et al. [95] indicated that preprocessing techniques, with expert knowledge of the target or interferents, could improve the predictions of partial least squares regression.
Meanwhile, a large number of previous studies reported very good performance in the use of derivatives on vegetation property estimation in the spectral indices and partial least squares regression [65,96,97], due to their advantage of reducing background effects [68]. The derivatives in this study also performed reasonably well, although not optimally. However, the best index for the chlorophyll/carotenoid ratio was found when the reflectance was preprocessed by combining EMSC and first-order derivative, suggesting the potential for using combinations of preprocessing methods in the reflectance spectra for assessing vegetation functions.
4.4. Future Studies
Vegetation functions are fundamental to understanding ecosystem behavior and they can be evaluated by tracing vegetation characteristics, which are dynamic in nature [98]. Through this study, it is clear that vegetation functions should be investigated independently when using reflected information in order for a better understanding of the interaction of vegetation and environments under current changes in climate. The results obtained in this study may, potentially, provide useful guidance for tracing vegetation functions through the development of a general spectral index. Nevertheless, because the limited datasets continue to provide synchronous spectral information and vegetation functions, simulation datasets are required to detect the general indicators. Unfortunately, models that have the ability to simulate both spectral responses and vegetation functions are not yet sophisticated enough to produce realistic simulations. This is a bottleneck that should be thoroughly addressed in the future. Furthermore, the ratio of chlorophyll to carotenoid may behave differently in different species, various plant functional types, and/or different environmental conditions, and this study has only explored deciduous species. Spectral indices, in general, face limitations in terms of robustness and portability, for which the associations between spectral indices and vegetation characteristics elucidated from a restricted dataset are difficult to apply to other datasets. Consequently, more extensive validations in other species and conditions should be carried out in future studies.
5. Conclusions
This study demonstrates the ability of spectral indices to remotely detect the ratio of chlorophyll to carotenoid with seasonal changes in deciduous forests. The newly developed D-type index combined with extended multiplicative signal correction and first-order derivative spectra gave the most accurate estimation of the chlorophyll/carotenoid ratio in the combined datasets measured. The capability and feasibility of using D-type index spectral indices were compared with previously published, associated spectral indices and were validated for different phenological stages. Overall, the variations in the chlorophyll/carotenoid ratio can be captured accurately by spectral indices, which can therefore act as proxies for photosynthetic activity.
Author Contributions
Q.W. designed this study. G.S. carried out the analyses. G.S. and Q.W. wrote the manuscript. All authors have read and agreed to the published version of the manuscript.
Funding
This research was supported by the JSPS project (Grant No. 21H02230).
Institutional Review Board Statement
Not applicable.
Informed Consent Statement
Not applicable.
Data Availability Statement
The data that support the findings of this study are available on request from the corresponding author.
Acknowledgments
The authors would like to express their gratitude to the members of the Laboratory of Macroecology and the Institute of Silviculture, Shizuoka University, for their support in conducting both fieldwork and laboratory analyses.
Conflicts of Interest
The authors declare no conflict of interest.
References
- Li, Y.; He, N.; Hou, J.; Xu, L.; Liu, C.; Zhang, J.; Wang, Q.; Zhang, X.; Wu, X. Factors Influencing Leaf Chlorophyll Content in Natural Forests at the Biome Scale. Front. Ecol. Evol. 2018, 6, 64. [Google Scholar] [CrossRef] [Green Version]
- Ritz, T.; Damjanović, A.; Schulten, K.; Zhang, J.P.; Koyama, Y. Efficient Light Harvesting through Carotenoids. Photosynth. Res. 2000, 66, 125–144. [Google Scholar] [CrossRef] [PubMed]
- Walker, B.J.; Drewry, D.T.; Slattery, R.A.; VanLoocke, A.; Cho, Y.B.; Ort, D.R. Chlorophyll Can Be Reduced in Crop Canopies with Little Penalty to Photosynthesis. Plant Physiol. 2018, 176, 1215–1232. [Google Scholar] [CrossRef] [PubMed] [Green Version]
- Blackburn, G.A. Hyperspectral Remote Sensing of Plant Pigments. J. Exp. Bot. 2007, 58, 855–867. [Google Scholar] [CrossRef] [PubMed] [Green Version]
- Demmig-Adams, B. Survey of Thermal Energy Dissipation and Pigment Composition in Sun and Shade Leaves. Plant Cell Physiol. 1998, 39, 474–482. [Google Scholar] [CrossRef]
- Fang, Z.; Bouwkamp, J.C.; Solomos, T. Chlorophyllase Activities and Chlorophyll Degradation during Leaf Senescence in Non-Yellowing Mutant and Wild Type of Phaseolus Vulgaris L. J. Exp. Bot. 1998, 49, 503–510. [Google Scholar]
- Asner, G.P.; Martin, R.E.; Ford, A.J.; Metcalee, D.J.; Liddell, M.J. Leaf Chemical and Spectral Diversity in Australian Tropical Forests. Ecol. Appl. 2009, 19, 236–253. [Google Scholar] [CrossRef]
- Curran, P.J.; Windham, W.R.; Gholz, H.L. Exploring the Relationship between Reflectance Red Edge and Chlorophyll Concentration in Slash Pine Leaves. Tree Physiol. 1990, 7, 33–48. [Google Scholar] [CrossRef]
- Ustin, S.L.; Gitelson, A.A.; Jacquemoud, S.; Schaepman, M.; Asner, G.P.; Gamon, J.A.; Zarco-Tejada, P. Retrieval of Foliar Information about Plant Pigment Systems from High Resolution Spectroscopy. Remote Sens. Environ. 2009, 113, S67–S77. [Google Scholar] [CrossRef] [Green Version]
- Merzlyak, M.N.; Gitelson, A.A.; Chivkunova, O.B.; Rakitin, V.Y. Non-Destructive Optical Detection of Pigment Changes during Leaf Senescence and Fruit Ripening. Physiol. Plant. 1999, 106, 135–141. [Google Scholar] [CrossRef] [Green Version]
- Filimon, R.V.; Rotaru, L.; Filimon, R.M. Quantitative Investigation of Leaf Photosynthetic Pigments during Annual Biological Cycle of Vitis Vinifera L. Table Grape Cultivars. S. Afr. J. Enol. Vitic. 2016, 37, 1–14. [Google Scholar] [CrossRef] [Green Version]
- Solovchenko, A. Photoprotection in Plants: Optical Screening-Based Mechanisms; Springer: New York, NY, USA, 2010. [Google Scholar]
- Croft, H.; Chen, J.M.; Froelich, N.J.; Chen, B.; Staebler, R.M. Seasonal Controls of Canopy Chlorophyll Content on Forest Carbon Uptake: Implications for GPP Modeling. J. Geophys. Res. Biogeosci. 2015, 120, 1576–1586. [Google Scholar] [CrossRef] [Green Version]
- Gitelson, A.A.; Keydan, G.P.; Merzlyak, M.N. Three-Band Model for Noninvasive Estimation of Chlorophyll, Carotenoids, and Anthocyanin Contents in Higher Plant Leaves. Geophys. Res. Lett. 2006, 33, 2–6. [Google Scholar] [CrossRef] [Green Version]
- Li, Y.; Liu, C.; Zhang, J.; Yang, H.; Xu, L.; Wang, Q.; Sack, L.; Wu, X.; Hou, J.; He, N. Variation in Leaf Chlorophyll Concentration from Tropical to Cold-Temperate Forests: Association with Gross Primary Productivity. Ecol. Indic. 2018, 85, 383–389. [Google Scholar] [CrossRef]
- Ustin, S.L.; Roberts, D.A.; Gamon, J.A.; Asner, G.P.; Green, R.O. Using Imaging Spectroscopy to Study Ecosystem Processes and Properties. Bioscience 2004, 54, 523–534. [Google Scholar] [CrossRef]
- Ormrod, D.P.; Lesser, V.M.; Olszyk, D.M.; Tingey, D.T. Elevated Temperature and Carbon Dioxide Affect Chlorophylls and Carotenoids in Douglas-Fir Seedlings. Int. J. Plant Sci. 1999, 160, 529–534. [Google Scholar] [CrossRef]
- Qiu, T.; Jiang, L.L.; Li, S.Z.; Yang, Y.F. Small-Scale Habitat-Specific Variation and Adaptive Divergence of Photosynthetic Pigments in Different Alkali Soils in Reed Identified by Common Garden and Genetic Tests. Front. Plant Sci. 2017, 7, 2016. [Google Scholar] [CrossRef] [Green Version]
- Rosevear, M.J.; Young, A.J.; Johnson, G.N. Growth Conditions Are More Important than Species Origin in Determining Leaf Pigment Content of British Plant Species. Funct. Ecol. 2001, 15, 474–480. [Google Scholar] [CrossRef]
- Ivanov, L.A.; Ivanova, L.A.; Ronzhina, D.A.; Yudina, P.K. Changes in the Chlorophyll and Carotenoid Contents in the Leaves of Steppe Plants along a Latitudinal Gradient in South Ural. Russ. J. Plant Physiol. 2013, 60, 812–820. [Google Scholar] [CrossRef]
- Casierra-posada, F.; Peña-olmos, J.E.; Zapata-casierra, E. Pigment Content in Strawberry Leaves (Fragaria sp.) Exposed to Different Light Quality. Rev. UDCA Actual. Divulg. Cient. 2014, 17, 87–94. [Google Scholar]
- Lichtenthaler, H.K. Biosynthesis, Accumulation and Emission of Carotenoids, α-Tocopherol, Plastoquinone, and Isoprene in Leaves under High Photosynthetic Irradiance. Photosynth. Res. 2007, 92, 163–179. [Google Scholar] [CrossRef] [PubMed]
- Lichtenthaler, H.K.; Babani, F.; Navrátil, M.; Buschmann, C. Chlorophyll Fluorescence Kinetics, Photosynthetic Activity, and Pigment Composition of Blue-Shade and Half-Shade Leaves as Compared to Sun and Shade Leaves of Different Trees. Photosynth. Res. 2013, 117, 355–366. [Google Scholar] [CrossRef] [PubMed]
- Lichtenthaler, H.K.; Babani, F.; Langsdorf, G. Chlorophyll Fluorescence Imaging of Photosynthetic Activity in Sun and Shade Leaves of Trees. Photosynth. Res. 2007, 93, 235–244. [Google Scholar] [CrossRef] [PubMed]
- Lichtenthaler, H.K.; Ač, A.; Marek, M.V.; Kalina, J.; Urban, O. Differences in Pigment Composition, Photosynthetic Rates and Chlorophyll Fluorescence Images of Sun and Shade Leaves of Four Tree Species. Plant Physiol. Biochem. 2007, 45, 577–588. [Google Scholar] [CrossRef] [PubMed]
- Sarijeva, G.; Knapp, M.; Lichtenthaler, H.K. Differences in Photosynthetic Activity, Chlorophyll and Carotenoid Levels, and in Chlorophyll Fluorescence Parameters in Green Sun and Shade Leaves of Ginkgo and Fagus. J. Plant Physiol. 2007, 164, 950–955. [Google Scholar] [CrossRef]
- Lichtenthaler, H.K.; Babani, F. Contents of Photosynthetic Pigments and Ratios of Chlorophyll a/b and Chlorophylls to Carotenoids (z+b)/(x+c) in C4 Plants as Compared to C3 Plants. Photosynthetica 2022, 60, 1–7. [Google Scholar]
- Villa, P.; Bolpagni, R.; Pinardi, M.; Tóth, V.R. Leaf Reflectance Can Surrogate Foliar Economics Better than Physiological Traits across Macrophyte Species. Plant Methods 2021, 17, 115. [Google Scholar] [CrossRef]
- Yang, X.; Tang, J.; Mustard, J.F.; Wu, J.; Zhao, K.; Serbin, S.; Lee, J.E. Seasonal Variability of Multiple Leaf Traits Captured by Leaf Spectroscopy at Two Temperate Deciduous Forests. Remote Sens. Environ. 2016, 179, 1–12. [Google Scholar] [CrossRef] [Green Version]
- Cheng, R.; Magney, T.S.; Dutta, D.; Bowling, D.R.; Logan, B.A.; Burns, S.P.; Blanken, P.D.; Grossmann, K.; Lopez, S.; Richardson, A.D.; et al. Decomposing Reflectance Spectra to Track Gross Primary Production in a Subalpine Evergreen Forest. Biogeosciences 2020, 17, 4523–4544. [Google Scholar] [CrossRef]
- Gamon, J.A.; Huemmrich, K.F.; Wong, C.Y.S.; Ensminger, I.; Garrity, S.; Hollinger, D.Y.; Noormets, A.; Peñuelask, J. A Remotely Sensed Pigment Index Reveals Photosynthetic Phenology in Evergreen Conifers. Proc. Natl. Acad. Sci. USA 2016, 113, 13087–13092. [Google Scholar] [CrossRef] [Green Version]
- Seyednasrollah, B.; Bowling, D.R.; Cheng, R.; Logan, B.A.; Magney, T.S.; Frankenberg, C.; Yang, J.C.; Young, A.M.; Hufkens, K.; Arain, M.A.; et al. Seasonal Variation in the Canopy Color of Temperate Evergreen Conifer Forests. New Phytol. 2021, 229, 2586–2600. [Google Scholar] [CrossRef] [PubMed]
- Gitelson, A.A.; Merzlyak, M.N. Signature Analysis of Leaf Reflectance Spectra: Algorithm Development for Remote Sensing of Chlorophyll. J. Plant Physiol. 1996, 148, 494–500. [Google Scholar] [CrossRef]
- Gitelson, A.A.; Zur, Y.; Chivkunova, O.B.; Merzlyak, M.N. Assessing Carotenoid Content in Plant Leaves with Reflectance Spectroscopy. Photochem. Photobiol. 2002, 75, 272–281. [Google Scholar] [CrossRef]
- Curran, P.J. Remote Sensing of Foliar Chemistry. Remote Sens. Environ. 1989, 30, 271–278. [Google Scholar] [CrossRef]
- Kattenborn, T.; Schiefer, F.; Zarco-tejada, P.; Schmidtlein, S. Advantages of Retrieving Pigment Content [μg/Cm2] versus Concentration [%] from Canopy Re Fl Ectance. Remote Sens. Environ. 2019, 230, 111195. [Google Scholar] [CrossRef]
- Sims, D.A.; Gamon, J.A. Relationships between Leaf Pigment Content and Spectral Reflectance across a Wide Range of Species, Leaf Structures and Developmental Stages. Remote Sens. Environ. 2002, 81, 337–354. [Google Scholar] [CrossRef]
- Gamon, J.A.; Penuelas, J.; Field, C.B. A Narrow-Waveband Spectral Index That Tracks Diurnal Changes in Photosynthetic Efficiency. Remote Sens. Environ. 1992, 41, 35–44. [Google Scholar] [CrossRef]
- Gamon, J.A.; Surfus, J.S. Assessing Leaf Pigment Content and Activity with a Reflectometer. New Phytol. 1999, 143, 105–117. [Google Scholar] [CrossRef]
- Gitelson, A.A.; Merzlyak, M.N. Remote Estimation of Chlorophyll Content in Higher Plant Leaves. Int. J. Remote Sens. 1997, 18, 2691–2697. [Google Scholar] [CrossRef]
- Le Maire, G.; François, C.; Dufrêne, E. Towards Universal Broad Leaf Chlorophyll Indices Using PROSPECT Simulated Database and Hyperspectral Reflectance Measurements. Remote Sens. Environ. 2004, 89, 1–28. [Google Scholar] [CrossRef]
- Zarco-tejada, P.J.; Hornero, A.; Beck, P.S.A.; Kattenborn, T.; Kempeneers, P.; Hernández-clemente, R. Chlorophyll Content Estimation in an Open-Canopy Conifer Forest with Sentinel-2A and Hyperspectral Imagery in the Context of Forest Decline. Remote Sens. Environ. 2019, 223, 320–335. [Google Scholar] [CrossRef] [PubMed]
- Main, R.; Cho, M.A.; Mathieu, R.; O’Kennedy, M.M.; Ramoelo, A.; Koch, S. An Investigation into Robust Spectral Indices for Leaf Chlorophyll Estimation. ISPRS J. Photogramm. Remote Sens. 2011, 66, 751–761. [Google Scholar] [CrossRef]
- Hernández-Clemente, R.; Navarro-Cerrillo, R.M.; Zarco-Tejada, P.J. Carotenoid Content Estimation in a Heterogeneous Conifer Forest Using Narrow-Band Indices and PROSPECT+DART Simulations. Remote Sens. Environ. 2012, 127, 298–315. [Google Scholar] [CrossRef]
- Peñuelas, J.; Gamon, J.A.; Fredeen, A.L.; Merino, J.; Field, C.B. Reflectance Indices Associated with Physiological Changes in Nitrogen- and Water-Limited Sunflower Leaves. Remote Sens. Environ. 1994, 48, 135–146. [Google Scholar] [CrossRef]
- Penuelas, J.; Baret, F.; Filella, I. Semi-Empirical Indices to Assess Carotenoids/Chlorophyll a Ratio from Leaf Spectral Reflectance. Photosynthetica 1995, 31, 221–230. [Google Scholar]
- Zhou, X.; Huang, W.; Zhang, J.; Kong, W.; Casa, R.; Huang, Y. A Novel Combined Spectral Index for Estimating the Ratio of Carotenoid to Chlorophyll Content to Monitor Crop Physiological and Phenological Status. Int. J. Appl. Earth Obs. Geoinf. 2019, 76, 128–142. [Google Scholar] [CrossRef]
- Zhou, X.; Huang, W.; Kong, W.; Ye, H.; Dong, Y.; Casa, R. Assessment of Leaf Carotenoids Content with a New Carotenoid Index: Development and Validation on Experimental and Model Data. Int. J. Appl. Earth Obs. Geoinf. 2017, 57, 24–35. [Google Scholar] [CrossRef]
- Gitelson, A.A.; Viña, A.; Ciganda, V.; Rundquist, D.C.; Arkebauer, T.J. Remote Estimation of Canopy Chlorophyll Content in Crops. Geophys. Res. Lett. 2005, 32, 1–4. [Google Scholar] [CrossRef] [Green Version]
- Garrity, S.R.; Eitel, J.U.H.; Vierling, L.A. Disentangling the Relationships between Plant Pigments and the Photochemical Reflectance Index Reveals a New Approach for Remote Estimation of Carotenoid Content. Remote Sens. Environ. 2011, 115, 628–635. [Google Scholar] [CrossRef]
- Filella, I.; Porcar-Castell, A.; Munné-Bosch, S.; Bäck, J.; Garbulsky, M.F.; Peñuelas, J. PRI Assessment of Long-Term Changes in Carotenoids/Chlorophyll Ratio and Short-Term Changes in de-Epoxidation State of the Xanthophyll Cycle. Int. J. Remote Sens. 2009, 30, 4443–4455. [Google Scholar] [CrossRef]
- Gitelson, A.A.; Gamon, J.A.; Solovchenko, A. Multiple Drivers of Seasonal Change in PRI: Implications for Photosynthesis 1. Leaf Level. Remote Sens. Environ. 2017, 191, 110–116. [Google Scholar] [CrossRef] [Green Version]
- Muraoka, H.; Saigusa, N.; Nasahara, K.N.; Noda, H.; Yoshino, J.; Saitoh, T.M.; Nagai, S.; Murayama, S.; Koizumi, H. Effects of Seasonal and Interannual Variations in Leaf Photosynthesis and Canopy Leaf Area Index on Gross Primary Production of a Cool-Temperate Deciduous Broadleaf Forest in Takayama, Japan. J. Plant Res. 2010, 123, 563–576. [Google Scholar] [CrossRef] [PubMed]
- Song, G.; Wang, Q.; Jin, J. Exploring the Instability of the Relationship between Maximum Potential Electron Transport Rate and Maximum Carboxylation Rate in Cool-Temperate Deciduous Forests. Agric. For. Meteorol. 2021, 308–309, 108614. [Google Scholar] [CrossRef]
- Wang, Q.; IIo, A.; Tenhunen, J.; Kakubari, Y. Annual and Seasonal Variations in Photosynthetic Capacity of Fagus Crenata along an Elevation Gradient in the Naeba Mountains, Japan. Tree Physiol. 2008, 28, 277–285. [Google Scholar] [CrossRef] [PubMed] [Green Version]
- Baldocchi, D. “Breathing” of the Terrestrial Biosphere: Lessons Learned from a Global Network of Carbon Dioxide Flux Measurement Systems. Aust. J. Bot. 2008, 56, 1–26. [Google Scholar] [CrossRef]
- Cleland, E.E.; Chuine, I.; Menzel, A.; Mooney, H.A.; Schwartz, M.D. Shifting Plant Phenology in Response to Global Change. Trends Ecol. Evol. 2007, 22, 357–365. [Google Scholar] [CrossRef]
- Richardson, A.D.; Hollinger, D.Y.; Dail, D.B.; Lee, J.T.; Munger, J.W.; O’Keefe, J. Influence of Spring Phenology on Seasonal and Annual Carbon Balance in Two Contrasting New England Forests. Tree Physiol. 2009, 29, 321–331. [Google Scholar] [CrossRef]
- Dillen, S.Y.; de Beeck, M.O.; Hufkens, K.; Buonanduci, M.; Phillips, N.G. Seasonal Patterns of Foliar Reflectance in Relation to Photosynthetic Capacity and Color Index in Two Co-Occurring Tree Species, Quercus Rubra and Betula Papyrifera. Agric. For. Meteorol. 2012, 160, 60–68. [Google Scholar] [CrossRef]
- Ito, A.; Muraoka, H.; Koizumi, H.; Saigusa, N.; Murayama, S.; Yamamoto, S. Seasonal Variation in Leaf Properties and Ecosystem Carbon Budget in a Cool-Temperate Deciduous Broad-Leaved Forest: Simulation Analysis at Takayama Site, Japan. Ecol. Res. 2006, 21, 137–149. [Google Scholar] [CrossRef]
- Croft, H.C. Remote Sensing of Leaf Pigments. In Comprehensive Remote Sensing; Elsevier: Oxford, UK, 2018; pp. 117–142. [Google Scholar]
- Marien, B.; Balzarolo, M.; Dox, I.; Leys, S.; Lor, M.J.; Geron, C.; Portillo-estrada, M.; Abdelgawad, H.; Asard, H.; Campioli, M. Detecting the Onset of Autumn Leaf Senescence in Deciduous Forest Trees of the Temperate Zone. New Phytol. 2019, 224, 166–176. [Google Scholar] [CrossRef]
- Jin, J.; Wang, Q. Informative Bands Used by Efficient Hyperspectral Indices to Predict Leaf Biochemical Contents Are Determined by Their Relative Absorptions. Int. J. Appl. Earth Obs. Geoinf. 2018, 73, 616–626. [Google Scholar] [CrossRef]
- Sonobe, R.; Wang, Q. Nondestructive Assessments of Carotenoids Content of Broadleaved Plant Species Using Hyperspectral Indices. Comput. Electron. Agric. 2018, 145, 18–26. [Google Scholar] [CrossRef]
- Jin, J.; Pratama, B.A.; Wang, Q. Tracing Leaf Photosynthetic Parameters Using Hyperspectral Indices in an Alpine Deciduous Forest. Remote Sens. 2020, 12, 1124. [Google Scholar] [CrossRef] [Green Version]
- Wang, Q.; Jin, J.; Sonobe, R.; Chen, J. Derivative Hyperspectral Vegetation Indices in Characterizing Forest Biophysical and Biochemical Quantities. In Hyperspectral Indices and Image Classifications for Agriculture and Vegetation; Thenkabail, P.S., Lyon, J.G., Huete, A., Eds.; CRC Press: Boca Raton, FL, USA, 2018. [Google Scholar]
- Burger, J.; Geladi, P. Spectral Pre-Treatments of Hyperspectral near Infrared Images: Analysis of Diffuse Reflectance Scattering. J. Near Infrared Spectrosc. 2007, 15, 29–37. [Google Scholar] [CrossRef]
- Demetriades-Shah, T.H.; Steven, M.D.; Clark, J.A. High Resolution Derivative Spectra in Remote Sensing. Remote Sens. Environ. 1990, 33, 55–64. [Google Scholar] [CrossRef]
- Imanishi, J.; Sugimoto, K.; Morimoto, Y. Detecting Drought Status and LAI of Two Quercus Species Canopies Using Derivative Spectra. Comput. Electron. Agric. 2004, 43, 109–129. [Google Scholar] [CrossRef]
- Rinnan, Å.; Van Den Berg, F.; Engelsen, S.B. Review of the Most Common Pre-Processing Techniques for near-Infrared Spectra. TrAC Trends Anal. Chem. 2009, 28, 1201–1222. [Google Scholar] [CrossRef]
- Dhanoa, M.S.; Lister, S.J.; Sanderson, R.; Barnes, R.J. The Link between Multiplicative Scatter Correction (MSC) and Standard Normal Variate (SNV) Transformations of NIR Spectra. J. Near Infrared Spectrosc. 1994, 2, 43–47. [Google Scholar] [CrossRef]
- Martens, H.; Stark, E. Extended Multiplicative Signal Correction and Spectral Interference Subtraction: New Preprocessing Methods for near Infrared Spectroscopy. J. Pharm. Biomed. Anal. 1991, 9, 625–635. [Google Scholar] [CrossRef]
- Iio, A.; Yokoyama, A.; Takano, M.; Nakamura, T.; Fukasawa, H.; Nose, Y.; Kakubari, Y. Interannual Variation in Leaf Photosynthetic Capacity during Summer in Relation to Nitrogen, Leaf Mass per Area and Climate within a Fagus Crenata Crown on Naeba Mountain, Japan. Tree Physiol. 2008, 28, 1421–1429. [Google Scholar] [CrossRef]
- Lichtenthaler, H.K. Chlorophylls and Carotenoids: Pigments of Photosynthetic Biomembranes. Methods Enzymol. 1987, 148, 350–382. [Google Scholar]
- Feret, J.-B.; François, C.; Asner, G.P.; Gitelson, A.A.; Martin, R.E.; Bidel, L.P.R.; Ustin, S.L.; le Maire, G.; Jacquemoud, S. PROSPECT-4 and 5: Advances in the Leaf Optical Properties Model Separating Photosynthetic Pigments. Remote Sens. Environ. 2008, 112, 3030–3043. [Google Scholar] [CrossRef]
- Barnes, R.J.; Dhanoa, M.S.; Lister, S.J. Standard Normal Variate Transformation and De-Trending of near-Infrared Diffuse Reflectance Spectra. Appl. Spectrosc. 1989, 43, 772–777. [Google Scholar] [CrossRef]
- Geladi, P.; MacDougall, D.; Martens, H. Linearization and Scatter-Correction for near-Infrared Reflectance Spectra of Meat. Appl. Spectrosc. 1985, 39, 491–500. [Google Scholar] [CrossRef]
- Wong, C.Y.S.; D’Odorico, P.; Arain, M.A.; Ensminger, I. Tracking the Phenology of Photosynthesis Using Carotenoid-Sensitive and near-Infrared Reflectance Vegetation Indices in a Temperate Evergreen and Mixed Deciduous Forest. New Phytol. 2020, 226, 1682–1695. [Google Scholar] [CrossRef]
- Chang, C.W.; Laird, D.A.; Mausbach, M.J.; Hurburgh, C.R. Near-Infrared Reflectance Spectroscopy-Principal Components Regression Analyses of Soil Properties. Soil Sci. Soc. Am. J. 2001, 65, 480–490. [Google Scholar] [CrossRef] [Green Version]
- Stylinski, C.D.; Gamon, J.A.; Oechel, W.C. Seasonal Patterns of Reflectance Indices, Carotenoid Pigments and Photosynthesis of Evergreen Chaparral Species. Oecologia 2002, 131, 366–374. [Google Scholar] [CrossRef] [PubMed]
- Guo, J.M.; Trotter, C.M. Estimating Photosynthetic Light-Use Efficiency Using the Photochemical Reflectance Index: Variations among Species. Funct. Plant Biol. 2004, 31, 255–265. [Google Scholar] [CrossRef]
- Garbulsky, M.F.; Peñuelas, J.; Gamon, J.; Inoue, Y.; Filella, I. The Photochemical Reflectance Index (PRI) and the Remote Sensing of Leaf, Canopy and Ecosystem Radiation Use Efficiencies. A Review and Meta-Analysis. Remote Sens. Environ. 2011, 115, 281–297. [Google Scholar] [CrossRef]
- Wong, C.Y.S.; Gamon, J.A. Three Causes of Variation in the Photochemical Reflectance Index (PRI) in Evergreen Conifers. New Phytol. 2015, 206, 187–195. [Google Scholar] [CrossRef]
- Middleton, E.M.; Huemmrich, K.F.; Landis, D.R.; Black, T.A.; Barr, A.G.; McCaughey, J.H. Photosynthetic Efficiency of Northern Forest Ecosystems Using a MODIS-Derived Photochemical Reflectance Index (PRI). Remote Sens. Environ. 2016, 187, 345–366. [Google Scholar] [CrossRef]
- Wong, C.Y.S.; Gamon, J.A. The Photochemical Reflectance Index Provides an Optical Indicator of Spring Photosynthetic Activation in Evergreen Conifers. New Phytol. 2015, 206, 196–208. [Google Scholar] [CrossRef] [PubMed]
- Gamon, J.A. Reviews and Syntheses: Optical Sampling of the Flux Tower Footprint. Biogeosciences 2015, 12, 4509–4523. [Google Scholar] [CrossRef] [Green Version]
- Gitelson, A.; Solovchenko, A. Non-Invasive Quantification of Foliar Pigments: Possibilities and Limitations of Reflectance- and Absorbance-Based Approaches. J. Photochem. Photobiol. B Biol. 2018, 178, 537–544. [Google Scholar] [CrossRef]
- Merzlyak, M.N.; Chivkunova, O.B. Light-Stress-Induced Pigment Changes and Evidence for Anthocyanin Photoprotection in Apples. J. Photochem. Photobiol. B Biol. 2000, 55, 155–163. [Google Scholar] [CrossRef]
- Merzlyak, M.N.; Solovchenko, A.E.; Gitelson, A.A. Reflectance Spectral Features and Non-Destructive Estimation of Chlorophyll, Carotenoid and Anthocyanin Content in Apple Fruit. Postharvest Biol. Technol. 2003, 27, 197–211. [Google Scholar] [CrossRef]
- Cao, Z.; Wang, Q.; Zheng, C. Best Hyperspectral Indices for Tracing Leaf Water Status as Determined from Leaf Dehydration Experiments. Ecol. Indic. 2015, 54, 96–107. [Google Scholar] [CrossRef]
- Junttila, S.; Hölttä, T.; Saarinen, N.; Kankare, V.; Yrttimaa, T.; Hyyppä, J.; Vastaranta, M. Close-Range Hyperspectral Spectroscopy Reveals Leaf Water Content Dynamics Research Highlights. Preprint 2021, 2021080497. [Google Scholar]
- Morley, P.J.; Jump, A.S.; West, M.D.; Donoghue, D.N.M. Spectral Response of Chlorophyll Content during Leaf Senescence in European Beech Trees. Environ. Res. Commun. 2020, 2, 071002. [Google Scholar] [CrossRef]
- Decker, M.; Nielsen, P.V.; Martens, H. Near-Infrared Spectra of Penicillium Camemberti Strains Separated by Extended Multiplicative Signal Correction Improved Prediction of Physical and Chemical Variations. Appl. Spectrosc. 2005, 59, 56–68. [Google Scholar] [CrossRef]
- Martens, H.; Nielsen, J.P.; Engelsen, S.B. Light Scattering and Light Absorbance Separated by Extended Multiplicative Signal Correction. Application to near-Infrared Transmission Analysis of Powder Mixtures. Anal. Chem. 2003, 75, 394–404. [Google Scholar] [CrossRef] [PubMed]
- Sharma, S.; Goodarzi, M.; Ramon, H.; Saeys, W. Performance Evaluation of Preprocessing Techniques Utilizing Expert Information in Multivariate Calibration. Talanta 2014, 121, 105–112. [Google Scholar] [CrossRef] [PubMed]
- Wang, Q.; Jin, J. Leaf Transpiration of Drought Tolerant Plant Can Be Captured by Hyperspectral Reflectance Using PLSR Analysis. IForest 2016, 9, 30–37. [Google Scholar] [CrossRef] [Green Version]
- Jin, J.; Wang, Q. Hyperspectral Indices Based on First Derivative Spectra Closely Trace Canopy Transpiration in a Desert Plant. Ecol. Inform. 2016, 35, 1–8. [Google Scholar] [CrossRef]
- Gamon, J.A.; Somers, B.; Malenovský, Z.; Middleton, E.M.; Rascher, U.; Schaepman, M.E. Assessing Vegetation Function with Imaging Spectroscopy. Surv. Geophys. 2019, 40, 489–513. [Google Scholar] [CrossRef] [Green Version]
Figure 1.
Violin plots with boxplots (inside) for the ratio of chlorophyll (Chl) to carotenoid (Car) (Chl/Car) in different datasets (Naeba, Nakakawane, and Angers) (a), and during different phenological stages (flushing, maturity, and senescence) of the Naeba and Nakakawane datasets (b). The boxplots indicate the interquartile range (box), median (gap), and 1.5 times the interquartile range (whiskers).

Figure 2.
The corresponding original reflectance (OR) data in the Naeba, Nakakawane, and Angers datasets (a), and during the flushing, maturity, and senescence stages (b). Solid lines and shading zones represent the averages of the original reflectance values and the corresponding standard deviations, respectively.

Figure 3.
The reflectance resulting from the pre-processing of both extended multiplicative scatter correction (EMSC) and first-order derivative (1st derivative) (a) and the performance of the developed best index for assessing the Chl/Car ratio (b).
Figure 3.
The reflectance resulting from the pre-processing of both extended multiplicative scatter correction (EMSC) and first-order derivative (1st derivative) (a) and the performance of the developed best index for assessing the Chl/Car ratio (b).

Figure 4.
Performance of the best developed index for tracing the Chl/Car ratio in the two field-measured datasets (Naeba and Nakakawane) at distinctive phenological stages.
Figure 4.
Performance of the best developed index for tracing the Chl/Car ratio in the two field-measured datasets (Naeba and Nakakawane) at distinctive phenological stages.

Figure 5.
The relationship between dDEMSC (540, 1396) and Chl/Car ratio for a simulated dataset from PROSPECT 5.
Figure 5.
The relationship between dDEMSC (540, 1396) and Chl/Car ratio for a simulated dataset from PROSPECT 5.


Table 1.
Previously published spectral indices for the estimation of the chlorophyll (Chl)/carotenoid (Car) ratio in other studies.
Table 1.
Previously published spectral indices for the estimation of the chlorophyll (Chl)/carotenoid (Car) ratio in other studies.
| Index | Variable | Formula | Reference |
|---|---|---|---|
| Photochemical reflectance index (PRI) | LUE | Gamon et al. [38] | |
| Normalized pigment chlorophyll ratio index (NPCI) | Total pigments/Chl | Peñuelas et al. [45] | |
| Structure insensitive pigment index (SIPI) | Car/Chla | Peñuelas et al. [45] | |
| Plant senescence reflectance index (PSRI) | Car/Chl | Merzlyak et al. [46] | |
| Carotenoid/chlorophyll ratio index (CCRI) | Car/Chl | Zhou et al. [47] | |
| Chlorophyll/carotenoid index (CCI) | Car/Chl | Wong et al. [78] | |
| Normalized difference vegetation index (NDVI) | Car/Chl |
Table 2.
New types of indices were developed for the estimation of the chlorophyll (Chl)/carotenoid (Car) ratio in this study. and the suffixes ( or ) represent the reflectance and wavelength, respectively.
Table 2.
New types of indices were developed for the estimation of the chlorophyll (Chl)/carotenoid (Car) ratio in this study. and the suffixes ( or ) represent the reflectance and wavelength, respectively.
| Index Type | Wavelength | Formula |
|---|---|---|
| R | ||
| SR | , | |
| D | , | |
| ND | , | |
| ID | , | ) |
| DDn | , | |
| mSR1 | , | |
| mSR2 | , | |
| mND | , | |
| mID | , |
Table 3.
Performance of reported indices for the evaluation of the ratio of chlorophyll (Chl) to carotenoid (Car) in the individual and composite datasets.
Table 3.
Performance of reported indices for the evaluation of the ratio of chlorophyll (Chl) to carotenoid (Car) in the individual and composite datasets.
| Dataset | Criteria | PRI | PSRI | SIPI | NPCI | CCRI | CCI | NDVI |
|---|---|---|---|---|---|---|---|---|
| Naeba | R2 | 0.28 | 0.00 | 0.00 | 0.02 | 0.43 | 0.04 | 0.03 |
| RMSE | 0.79 | 0.93 | 0.93 | 0.92 | 0.70 | 0.91 | 0.92 | |
| RPD | 1.19 | 1.01 | 1.01 | 1.02 | 1.33 | 1.03 | 1.02 | |
| Nakakawane | R2 | 0.13 | 0.02 | 0.00 | 0.04 | 0.02 | 0.00 | 0.05 |
| RMSE | 0.60 | 0.64 | 0.65 | 0.63 | 0.64 | 0.65 | 0.63 | |
| RPD | 1.08 | 1.01 | 1.00 | 1.02 | 1.01 | 1.00 | 1.03 | |
| Angers | R2 | 0.36 | 0.37 | 0.24 | 0.31 | 0.29 | 0.14 | 0.45 |
| RMSE | 0.50 | 0.50 | 0.55 | 0.52 | 0.53 | 0.58 | 0.47 | |
| RPD | 1.25 | 1.26 | 1.15 | 1.21 | 1.19 | 1.08 | 1.35 | |
| All | R2 | 0.17 | 0.12 | 0.22 | 0.19 | 0.36 | 0.01 | 0.25 |
| RMSE | 0.82 | 0.84 | 0.79 | 0.81 | 0.72 | 0.90 | 0.78 | |
| RPD | 1.10 | 1.07 | 1.14 | 1.11 | 1.25 | 1.00 | 1.16 |
Table 4.
The performance of different types of indices developed for the estimation of the chlorophyll (Chl)/carotenoid (Car) ratio using various spectral transformations.
Table 4.
The performance of different types of indices developed for the estimation of the chlorophyll (Chl)/carotenoid (Car) ratio using various spectral transformations.
| Form | Criteria | Index Types | |||||||||
|---|---|---|---|---|---|---|---|---|---|---|---|
| R | SR | D | ND | ID | DDn | mSR1 | mSR2 | mND | mID | ||
| OR | R2 | 0.35 | 0.51 | 0.50 | 0.53 | 0.50 | 0.44 | 0.48 | 0.51 | 0.47 | 0.49 |
| RMSE | 0.73 | 0.63 | 0.64 | 0.61 | 0.64 | 0.67 | 0.65 | 0.63 | 0.66 | 0.64 | |
| RPD | 1.24 | 1.43 | 1.42 | 1.47 | 1.41 | 1.34 | 1.39 | 1.42 | 1.37 | 1.41 | |
| SNV | R2 | 0.46 | 0.50 | 0.51 | 0.44 | 0.46 | 0.46 | 0.48 | 0.51 | 0.47 | 0.47 |
| RMSE | 0.66 | 0.64 | 0.63 | 0.68 | 0.66 | 0.66 | 0.65 | 0.63 | 0.66 | 0.65 | |
| RPD | 1.36 | 1.42 | 1.43 | 1.33 | 1.37 | 1.36 | 1.39 | 1.42 | 1.37 | 1.38 | |
| MSC | R2 | 0.46 | 0.50 | 0.51 | 0.52 | 0.51 | 0.46 | 0.48 | 0.51 | 0.47 | 0.47 |
| RMSE | 0.66 | 0.64 | 0.63 | 0.62 | 0.63 | 0.66 | 0.65 | 0.63 | 0.66 | 0.65 | |
| RPD | 1.36 | 1.41 | 1.43 | 1.44 | 1.42 | 1.37 | 1.38 | 1.42 | 1.37 | 1.38 | |
| EMSC | R2 | 0.42 | 0.48 | 0.45 | 0.48 | 0.47 | 0.47 | 0.46 | 0.45 | 0.44 | 0.48 |
| RMSE | 0.69 | 0.65 | 0.67 | 0.65 | 0.66 | 0.66 | 0.66 | 0.67 | 0.67 | 0.65 | |
| RPD | 1.31 | 1.39 | 1.35 | 1.39 | 1.37 | 1.37 | 1.36 | 1.35 | 1.34 | 1.39 | |
| Log | R2 | 0.33 | 0.53 | 0.53 | 0.53 | 0.49 | 0.43 | 0.46 | 0.51 | 0.47 | 0.42 |
| RMSE | 0.74 | 0.62 | 0.62 | 0.62 | 0.64 | 0.68 | 0.66 | 0.63 | 0.66 | 0.69 | |
| RPD | 1.22 | 1.45 | 1.46 | 1.45 | 1.40 | 1.33 | 1.36 | 1.43 | 1.38 | 1.31 | |
| 1st derivative | R2 | 0.44 | 0.50 | 0.54 | 0.46 | 0.37 | 0.51 | 0.52 | 0.53 | 0.53 | 0.49 |
| RMSE | 0.68 | 0.64 | 0.61 | 0.66 | 0.71 | 0.63 | 0.62 | 0.62 | 0.62 | 0.64 | |
| RPD | 1.33 | 1.42 | 1.47 | 1.36 | 1.26 | 1.43 | 1.44 | 1.46 | 1.46 | 1.41 | |
| 2nd derivative | R2 | 0.39 | 0.47 | 0.45 | 0.49 | 0.45 | 0.45 | 0.46 | 0.46 | 0.47 | 0.33 |
| RMSE | 0.70 | 0.66 | 0.67 | 0.64 | 0.67 | 0.67 | 0.66 | 0.66 | 0.66 | 0.74 | |
| RPD | 1.28 | 1.38 | 1.35 | 1.40 | 1.36 | 1.35 | 1.37 | 1.36 | 1.37 | 1.22 | |
Publisher’s Note: MDPI stays neutral with regard to jurisdictional claims in published maps and institutional affiliations. |
© 2022 by the authors. Licensee MDPI, Basel, Switzerland. This article is an open access article distributed under the terms and conditions of the Creative Commons Attribution (CC BY) license (https://creativecommons.org/licenses/by/4.0/).
Share and Cite
MDPI and ACS Style
Song, G.; Wang, Q. Developing Hyperspectral Indices for Assessing Seasonal Variations in the Ratio of Chlorophyll to Carotenoid in Deciduous Forests. Remote Sens. 2022, 14, 1324. https://0-doi-org.brum.beds.ac.uk/10.3390/rs14061324
AMA Style
Song G, Wang Q. Developing Hyperspectral Indices for Assessing Seasonal Variations in the Ratio of Chlorophyll to Carotenoid in Deciduous Forests. Remote Sensing. 2022; 14(6):1324. https://0-doi-org.brum.beds.ac.uk/10.3390/rs14061324
Chicago/Turabian StyleSong, Guangman, and Quan Wang. 2022. "Developing Hyperspectral Indices for Assessing Seasonal Variations in the Ratio of Chlorophyll to Carotenoid in Deciduous Forests" Remote Sensing 14, no. 6: 1324. https://0-doi-org.brum.beds.ac.uk/10.3390/rs14061324
Note that from the first issue of 2016, this journal uses article numbers instead of page numbers. See further details here.