Article

Analyses of DSD Vertical Evolution and Rain Variation Mechanism in Stratiform Cloud Cases Using Micro Rain Radar

1
Beijing Weather Modification Center, Beijing 100089, China
2
Beijing Key Laboratory of Cloud, Precipitation and Atmospheric Water Resources (LCPW), Beijing Meteorological Bureau, Beijing 100089, China
3
CSSC Marine Technology Co., Ltd., Beijing 100070, China
4
State Key Laboratory of Severe Weather, Chinese Academy of Meteorological Science, Beijing 100089, China
*
Author to whom correspondence should be addressed.
Submission received: 2 February 2022 / Revised: 7 March 2022 / Accepted: 14 March 2022 / Published: 30 March 2022

Abstract

:
(1) Raindrop size distribution (DSD) is a vital microphysical characteristic of clouds and precipitations. The vertical evolution of DSD also provides a reference for the microphysical mechanisms and dynamic processes involved in clouds and precipitations. (2) Here we analyzed the characteristics and vertical evolution of DSDs, which were obtained from Micro Rain Radar (MRR) data of two typical stratiform rain cases. (3) First, we compared MRR-observed reflectivity (Z) and DSD at 400 m with data from a distrometer on the ground. This ensured the reliability of the MRR data of the two cases. Then it was found that the DSD was wider just below the 0 °C level than at lower levels. The larger DSDs width formed a bulge shape in the vertical direction, and large particles in the ‘bulge’ then constantly collided as they were falling down. The DSD was broadened and the echo of the warm layer was strengthened. We referred to this as the bulge phenomenon (BP), which appeared occasionally, and broader DSD propagated from high to low intermittently during the stratiform rain. Next, by combining the detailed cloud structures detected by cloud radar with BP, we found that a BP was always accompanied by higher developing cloud tops, stronger Z and larger falling velocity. It was inferred that ice particles formed near cloud top intermittently and fell through the underlying cloud, causing the gustiness and instability of particle aggregation, which was reflected by the BP below the 0 °C layer. BP triggered quick collision and falling down along the warm layer, enhancing the Z and falling velocity transiently. Thus, BP was considered as one of the mechanisms of rain variation in stratocumulus and stratiform rain in North China. Finally, we defined the cycle time of a BP (BPT), which was composed of broadening stage (BS) and stable stage (SS). We found that changes of DSD parameters for both MRR and distrometer responded to each BP occurring, showing the same intermittency. From each BP occurring time to the corresponding BS ending time, Dm basically grew from small to large. After this, Dm decreased immediately or maintained for a while and then decreased. Nw had the opposite trend to Dm. Also, it was found that larger R accelerated the fluency of BP occurring (BPT).

Graphical Abstract

1. Introduction

The macrophysical and microphysical characteristics and evolution of cloud–precipitation systems have an important influence on the weather, climate, and water cycle of earth systems. Obtaining microphysical characteristics is difficult and has been a focus of cloud physics research. Raindrop size distribution (DSD) is one of the most important microphysical parameters for cloud parameterizations, large-scale weather research, and forecasting models. The vertical evolution of DSD in the air also directly reflects the growth and evolution of falling particles, which provides a reference for the microphysical mechanism and dynamic process of cloud and precipitation. Therefore, the characteristics and vertical evolution of DSD have been of great significance in cloud physics and weather modification research areas.
In convective precipitation, a strong updraft and high cloud top lead to abundant cloud condensation nuclei. Hydrometers grow rapidly in a vertical direction and raindrops fall fast from high to low. Meanwhile, stratiform rain, especially stratocumulus rain, also involves a change in its vertical airflow and cloud development. Even in stable stratiform clouds, relatively continuous vertical flows still exist [1], which affect the growth and circulation of a hydrometer. To better understand the microphysical mechanism involved in a hydrometer in stratiform precipitation, the vertical evolution of DSD needs to be obtained.
Methods for observing DSD include distrometer on the ground, particle probes carried by aircraft for cloud and rain, and satellite and radar remote sensing [2,3]. A distrometer is typically fixed at a meteorological station to obtain real DSD data at fixed points; however, it cannot gather information on the vertical DSD. In some studies, several distrometers have been set up at different altitudes on a mountain to obtain the vertical evolution characteristics of DSD [4,5,6]. However, due to the limited number of meteorological stations and tough setting conditions, data were only collected at three to four heights. The limited data collected were insufficient to provide a continuous and representative vertical observation of DSD. Airborne DSD detection can only obtain a real value at a certain time and space. The observation range is typically limited for each flight; therefore, obtaining a DSD vertical evolution is also difficult. A ground-based remote sensing device such as a weather radar does not have sufficient fine resolution for detecting DSD. Meanwhile, a millimeter-wave cloud radar (CR) has high accuracy and resolution; however, its attenuation is too strong in heavy rain, and detection for DSD is greatly affected by turbulence and vertical air motions [7,8].
Micro Rain Radar (MRR) is a K-band precipitation radar with a wavelength and frequency of 1.25 cm and 24.15 GHz, respectively. The wavelength is at the boundary between millimeter-wave and centimeter-wave, which is advantageous for detecting precipitation. MRR is portable, low cost, simple to install, and can provide remote sensing of a continuous DSD in a vertical direction. Wen et al. [9,10] evaluated the accuracy of an MRR for rain detection in different types of clouds in the Jiangnan area of China. In general, the rain intensity (R) and DSD detected by the MRR were found to be in good agreement with the results from a distrometer. The authors also statistically analyzed the characteristics and vertical evolution of DSD during the plum rains in eastern China. In another report, Wang et al. [11] used an MRR to analyze the microphysical characteristics of precipitation in different clouds at Shandong, China. They presented the DSD features found in different rainfall intensities and cloud types.
In the vertical detection of Doppler radar, the raindrop size can be calculated from the detected falling velocity of raindrops according to the relationship between the raindrop falling velocity in still air and particle diameter (V-D relationship), so DSD can be obtained. However, both CR and MRR are highly susceptible to vertical airspeed when used to retrieve the DSD, because the detected falling velocity of raindrops includes both the falling velocity of the particles and the vertical airspeed. As a result, an error will occur when the V-D relationship is used to calculate DSD [1,7,8,12]. Wang et al. [11] analyzed convective rain and found that the measurement deviation between an MRR and distrometer was large, which was explained by the large actual vertical airspeed in convective rain. Conversely, Peters et al. [5] suggested that a 1-min averaged DSD product from an MRR can be considered close to the real values, as long as the vertical airspeed was <2 m s−1 [13]. Therefore, the MRR DSD product can be used to study the DSD vertical distribution in stratiform, in which the vertical airspeed is generally less than 2 m s−1. [11,14,15]. Konwar et al. [15] used a variety of instruments, including MRR, to observe the rainfall in the mountains of southern India. They analyzed the observation results from both upwind and downwind and found a significant role in the breaking and collision processes of large drops. The upwind generated by the topography, which maintained the collision and growth processes, also played a significant role. Das and Maitra [16] used an MRR to analyze vertical DSD and different near-ground evolution mechanisms of DSD in different types of clouds. There have been several reports on the topics of vertical DSD and microphysical mechanism; however, only a few studies have focused on the continuous vertical evolution along the whole warm cloud–precipitation and microphysical mechanism in stratiform rain. In this paper, DSDs retrieved by an MRR were used to analyze DSD characteristics in two stratiform rain cases and some new phenomena in the vertical evolution of DSD. We also tried to explain the evolution mechanism involved and find the link between rain formation and variation.

2. Instrumentation and Methods

2.1. Instrumentation

Haituo Mountain is located at the junction of Yanqing District, Beijing and Chicheng County, Hebei, about 18 km away from Yanqing City and about 130 km away from Beijing City. The YJP Station (115.73°E, 40.52°N; called YJP for short) is about 6 km southwest of Haituo Mountain, with an altitude of 1344 m. The building of the YJP station began in 2014, and a comprehensive observation station had been formed by 2018. It is equipped with a Ka-band CR, micro pulse Lidar (MPL), MRR, microwave radiometer (MWR), wind profile radar (WPR), distrometer (OTT Parsivel), laser ceilometer (CL31), automatic weather station, total sky imager, etc. The location and equipment layout of YJP Station are shown in the Figure 1.
The MRR that is considered a vertically pointing frequency-modulated continuous-wave radar has an offset antenna of 60 cm, made from METEK GmbH. From this MRR, we obtained the values for liquid water content (LWC), average raindrop diameter (Dm), R, the vertical profile of DSD, and other parameters. The temporal resolution for MRR we used is 1 min. The MRR saved the Doppler spectrum in 31 range bins with a resolution of 200 m and detection range of 6200 m. Stratiform clouds in North China are mainly mixed clouds containing various phases. But it was difficult for the MRR to detect ice particles at temperatures above 0 °C; therefore, the main objects detected were the liquid particles in warm rain below 0 °C.
Compared with MRR, CR detects a smaller reflectivity factor (Z) due to the attenuation generated by precipitation [9]. However, CR has higher temporal and spatial resolution and sensitivity, which are useful in obtaining a detailed cloud structure. The main specifications of the MRR and CR used are summarized in Table 1. The 0 °C-layer bright band near the melting layer is a feature of stratiform clouds. The linear depolarization ratio (LDR) represents the polarization information, where larger values for LDR indicate spherical particles. We note that a stratiform rain also contains a 0 °C-layer LDR bright band.
A distrometer provides a reference to ensure the reliability of MRR data and retrieval. The distrometer used is a DSD measuring device, which was made on the basis of the principle of optical sensors. It measured the particle size and falling speed of different-sized particles in rain and snow with high accuracy. The main technical characteristics of distrometer are summarized in Table 2.

2.2. DSD Retrieval by MRR

A DSD value (N(D)) can be calculated directly from the Doppler spectrum (Sz(Vr)). By ignoring the effect of vertical airspeed, the derivation of DSD from Sz(Vr) can be expressed using Equation (1).
S z ( V r ) = | Z V r | = | Z D × D V f | = C × N ( D ) σ b s c ( D ) × D V f
where σbsc(D), Vr, and Vf are the raindrop backscatter cross section with diameter D, falling velocity of particles observed by MRR, and falling velocity of particles in still air, respectively. σbsc(D) should be computed by different formulas according to the scattering type. For example, during heavy rainfall, the particle diameter is up to 4 mm, and the value of π D / λ is approximately 1.015, which does not meet the Rayleigh scattering range ( π D / λ 1 ). Therefore, when the raindrop diameter is >1.2 mm, we used the extended boundary condition algorithm to calculate the Mie backscattering energy of precipitation particles [17]. When the raindrop diameter is <1.2 mm, σbsc(D) is computed by the Rayleigh scattering formula given by Equation (2).
σ b s c ( D ) = π 5 / λ × K 2 × D 6
In addition, Equation (1) includes the derivative of D with respect to the final falling velocity (Vf), which was calculated using the V-D relationship in Equation (3) [18]:
D = { 1 4 V f × ( ρ / ρ 0 ) 0.5 ( V f 2.5   m / s ) 1.667 ln ( 9.65 V f × ( ρ ρ 0 ) 0.4 10.3 ) ( V f > 2.5   m / s )
where ρ and ρ 0 are the air density on the ground and at the detection height, respectively. The ρ / ρ 0 values were determined by the detection height, surface temperature, and lapse rate of the atmospheric temperature. At low altitudes, Equation (3) can be simplified into a function that relates to height only.
To study the characteristics of DSD, we tried to fit their values with a normalized gamma distribution [19], in which the shape parameter (μ) was independent of the LWC and mass-weighted mean diameter (Dm). The three parameters of the normalized gamma distribution are given using Equations (4)–(6).
N ( D ) = N w f ( μ ) ( D D m ) μ exp [ ( μ + 4 ) D D m ]
f ( μ ) = 6 256 × ( μ + 4 ) μ + 4 Γ ( μ + 4 )
Γ ( x ) = 2 π e x x x 1 2
where Dm and Nw represent the mass-weighted mean diameter and standardized intercept parameter (overall number concentration magnitude), respectively. The parameter μ is independent of both Dm and Nw and is related only to the DSD shape; however, Nw and Dm affect each other. Under the condition of the same LWC, larger Dm values result to lower Nw values. We used the method of order moment to fit the three parameters in a normalized gamma distribution. Nw, μ, and Dm were described by the third-, fourth-, and sixth-order moments of the DSD, respectively [19]. The i-th order and DSD parameters are expressed using Equations (7)–(13). The Z and R were also calculated using the order moment expression of DSD.
M i = N ( D ) × D i d D
N w = 256 6 × M 3 5 M 4 4
D m = M 4 M 3
G = M 4 3 M 3 2 M 6
μ = 11 G 8 + G ( G + 8 ) 2 ( 1 G )
Z = N ( D ) × D 6 d D
R = π 6 N ( D ) × v ( D ) × D 3 d D

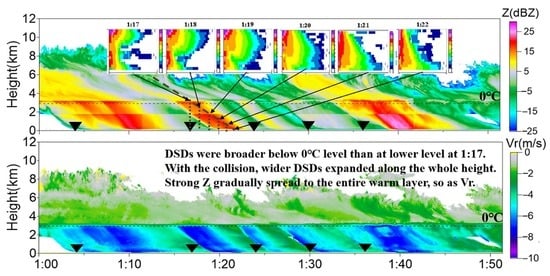
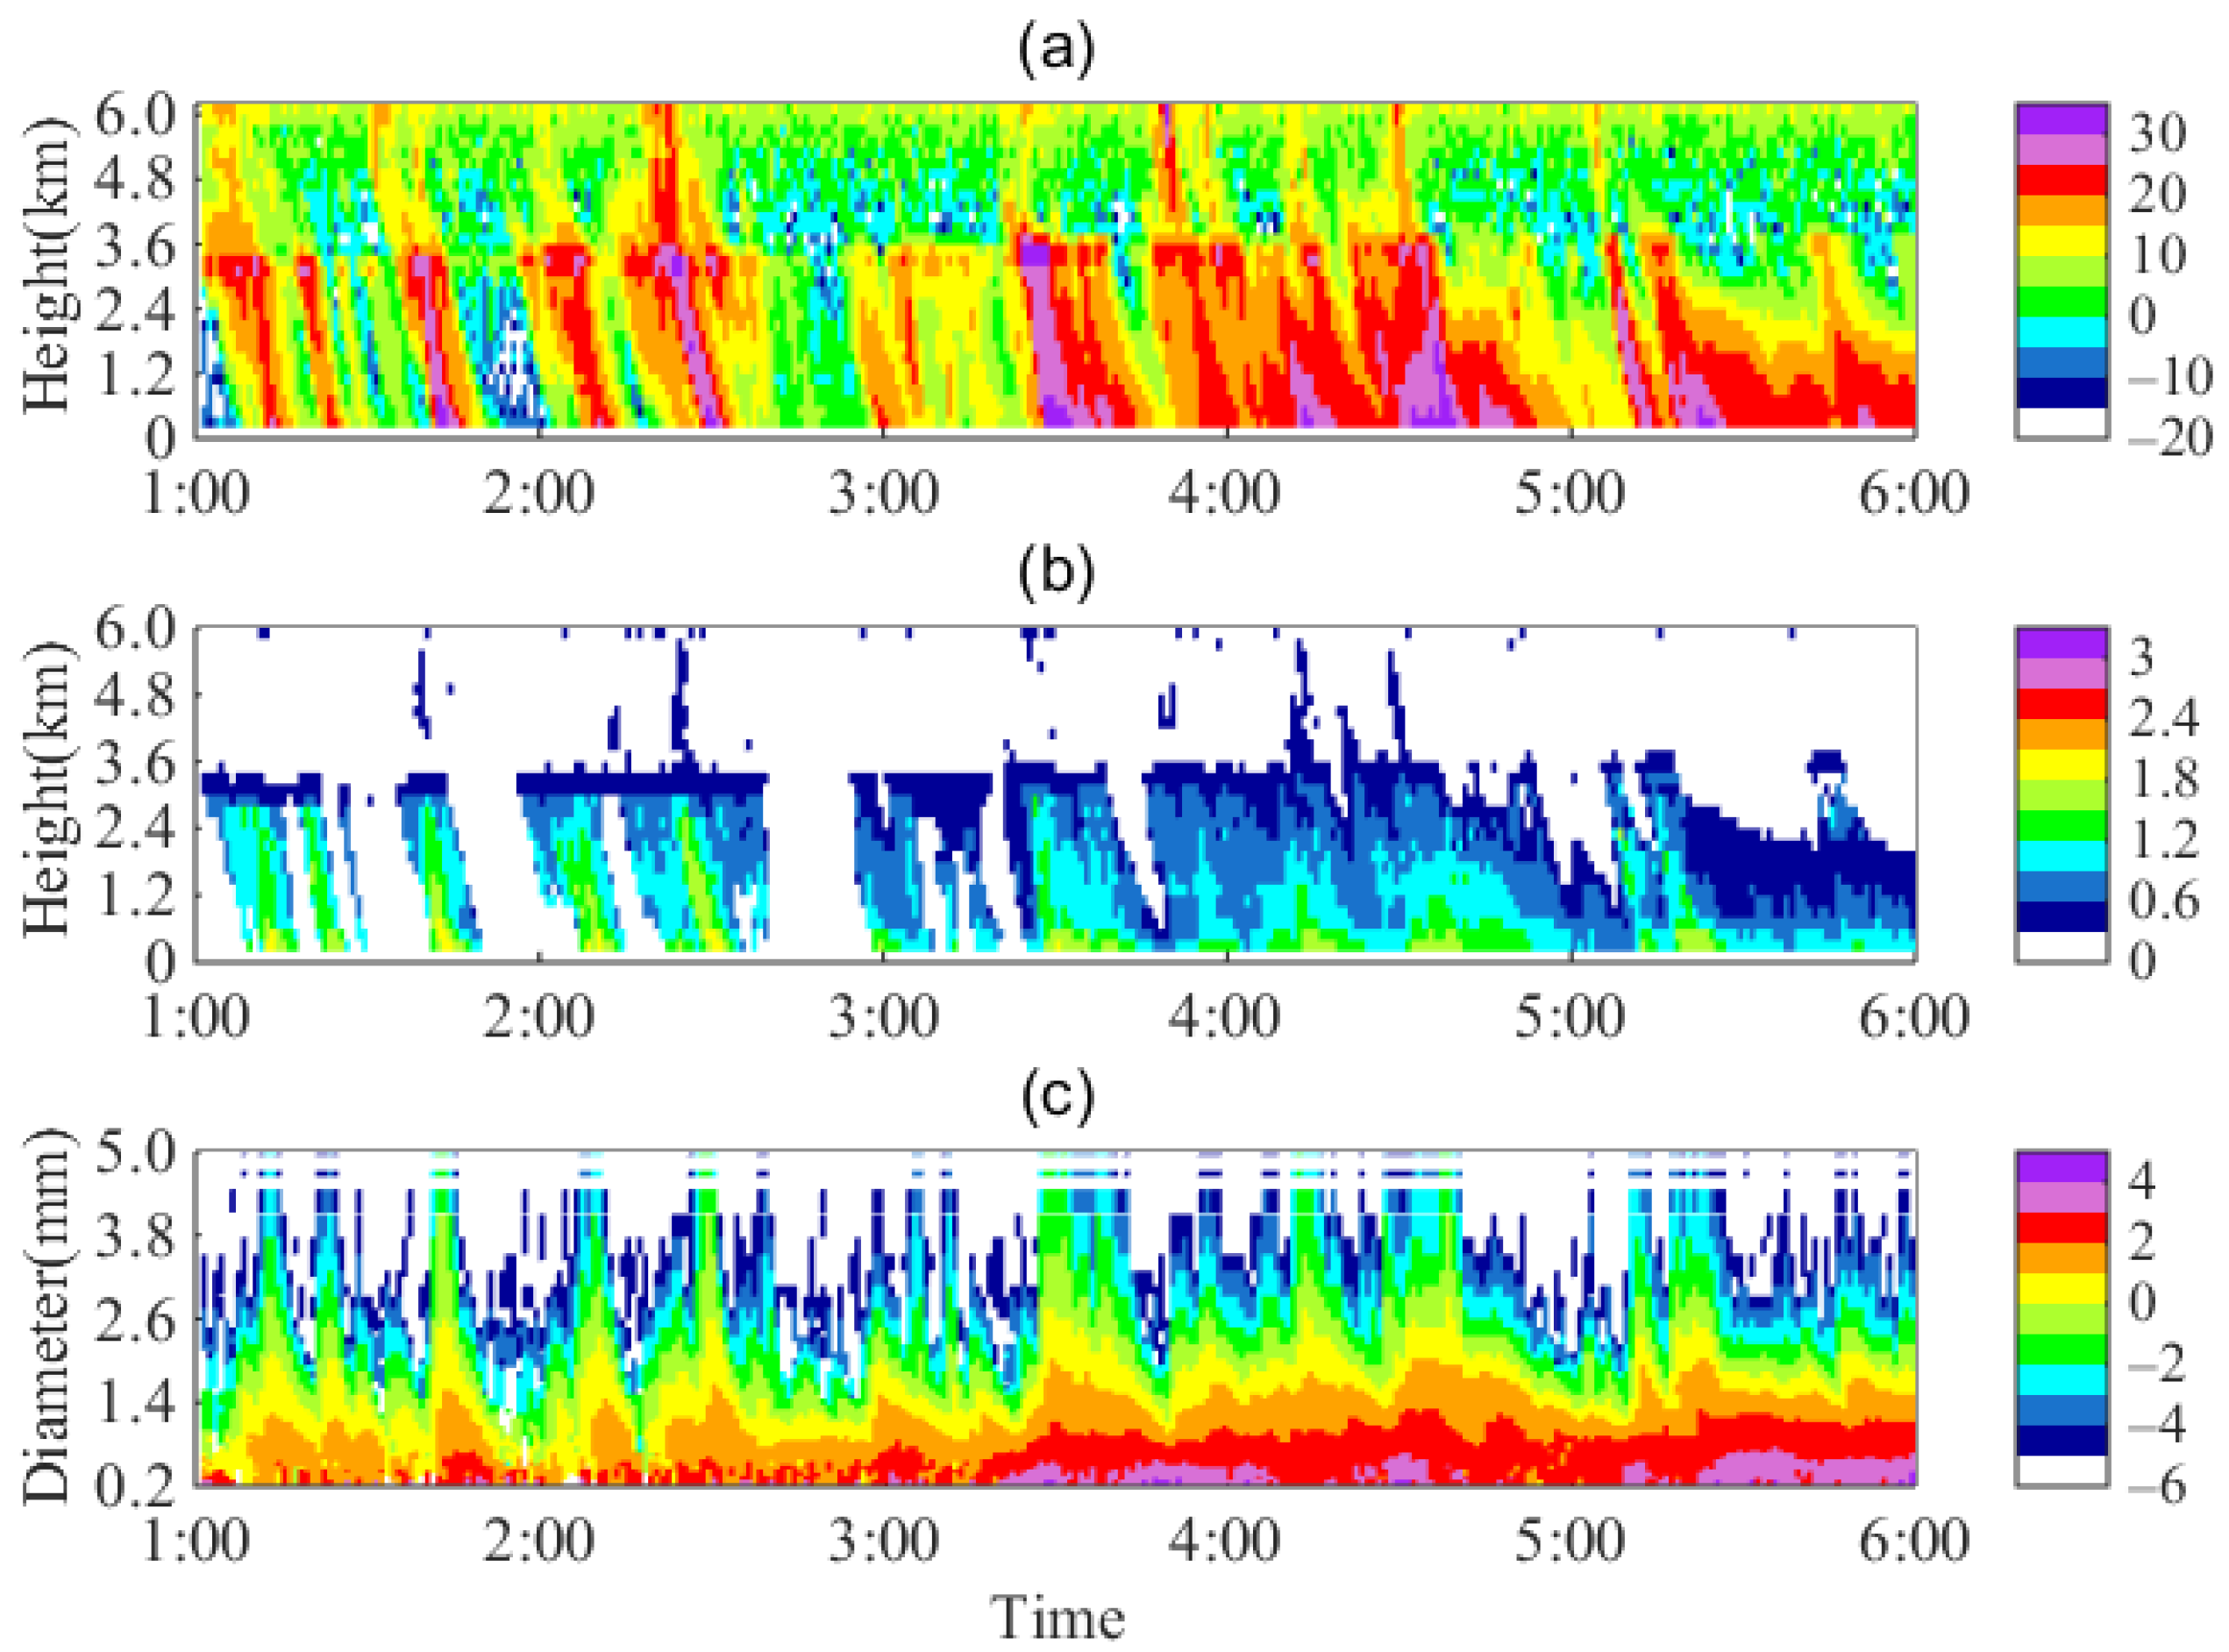
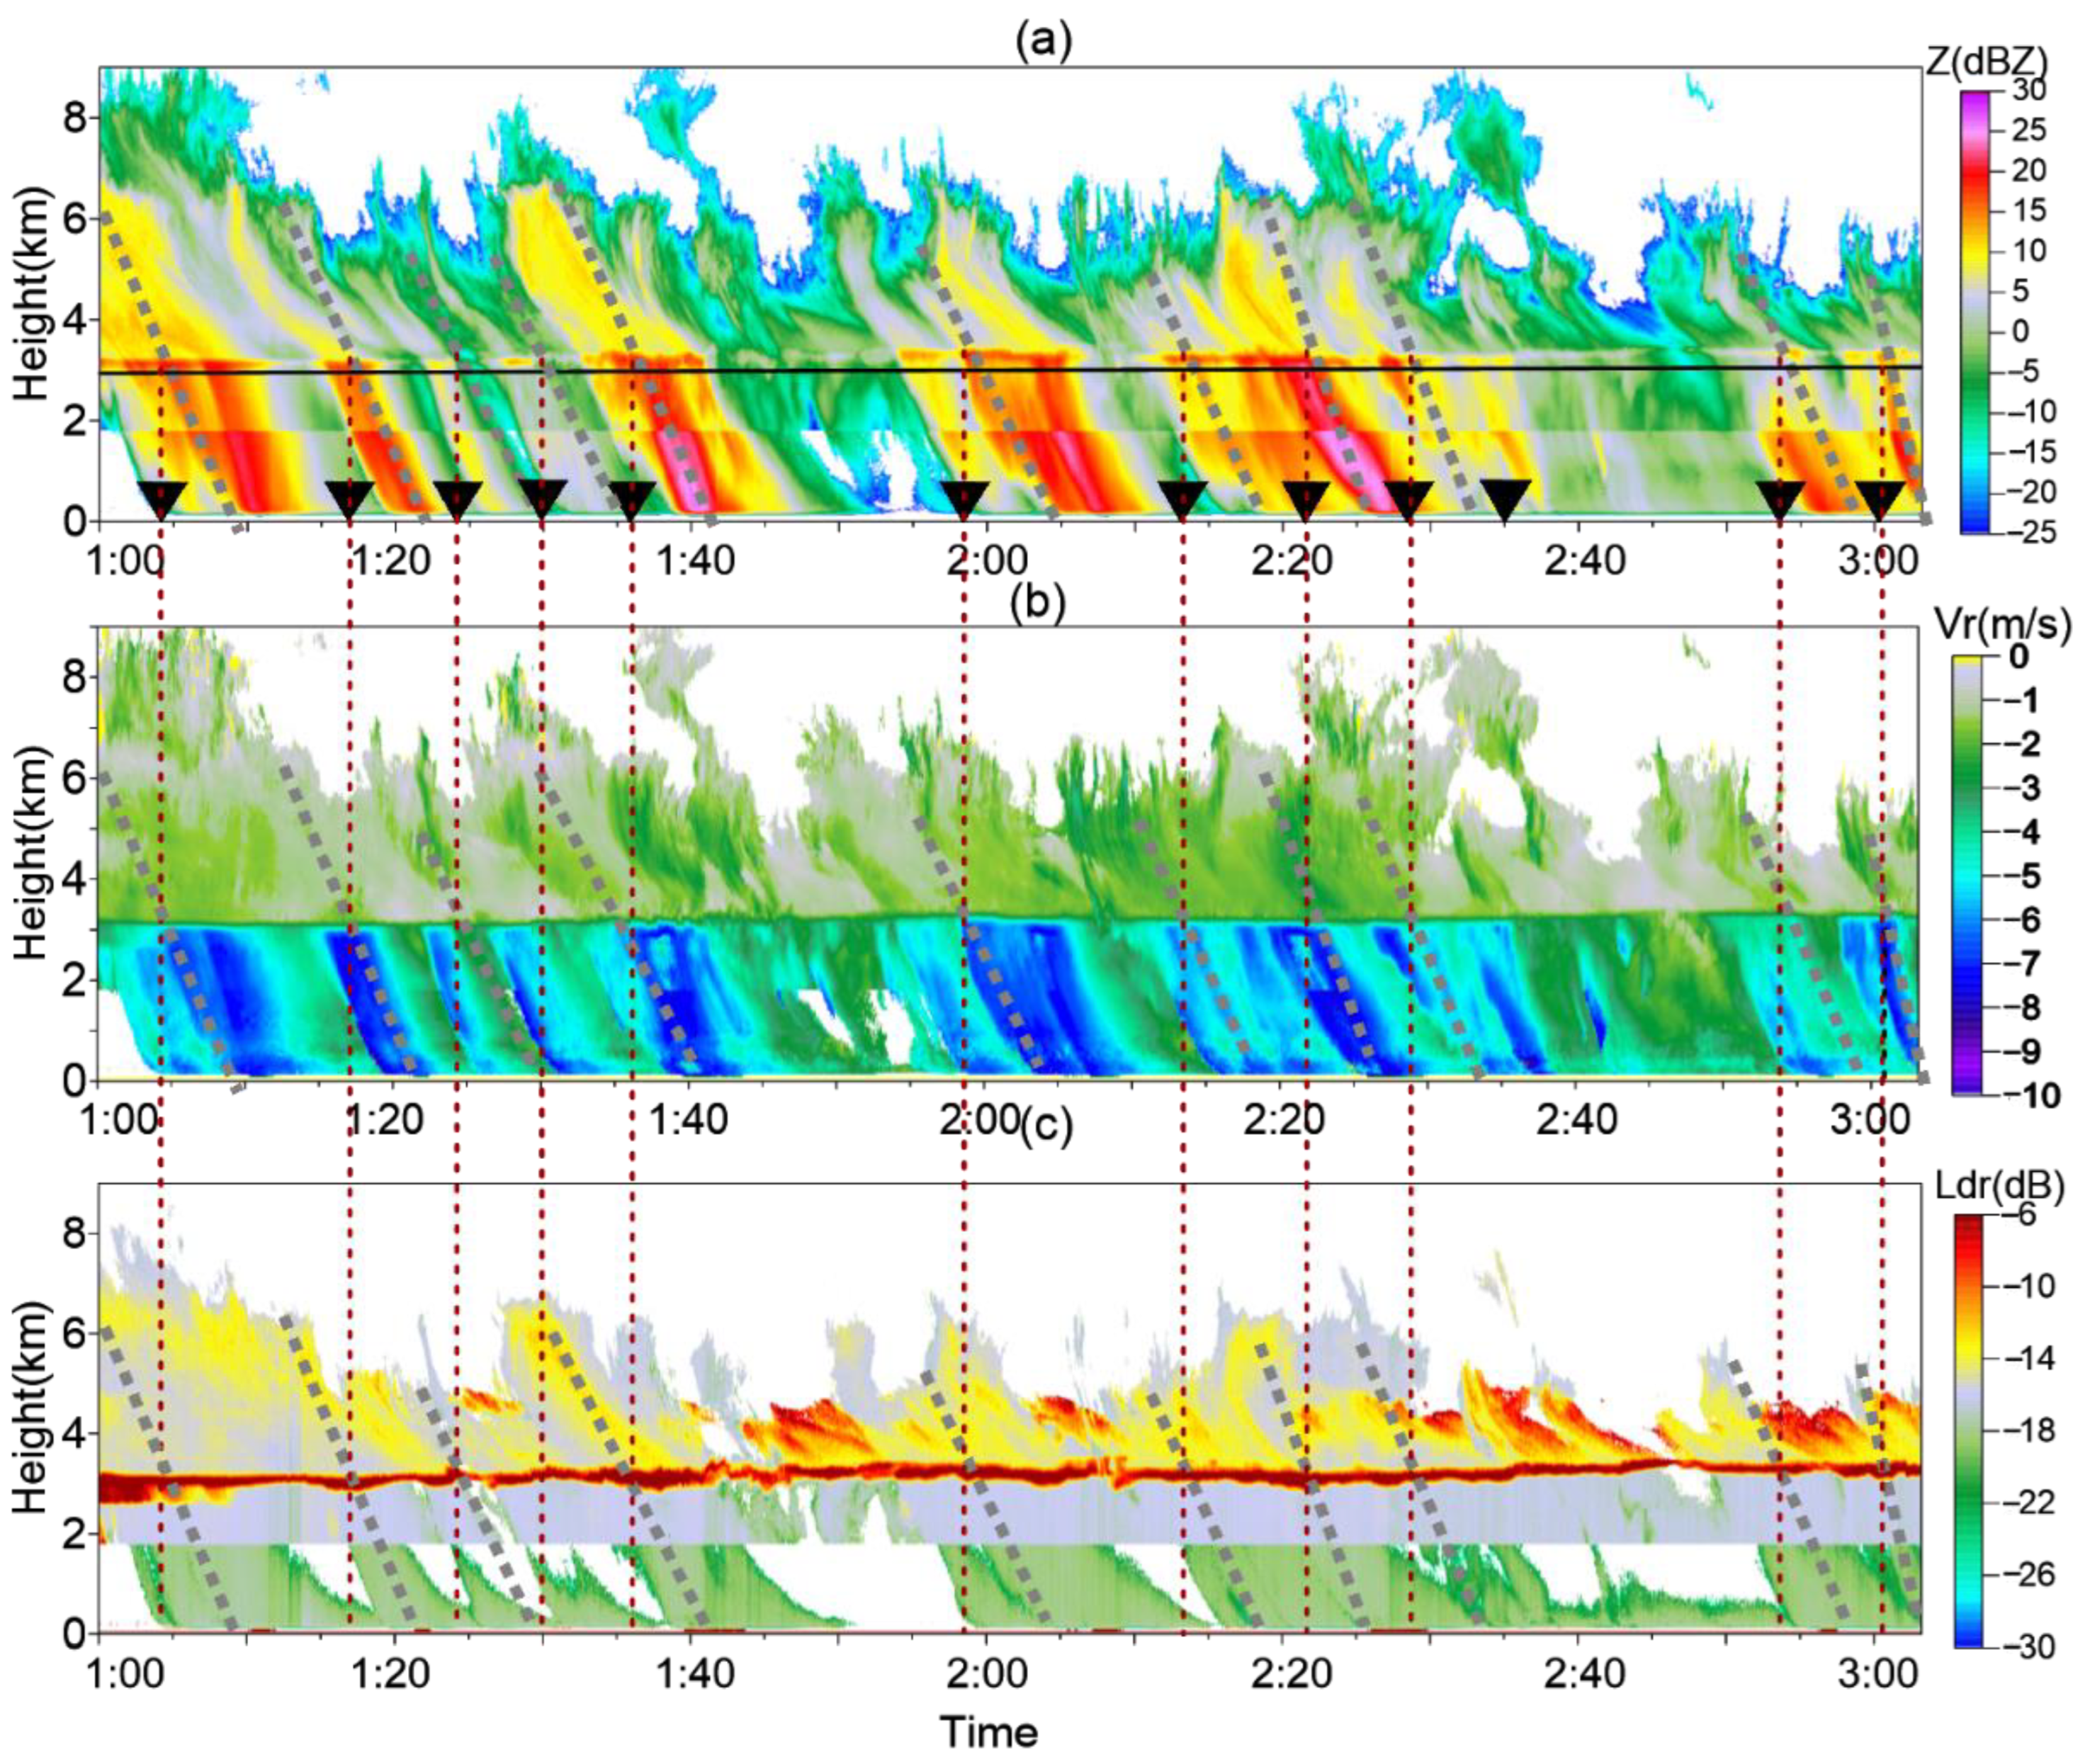
3. Vertical Evolution of DSD in Stratiform Precipitation

3.1. Reliability of MRR Data

This paper focused on two stratiform precipitation cases on 16 June 2021 and 18–19 August 2021 which were stratocumulus cloud and stratiform cloud process respectively. We tried to compare the Z and DSD parameters get by MRR and distrometer to guarantee the reliability of the MRR measurements of the two cases. MRR-observed Z and DSD were chosen at the second distance range (400 m). The DSD parameters Nw, Dm were calculated by a normalized gamma fitting according to Formulas (8) and (9). The comparison results of the two cases are shown in Figure 2. Also, the mean deviations and correlation coefficients between the observations of MRR and distrometer were listed in Table 3.
Observations of MRR at 400 m were generally close to the measured value on the ground by distrometer. Result differences of the case on 16 June were larger than 18–19 August, which showed the errors brought by the moderate vertical airspeed in stratocumulus cloud. The comparison results basically guaranteed the reliability of the MRR measurements of the two cases.

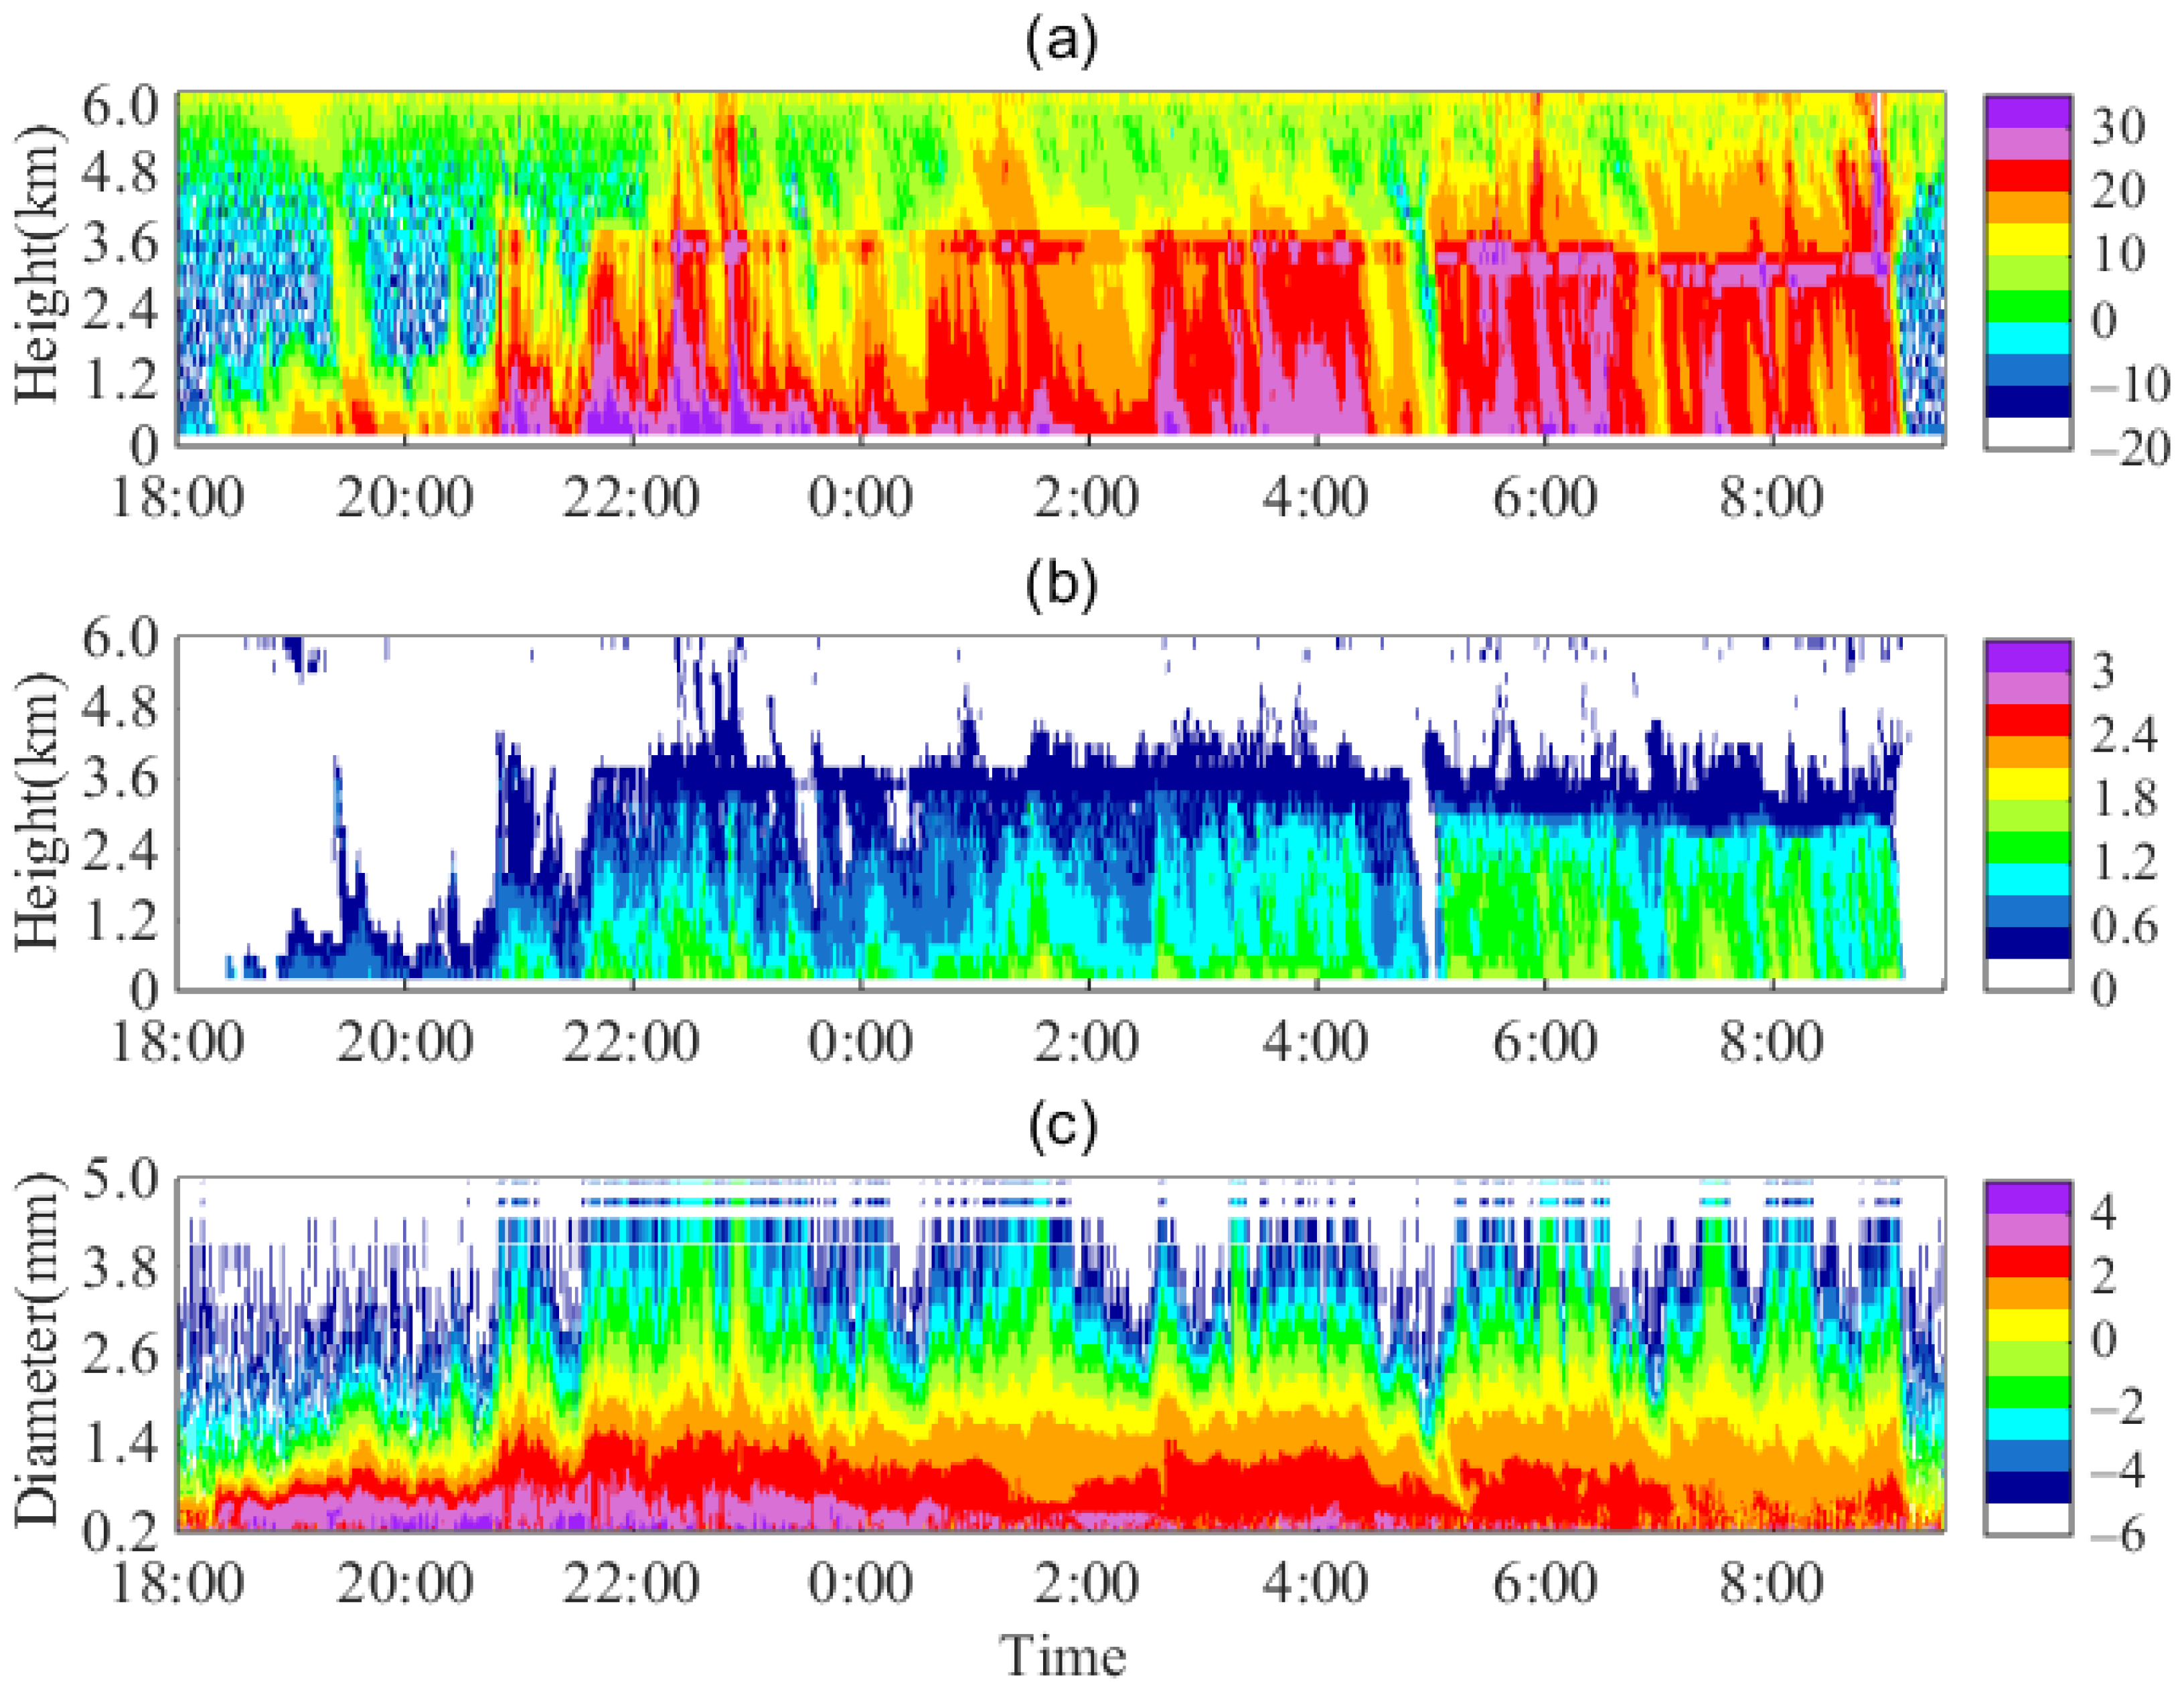
3.2. Stratocumulus Rain on 16 June 2021

On 16 June 2021, a stratocumulus rain process was observed. The rain that started from 0100 UTC was intermittent at first; then, it became continuous from 0300 UTC to 0600 UTC The variation of Z detected by MRR over time is shown in Figure 3a. The maxima of Z exceeded 35 dBZ, and R still fluctuated in two continuous rain stages. The 0 °C height was at approximately 2.7–3 km according to the temperature profiles get from MWR, as shown in Figure 4a. The evolution of Dm at different heights in the whole process was calculated using Formula (9), and the results are shown in Figure 3b. In general, the values of Dm gradually increased in the vertical direction as the heights were reduced. The Dm reached 2 mm near the ground, and all its values exceeded 0.6 mm below the 0 °C layer. To show the evolution of DSD over time during the entire rainfall process, we obtained DSD from MRR at 400 m, and the results are shown in Figure 3c. The ordinate in the Figure 3 represents the particle diameter or D, which ranges from 0.2 to 5 mm. Almost every strong Z value corresponded to a wider DSD; thus, large particles contributed mostly to the reflectivity.
To further explore the evolution of raindrops in the vertical direction, the vertical DSD every minute from 4:00 to 4:11 below the 0 °C layer was obtained in the continuous rain periods. The results are shown in Figure 5. We note that the DSD was wider just below the 0 °C level than at lower levels at 4:01. In addition, the large DSD widths at 1.8–3.10 km formed a bulge shape at 4:02. Then the wider DSDs gradually fell to the surface and became narrower at 4:03. This differed from our previous assumption on DSD. We inferred that due to the collision and integration of raindrops, the DSD should gradually broaden as the height decreases. Here, we found that the DSD expanded in the upper air, forming a ‘bulge’ (bulge shape), and became narrower below this layer. We call this the bulge phenomenon (BP). The wider DSDs of the ‘bulge’ constantly collided and reached the lower air between 4:04 and 4:05. Then, the DSD gradually broadened as the height decreased. Upon reaching a relatively stable state that was maintained to 4:07, the ‘bulge’ appeared below the 0 °C layer again and gradually collided and fell to the ground. This movement of the ‘bulge’ was considered a dynamic circulation, where the ‘bulge’ appeared at 4:12, 4:21, and 4:27 again and again. During the whole process, the BP emerged from time to time.
In order to analyze the microphysical mechanism of the BP, we located the BP that occurred inside the cloud structure. This is marked with a black triangle on the horizontal axis in Figure 6a. We then studied the detailed structure of the cloud according to the Z, Vr and LDR values, which were detected by the CR, as shown in Figure 6. The considered stratocumulus cloud contained convection between 1:00 and 3:03, and the cloud structure also showed gustiness as the convection was passing the station. The 0 °C layer with a bright band above 3 km in Figure 6c indicated the melting layer. Because the horizontal wind was 4–8 m s−1 of the warm layer and increased to 6–12 m s−1 above the 0 °C level, as shown in Figure 4b, the clouds in the upper layer arrived at the station earlier than those in the lower layer; therefore, the clouds were tilted. We used gray dotted lines to roughly mark the tilted structure of the clouds that contained convection.
From the brown vertical dotted line extending from the black triangle to the 0 °C-layer bright band, it can be seen that the Z of the bright band and warm layer above the station began to become stronger around the moment of the occurring BP. We then tracked the vertical evolution of DSD from 1:17 to 1:22 inside one convection structure. As is shown in Figure 7, the ‘bulge’ appeared at 1:17, where the Z increased near the 0 °C layer. Then, with the collision and descent of the ‘bulge’, the DSD expanded along the whole height, and the strong Z gradually spread to the entire warm layer. From the descent and spread of the ‘bulge’ from a high to a low position, we inferred that the large particles of the wide DSDs may have been transmitted downwards from the 0 °C layer.
In the convections with intermittent enhancement 1:00–3:03 on 16 June in Figure 6, larger Vr also spread together with the strong Z along the warm layer, indicating quick falling and collision. The tilted convection structure marked with grey dotted lines developed stronger and higher and the cloud tops were higher. Most BP corresponded to a transient enhancement of cloud echo, quick falling and collision, as well as the development of higher clouds.
Higher cloud top can lead to lower cloud top temperature, generating more ice particles. Ice particles formed near cloud top intermittently and then fell through the underlying cloud, causing the gustiness and instability of particle aggregation. Thus, a larger number of big particles could combine, which was reflected in the BP in the rain of the warm layer below the 0 °C layer. This resulted in quick collisions and falling of particles, which enhanced stratiform precipitation, generated the rain shafts among the stratocumulus rain process. Tamir et al. [20] verified the important role that large particle played in initiating precipitation via rapid collision and accelerated particle growth in different types of clouds and precipitations. The appearance of large particles, including these in the ‘bulge’, is considered the start of rapid collisions and the mechanism of rain shafts. Therefore, there maybe two processes in the cloud: a continuous rainfall with drops up to around 1 mm and an intermittent process that yielded larger drops that fell through the continuous rain.

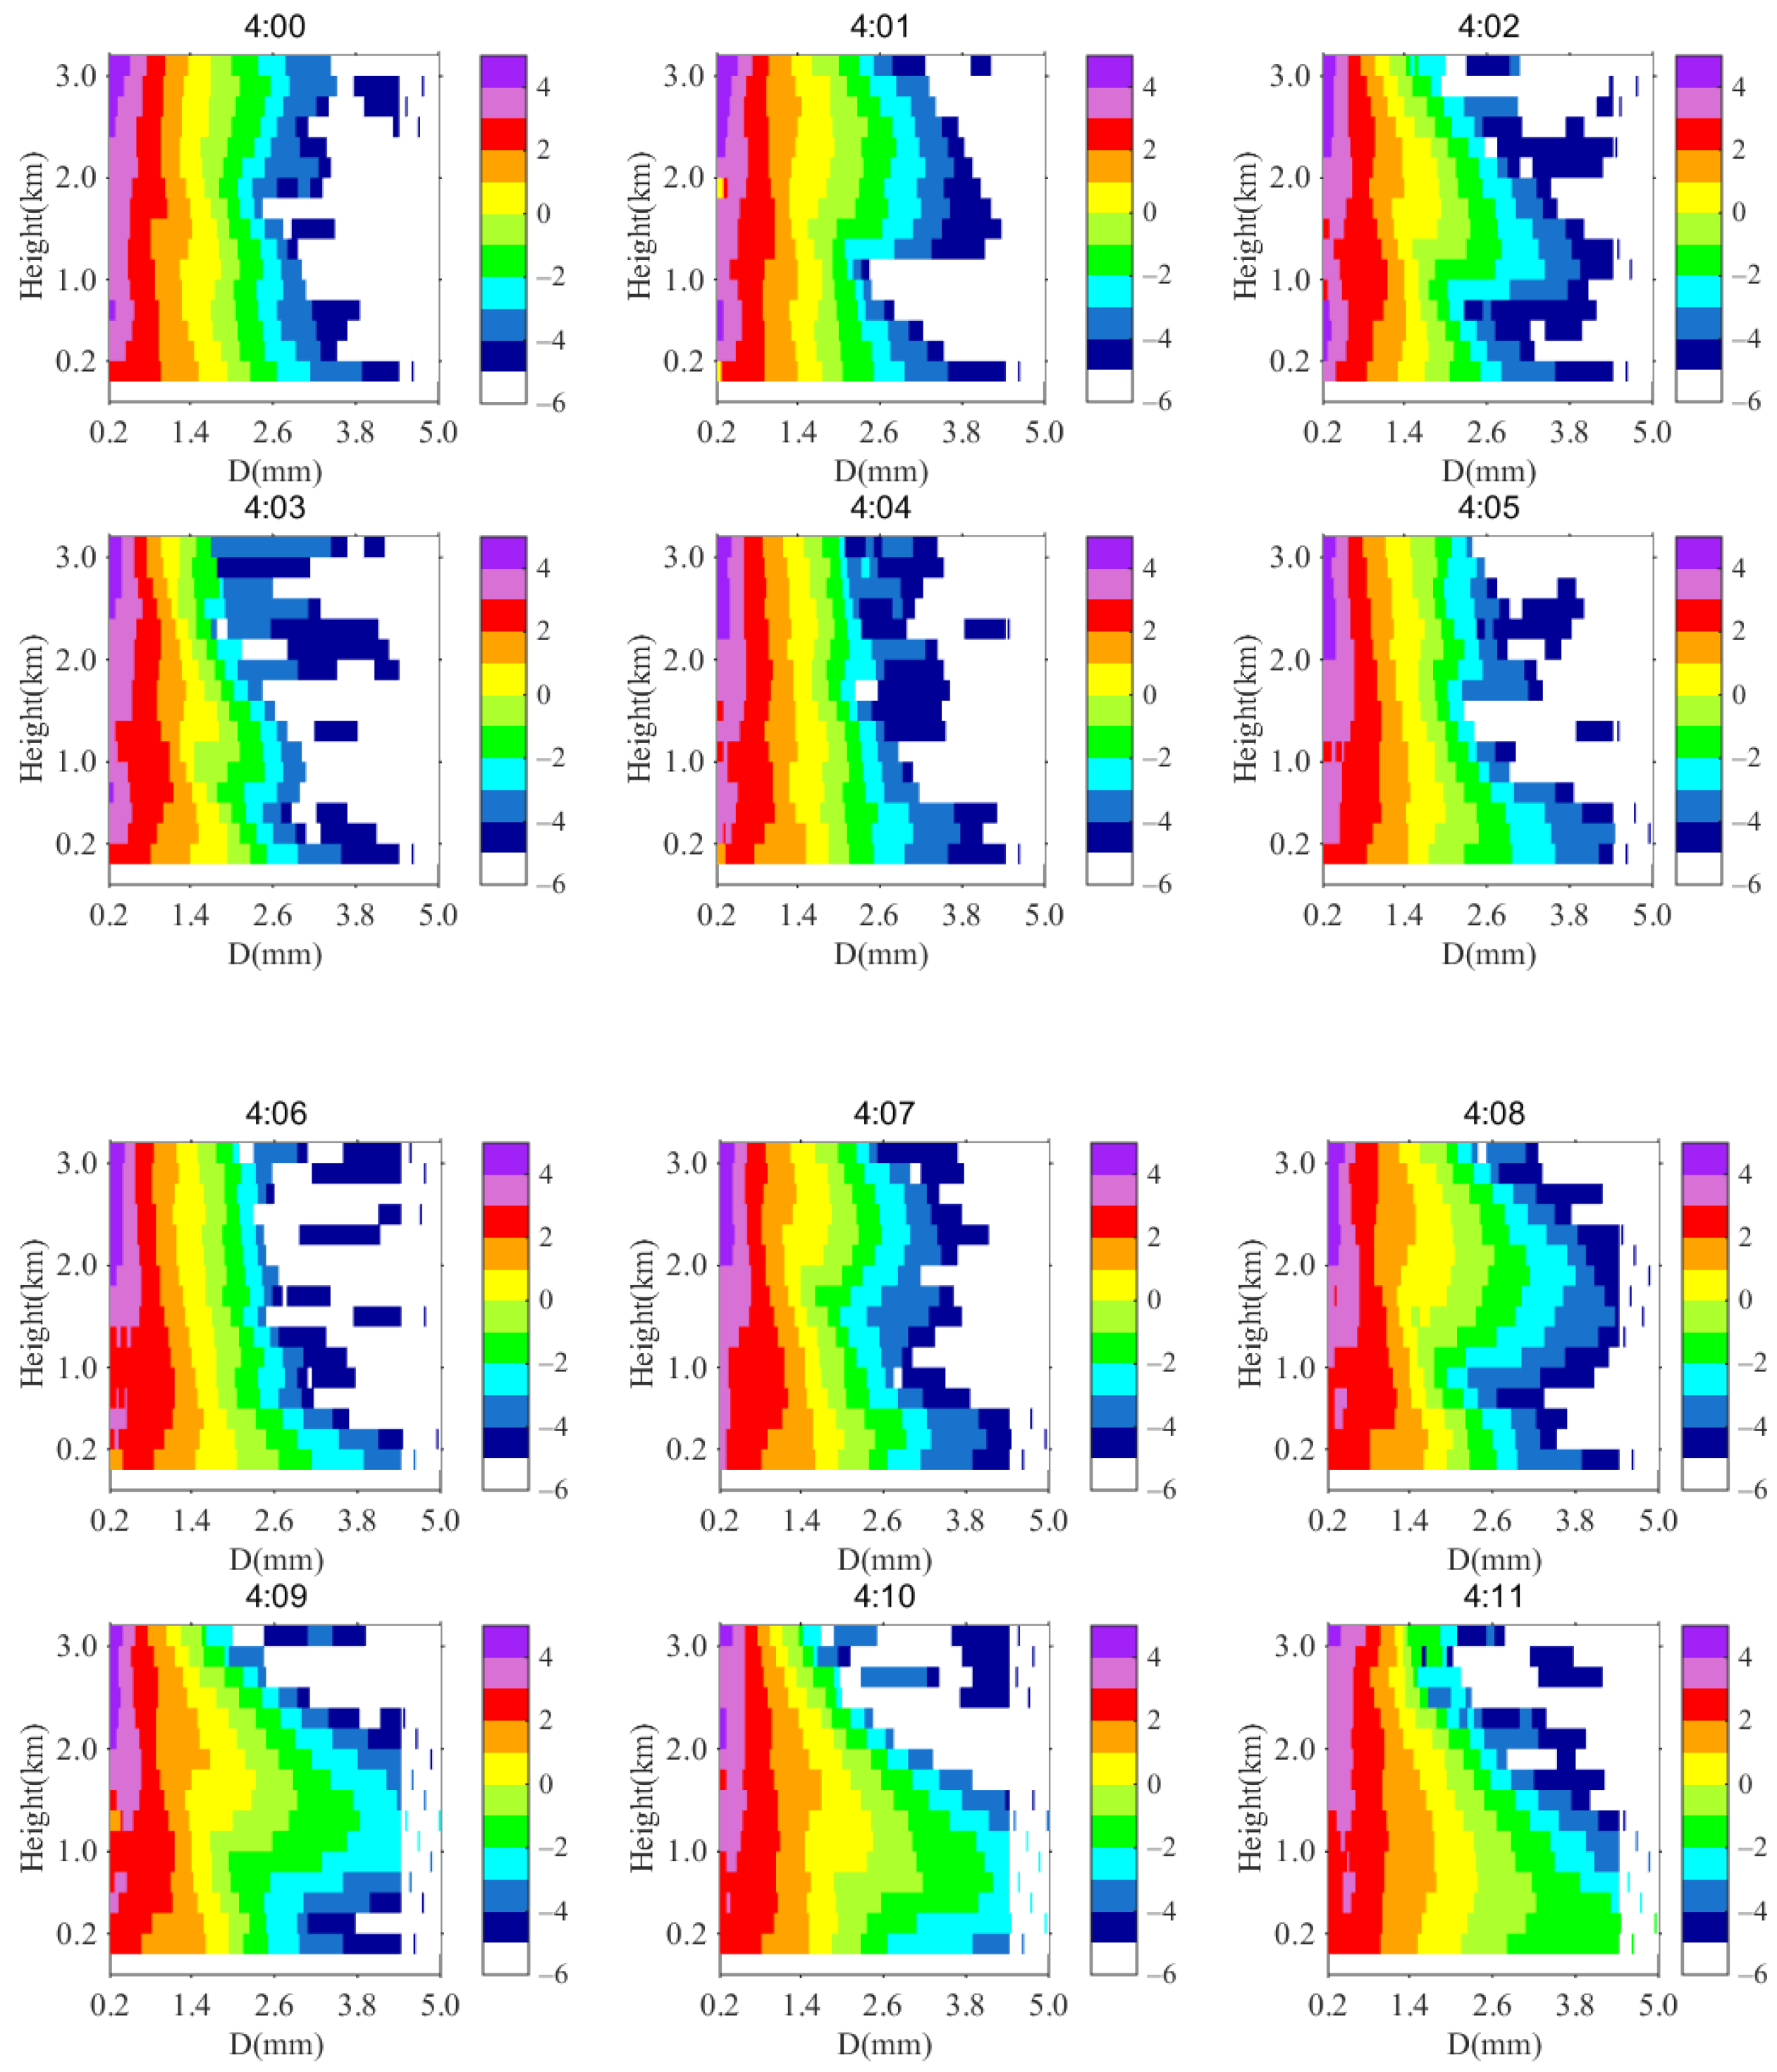
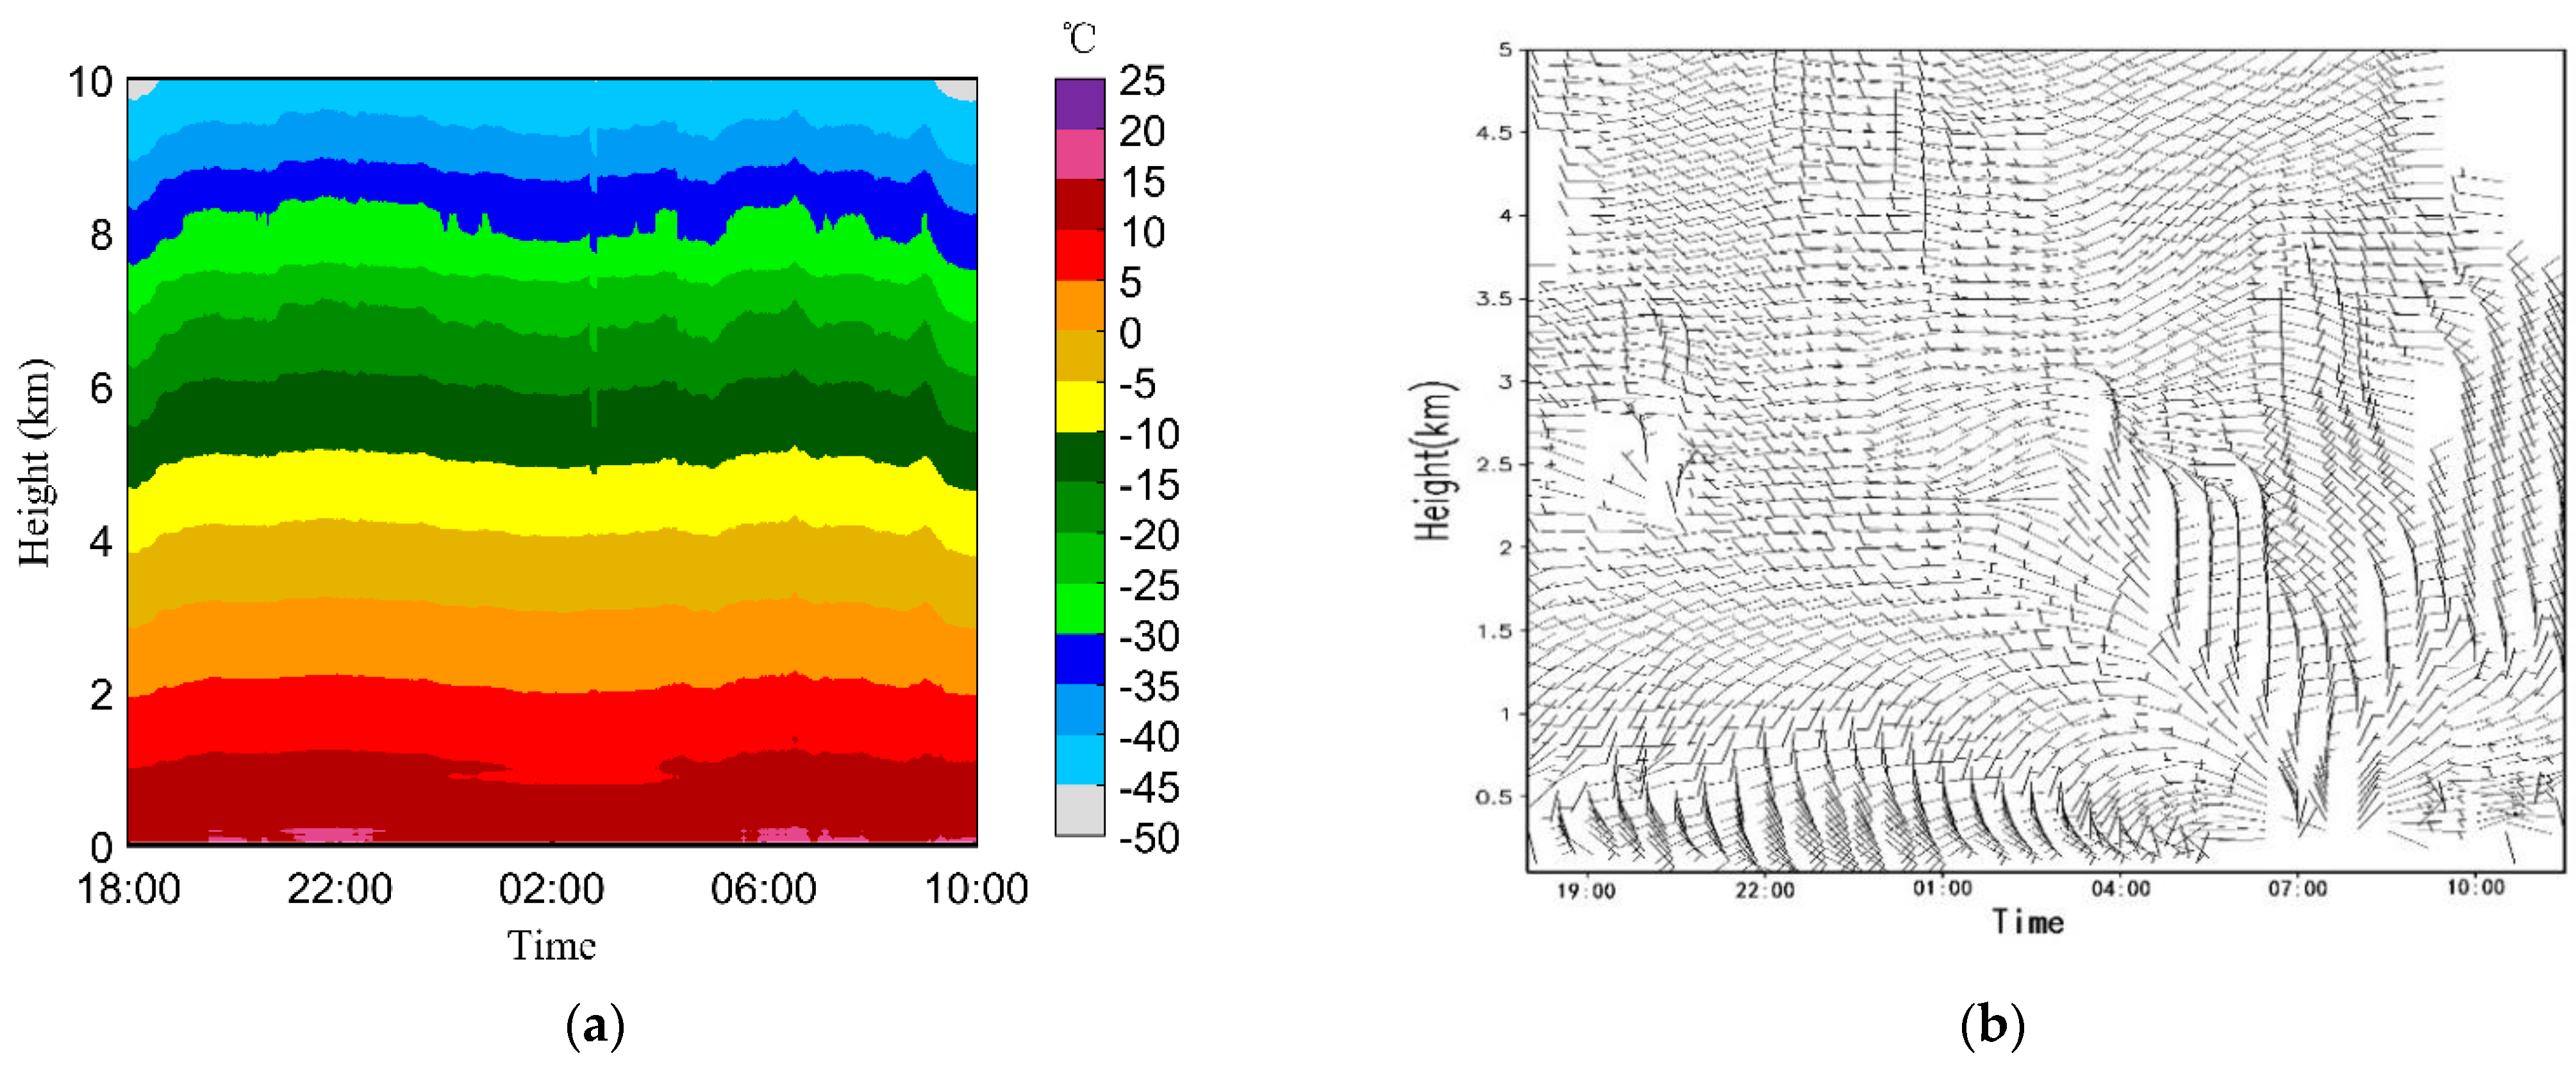
3.3. Stratiform Rain on 18–19 August 2021
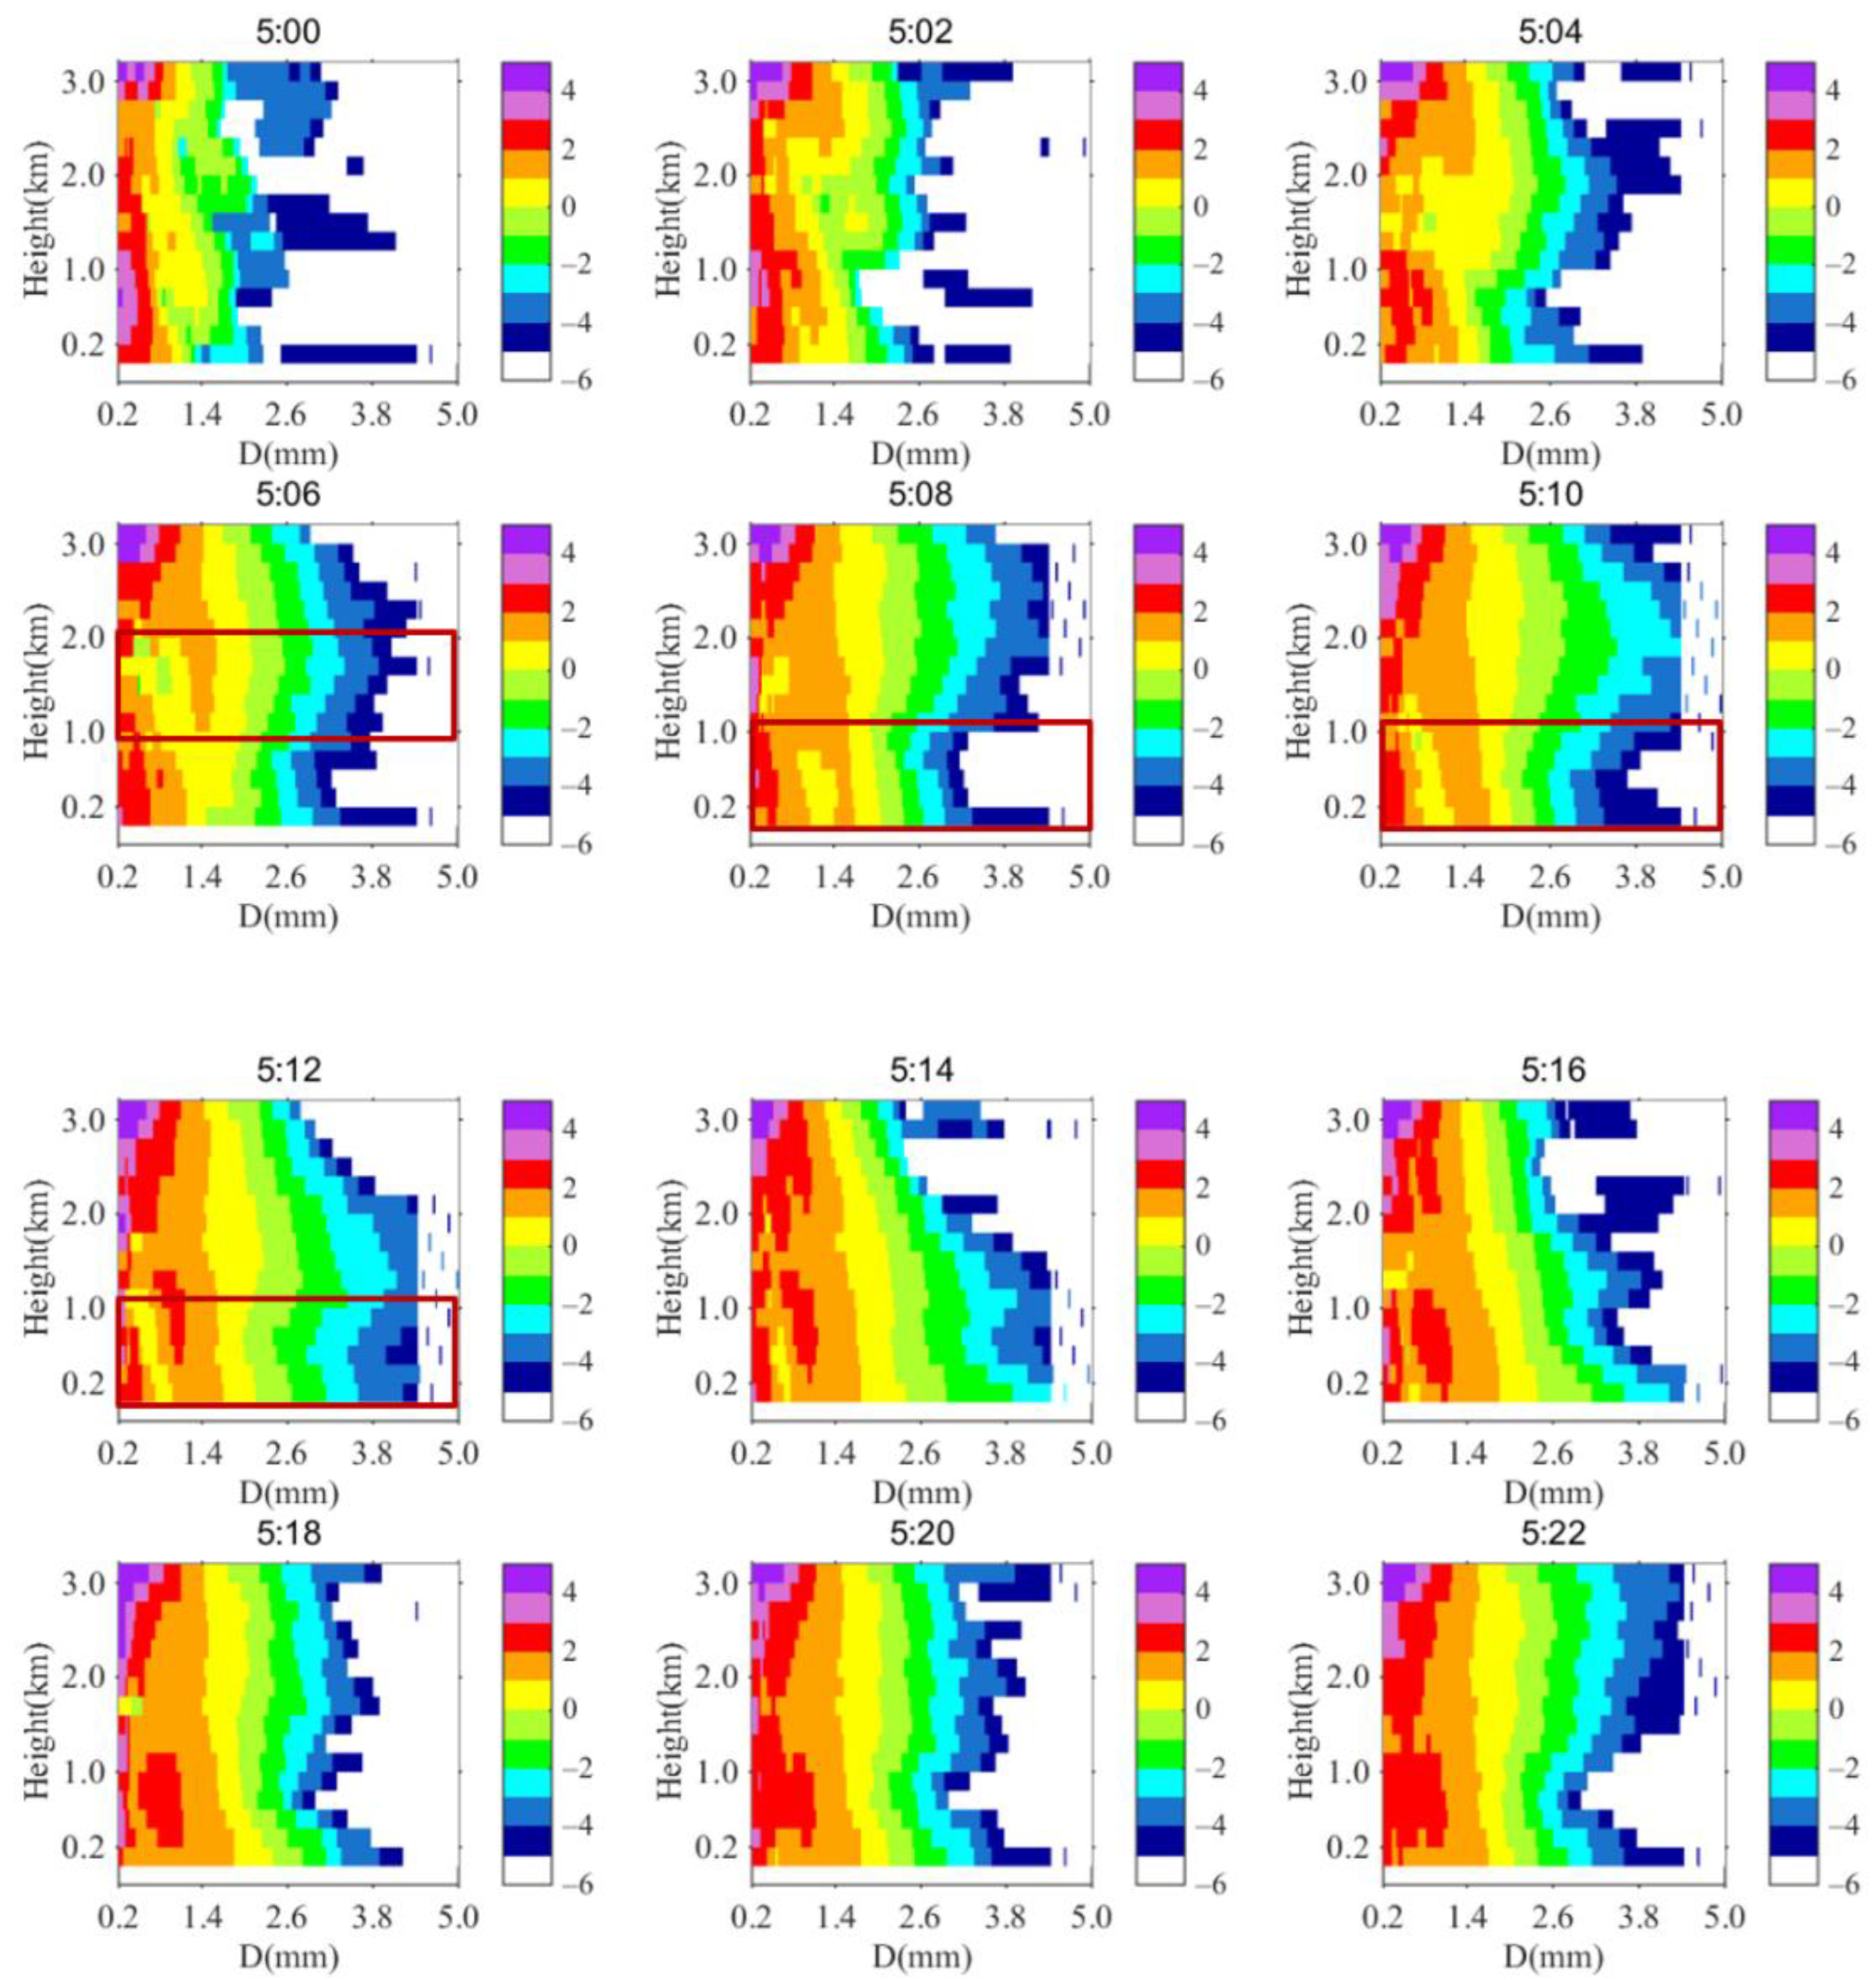
From 18 August 2021, at 1800 UTC to 19 August 2021, at 0930 UTC, a long-lasting stratiform rain with strong R and Z > 35 dBZ was observed, as shown in Figure 8. The Dm values were from 0.9 mm below the 0 °C layer to 2 mm near the ground. In the latter half of the precipitation and after a short pause at approximately 5:00 on August 19, the rain was heavier with more large particles. The temperature profile from the MWR showed that the heights of the 0 °C layer were between 3.1 and 3.3 km, as is shown in Figure 9a. The horizontal wind profiles within the entire layer, is shown in Figure 9b.
The vertical evolution of DSD every 2 min between 5:00 and 5:22 is shown in Figure 10. We note that when the ‘bulge’ in the upper air collided and fell at 5:06, a belt of falling large particles fell to 1 to 2 km rapidly, and the DSD showed a bimodal distribution (marked with red rectangle). This revealed the instantaneous aggregation, collision, growth, and descent of the large raindrops. From 5:08 to 5:12, the DSD still showed a bimodal distribution from the ground to approximately 1.5 km. Meanwhile large particles in the above layer continued to supplement and formed a ‘bulge’ at 5:08 and gradually collided and fell to the ground at 5:14. Again, the particles in the upper air started a new round of growth after 5:20. Large raindrops gathered, collided, and descended, forming a ‘bulge’, which propagated in the entire warm layer continuously. BP similarly caused the transient change in the continuous stratiform rain.
From the period between 5:00–7:47 on 19 August, we observed a stratiform precipitation process in Figure 11. The horizontal wind, which was basically between 4 and 10 m s−1 within the entire layer, is shown in Figure 9b. During this period the wind became stronger and the cloud body was more tilted than before. More uniform echoes were observed but transient change still existed. Similarly, with the appearance of BP, the DSD expanded along the whole height, so as the strong Z and large Vr.
We tried to divide BP into several stages to obtain more information about the detailed changes according to its developing features. As is shown by the interval 4:01–4:03 on 16 June in Figure 5, as well as 5:00–5:14 on 19 August in Figure 10, broader DSDs in the ‘bulge’ appeared below the 0 °C layer. Then, with the collision and descent of the ‘bulge’, the broad DSDs expanded along the whole height, and fell to the ground. Finally, DSD roughly formed a vertical distribution pattern that DSD gradually widened as the height decreases. We define this stage as broadening stage (BS) of BP.
Changes of DSD parameters for both MRR and distrometer responded to each BP occurring, showing the same intermittency. Figure 12 shows the time series of DSD parameters detected by MRR and distrometer during 4:47–7:57. We used triangles with colors on the horizontal axis to mark each BP occurring time, and the dotted lines with colors marked the ending moment of each BS, referring to the moment that broad DSD in the ‘bulge’ reached the surface finally. From each BP occurring time to the corresponding BS ending time, Dm basically grew from small to large. After this, Dm decreased immediately or maintained for a while and then decreased. This depended on whether large particles were supplemented continuously from the upper air to the ground. If there were supplements, Dm will maintain or slightly increase before it decreased. Similarly, log10 (Nw) had the opposite trend to Dm. It generally decreased to a lower point at the end of BS, and may increase directly or keep decreasing slightly for a while and then increased again. MRR and distrometer all showed that Z gradually increased after most BP appeared.
We first defined the time interval form one BP occurring to the next BP occurring as BPT, to show the fluency of BP. We tried to find the relationship between R and the BPT, to confirm that if larger R can promote the occurrence of BP. After the BS, the DSD became narrower and attenuated over time. The vertical DSD in the entire layer during the period from 5:14 to 5:16 in Figure 10 was relatively stable until the appearance of next BP below the 0 °C layer at 5:18. This period was called the stable stage (SS). Each BPT consists of BS and SS. Sometimes, there were some broader DSDs existing below 0 °C, but they didn’t collide from high to low and get to the ground, which cannot be called BP but expanding the BPT incorrectly. So we ignored them. BPT was calculated by SS before this BP occurring time plus BS after this BP occurring time. According to this definition, the BPT values during the rain on 18–19 August 2021, were counted and the results are shown in Table 4.
Taking the BP appearance number (BT Number) as the abscissa, the relationship between the BPT and the R from distrometer at these BP appearance moments was determined. The results are shown in Figure 13. The variation trend of the BPT (dotted line in red) was roughly opposite to R (dotted line in black). Their correlation coefficient was −0.52. Larger R accelerate the fluency of BP.

4. Discussion

We analyzed two stratiform precipitation cases in Haituo Mountain during the summer of 2021. We found that the vertical DSD contained certain features, including the appearance of wider DSDs in the upper air below the 0 °C layer and the formation of a ‘bulge’. The ‘bulge’ in the upper air kept colliding fast and gradually descended to the ground. In addition, the DSD in the entire warm layer broadened along with the descent of the ‘bulge’. This was called the BP.
Each BP was accompanied by the transient enhancement of the cloud echo, radial falling velocity detected by radar and high developing cloud tops. Higher cloud top leads to lower cloud top temperature, generating more ice particles. Ice particles formed near cloud top intermittently and then fell through the underlying cloud, causing the gustiness and instability of particle aggregation. Therefore, a larger number of big particles converged, which was reflected by the BP below the 0 °C layer in the rain of the warm layer. We witnessed cycles of large raindrops that accumulated, collided, and descended throughout the warm layer. This created the transience and gustiness of the continuous stratiform or stratocumulus precipitation. We also observed that the BP was not only the mechanism of rain intensity enhancement but also a trigger for rainfall restart when precipitation and cloud are weak. This can effectively give a promotion to precipitation generation and break a stable state.
We defined the time interval form one BP occurring to the next BP occurring as BPT, to show the fluency of BP and each BPT consists of broadening stage (BS) and stable stage (SS). We found that changes of DSD parameters for both MRR and distrometer responded to each BP occurring, showing the same intermittency. From each BP occurring time to the corresponding BS ending time, Dm basically grew from small to large. After this, Dm decreased immediately or maintained for a while and then decreased. log10(Nw) had the opposite trend to Dm. MRR and distrometer all showed that Z gradually increased after most BP appeared. Also, our analysis of the stratiform precipitation on 18–19 August showed that Larger R accelerate the fluency of BP.
In addition, BPT was observed to be related to many other factors, which were not discussed further in this paper. These factors include the cloud height, which was related to the length of the growing path of particles from cold layer to warm layer. The BPT may be suppressed by a strong horizontal wind speed and affected by small-scale wind shear. Last but not least, vertical air motions can be essential mechanisms affecting the BP because it can not only affect the development of the cloud but also causes the gustiness and instability of particle aggregation; however, relationships between them have not been studied. In the future, the inversion of vertical airspeed in the observations needs to be improved. In addition, the model of precipitation intensity change brought by the BP needs to be established.

Author Contributions

Conceptualization, N.M.; methodology, N.M. and Z.J.; software, N.M.; validation, L.L., Y.C. and X.M.; data curation, N.M.; writing—original draft preparation, N.M.; writing—review and editing, Z.J., Y.C. and Y.H. All authors have read and agreed to the published version of the manuscript.

Funding

This research was funded by the National Key R&D Program of China(Grant No. 2019YFC1510301), the National Natural Science Foundation of China (Grant No. 42075092) and the Science and Technology Project of Beijing Meteorological Bureau of China (Grant No. BMBKJ202003012).

Institutional Review Board Statement

Not applicable.

Informed Consent Statement

Not applicable.

Data Availability Statement

Not applicable.

Acknowledgments

We are grateful to Xia Li in Beijing Weather Modification Center for her help in providing distrometer data, and to Dian Wen for providing synoptic analysis.

Conflicts of Interest

The authors declare no conflict of interest.

References

  1. Kollias, P.; Albrecht, B.A. The turbulence structure in a continental stratocumulus cloud from millimeter-wavelength Radar observations. J. Atmos. Sci. 2000, 57, 2417–2434. [Google Scholar] [CrossRef]
  2. Bringi, V.N.; Chandrasekay, V.; Hubbert, J.; Gorgucci, E.; Randeu, W.L.; Schoenhuber, M. Raindrop size distribution in different climate regimes from distrometer and Dual-Polarized Radar Analysis. J. Atmos. Sci. 2003, 60, 354–365. [Google Scholar] [CrossRef]
  3. Geoffroy, O.; Siebeama, A.P.; Bumet, F. Characteristics of the raindrop distribution in RICO shallow cumulus. Atmos. Chem. Phys. 2013, 14, 10897–10909. [Google Scholar] [CrossRef] [Green Version]
  4. Rao, T.N.; Kirankumar, N.V.P.; Radhakrishna, B.; Rao, D.N. On the variability of the shape-slope parameter relations of the shape-slope parameter relations of the gamma raindrop size distribution model. Geophys. Res. Lett. 2006, 33, 351–361. [Google Scholar] [CrossRef]
  5. Peters, Q.; Fischer, B.; Munster, H.; Clemens, M.; Wagner, A. Profiles of raindrop size distribution as retrieved by Micro rain radars. J. Appl. Meteorol. 2005, 44, 1930–1949. [Google Scholar] [CrossRef]
  6. Li, H.; Yin, Y.; Shan, Y.P.; Jin, Q. Statistical characteristics of raindrop size distribution for stratiform and convective precipitation at different altitudes in Mt. Huangshan. Chin. J. Atmos. Sci. 2018, 42, 268–280. (In Chinese) [Google Scholar] [CrossRef]
  7. Shupe, M.D.; Kollias, P.; Poellot, M.; Eloranta, E. On Deriving Vertical Air Motions from Cloud Radar Doppler Spectra. J. Atmos. Ocean. Technol. 2008, 25, 547. [Google Scholar] [CrossRef] [Green Version]
  8. Liu, L.P.; Xie, L.; Cui, Z.H. Examination and application of Doppler spectral density data in drop size distribution retrieval in weak precipitation by cloud radar. Chin. J. Atmos. Sci. 2014, 38, 223–236. (In Chinese) [Google Scholar] [CrossRef]
  9. Wen, L.; Liu, S.; Zhao, K.; Li, Y.; Li, L. Precision Evaluation of Micro Rain Radar Observation in Two Precipitation Events. Meter. Mon. 2015, 41, 577–587. (In Chinese) [Google Scholar] [CrossRef]
  10. Wen, L.; Zhao, K.; Zhang, G.; Xue, M.; Zhou, B.; Liu, S.; Chen, X. Statistical Characteristics of Raindrop Size Distributions Observed in East China during the Asian Summer Monsoon Season using 2D-Video Disdrometer and Micro-rain Radar Data. J. Geophys. Res. Atmos. 2016, 121, 2265–2282. [Google Scholar] [CrossRef] [Green Version]
  11. Wang, H.; Lei, H.C.; Yang, J.F. Microphysical processes of a stratiform precipitation event over eastern China: Analysis using micro rain radar data. Adv. Atmos. Sci. 2017, 34, 1472–1482. [Google Scholar] [CrossRef]
  12. Ma, N.K.; Liu, L.P.; Zheng, J.F. Application of Doppler spectral density data in vertical air motions and drop size distribution retrieval in cloud and precipitation by Ka-band Millimeter Radar. Plateau Meteorol. 2019, 38, 325–339. (In Chinese) [Google Scholar] [CrossRef]
  13. Cifelli, R.; Rutledge, S.A. Vertical motion structure in maritime continent mesoscale convective systems: Results from a 50-MHz profiler. J. Atmos. Sci. 1994, 51, 2631–2652. [Google Scholar] [CrossRef] [Green Version]
  14. Konwar, M.; Maheskumar, R.S.; Das, S.K.; Morwal, S.B. Nature of light rain during presence and absence of bright band. J. Earth Syst. Sci. 2012, 121, 947–961. [Google Scholar] [CrossRef] [Green Version]
  15. Konwar, M.; Das, S.K.; Deshpande, S.M.; Chakravarty, K.; Goswami, B.N. Microphysics of clouds and rain over the Western Ghat. J. Geophys. Res. Atmos. 2014, 119, 6140–6159. [Google Scholar] [CrossRef]
  16. Das, S.; Maitra, A. Vertical profile of rain: Ka band radar observations at tropical locations. J. Hydrol. 2016, 534, 31–41. [Google Scholar] [CrossRef]
  17. Barber, P.; Yeh, C. Scattering of electromagnetic waves by arbitrarily shaped dielectric bodies. Appl. Opt. 1975, 14, 2864–2872. [Google Scholar] [CrossRef] [PubMed]
  18. Gossard, E.E. Measurement of cloud droplet size spectra by Doppler radar. J. Atmos. Ocean. Technol. 1994, 11, 712–726. [Google Scholar] [CrossRef] [Green Version]
  19. Testud, J.; Oury, S.; Black, R.A.; Amayenc, P.; Dou, X. The Concept of “Normalized” Distribution to Describe Raindrop Spectra: A Tool for Cloud Physics and Cloud Remote Sensing. J. Appl. Meteorol. 2001, 40, 1118–1140. [Google Scholar] [CrossRef]
  20. Reisin, T.G.; Yan, Y.; Levin, Z.; Tzivion, S. Development of giant drops and high-reflectivity cores in Hawaiian clouds: Numerical simulations using a kinematic model with detailed microphysics. Atmos. Res. 1998, 45, 275–297. [Google Scholar] [CrossRef]
Figure 1. Location (a) and equipment layout (b) of YJP Station in the Haituo Mountain District of Beijing.
Remotesensing 14 01655 g001
Figure 2. Time series of Z and DSD parameters of stratiform rain cases on 16 June 2021(UTC): (a) Z (dBZ), (b) log10(Nw) and (c) Dm (mm) and on 18–19 August 2021(UTC): (d) Z (dBZ), (e) log10(Nw) and (f) Dm (mm), detected by Distrometer (black line) and MRR (red line) on YJP station.
Remotesensing 14 01655 g002
Figure 3. Time–height cross-sections of stratocumulus rain detected by MRR from 0100-0600 (UTC) on16 June 2021: (a) reflectivity factor (Z) (dBZ), (b) mass-weighted mean diameter (Dm) (mm) and (c) DSD at 400 m (mm−1 m−3 on log scale).
Remotesensing 14 01655 g003
Figure 4. Time–height cross-sections of temperature (a) detected by MWR and wind profiles (b) detected by WPR from1:00–6:00 on 16 June 2021 in YJP station.
Remotesensing 14 01655 g004
Figure 5. Vertical evolution of DSD every 1 min detected by MRR below 0 °C layer between 4:00 and 4:11 on 16 June 2021.
Remotesensing 14 01655 g005
Figure 6. Time–height cross sections of the stratocumulus rain detected by CR from 1:00 to 3:03 on June 16, 2021, with (a) Z (dBZ), (b) Vr (m s−1) and (c) LDR (dB). The grey dotted lines roughly mark the tilted structure of the clouds that contained convection. The black triangles on the horizontal axis mark the BP occurring moment. The black horizontal lines mark the 0 °C line. The brown dotted vertical lines extend from the black triangle to the 0 °C-layer bright band between 2.7 and 2.9 km.
Remotesensing 14 01655 g006
Figure 7. Detailed time–height cross sections of Z detected by CR from 1:00 to 1:50, vertical evolution of DSD from 1:36 to 1:41 are drawn in the blank area.
Remotesensing 14 01655 g007
Figure 8. Time–height cross-sections of stratiform rain detected by MRR from 18:00 on 18 August 2021 to 9:30 on 19 August 2021: (a) reflectivity factor Z (dBZ), (b) mass-weighted mean diameter (mm) and (c) DSD at 400 m.
Remotesensing 14 01655 g008
Figure 9. Time–height cross-sections of temperature (a) detected by MWR and wind profiles (b) detected by WPR from18:00 on18 August-10:00 on 19 August 2021 in YJP station.
Remotesensing 14 01655 g009
Figure 10. Vertical evolution of DSD every 2 min detected by MRR below 0 °C layer between 5:00 and 5:22 on 19 August 2021.
Remotesensing 14 01655 g010
Figure 11. Time–height cross sections of the stratiform rain detected by CR on 19 August 2021, from 4:47–7:57 with (a) Z (dBZ), (b) Vr (m/s) and (c) LDR (dB). The black triangles on the horizontal axis mark the BP occurring moment. The black horizontal lines mark the 0 °C line. The black dotted vertical lines extend from the black triangle to the 0 °C-layer bright band between 3.1 and 3.2 km.
Remotesensing 14 01655 g011
Figure 12. Time series of DSD parameters in stratiform rain detected by distrometer (black line) and MRR (red line) on 19 August 2021, from 4:47–7:57 with (a) Z (dBZ), (b) log10(Nw) and (c) Dm (mm). The triangles with colors on the horizontal axis to mark the BP occurring time, and the dotted lines with colors marked the ending moment of BS.
Remotesensing 14 01655 g012
Figure 13. Time series of BPT (red line, unit: min), R (black line, unit: mm h−1) and DSD parameters (lg (Nw) (dark green line, unit: mm−1.m−3 on log scale)), Dm (light green line, unit: mm), μ (blue line) on 18–19 August 2021.
Remotesensing 14 01655 g013
Table 1. The main specifications of MRR and Cloud Radar.
ParameterMRRCloud Radar
ModelMRR-2 HMB-KST
Transmitting frequency24.230 GHz (K-band)33.4 GHz (Ka-band)
Wavelength12.38 mm8.5 mm
3 dB beam width0.3°
Range resolution200 m30 m
Temporal resolution10–3600 s (adjustable)3 s
Nyquist velocity range−12.19~12.19 m·s−1−18.54~18.54 m·s−1
Height range0~6.2 km0~15.3 km
Primary detection objectPrecipitationNon-precipitation clouds, weak precipitation clouds, weak precipitation
Detecting elementsReflectivity(Z), Doppler spectrum, DSD, R, LWCReflectivity (Z), radial velocity (Vr), velocity spectrum width (Sw), liner depolarization ratio (LDR), Doppler spectrum
Detection modeVertical pointingVertical pointing, and other detection modes
Table 2. Main specifications of distrometer.
ParameterDistrometer
ModelOTT Parsivel
Sensor typeLaser transmitter
Wavelength785 nm
Sensor componentsRed laser shooting
Weather type22 classes (no rain, fog, rain, snow, drizzle, hail, etc.)
Measurement area54 cm
Measurement rangeParticle size: 0~25 mm
Velocity: 0~20 m s−1
Rain intensity: 0.001~1200 mm h−1
Height range0~15.3 km
Measurement range Non precipitation clouds, weak precipitation clouds, weak precipitation
Detection principleA combination of extinction with forward
scattering
Working temperature−40~+60 °C
Table 3. The mean deviations and correlation coefficients and of Z, log10(Nw) and Dm between MRR and disdrometer of two stratiform precipitation cases.
Rain ParameterStatistics16 June 202118–19 August 2021
Zmean deviation3.252.23
correlation coefficient0.920.89
log10(Nw)mean deviation0.480.14
correlation coefficient0.700.93
Dmmean deviation0.160.09
correlation coefficient0.650.94
Table 4. Statistics of BPT during the rain on 18 to 19 August 2021.
BP NumberBSSSBPT (min)
1-3:17–3:24 (8 min)
23:25–3:32 (8 min)3:33–3:44 (12 min)8 + 8 = 16
33:45–3:49 (5 min)3:50–3:57 (8 min)12 + 5 = 17
43:58–4:03 (6 min)4:04–4:09 (6 min)8 + 6 = 14
54:10–4:15 (6 min)4:16–4:21 (6 min)6 + 6 = 12
64:22–4:26 (5 min)4:27–4:35 (9 min)6 + 5 = 11
74:37–4:46 (10 min)4:47–4:58 (12 min)9 + 10 = 19
85:00–5:13 (14 min)5:14–5:17 (4 min)12 + 14 = 26
95:18–5:32 (15 min)5:33–5:42 (10 min)4 + 15 = 19
105:43–5:48 (6 min)5:49–5:50 (2 min)10 + 6 = 16
115:51–5:58 (8 min)5:59–6:05 (7 min)2 + 8 = 10
126:06–6:11 (6 min)6:12–6:16 (5 min)7 + 6 = 13
136:25–6:32 (8 min)6:32–6:33 (2 min)5 + 8 = 13
146:33–6:38 (6 min)6:39–6:58 (20 min)2 + 6 = 8
156:59–7:05 (7 min)7:06–7:11 (6 min)20 + 7 = 27
167:18–7:24 (7 min)7:25–7:37 (13 min)6 + 7 = 13
177:45–7:58 (14 min)7:59–8:03 (5 min)13 + 14 = 27
188:09–8:14 (6 min)8:15–8:20 (6 min)5 + 6 = 11
198:20–8:26 (7 min)8:27–8:30 (4 min)6 + 7 = 13
208:36–8:47 (12 min) 4 + 12 = 16
BPT is calculated by SS before this BP occurring time (Highlight in italics and bold) plus BS after this BP occurring time.
Publisher’s Note: MDPI stays neutral with regard to jurisdictional claims in published maps and institutional affiliations.

