
Ground-Based MAX-DOAS Measurements of Tropospheric Aerosols, NO2, and HCHO Distributions in the Urban Environment of Shanghai, China

 ,
,
Abstract
:1. Introduction
2. Analysis of Experimental Data
3. Retrieval Algorithm
3.1. Consistency Check
3.2. Aerosol Inversion
3.3. Trace Gas Inversion (NO2 and HCHO)
4. Data Analysis
4.1. Aerosol
4.2. AOD and Boundary Layer Height
4.3. Tropospheric NO2 and HCHO Vertical Column Densities
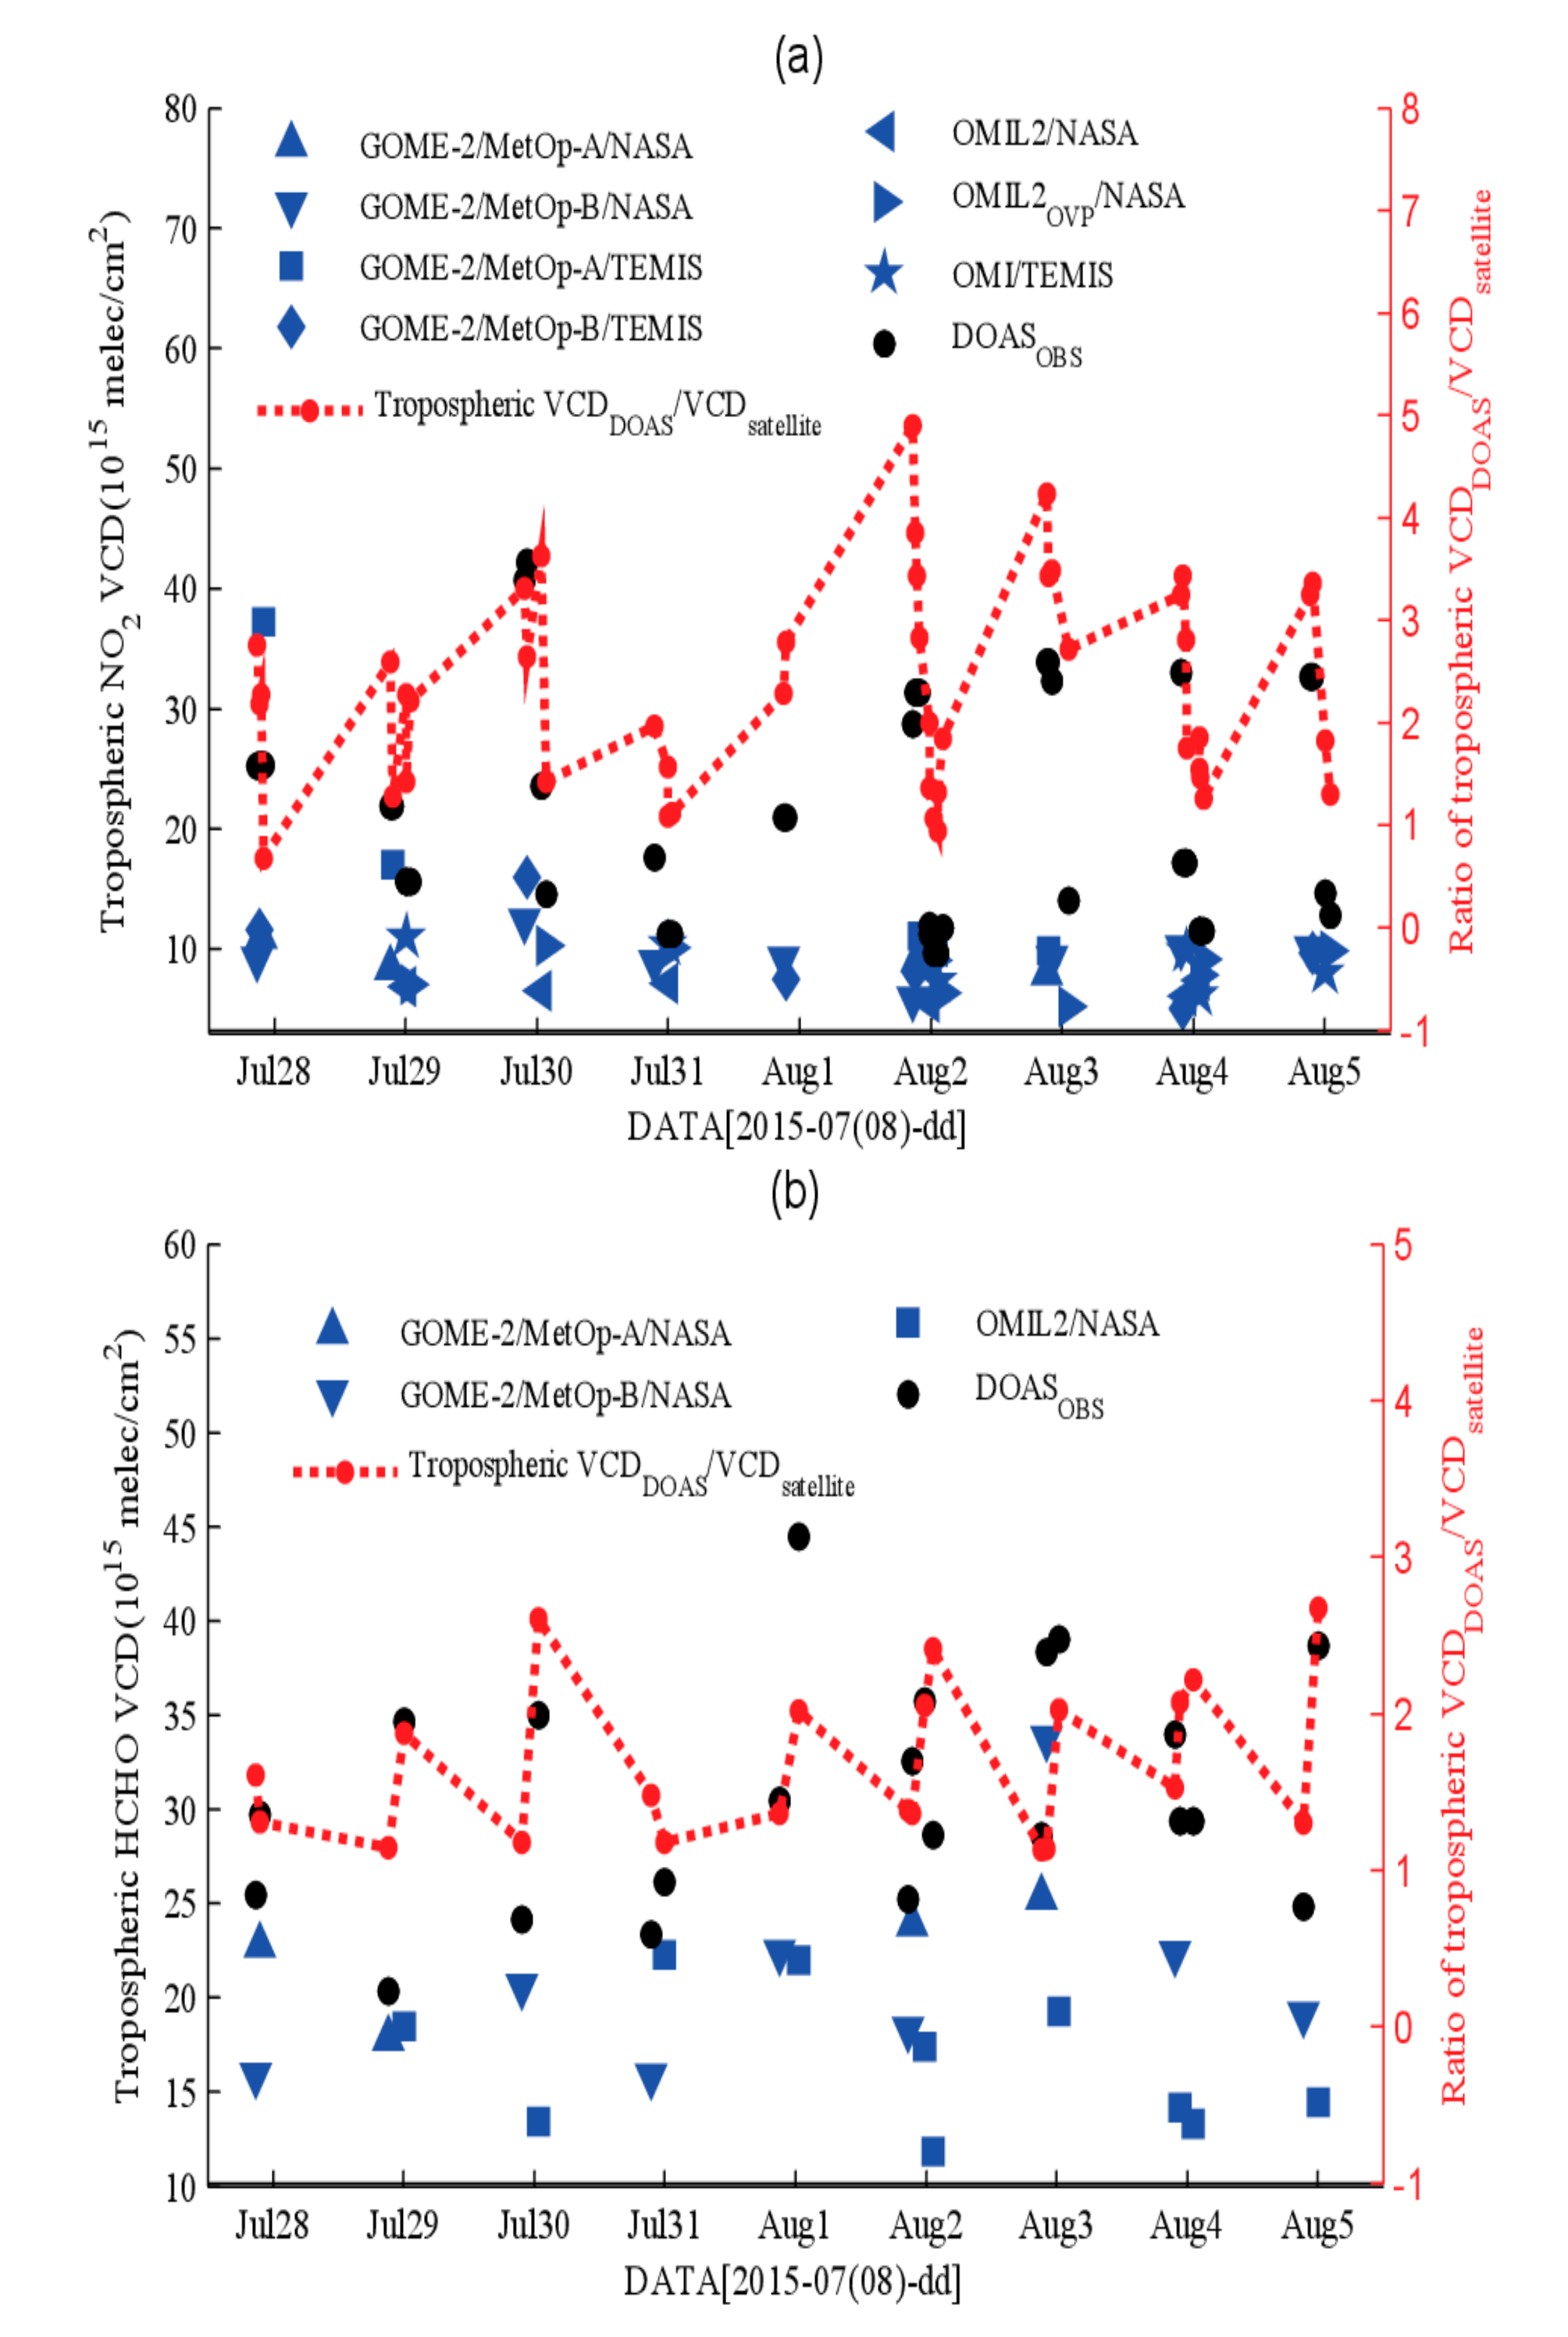
4.4. Comparision to Satellite Products
4.5. A Cause Analysis of Aerosol Reduced and Recovered Process
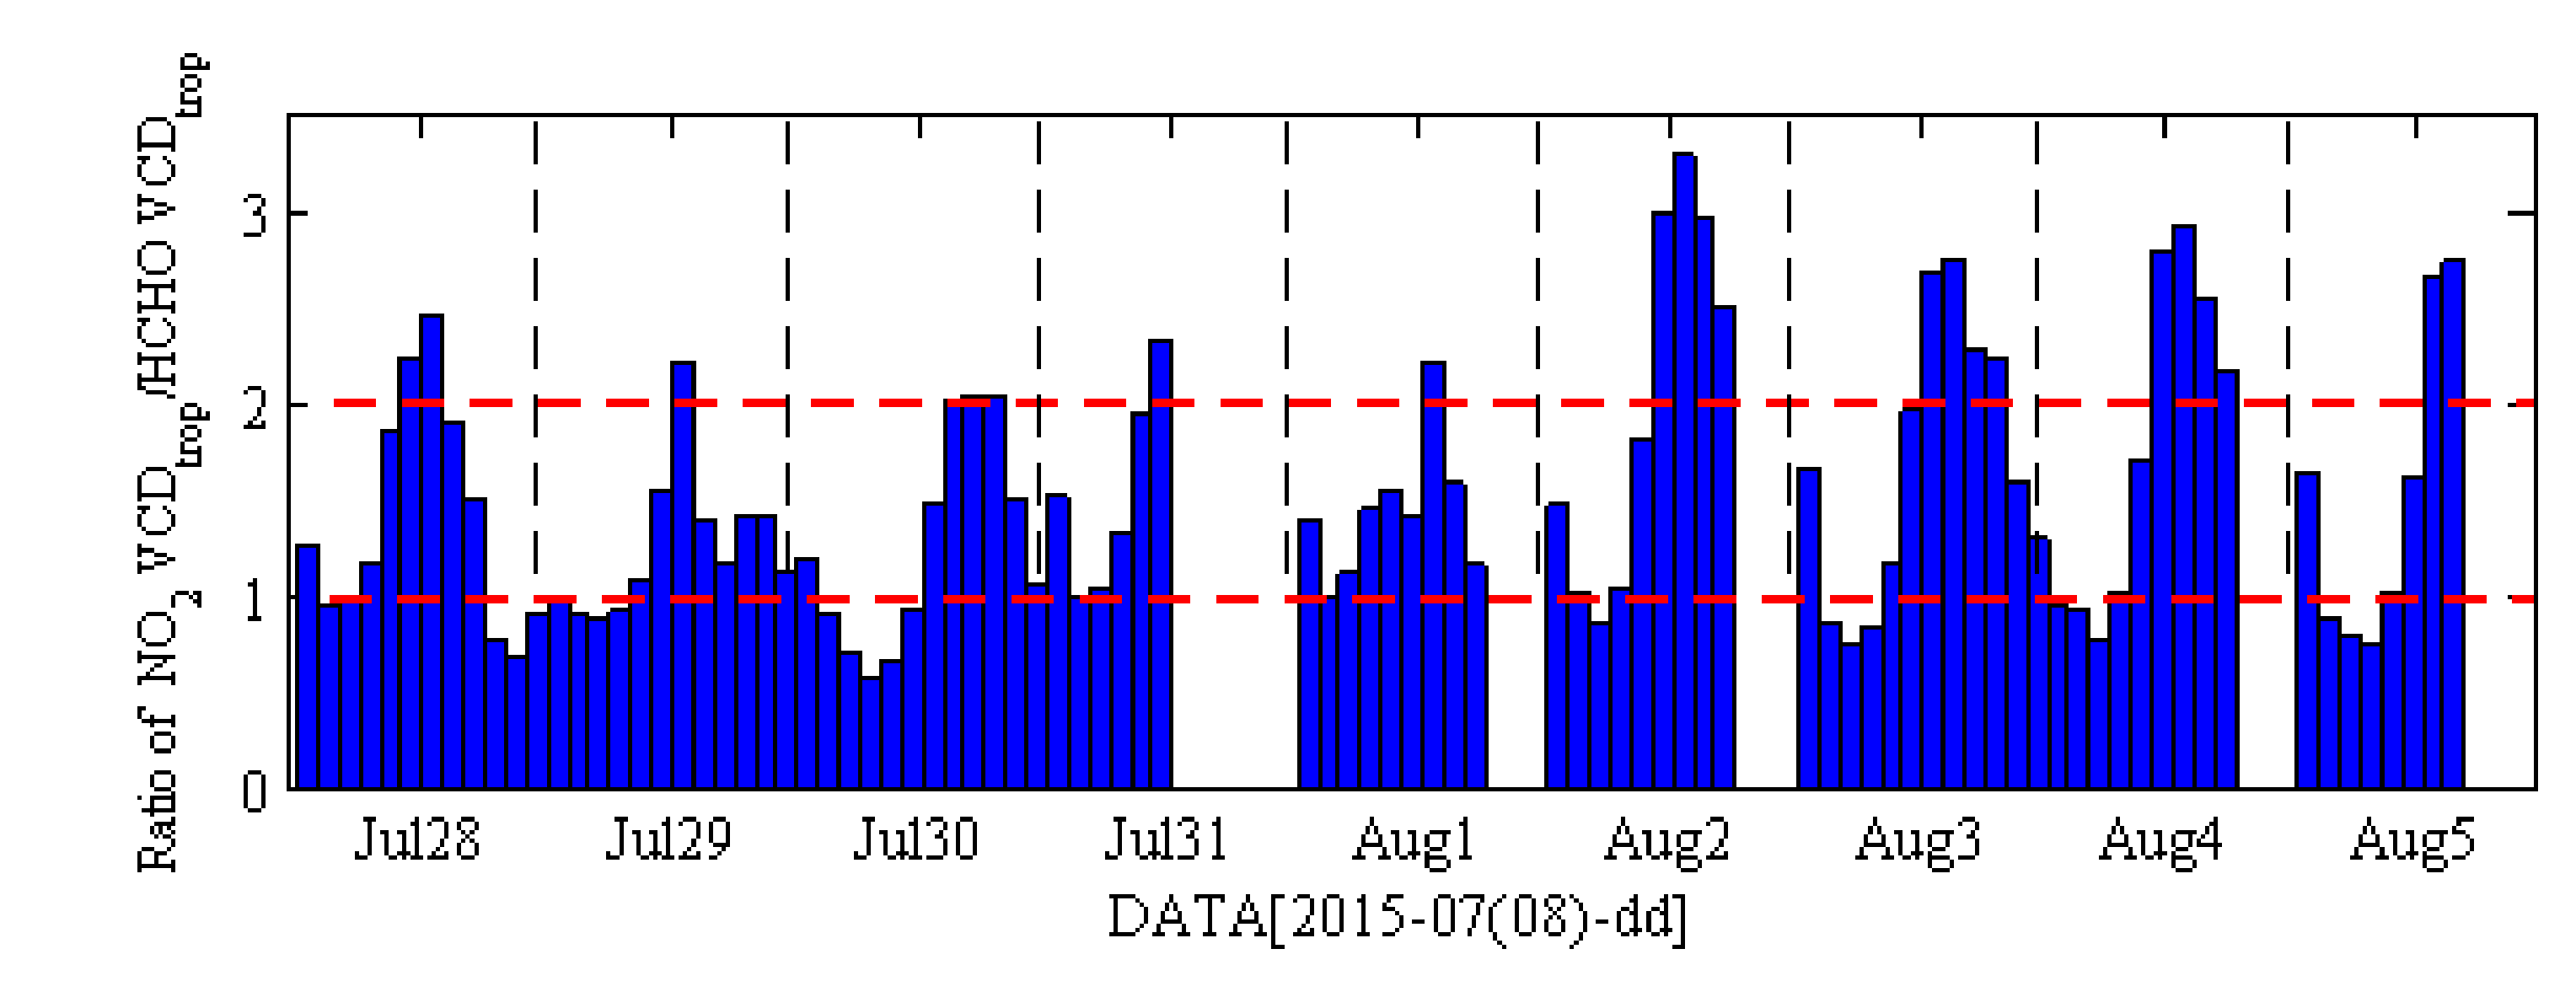
4.6. Study on Chemical Sensitivity of Local Ozone Production
5. Conclusions
Author Contributions
Funding
Institutional Review Board Statement
Informed Consent Statement
Data Availability Statement
Acknowledgments
Conflicts of Interest
References
- Platt, U.; Stutz, J. Differential Absorption Spectroscopy. Phys. Earth Space Environ. 2008, 29, 2458–2462. [Google Scholar]
- Irie, H.; Takashima, H.; Kanaya, Y.; Boersma, K.F.; Gast, L.; Wittrock, F.; Brunner, D.; Zhou, Y.; Roozendael, M.V. Eight-Component Retrievals from Ground-Based MAX-DOAS Observations. Atmos. Meas. Tech. 2011, 4, 1027–1044. [Google Scholar] [CrossRef] [Green Version]
- Cracknell, A.P.; Varotsos, C.A. New Aspects of Global Climate-Dynamics Research and Remote Sensing. Int. J. Remote Sens. 2011, 32, 579–600. [Google Scholar] [CrossRef]
- Varotsos, C.; Ondov, J.; Tzanis, C.; Öztürk, F.; Nelson, M.; Christodoulakis, J. An Observational Study of the Atmospheric Ultra-Fine Particle Dynamics. Atmos. Environ. 2012, 94, 312–319. [Google Scholar] [CrossRef]
- Varotsos, C.; Tzanis, C.; Cracknell, A. The Enhanced Deterioration of the Cultural Heritage Monuments Due to Air Pollution. Environ. Sci. Pollut. Res. Int. 2009, 16, 590–592. [Google Scholar] [CrossRef] [PubMed]
- Wang, Y.; Li, A.; Xie, P.H.; Chen, H.; Mou, F.S.; Xu, J.; Wu, F.C.; Zeng, Y.; Liu, J.G.; Liu, W.Q. Measuring Tropospheric Vertical Distribution and Vertical Column Density of NO2 by Multi-Axis Differential Optical Absorption Spectroscopy. Acta Phys. Sin. 2013, 62, 000138–151. [Google Scholar] [CrossRef]
- Wang, Y.; Li, A.; Xie, P.H.; Chen, H.; Xu, J.; Wu, F.C.; Liu, J.G.; Liu, W.Q. Retrieving Vertical Profile of Aerosol Extinction by Multi-Axis Differential Optical Absorption Spectroscopy. Acta Phys. Sin. 2013, 62, 180705. [Google Scholar] [CrossRef]
- Wagner, T.; Beirle, S.; Brauers, T.; Deutschmann, T. Inversion of Tropospheric Profiles of Aerosol Extinction and HCHO and NO2 Mixing Ratios from MAX-DOAS Observations in Milano during the Summer of 2003 and Comparison with Independent Data Sets. Atmos. Meas. Tech. 2011, 4, 2685–2715. [Google Scholar] [CrossRef] [Green Version]
- Li, X.; Brauers, T.; Shao, M.; Garland, R.M.; Wagner, T.; Deutschmann, T.; Wahner, A. MAX-DOAS Measurements in Southern China: Retrieval of Aerosol Extinctions and Validation Using Ground-Based In Situ Data. Atmos. Chem. Phys. 2010, 10, 2079–2089. [Google Scholar] [CrossRef] [Green Version]
- Li, X.; Brauers, T.; Hofzumahaus, A.; Lu, K.; Li, Y.P.; Shao, M.; Wagner, T.; Wahner, A. MAX-DOAS Measurements of NO2, HCHO and CHOCHO at A Rural Site in Southern China. Atmos. Chem. Phys. 2013, 13, 2133–2151. [Google Scholar] [CrossRef] [Green Version]
- Wagner, T.; Dix, B.; von Friedeburg, C.; Frieß, U.; Sanghavi, S.; Sinreich, R.; Platt, U. MAX-DOAS O4 Measurements: A New Technique to Derive Information on Atmospheric Aerosols—Principles and Information Content. J. Geophys. Res. Earth Surf. 2004, 109, D22205. [Google Scholar] [CrossRef] [Green Version]
- Vlemmix, T.; Hendrick, F.; Pinardi, G.; De Smedt, I.; Fayt, C.; Hermans, C.; Piters, A.; Wang, P.; Levelt, P.; Van Roozendael, M. MAX-DOAS Observations of Aerosols, Formaldehyde and Nitrogen Dioxide in the Beijing Area: Comparison of Two Profile Retrieval Approaches. Atmos. Meas. Tech. 2015, 8, 941–963. [Google Scholar] [CrossRef] [Green Version]
- Irie, H.; Boersma, F.; Kanaya, Y.; Takashima, H.; Xiaole, P.; Wang, Z. Quantitative bias estimates for tropospheric NO2 columns retrieved from SCIAMACHY, OMI, and GOME-2 using a common standard for East Asia. In Proceedings of the AGU Fall Meeting, San Francisco, CA, USA, 3–7 December 2012; pp. 2403–2411. [Google Scholar]
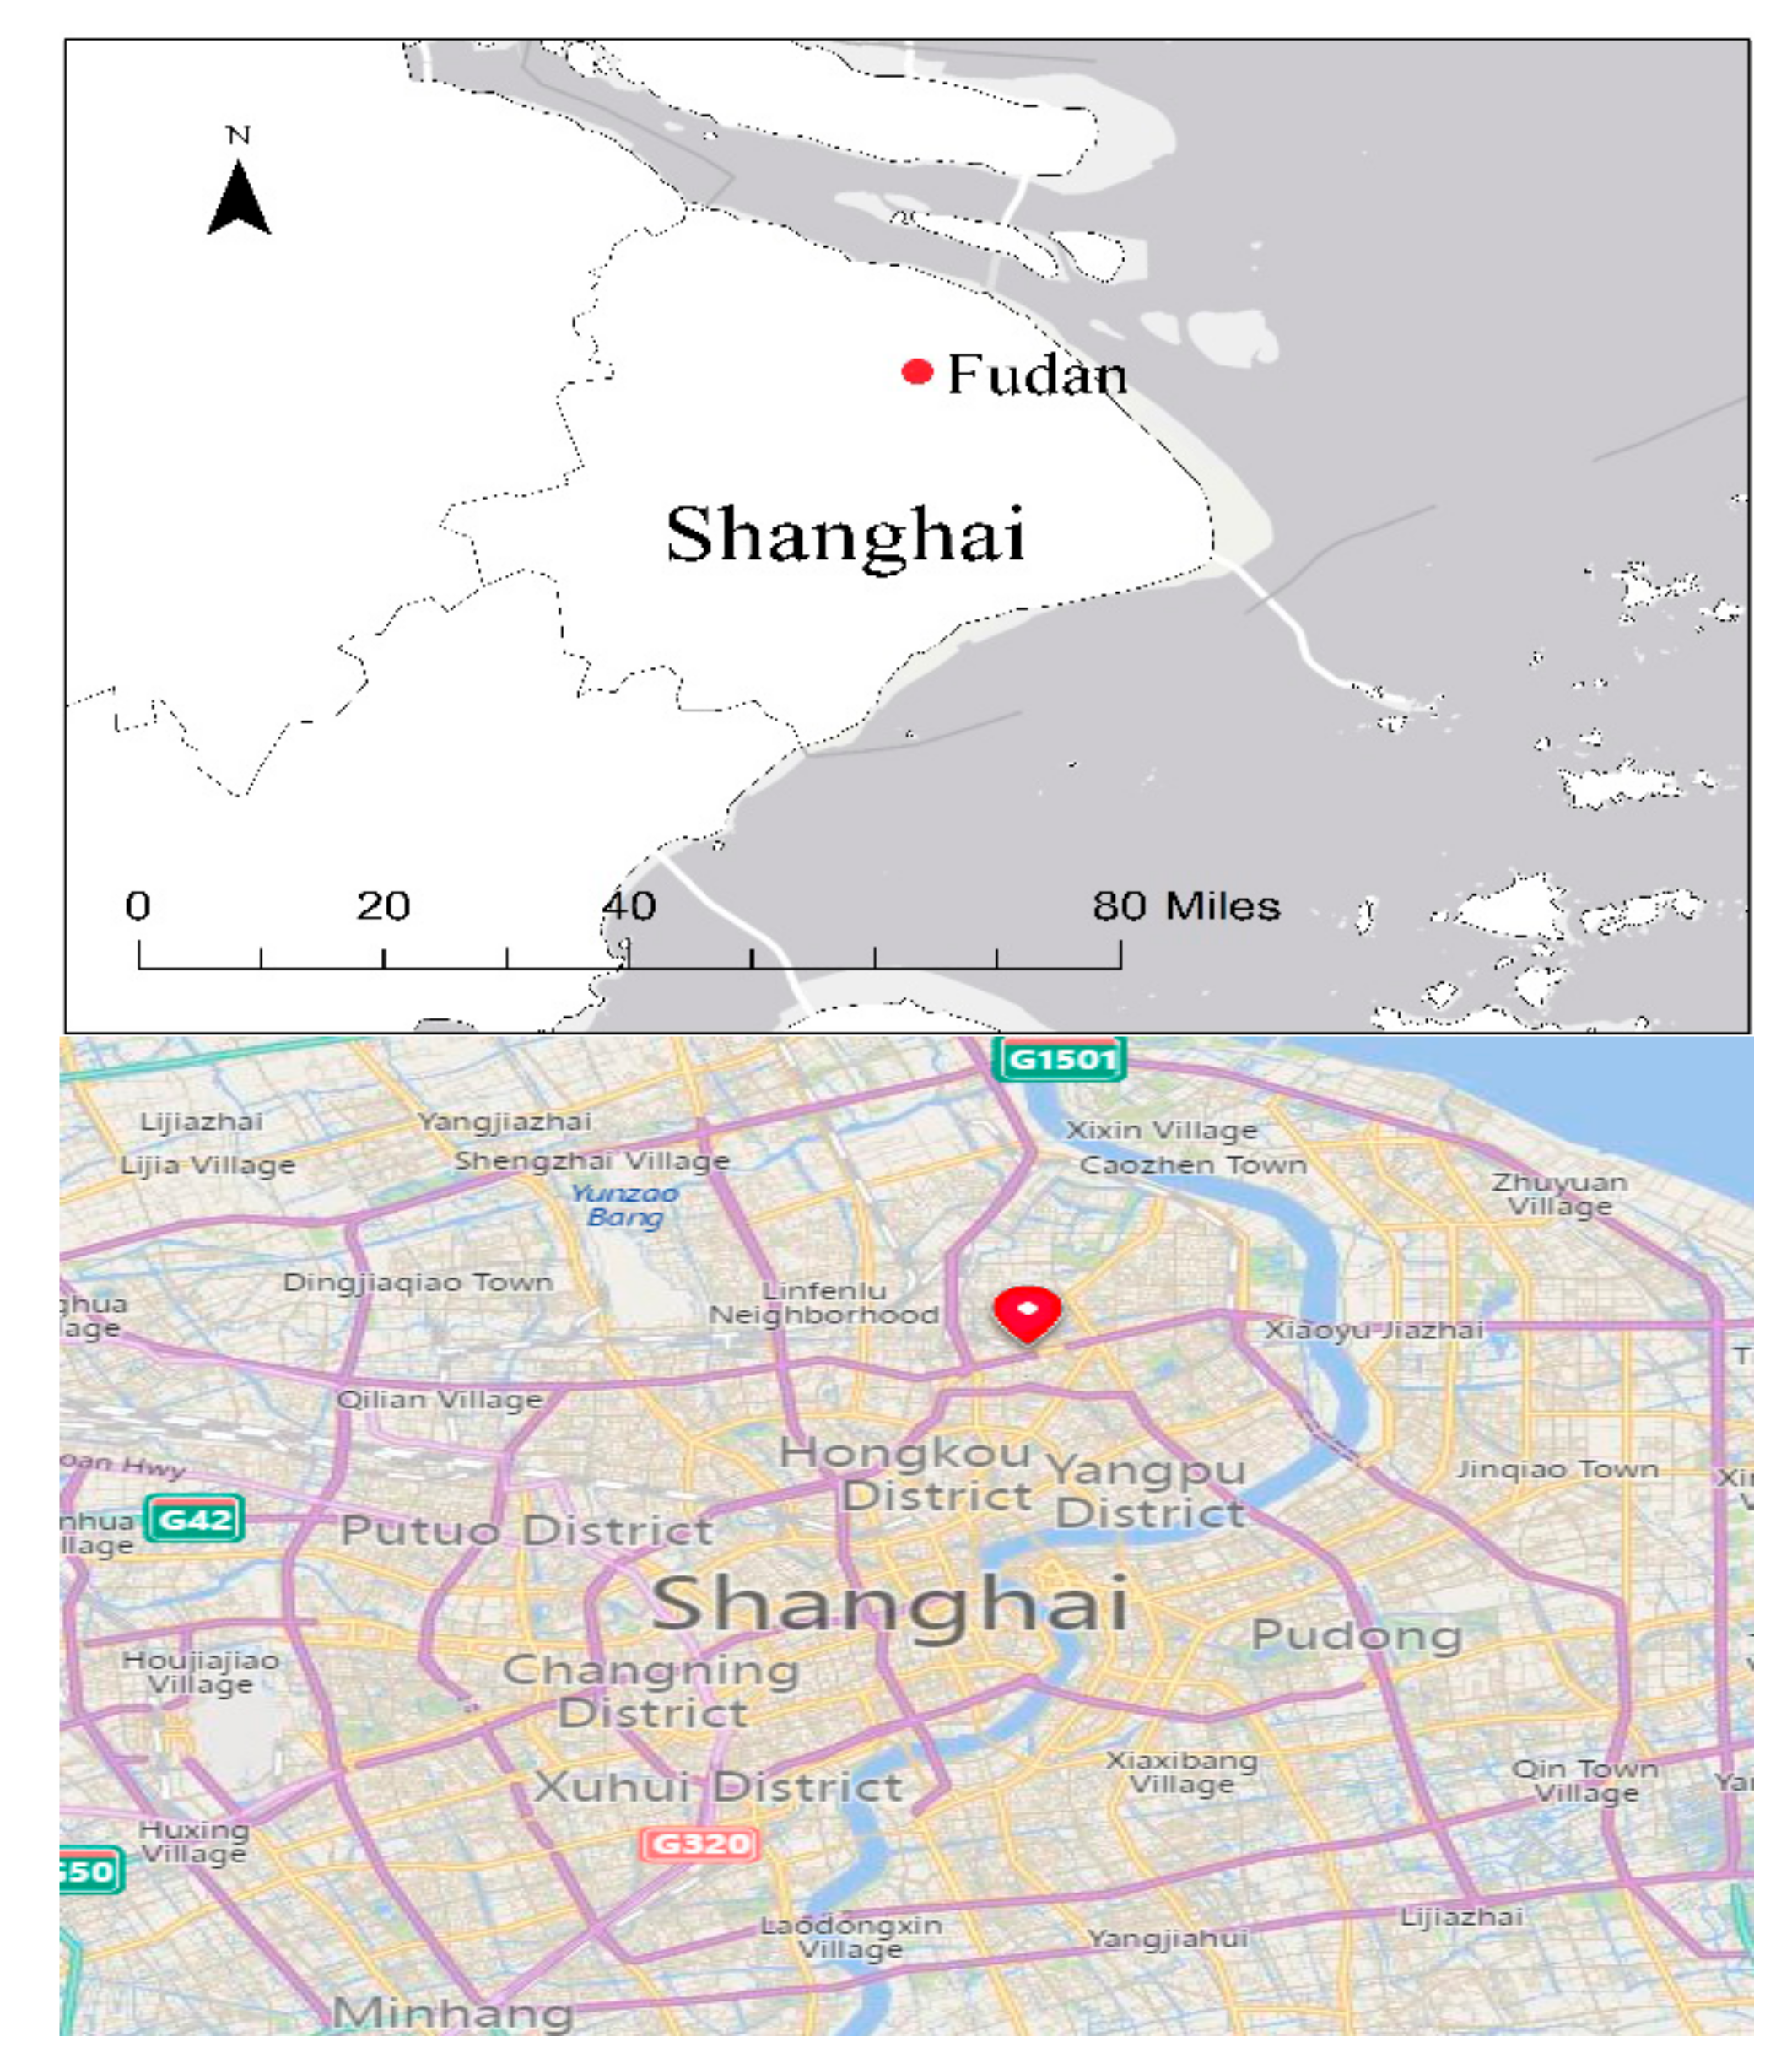
- Wang, S.S. Study on the Retrieval of NO2 and Aerosol Pollution in Shanghai Urban Area Based on the Passive DOAS Technique. P.D. Thesis, Fudan University, Shanghai, China, 2012. [Google Scholar]
- Meena, G.S.; Bhosale, C.S.; Jadhav, D.B. Influence of Tropospheric Clouds on Ground-Based Measurements of Stratospheric Trace Gases at Tropical Station, Pune. Atmos. Environ. 2004, 38, 3459–3468. [Google Scholar] [CrossRef]
- Qiu, J.; Zong, X.; Zhang, X. A Study of the Scaling Height of the Tropospheric Aerosol and Its Extinction Coefficient Profile. J. Aerosol Sci. 2005, 36, 361–371. [Google Scholar] [CrossRef]
- Xu, X.F.; Qiu, J.H.; Niu, S.J.; Tang, L.L. Optical Depth of Atmospheric Aerosol at 12 Stations in China over the Past 45 Years. Acta Sci. Circumstantiae 2009, 29, 488–495. [Google Scholar]
- Clémer, K.; Roozendael, M.V.; Fayt, C.; Hendrick, F. Multiple Wavelength Retrieval of Tropospheric Aerosol Optical Properties from MAXDOAS Measurements in Beijing. Atmos. Meas. Tech. Discuss. 2010, 3, 863–878. [Google Scholar] [CrossRef] [Green Version]
- Duncan, B.N.; Yoshida, Y.; Olson, J.R.; Sillman, S.; Martin, R.V.; Lamsal, L.; Hu, Y.; Pickering, K.E.; Retscher, C.; Allen, D.J. Application of OMI Observations to A Space-Based Indicator of Nox and VOC Controls on Surface Ozone Formation. Atmos. Environ. 2010, 44, 2213–2223. [Google Scholar] [CrossRef] [Green Version]


| Species | Cross Section | Temperature | Data Source a |
|---|---|---|---|
| O4 | O4 | 293 °K | Thalman Volkamer (2013) |
| HCHO | 297 °K | Meller, MPI Mainz (1992) | |
| BrO | 223 °K | Fleischmann (2000) | |
| NO2 | 293 °K | Bogumil (2003) | |
| O3 | 223 °K | Serdyuchenko (2014) | |
| Ring | - | QDOAS | |
| NO2 | NO2 | 293 °K | Bogumil (2003) |
| O4 | 293 °K | Thalman Volkamer (2013) | |
| O3 | 223 °K | Serdyuchenko (2014) | |
| Ring | - | QDOAS | |
| HCHO | HCHO | 297 °K | Meller, MPI Mainz (1992) |
| O4 | 293 °K | Thalman Volkamer (2013) | |
| O3 | 223 °K | Serdyuchenko (2014) | |
| O3 | 293 °K | Serdyuchenko (2014) | |
| NO2 | 293 °K | Bogumil (2003) | |
| BrO | 223 °K | Fleischmann (2000) | |
| Ring | - | QDOAS |
| Parameter | Value |
|---|---|
| τ | 0.1~1.3, interval: 0.1; 1.5~3.0, interval: 0.25; 3.0~4.0, interval: 0.5 |
| F | 0.1~1.0, interval: 0.1 |
| H (km) | 0.2~1.5, interval: 0.05 |
| Ξ (km) | 5 |
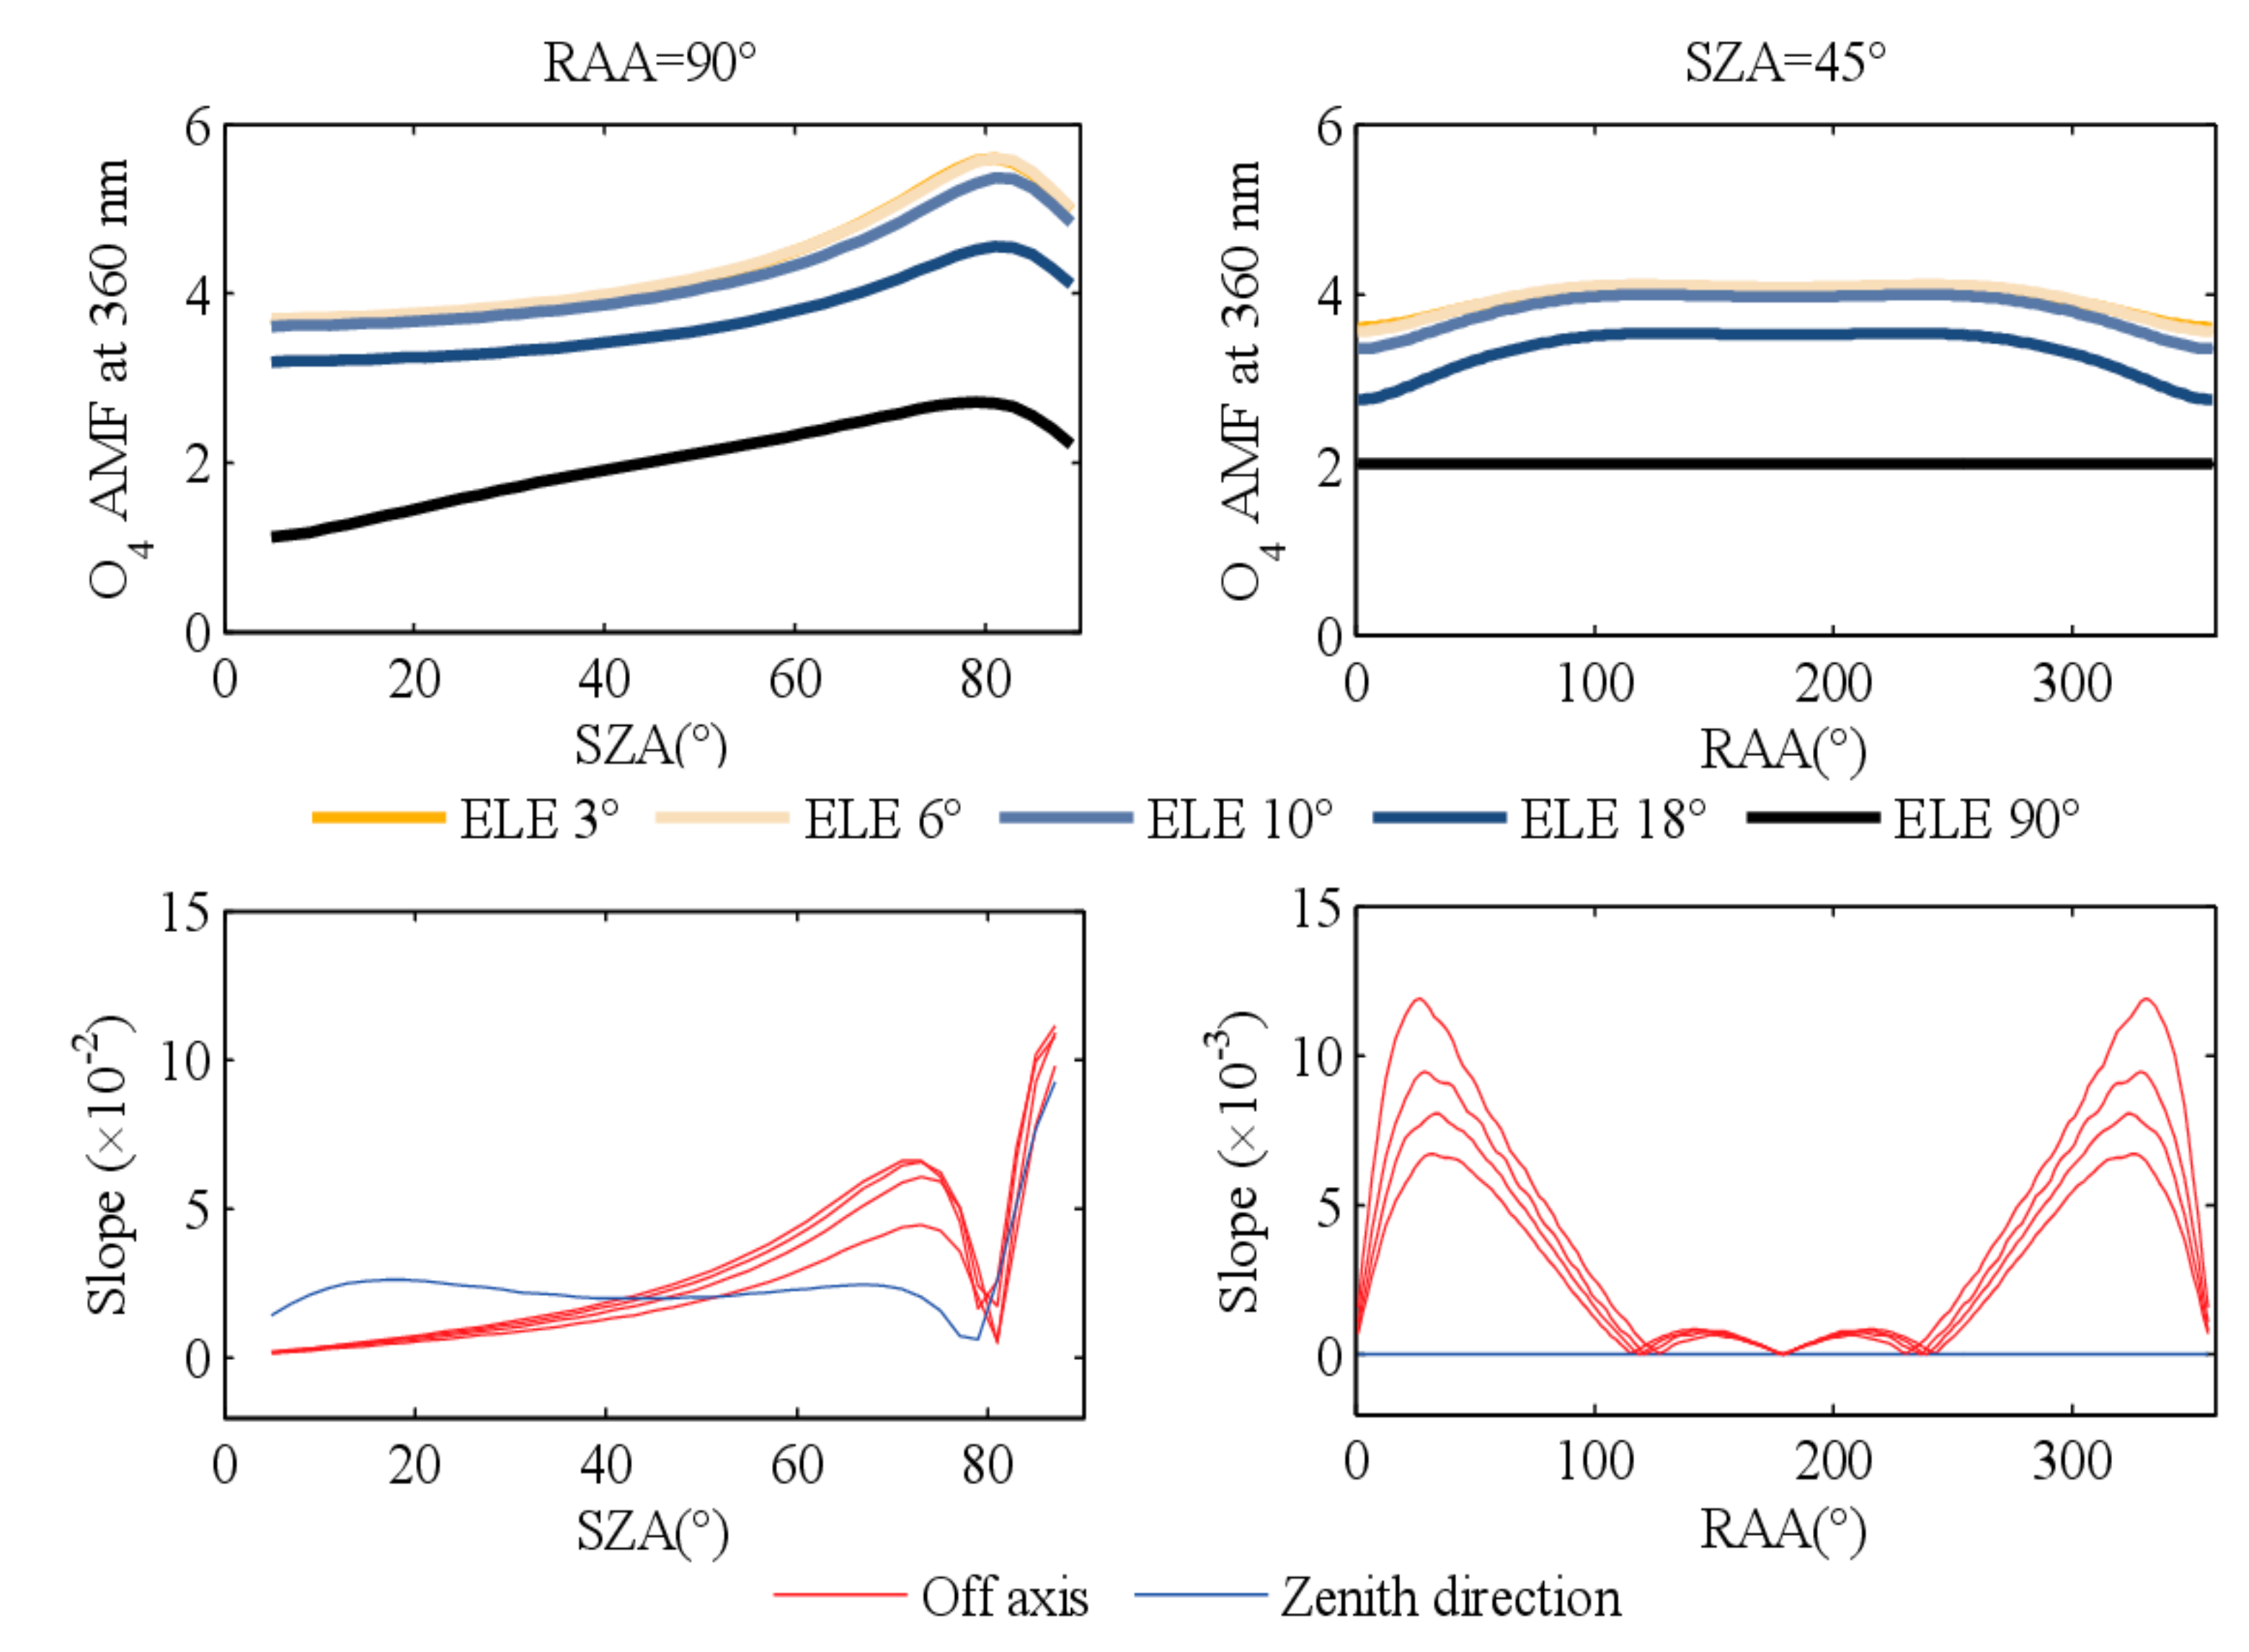
| ELE (°) | 3, 6, 10, 18, 90 |
| SZA (°) and RAA (°) | averaging the measured values and interpolating |
Publisher’s Note: MDPI stays neutral with regard to jurisdictional claims in published maps and institutional affiliations. |
© 2022 by the authors. Licensee MDPI, Basel, Switzerland. This article is an open access article distributed under the terms and conditions of the Creative Commons Attribution (CC BY) license (https://creativecommons.org/licenses/by/4.0/).
Share and Cite
Wang, H.; Wei, W.; Che, H.; Tang, X.; Bian, J.; Yu, K.; Wang, W. Ground-Based MAX-DOAS Measurements of Tropospheric Aerosols, NO2, and HCHO Distributions in the Urban Environment of Shanghai, China. Remote Sens. 2022, 14, 1726. https://0-doi-org.brum.beds.ac.uk/10.3390/rs14071726
Wang H, Wei W, Che H, Tang X, Bian J, Yu K, Wang W. Ground-Based MAX-DOAS Measurements of Tropospheric Aerosols, NO2, and HCHO Distributions in the Urban Environment of Shanghai, China. Remote Sensing. 2022; 14(7):1726. https://0-doi-org.brum.beds.ac.uk/10.3390/rs14071726
Chicago/Turabian StyleWang, Haoyue, Wanlin Wei, Huizheng Che, Xiao Tang, Jianchun Bian, Ke Yu, and Weiguo Wang. 2022. "Ground-Based MAX-DOAS Measurements of Tropospheric Aerosols, NO2, and HCHO Distributions in the Urban Environment of Shanghai, China" Remote Sensing 14, no. 7: 1726. https://0-doi-org.brum.beds.ac.uk/10.3390/rs14071726