Article

Assessing Drought Response in the Southwestern Amazon Forest by Remote Sensing and In Situ Measurements

by
Ranieli Dos Anjos De Souza
1,2,*,
Valdir Moura
1,
Rennan Andres Paloschi
2,
Renata Gonçalves Aguiar
3,
Alberto Dresch Webler
3 and
Laura De Simone Borma
4
1
Space Research Group (GREES), Federal Institute of Education, Science and Technology of Rondonia State (IFRO), Colorado do Oeste 76993-000, Brazil
2
Doctoral Program in Remote Sensing (PGSER), National Institute for Space Research, São José dos Campos 12227-010, Brazil
3
Department of Environmental Engineering, Federal University of Rondonia (UNIR), Ji-Paraná 76900-726, Brazil
4
Earth System Science Center (CCST), National Institute for Space Research (INPE), São José dos Campos 12227-010, Brazil
*
Author to whom correspondence should be addressed.
Submission received: 3 March 2022 / Revised: 27 March 2022 / Accepted: 31 March 2022 / Published: 4 April 2022

Abstract

:
Long-term meteorological analyzes suggest an increase in air temperature and a decrease in rainfall over the Amazon biome. The effect of these climate changes on the forest remains unresolved, because field observations on functional traits are sparse in time and space, and the results from remote sensing analyses are divergent. Then, we analyzed the drought response in a ‘terra firme’ forest fragment in the southwestern Amazonia, during an extreme drought event influenced by ENSO episode (2015/2017), focusing on stem growth, litter production, functional traits and forest canopy dynamics. We use the Moderate Resolution Imaging Spectroradiometer (MODIS), corrected by Multi-Angle Implementation of Atmospheric Correction (MAIAC) to generate the enhanced vegetation index (EVI) and green chromatic coordinate (Gcc) vegetation indices. We monitor stem growth and measure the functional traits of trees in situ, such as the potential at which the plant loses 50% of hydraulic conductivity (P50), turgor loss point (πTLP), hydraulic safety margin (HSM) and isohydricity. Our results suggest that: (a) during the dry season, there is a smooth reduction in EVI values (browning) and an increase in the wet season (greening); (b) in the dry season, leaf flush occurs, when the water table still has a quota at the limit of the root zone; (c) the forest showed moderate resistance to drought, with water as the primary limiting factor, and the thickest trees were the most resistant; and (d) a decline in stem growth post-El-Niño 2015/2016 was observed, suggesting that the persistence of negative rainfall anomalies may be as critical to the forest as the drought episode itself.

1. Introduction

Tropical forests play an important role in the carbon cycle [1], and more than half of them are distributed in the Amazon [2]. However, this ecosystem is threatened by global climate change [3], with projections of an increase in temperature and a decrease in precipitation [4,5,6]. These changes are driven by advances in deforestation, fires and constant change in land use [7].
Long-term meteorological analyses suggest that 2015 was the warmest year for this biome in the last century [8]. On the other hand, climate models indicate a reduction of 0.32% per year in rainfall over the Amazon [5], coinciding with records of the most intense drought events in recent decades [9,10]. As examples, we cite the droughts of 1997/98, 2005, 2010 and 2015/2016 [10,11,12].
Given the prospects of a drier and warmer climate in the Amazon [4,5,13,14], it is necessary to understand the response of the forest to these changes, given that conclusions of the research are divergent. For example, the forest can be replaced by vegetation that is more resistant to drought, such as the savannah, as a result of changes in the rainfall regime, increase in temperature and deforestation [13,15]; or some regions of the Amazon experience an increase or decline in evapotranspiration in the dry season (drought that has well-defined months), and the forest increase, decline or maintain the gross ecosystem productivity (GPP) [16,17,18,19].
Extreme drought events, such as those that occurred in 2005, 2010 and recently in 2015/2016, have acted as natural laboratories to understand forest dynamics during these climatic episodes. However, a number of questions still remain, because the conclusions resulting from in situ and remote sensing analysis are divergent. While remote sensing analyses have identified a potential resilience of the Amazon rainforest to drought with apparent greening during the dry season [20,21], others have shown that this is due to satellite artifacts and solar sensor geometry [22,23,24]. On the other hand, in situ studies have shown decreased gross primary productivity [25], increased mortality [26,27,28], decline in photosynthesis [29] and stem diameter growth, and leaf litterfall and leaf flushing increase [30,31].
These variations reinforce the complexity of the Amazon biome, and increase scientific efforts to investigate ecological issues, such as the response of organisms and the functional composition of trees, as a function of environmental and climatic changes [32,33]. These functional traits are morphological, physiological and phenological attributes that allow one to analyze the potential of communities to adapt to climate change [34,35].
The ecophysiological responses of the trees to drought using functional traits such as isohydricity, turgor loss point potential (πTLP), potential in which the plant loses 50% of hydraulic conductivity (P50) and hydraulic safety margin (HSM), have been analyzed as measurements of drought tolerance [36,37]. These functional traits highlight that the primary cause for tree mortality during drought is hydraulic failure, caused by carbon starvation or embolism [38,39].
Methods or techniques that help to obtain functional data on a large scale can contribute to the understanding of the ecosystem. Therefore, mappings based on multispectral and hyperspectral images have sought to fill this information gap [40,41,42,43,44]. Satellite observations to study the phenology of tropical forests using vegetation indices as a proxy for photosynthetic activity and leaf renewal (leaf flush or leaf flushing), combined with in situ data, can help to minimize the uncertainties raised and improve the biophysical understanding of forest dynamics in wet and dry periods.
Most of the in situ studies used for orbital validations were carried out in the eastern portion of the Brazilian Amazon, with an information gap in the southwest part of the basin. In addition, most of the in situ studies have not considered the ability of the forest to deal with droughts, measured by the plant hydraulic traits. Considering that the impact caused by climate changes does not depend exclusively on extreme events, but also on the ability of plants to resist the changes they are exposed and, due to limited knowledge of the vulnerability of tropical forests to droughts (extreme or seasonal) [45,46], we evaluated ecophysiological attributes of drought tolerance.
To better understand the climate–vegetation dynamics, this research was based on the following questions: How is the seasonal dynamics of the forest in the southwest portion of the Amazon? What are the forest mechanisms to resist seasonal drought? Does remote sensing have the potential to represent phenological and physiological changes in the forest?
From these questions, this research aimed to evaluate the seasonal response to drought of a “terra firme” forest fragment located in the Jaru Biological Reserve—Rebio Jaru (RJA site), southwest of the Amazon. Here, we combine satellite with in situ data to analyze: (i) the phenological pattern of the canopy, using the enhanced vegetation index (EVI) and the green chromatic coordinate (Gcc) as a proxy of photosynthetic activity and production of new leaves, respectively, derived from the Moderate-Resolution Imaging Spectroradiometer (MODIS) from Terra/Aqua satellites, corrected by Multi-Angle Implementation of Atmospheric Correction algorithm (MAIAC); (ii) physiological behavior, using measures of stem growth and total litter production, (iii) ecophysiological behavior, using functional attributes indicative of drought tolerance (P50, πTLP, HSM and isohydricity); and (iv) soil moisture, water table depth and climatic data.

2. Materials and Methods

2.1. Study Area

The study area is located in the Jaru Biological Reserve (Rebio Jaru), state of Rondônia, southwest Amazonia. The experimental site (RJA site) is part of the LBA Program (Large Biosphere-Atmosphere Experiment in Amazonia) equipped with an eddy covariance (EC) flux tower located at the coordinates 10°11′21.2712″S e 61°52′15.1674″W, 62 m high and 152.2 m elevation (Figure 1), part of the. Rebio Jaru contains a predominantly evergreen, seasonally dry tropical forest with some semi-deciduous species and palm trees with an average canopy height of 20 ± 6.7 m [47].
The total annual precipitation of the RJA site is 1926 ± 141 mm, with 5 months of dry season (between May and September), which characterizes as one of the most seasonal sites among the LBA-monitored micrometeorological tower sites [19,25]. The dry season is the months when evapotranspiration exceeds precipitation, around 100 mm.month−1 [48].

2.2. RJA Climatology

To generate historical averages of climate and forest canopy data, were used in situ data obtained from the LBA EC flow tower 2004 onwards until 2017, for air temperature, soil moisture and net radiation. We used reanalysis data from the National Oceanic and Atmospheric Administration (NOAA) for precipitation, that was used to generate SPI-6 index (Table 1).
The in situ data used in the seasonal analysis (dry and wet seasons), such as litter, stem growth, soil moisture and water table depth, were collected in a period which comprises one of the most severe episodes of the El-Niño drought (ENSO 2015/16) recorded in the Amazon since 1901 [12,49].
Table 1. Summary of the data used in this study.
DataEquipament/MetodologyPeriodSource
MODIS/MAIACMODIS2000–2017[50]
Evapotranspiration (mm)MOD16A22001–2017[51]
Drought severityStandard precipitation index (SPI-6)1983–2017[52,53]
Precipitation (mm)Reanalysis1983–2017[54]
Air temperature (°C)Sensor: 107 Campbell Scientific Inc.2004–2017LBA
Net radiation (W·m2)CM-21, Kipp&Zonen2005–2017LBA
Soil moisture (%)CS615 sensor, Campbell Scientific Inc., installed in 10 cm; 20 cm; 30 cm; 40 cm; 60 cm and 100 cm deep.2015–2017LBA
Water table depth (m)PiezometerMay 2016–Dec 2017**
Total Litter (Mg·ha−1)Colectors (0.50 × 0.50 m)May 2016–Jan 2018**
Stem growth (cm)Dendrometers ZN12-T-2IP; ZWEIFEL et al. (2005) metodology.Sep. 2015–Ago 2017**
P50 (MPa)Pereira et al. (2016) metodology; Choat et al. (2012) limiar.Oct. 2016**
πTLP (Turgor Loss Point) (MPa)Tyree e Hammel (1972) and Sack e Pasquet-Kok (2011) metodology; Bartlett et al. (2012) limiarJul. 2017**
IsohydricityPMS Instruments Co., Albany, NY, USA; Bartlett et al. (2012) and Choat et al. (2012) pattern.Oct. 2016–Jul. 2017**
Hydraulic safety margin (HSM)Choat et al. (2012) patternOct. 2016–Jul. 2017**
Where: ** Data collected in this study.

2.3. Study Plot and Plant Species

In the RJA site, we built a plot of 5 ha (250 × 200 m) long (10°11′11.39″S, 61°52′20.89″W, with 153 ± 7 m altitude above sea level) (Figure 1). In the plot, we selected 31 tree individuals with diameter at breast height (DBH > 10 cm), covering 23 representative species of the area. The individual selection was based on the relative density (Rd) and value of importance index (IVI) phytosociological parameters (Table 2). For the selected trees, we measured the DBH, height followed by the botanical identification. The basal area of the selected trees covers 24.97 ± 0.1 m2.ha−1 and DBH of 21 ± 14 cm.ha−1, with a DBH range of 10 to 117.5 cm. The trees average 19.29 ± 9.4 m in height and some species reach up to 55 m.
The RJA site has a variable topography, from flat relief (0–3% slope) to strong wavy (20–45% slope). The soil has a clayey texture above 60%, with medium fertility of organic matter (2.01 ≤ MO ≤ 4.0) up to a layer of 0.20 m and very high acidity. The concentrations of the macronutrients P, K, Ca, Mg and Al are higher at 0.20 m, and from 0.40 m onwards, the concentration of these nutrients drops abruptly to low and even zero levels, especially in the case of phosphorus and potassium, which reach zero levels in the deeper layers of the soil.

2.4. Field Measurements

To analyze stem growth and relate it to weather conditions, we installed high resolution point dendrometers (ZN12-T-2IP, Natkon.ch, Oetwil am See, Switzerland) at 1.5 m above ground level in 22 out of the 31 trees mentioned above. Stem diameter change measurement was automatically recorded at a temporal resoluiton of 10 min from September 2015 to August 2017, based on registers of the compression or relaxation of the potentiometer spring of the point dendrometers.
We consider that variations registered by the springs are preferentially related to an increase in the bark thickness than on fluctuations in the water content of cambial tissues [57,58]. On the other hand, the decrease in bark represents a depletion in the tree’s water content [59]. Thus, direct measurements of the tree diameter (Dc), transformed into ΔDc, allow the extraction of the stem growth (Gr) excluding the influence of water fluctuations. To obtain the Gr data, we generated the “growth line”, by linking the maximum values of the data series using the methodology of [59]. All analyzes were performed with RStudio (R Development Core Team, 2015).
For total litter data, we installed 4 collectors (0.50 × 0.50 m) at 1 m above ground level between May 2016 and January 2018. The collect was carried out monthly, and then the material was submitted to oven drying, and the total litter fraction was weighed.
Water table was monitored between May 2016 and December 2017, using a piezometer installed at the RJA site with a depth of 9 m (10°11′11.39″S, 61°52′20.89″W), the location was chosen closest to the flux tower.
Ecophysiological analyses were conducted at different periods (Table 1) and all functional attributes of drought tolerance (P50, πTLP, HSM and Isohydricity) were generated from water potential data, measured with a Scholander camera (PMS Instruments Co., Albany, NY, USA) using specific methodologies and protocols (Table 1). πTLP measurements were performed on 22 specimens, being chosen for their highest IVI and Rd, when possible. Additionally, the P50 measurements were performed on 10 specimens, due to the difficulty of applying the methodology in the study area.
The hydraulic safety margin (HSM), turgor loss point (πTLP), isohydricity and potential in which the plant loses 50% of hydraulic conductivity (P50) were used as indicators of drought tolerance, and we used the limiar described in [38] to πTLP and [39] to P50.

2.5. Remote Sensing Products

We obtained surface reflectance data from the MODIS sensor corrected by the Multi-Angle Implementation of Atmospheric Correction (MAIAC) algorithm [60], whose data were processed by [50], between January 2000 to December 2017. MAIAC provides a new method for deriving aerosol and land surface reflectance products. This algorithm simultaneously retrieves atmospheric aerosols and bidirectional reflectance from MODIS data, detects clouds and corrects for atmospheric effects on dark vegetation surfaces and bright desert targets, in a moving window of up to 16 days of MODIS.
With the MODIS/MAIAC reflectance bands, the vegetation indices, the enhanced vegetation index (EVI) [61] used as a proxy of the canopy photosynthetic activity and the green chromatic coordinate index (Gcc) [62,63] used as a proxy for leaf flush, were calculated by the Equations (1) and (2). Evapotranspiration data were obtained by the MOD16A2 product. For the analysis at the RJA site, we used the average weighted by the area of the pixels that intercepted the study plot (n = 2).
Gcc = G/(R + G + B)
EVI = 2.5 ∗ ((NIR − R)/(NIR + 6 ∗ R − 7.5 ∗ B + 1))
where R, G, B and NIR are the digital numbers (DN) in the red, green, blue and near infrared channels, respectively.
Regression model was calculated to examine the linear relationship between variables, using the coefficient of determination (R2), with 95% confidence intervals. A nonparametric Kruskal–Wallis (KW) test was applied at a significance level of 5%, to test the hypothesis of equality between the evaluated samples.

3. Results

3.1. Seasonal Variability of Field Observations and Remote Sensing Data

The seasonality in the data during the study period (2015–2017) can be seen in Figure 2. Some parameters evaluated present a phase with precipitation (i.e., soil moisture, stem growth and photosynthetic activity (EVI)), others present seasonal behavior in the phase with net radiation (i.e., litter and leaf flush (Gcc)). The most severe drought episode recorded in the study region using the SPI index was in 2003, as also observed by [64]. A light-level drought was recorded in RJA between November 2015 and May 2016, coincided with the occurrence of the 2015/2016 El-Niño event [8,65]. However, the months with low rainfall lasted until July 2017 (Figure 2A,D).
The total annual rainfall (±SD, standard deviation) for the period 1983–2017 had an average of 1926 ± 141 mm. The confidence interval for precipitation determined for the wet season is 237.43 mm ≤ µ ≤ 252.62 mm, and for the dry season it is 36.39 mm ≤ µ ≤ 47.16 mm, with 95% confidence.
The water table depth reaches the lowest quota in the transition between the dry and wet seasons (Sep.-Oct.), and fluctuated out of phase with the rains, with a delay (Lag) of 3 months (R2 = 0.83, p-value <0.001). This lag demonstrates that the wet season rainfall is crucial for groundwater recharge during the dry period (Figure 2B). The water table reaches its maximum limit at the end of the wet season, when rainfall and soil moisture decrease, taking about 4 months for the water table to recharge (Figure 2B).
The production of total litter (leaves and miscellaneous) occurs throughout the year, but tends to show greater productivity during the dry period (Figure 2E). The production in the 2016 dry season was 9.13 Mg ha−1, whose season comprises the period after the El-Niño drought, but with persistent negative rainfall anomaly. In the 2017 dry season, in which the rainfall pattern in the region was normal, litter production was 7.94 Mg ha−1, representing a 13% decrease from one year to the other. In the wet season of 2016/17, the total litter production was 5.91 Mg ha−1. The total litter production in 21 months of monitoring was 26.69 Mg ha−1, which gives the RJA site an average annual production of 15.25 Mg ha−1 yr−1, in the period evaluated. The mean monthly production is 1.27 ± 0.82 Mg ha−1 mth−1, and the confidence interval is 0.92 Mg ha−1 mth−1 ≤ µ ≤ 1.62 Mg ha−1 mth−1.
The total annual stem growth in RJA had an average of 0.18 ± 0.15 cm (Figure 2F). During the 2015/16 wet season (0.16 cm), there was a higher stem growth compared to the 2016/17 wet season (0.09 cm) (p-value = 0.047, KW). In the 2016 dry season, stem grew 0.08 cm. The mean monthly stem growth is 0.015 ± 0.01 cm, and the interval confidence is 0.011 cm µ 0.019 cm.
The diameter class DBH ≥ 40 cm (0.19 ± 0.18 cm) showed greater stem growth in the wet season of 2015/16 followed by the class 20–30 cm in diameter (0.16 ± 0.11 cm), in the same period of 2016/17 the class of 30–40 cm (0.13 ± 0.11 cm) showed the greatest seasonal increase. In the 2016 dry period, trees between 30–40 cm (0.10 ± 0.13 cm) represented the diameter class with the greatest stem growth. In terms of stem growth, an increase trend was observed in the wet season compared to the dry season, whose seasonality was statistically significant (p = 0.007, KW).
The EVI increases in mid-September and decreases in mid-February/March during the wet season (Figure 2G). Average EVI was 0.49 ± 0.03, with interval confidence of 0.48 µ 0.50. In Gcc, it is possible to identify 2 peaks in the values, one at the apex of the dry season and the other at the beginning of the wet season (Figure 2H, red line). Average Gcc was 0.49 ± 0.01, with interval confidence of 0.494 µ 0.496. Gcc behaves opposite to EVI, as it tends to increase in the dry season and decrease in the wet season.
The stem growth (Gr) and EVI presented a relationship (R2 = 0.32, p-value = 0.006), being observed that stem growth increases when the photosynthetic activity also presents an increase (Figure 3A). When observing the EVI and Gr long-time series (average monthly), the relationship was R2 = 0.70 (p-value = 0.001) (Figure 3B). The Gcc and Gr long-term averages showed R2 = 0.31 (p-value = 0.058, Lag 1) (Figure 3C), and R2 = 0.18 (p-value = 0.063, Lag 3) during the period of this research (2015–2017) (Figure 3D).
Precipitation is the climatic factor that best explains the variability in long-term EVI, with R2 = 0.58 (p-value = <0.001), compared to net radiation (R2 = 0.30, p-value = 0.002). To the Gcc, precipitation explains 32% (p-value = 0.002) of variance, and net radiation explains 21% from Gcc (p-value = 0.015).
The analysis of the historical averaged monthly Gcc and total litter production, Gcc explained 45% of the variation of the total litter with one month lag (p-value = 0.0169) (Figure 4A); however, this relationship is weakened and not significant when tested month by month in the study period (2015 to 2017) (R2 = 0.01; p-value = 0.68).
Average monthly EVI does not follow changes in canopy structure associated with monthly leaf flush average by Gcc; on the contrary, an out-of-phase trend was observed between these two indices (Figure 2G,H). EVI × Gcc was R2 = 0.03 p-value = 0.61 (Figure 4B), and EVI × total litter was R2 = 0.14 p-value = 0.22 (Figure 4C). However, EVI with 3 months lag had R2 = 0.64 to total litter (p-value < 0.001) (Figure 4D).

3.2. Drought Tolerance

In terms of the leaf water potential at turgor loss (πTLP), among the monitored species, only one specimen showed resistance (id 284), based on the confidence interval (CI) established for seasonal tropical forests (πTLP > −3.01 MPa) based on [38]. Twelve specimens (id 382, 380, 381, 161, 32, 168, 286, 183, 489, 24, 36, 328) had moderate resistance (−1.69 ≥ πTLP ≥ −3.01 MPa), and nine species (id 288, 31, 29, 137, 27, 167, 102, 152, 20) had πTLP values within the low resistance class (πTLP > −1.69 MPa) (Figure 5). Specimen id 254 does not have a πTLP measurement.
The individual with the smallest stem diameter (DBH ≤ 20 cm) had more negative πTLP, with a mean of −2.2 ± 0.74 MPa. Species with DBH > 20 cm represented the diameter class with the highest πTLP values, with a mean of −1.73 ± 0.08 MPa (Figure 5). All classes presented mean values within the confidence interval from [38]. The mean of πTLP was −1.87 ± 0.63 MPa, then the monitored trees can be classified as having moderate drought resistance.
According to the P50 confidence interval, based on [39], two specimens showed low resistance to drought (id 380, 382) (P50 > −1.32 MPa), three specimens showed moderate resistance (id 381, 31, 137) (−1.32 ≥ P50 ≥ −3.54 MPa), and five specimens had P50 in the high resistance range (id 167, 168, 286, 183, 254) (P50 < −3.54 MPa) (Figure 6). The other trees did not have P50 measured. Considering all analyzed individuals, the average P50 for the plot was −3.25 ± 1.51 MPa, which corresponds to the moderate drought resistance class.
Individuals included in the ≤ 20 cm diameter class (thin tree) had higher P50 (−1.51 ± 1.03 MPa), which is equivalent to lower resistance to drought, and individuals with DBH > 20 cm (large tree) had lower values (−3.63 ± 1.21 MPa), which means higher drought resistance (Table 3).
Isohydricity is a good indicator of limitations to stomatal function, in which isohydric behavior species have greater stomatal regulation and anisohydric show minimal stomatal regulation. In the RJA site, an anisohydric behavior was predominant among the species, in which 75% (dry season) and 76% (wet season) of the evaluated species showed fluctuations in leaf water potential (ΨF) throughout the day as weather conditions varied. The ΨF varied with air temperature in 63% of the species in the dry period and 82% in the wet season, with increasing temperature during the day. The results from the functional attributes associated with the diurnal variation in the plant water potential suggest that this forest presents a moderate level of drought tolerance.
The hydraulic safety margin (HSM), which indicates how far the species is from a possible hydraulic failure during normal drought conditions [39,66], was a good predictor of diameter variation of the trees (R2 = 0.4299, p-value = 0.0436) (Figure 7A). When two outliers are excluded, the value reaches R2 = 0.8136 (p-value = 0.0025) (Figure 7B). More negative HSM indicates greater risk of embolism and, therefore, greater possibility of hydraulic failure [67]. The lowest values of HSM were observed in thinner trees, confirming their vulnerability to drought.
The functional attributes of drought tolerance, such as P50, πTLP and isohydricity, show a trend of moderate drought tolerance for the study plot. When evaluated by stem diameter, thinner trees show less resistance to drought.

4. Discussion

4.1. How Is the Seasonal Dynamics of the Forest in the Southwest Portion of the Amazon?

Seasonally, the phenological and physiological aspects show a diverse articulation in terms of survival strategy during the dry season, which, on average, reaches a total rainfall of ~250 mm in the 5 (five) months duration. Stem growth is prioritized in the wet season, and leaf renewal (see litter and Gcc) in the dry season (Figure 8). Plant investment in different tissues, following climatic seasonality, was also observed in other Amazonian sites [25]. The seasonality of stem growth occurs in phase with the seasonality of precipitation (R2 = 0.44, p-value = 0.001) (Figure 8), this trend was observed in several biomes [3,59,68,69]. In tropical forests, the relationship between stem growth and rainfall has been observed regardless of whether water or light availability acts as a limiting factor [3,69], as low water availability inhibits cell expansion process [70]. [68] state that small rainfall events can accelerate radial growth, even without moistening the soil or fully rehydrating the tree. This indicates that more important than water stored in the soil is rainfall for stem growth, and a change in rainfall patterns over this region can lead to effects on stem growth.
In the dry season, we also observed lower photosynthetic activity (represented by the EVI) and increased production of new leaves (represented by the Gcc and Litter) (Figure 8). This suggests that leaf renewal, in addition to weather conditions, is also related to the seasonality of wood growth, since the increase in the number of new leaves diverts energy from wood formation to the formation of leaf tissues [19]. The seasonality of stem growth following the seasonality of the EVI confirms this energy partition, as wood formation tends to occur in the season with greater availability of resources, e.g., water, nutrients and carbon. The reduction in stem growth at the RJA site during the drought corroborates global studies that have observed a decrease in net primary productivity driven by drought [1] and a decrease in stem growth in much of the Amazon [26,71].
Total litter increased in the dry season and decreased in the wet season (Figure 8), which corroborates the seasonality of the EVI, showing an increase in the wet season and decrease in the dry season with 3 months lag (R2 = 0.64, p-value < 0.001), when new leaves are expected to reach maturity 3–5 months after being produced [72,73], thus increasing the photosynthetic activity of the canopy.
Historical average of Gcc, is an important index to characterize leaf renewal in the study area, and to identify a bi-seasonal leaf flush aspect. However, its use to assess the seasonality of canopy phenology on a reduced time scale needs to be carefully analyzed due to the rapid response of this index to changes in the canopy in terms of leaf loss and renewal, which occurs throughout the entire year.

4.2. What Are The Forest Mechanisms to Resist Seasonal Drought?

As a result of a water deficit, plants can act to prevent hydraulic failure by closing the stomata, which causes a consequent reduction in transpiration and photosynthesis [74]. At the RJA site, different trees showed different survival strategies during periods of limited water availability, ranging from species that regulate stomata during the day (isohydric) to those that do not perform stomatal regulation as climatic conditions vary (anisohydric). In the wet period (October), 76% of the trees analyzed presented anisohydric behavior, and in the dry period (July) 75%. Anisohydric plants, under optimal conditions and under mild to moderate drought conditions, maintain greater stomatal conductance (gs) and CO2 assimilation than isohydric plants [75].
The pattern observed in evapotranspiration (Etp/MODIS), of a slight increase during the dry season, remaining almost constant throughout the year, corroborates the predominant anisohydric characteristic of species from the RJA site, which maintain their ability to carry out gas exchange due to low regulation stomatal even during the dry season. In other words, the existence of energy (Rn) and water in the system, part of the net radiation is used in the metabolic processes of plants, part is transformed into sensible heat that heats the soil and atmosphere and a greater part is commonly used to evapotranspire water [76].
Another plant survival strategy is foliar abscission, reported as a plant adaptation mechanism to dry periods, used to minimize water loss by transpiration [77]. The increase in litter production at the RJA site occurs during the dry period, but this pattern does not seem to reflect a water loss minimization strategy, since, although there is less rainfall, it is during this period that there is a slight increase in evapotranspiration, evaluated with MODIS and corroborated by previous studies [17,78], and an increase in the production of new leaves.
Evapotranspiration (Etp) has been used as an indication that the Amazon forest supports the dry season well, due to the fact that in some regions, Etp presents higher values in the dry season than in the wet season [16,17,79], as observed in this research. The question is, how can high Etp rates be maintained in periods of low rainfall? This answer has been supported by the hypothesis that plants produce roots capable of capturing water from deep soil layers [17,80], but the knowledge of root depth is still scarce [81]. During the drillings for soil collection at the RJA site, fine roots were observed to a depth of 5 m excavated, and the water table reaches more than 8 m in September, at the end of the dry season and beginning of the wet season (Figure 9). Based on this, the increase in Etp in the dry season, identified with data obtained remotely and corroborated by the literature, and the increase in the production of new leaves in this period, using Gcc and litter as proxies, can be explained by some mechanisms identified in the area of study, and based on previous studies carried out at Rebio Jaru: (i) water storage in the wet season keeps Etp in the dry season; (ii) deep roots, even if insignificant in mass, are efficient in capturing water from the soil, eventually distributing it to the shallower roots via hydraulic redistribution [17,82,83]; (iii) in the dry season, the flow of water in the soil is forced by capillary action, from the deeper and more humid layers to the shallower and drier layers, estimated to be around 2.8 mm.day−1 for the Rebio Jaru [18,80,81]; and (iv) the lower stomatal regulation by anisohydric plants, associated with the water supply and the availability of liquid radiation, allows gas exchange and, consequently, the maintenance of high Etp rates and the production of new leaves in the dry season, keeping Etp almost constant throughout the year.
Soil analysis showed homogeneity of the analyzed profiles. As a result, soils poor in nutrients and a thin layer rich in organic matter up to 0.20 m are observed. As a result, a large part of the supply of nutrients to plants comes from the decomposition of the biomass that falls on the forest floor. [84] observed a decomposition coefficient (K) of 1.37 for the RJA site, and that the decomposition of 50% of the material occurs in an average time of 184 days. The increase in litter at the beginning of the dry period therefore provides the necessary nutrients for the metabolic processes of the plants, since the soil in this area has low fertility and low nutrient content. High values during the dry season have been observed for the Amazonian forests [84,85], demonstrating that the forest has an intelligent mechanism to partition energy and survive.
Regarding stem growth (Gr), lower diameter class trees (DBH < 20 cm) showed less stem growth in all seasonal periods evaluated compared to high diameter class trees (DBH > 20 cm). Although the stem growth rate is reduced in the dry season, considering all diameter classes.
Trees with a diameter < 20 cm showed lower resistance to drought than those with a larger diameter (>20 cm), considering the attributes P50 (−1.51 ± 1.03 MPa), HSM and isohydric behavior.
Broad trees (DBH > 20 cm) showed greater growth in the RJA site. With the functional attributes πTLP (−1.73 ± 0.08 MPa), HSM and predominant anisohydric behavior, moderate drought resistance of these diameter classes was observed. This pattern indicates the ability to keep the stomata open, even during critical periods, which allows the maintenance of the tree’s metabolism to invest in growth, when water is not a limiting factor.
Analysis using functional attributes of drought tolerance showed a tradeoff between growth and tolerance. Broad trees, in the Amazon context, are identified as more vulnerable to drought, being more prone to mortality than thin trees [26,27,86]. Based on the set of attributes analyzed (P50, πTLP, HSM and isohydricity) in this research, larger diameter trees, in general, were more resistant to drought, due to their higher growth rate, lower P50 (more negative), higher HSM and anisohydric behavior (maintenance of gas exchange). On the other hand, thin trees (DBH ≤ 20 cm) grew less and had a higher P50 (less negative) compared to large trees, as a potential reflection of the greater stomatal control of species of this diameter class, which exhibit typically isohydric behavior. This indicates that greater stomatal control during drought is an adaptation strategy that, for the case of finer species, results in reduced growth due to limiting the capacity for gas exchange.
Although differences were observed between diameter classes, in the context of the plot (ROI), all classes showed resistance to drought within the limits established for the functional attributes based on [38,39], giving the RJA site moderate drought resistance. At the individual level or diameter classes, these attributes need to be carefully evaluated, since they represent different adaptation processes of plants to environmental forcings.
Taking into account the tendency to increase the stem growth (Gr) of trees with increased precipitation (R2 = 0.44, p-value = 0.001), it appears that the plant’s processes to invest in wood are mainly supplied by water from the rain. The trend of total litter to increase with increasing water table depth (R2 = 0.54, p-value < 0.001, Lag = 3), since litter was used as an indirect measure of leaf flush, these relationships may indicate that groundwater is used by the plant for the leaf renewal process. Water is therefore the main climatic factor of the forest dynamics in the RJA site.

4.3. Does Remote Sensing Have the Potential to Represent the Phenological and Physioloagical Changes of the Forest?

EVI was more related with rain than with net radiation. This result confirms the evidence raised by [69,87,88], that in Amazon regions with precipitation below the threshold of 2000 mm·year−1 [69,87] or 1943 mm·year−1 [88], photosynthesis, evaluated with EVI and SiF, is lower during the dry season than during the wet season. Therefore, in regions where the average annual precipitation is less than 2000 mm, the water stored in the soil in the wet season tends not to be enough to meet the atmospheric demands of the dry period.
It is suggested that the RJA site, in the southwest of the Amazon rainforest, is limited by water, so that photosynthetic activity increases with precipitation, and EVI peaks occur in November during the wet season. This result is consistent with a previous analysis that observed that maximum chlorophyll values occur between September and December for 88% of the Amazon rainforest [88], confirming our hypothesis that EVI is a better indicator of the maturity of leaves that fall from trees in the dry season. It has been discussed that young leaves tend to have higher transmittance of infrared radiation than mature leaves; therefore, it is expected that, as the leaves fall and are changed, the EVI decreases in response to its dependence on the near infrared band [89,90,91], which is the region of the spectrum that interacts with the intercellular spaces of the leaf mesophyll [92,93]. Additionally, as the new leaves reach maturity and the canopy increases its leaf area, there is an increase in EVI. So EVI was not related to total litter and Gcc, but was related to stem growth.
The seasonal variation of Gcc was consistent with the characteristic of the study region, in which leaf exchange is observed throughout the year, although greater in the dry season, and smaller in the wet season. The occurrence of leaf flush (foliar renewal) during the dry season has been reported in other regions of the eastern Amazon, e.g., [72,79,87,94,95] and now, with this dataset, at the RJA site located in the southwest of the Amazon basin. The results presented here demonstrate a bi-seasonal leaf flush characteristic, with peaks occurring in the dry season and at the beginning of the wet season. The total litter production also increased in the dry season, with a gradual reduction until the mid-wet season (Figure 2), corroborating the long-term Gcc.
Because of this, the pattern observed at the RJA site was the occurrence of the greening effect (or green-up, greeness) in the wet season, between October and April, which is the increase in photosynthetic activity observed by remote products. In the dry season, the browning (or brown-down) effect occurs, between May and September, a period in which there is leaf renewal and reduced photosynthetic activity. This result shows that there is a difference in the sensitivity of Gcc and EVI to chlorophyll present in leaves and shows that the expected greening during the dry season [21,78,96] does not occur in this region of the Amazon. The Gcc and Gr showed no relationship, that is, while the production of new leaves increases, the stem growth is reduced.
Ref. [71] observed that in tropical forests of French Guiana wood and leaf production processes occur separately. For this analysis they used measurements of litter, wood growth with band dendrometers and EVI data as a proxy of photosynthetic activity (MODIS/MOD13Q1 product). The authors observed that peak EVI occurs with a delay of 3.5 months with wood growth (R = 0.70), and in the dry season, when leaf renewal driven by radiation occurs, wood growth ceases. Already at the beginning of the wet season, when leaves are ripe and water is available, stem growth returns quickly, reflecting a shift in carbon allocation from short-lived plant organs (leaves) to long-lived ones (wood). This pattern was observed in this research, corroborating that in sites limited by water, the process of resource allocation by plants also occurs. However, unlike [71], the MODIS product used in this research, correcting the atmospheric effects and artifacts of the sun-sensor geometry with the MAIAC algorithm, showed a positive relationship between EVI and stem growth without lag of R2 = 0.32 in the study period (2015/17).
These results reveal the potential of remote sensing to assess forest dynamics and, in other cases, to support the integrated interpretation of the forest drought response. Although challenges exist, advances are being made, using traditional [97] and functional [98] vegetation indices.
Our results have brought unprecedented knowledge to this study area about how the forest responds to drought, which can support future projects in this region of the Amazon. The challenge on this site is to maintain the continuity of collections and access logistics. It is important to advance in the application of standardized atmospheric corrections for remote products, as MAIAC is an algorithm applied to MODIS images, which makes it difficult to compare the data with other freely available satellite images, such as TM, OLI and MUX sensors.

5. Conclusions

We provide the first regional assessment of the ecophysiological and physiological dynamics of the forest, integrating functional and orbital data in an installed plot in the southwest of the Amazonia. Additionally, we assess the forest’s response to the recent drought (2015/2016) using image-derived orbital products with corrections that exclude artifacts that may influence seasonal forest patterns (EVI MAIAC and Gcc MAIAC).
Our results, using remote sensing and in situ measurements, suggest that:
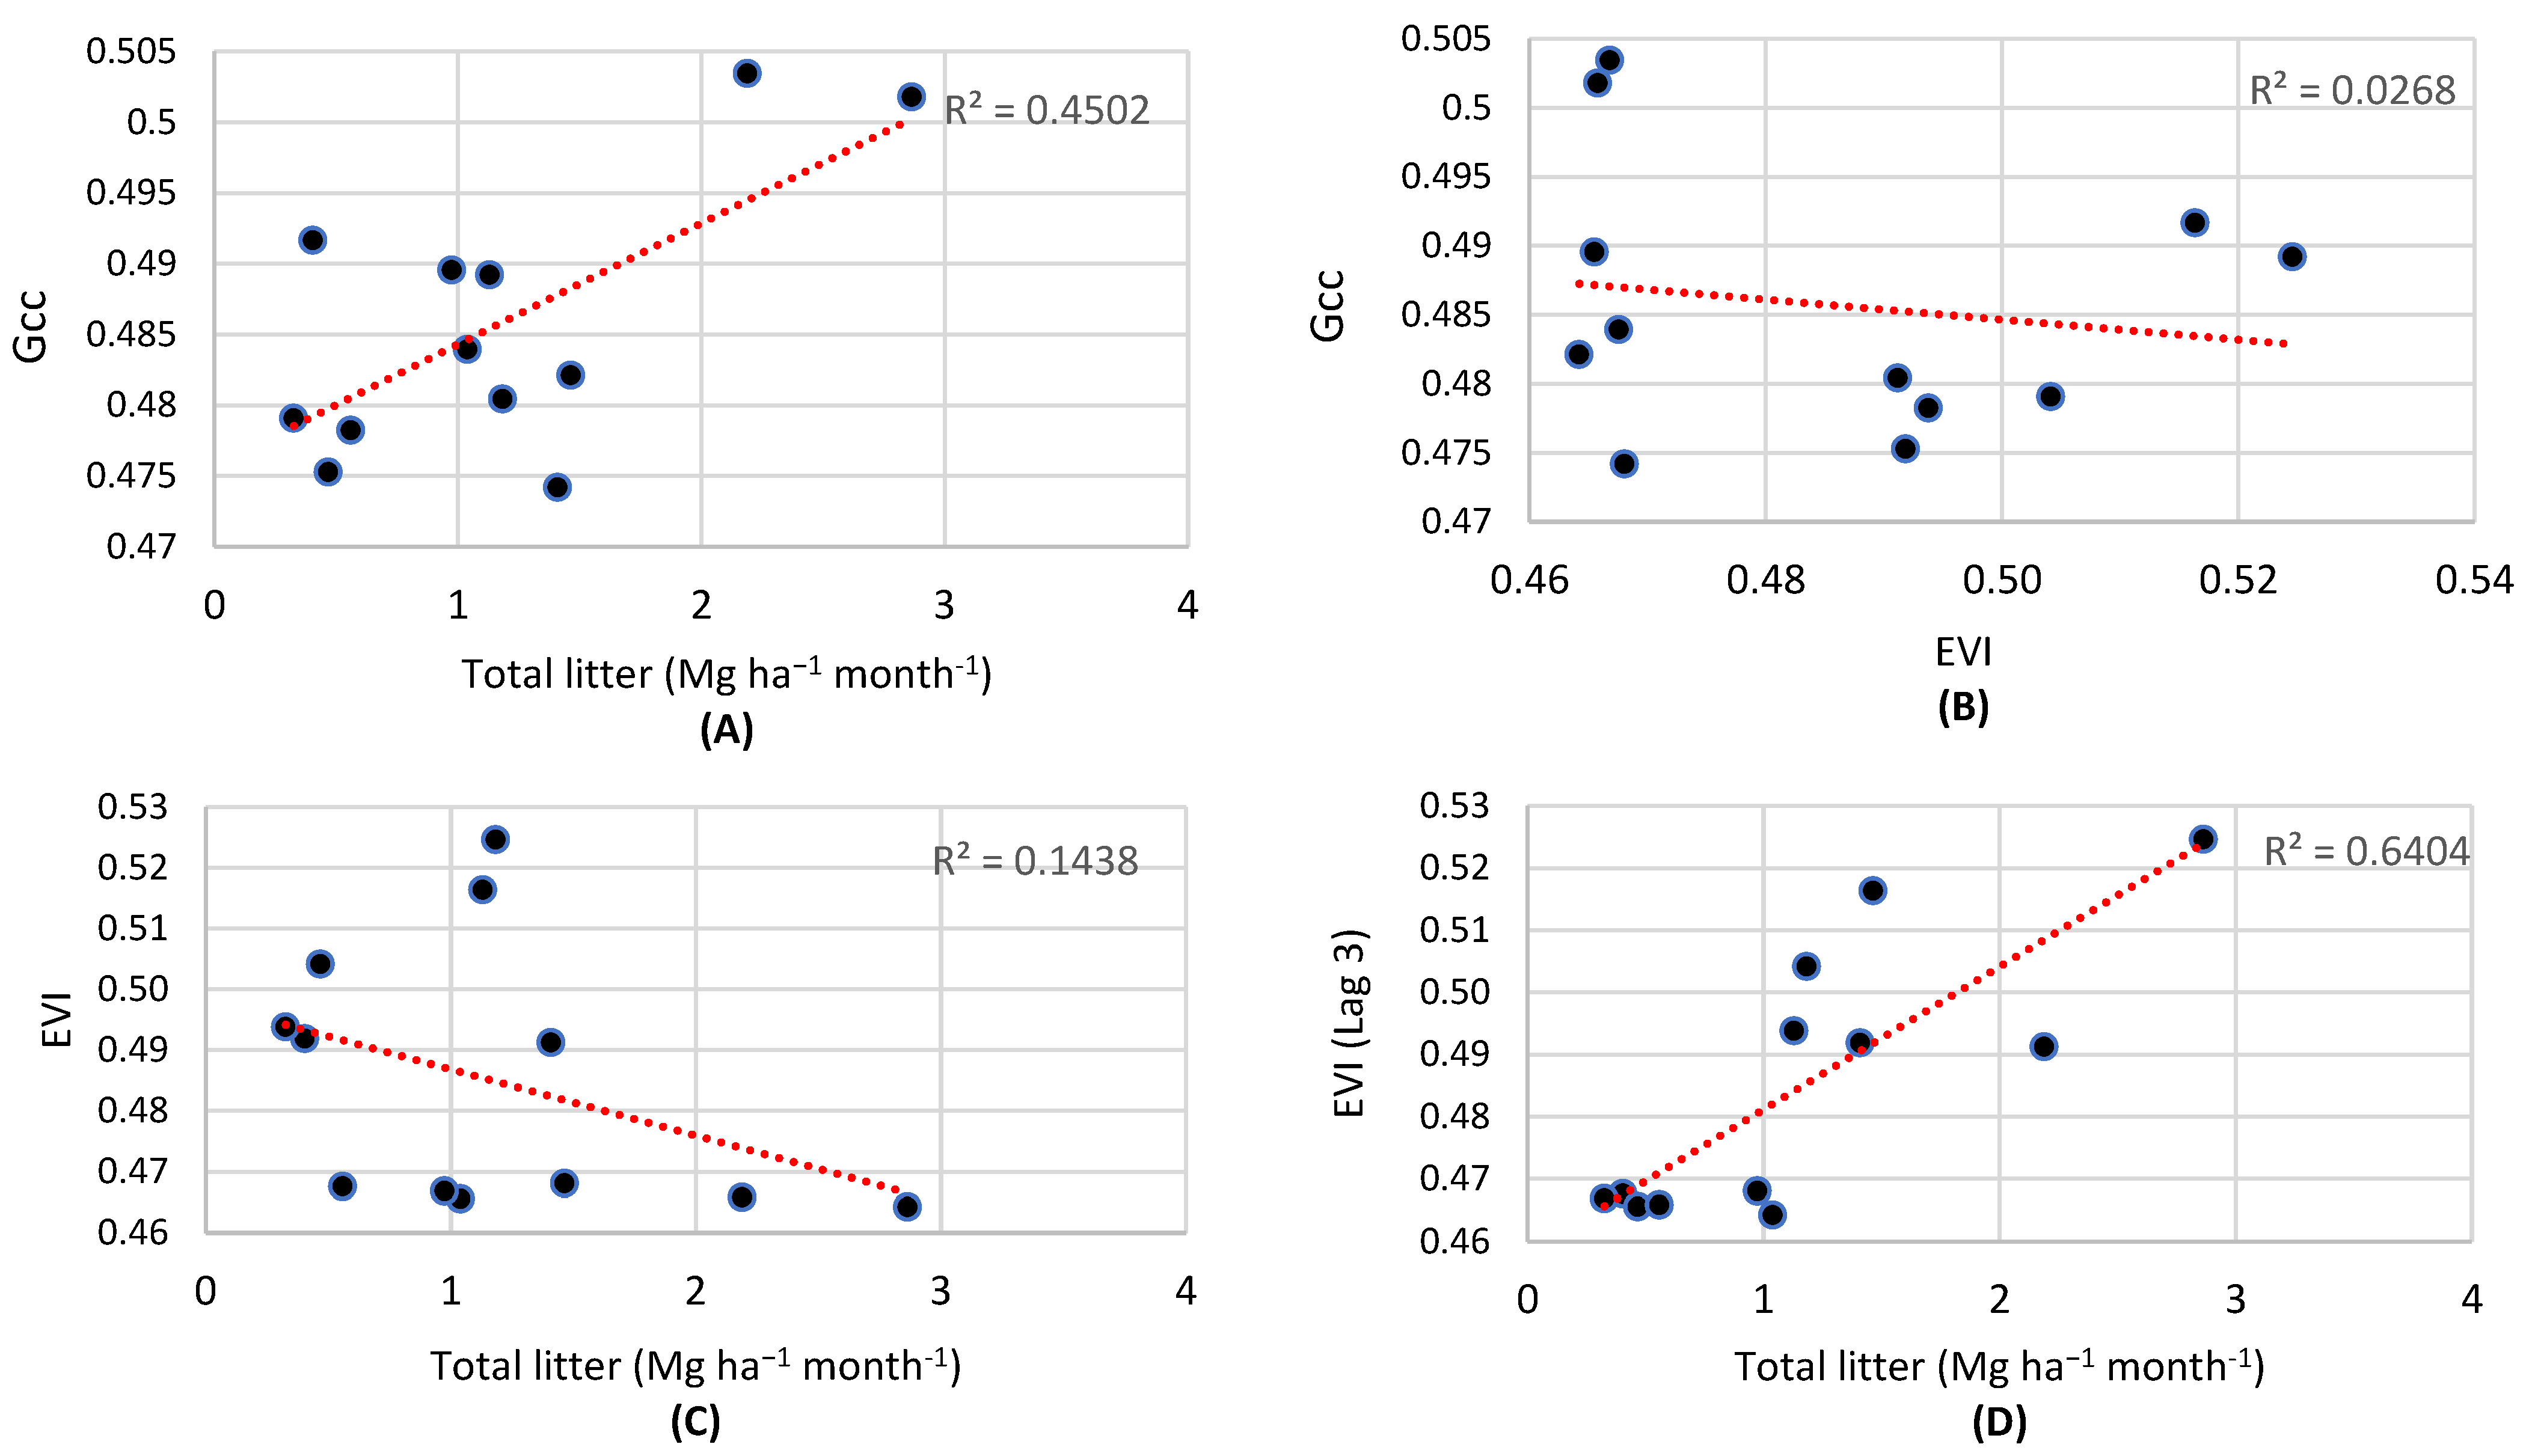
  • EVI and Gcc are sensitive to different responses of the forest canopy structure. During the dry season, the forest reduces its photosynthetic activity even as it renews its leaves at the same time, a browning effect. During the wet season, photosynthetic activity increases, with a greening effect, revealing the relationship of this response with leaf maturity.
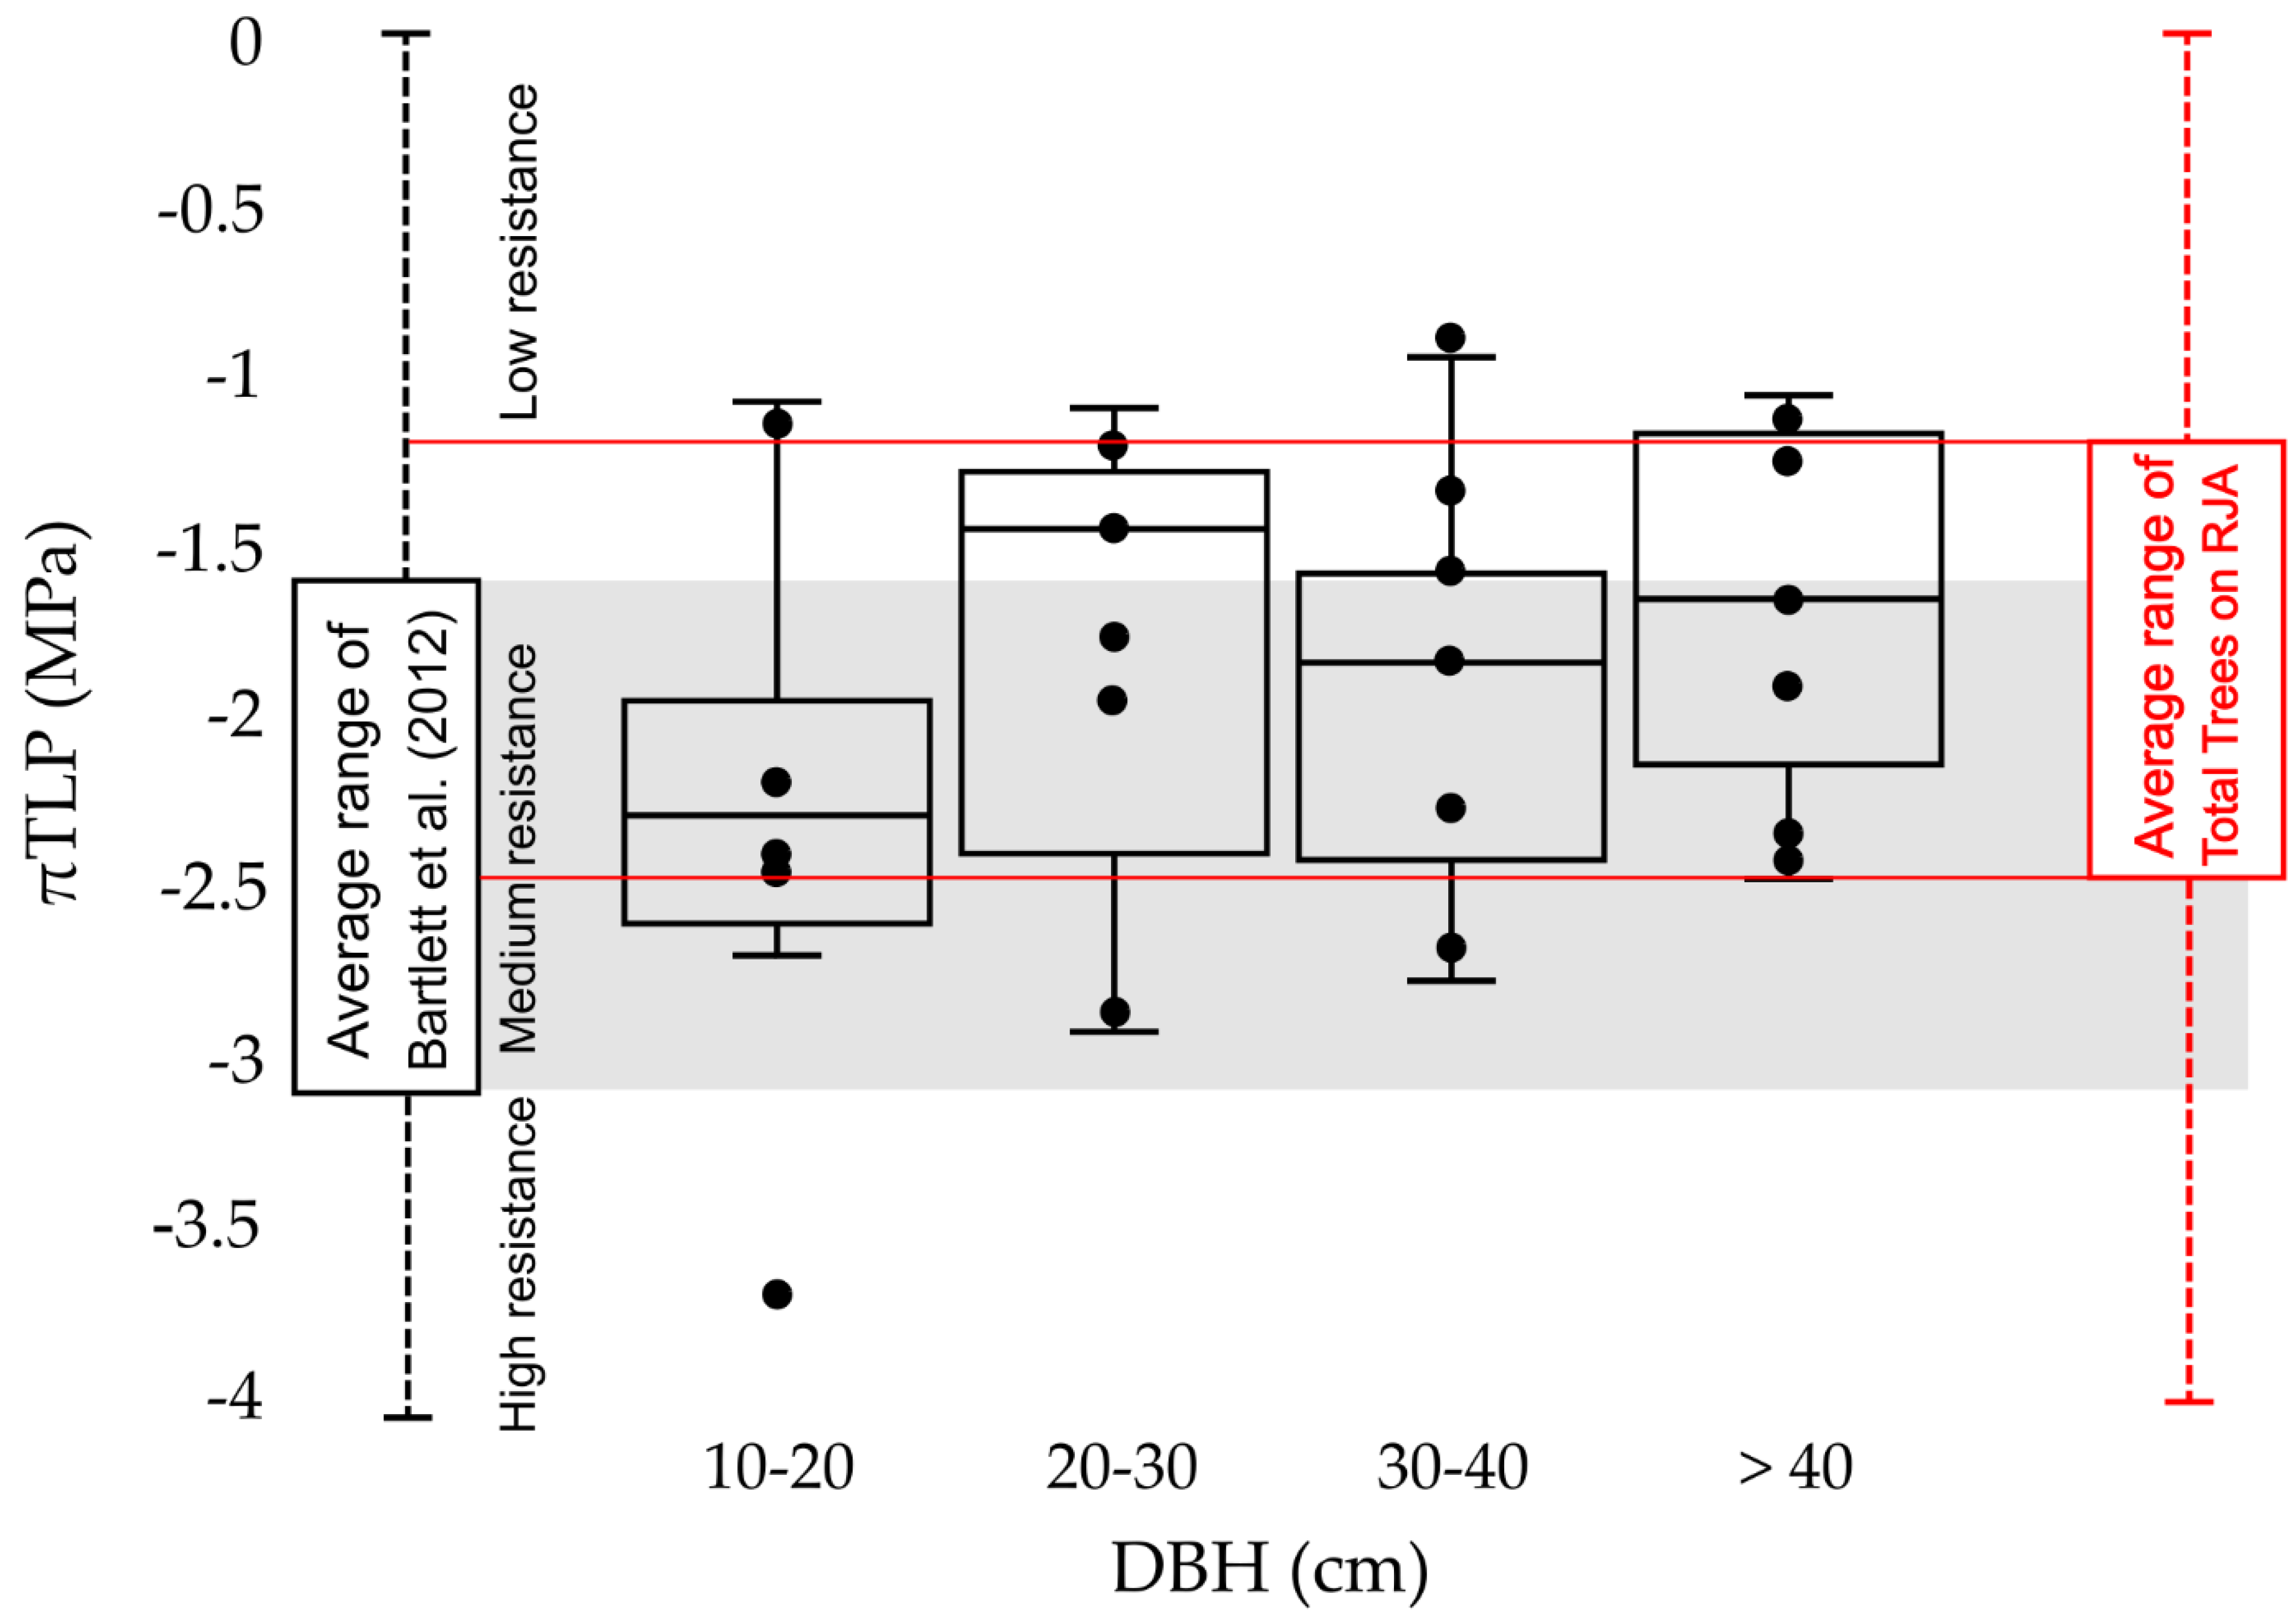
  • The pattern of vulnerability to drought does not follow that of other Amazonian sites. Trees with larger stem diameters are more resistant than trees with thinner stem diameters.
  • Negative effects on stem growth post-El-Niño 2015/2016 were observed, suggesting that the persistence of negative rainfall anomalies may be very critical for the forest, regardless of whether extreme drought is influenced by changes in ocean temperature.
  • It is expected that precipitation is climatic forcing with the greatest influence on both the stem growth and the increase in photosynthetic activity of the canopy.
  • In situ ecophysiological data are essential for this type of analysis; however, they are scarce, difficult to collect and have limited temporal resolution. Satellites provide a practical method to assess forest dynamics, at appropriate scales, to which this research sought to contribute.

Author Contributions

All authors have made significant contributions to this manuscript. R.D.A.D.S. and L.D.S.B. idealized the research proposal. R.D.A.D.S., R.A.P. and L.D.S.B. designed the experiment and performed all field collection and data processing. R.D.A.D.S., R.A.P. and V.M. collected the field data. R.D.A.D.S. and L.D.S.B. discussed and defined the appropriate methodological procedure. R.D.A.D.S., R.G.A. and A.D.W. processed the weather data from the flux tower. L.D.S.B. obtained financing. R.A.P. assisted in the processing of ecophysiological data. R.D.A.D.S., V.M. and L.D.S.B. wrote this manuscript together. All authors have read and agreed to the published version of the manuscript.

Funding

GoAmazon project supported by FAPESP 2013/50531-2, and Public Notice 12/2019/REIT-PROPESP/IFRO, 19 June 2019; Public Notice 180/2017/REIT-CGAB/REIT-CPOSG/IFRO, 17 August 2017 and Ordinance 2016/REIT- CGAB/IFRO, 11 October 2017 supported by Federal Institute of Education, Science and Technology of Rondônia (IFRO).

Data Availability Statement

The data presented in this study are available on reasonable request from the corresponding author. The data are not publicly available due to privacy restrictions.

Acknowledgments

We thank the and Federal Institute of Education, Science and Technology of Rondônia (IFRO) for providing equipment, National Institute For Space Research (INPE) for the Ph.D. course in Remote Sensing, and Academic Excellence Program (CAPES/PROEX) for granting a research grant. We also thank Ricardo Dalagnol for processing the MAIAC images, Dione Ventura for helping with field collections, LBA program for the partnership and supply of data from the Micrometeorological Tower. We would like to thank Chico Mendes Institute of Biodiversity (ICMBio), to the coordinators João Paulo de Oliveira Gomes and Patrícia Ferreira Ribeiro, for their authorization and support to this research. We also thank Paulo R. L. Bittencourt and Fernanda de Vasconcelos Barros for field data processing assistance and scripts.

Conflicts of Interest

The authors declare no conflict of interest.

References

  1. Zhao, M.; Running, S.W. Drought-induced reduction in global terrestrial net primary production from 2000 through 2009. Science 2010, 329, 940–943. [Google Scholar] [CrossRef] [PubMed] [Green Version]
  2. Malhi, Y.; Wood, D.; Baker, T.R.; Wright, J.; Phillips, O.L.; Cochrane, T.; Meir, P.; Chave, J.; Almeida, S.; Arroyo, L.; et al. The regional variation of aboveground live biomass in old-growth Amazonian forests. Glob. Chang. Biol. 2006, 12, 1107–1138. [Google Scholar] [CrossRef]
  3. Wagner, F.H.; Rossi, V.; Aubry-Kientz, M.; Bonal, D.; Dalitz, H.; Gliniars, R.; Stahl, C.; Trabucco, A.; Hérault, B. Pan-tropical analysis of climate effects on seasonal tree growth. PLoS ONE 2014, 9, e92337. [Google Scholar] [CrossRef] [PubMed]
  4. Costa, M.H.; Foley, J.A. Combined effects of deforestation and doubled atmospheric CO2 concentrations on the climate of Amazonia. J. Clim. 2000, 13, 18–34. [Google Scholar] [CrossRef]
  5. Li, W.; Fu, R.; Négron-Juárez, R.I.; Fernandes, K. Observed change of the standardized precipitation index, its potential cause and implications to future climate change in the Amazon region. Biol. Sci. 2008, 363, 1767–1772. [Google Scholar] [CrossRef] [PubMed]
  6. Gloor, M.; Barichivich, J.; Ziv, G.; Brienen, R.; Schöngart, J.; Peylin, P.; Cintra, B.B.L.; Feldpausch, T.; Phillips, O.; Baker, J. Recent Amazon climate as background for possible ongoing and future changes of Amazon humid forests. Glob. Biogeochem. Cycles 2015, 29, 1384–1399. [Google Scholar] [CrossRef]
  7. Moura, V.; Souza, R.D.A.D.; Mercante, E.; Richetti, J.; Johann, J.A. Three Decades after: Landscape Dynamics in Different Colonisation Models Implemented in the Brazilian Legal Amazon. Remote Sens. 2021, 13, 4581. [Google Scholar] [CrossRef]
  8. Jiménez-Muñoz, J.C.; Mattar, C.; Barichivich, J.; Santamaría-Artigas, A.; Takahashi, K.; Malhi, Y.; Sobrino, J.A.; van der Schrier, G. Record-breaking warming and extreme drought in the Amazon rainforest during the course of El Niño 2015–2016. Sci. Rep. 2016, 6, 33130. [Google Scholar] [CrossRef] [PubMed] [Green Version]
  9. Lewis, S.L.; Brando, P.M.; Phillips, O.L.; Van Der Heijden, G.M.F.; Nepstad, D. The 2010 Amazon drought. Science 2011, 331, 554. [Google Scholar] [CrossRef]
  10. Marengo, J.A.; Espinoza, J.C. Extreme seasonal droughts and floods in Amazonia: Causes, trends and impacts. Int. J. Climatol. 2016, 36, 1033–1050. [Google Scholar] [CrossRef]
  11. Marengo, J.A.; Nobre, C.A.; Tomasella, J.; Oyama, M.D.; Oliveira, G.S.; Oliveira, R.; Camargo, H.; Alves, L.M.; Brown, F. The drought of Amazonia in 2005. J. Clim. 2008, 21, 495–516. [Google Scholar] [CrossRef] [Green Version]
  12. Erfanian, A.; Wang, G.; Fomenko, L. Unprecedented drought over tropical South America in 2016: Significantly under-predicted by tropical SST. Sci. Rep. 2017, 7, 5811. [Google Scholar] [CrossRef] [Green Version]
  13. Cox, P.M.; Betts, R.A.; Collins, M.; Harris, P.P.; Huntingford, C.; Jones, C.D. Amazonian forest dieback under climate-carbon cycle projections for the 21st century. Theor. Appl. Climatol. 2004, 78, 137–156. [Google Scholar] [CrossRef]
  14. Fearnside, P.M.A. Vulnerabilidade da floresta amazônica perante as mudanças climáticas. Oecologia Bras. 2009, 13, 609–618. [Google Scholar] [CrossRef] [Green Version]
  15. Nobre, C.A.; Sellers, P.J.; Shukla, J. Amazonian deforestation and global climate change. J. Clim. 1991, 4, 957–988. [Google Scholar] [CrossRef] [Green Version]
  16. Shuttleworth, W. Evaporation from Amazonian rainforest. Biol. Sci. 1988, 233, 321–346. [Google Scholar] [CrossRef]
  17. Von Randow, C.; Manzi, A.O.; Kruijt, B.; de Oliveira, P.J.; Zanchi, F.B.; Silva, R.L.; Hodnett, M.G.; Gash, J.H.C.; Elbers, J.A.; Waterloo, M.J.; et al. Comparative measurements and seasonal variations in energy and carbon exchange over forest and pasture in South West Amazonia. Theor. Appl. Climatol. 2004, 78, 5–26. [Google Scholar] [CrossRef]
  18. Da Rocha, H.R.; Manzi, A.O.; Cabral, O.M.; Miller, S.D.; Goulden, M.L.; Saleska, S.R.; R.-Coupe, N.; Wofsy, S.C.; Borma, L.S.; Artaxo, P.; et al. Patterns of water and heat flux across a biome gradient from tropical forest to savanna in Brazil. J. Geophys. Res. 2009, 114, 1–8. [Google Scholar] [CrossRef]
  19. Restrepo-Coupe, N.; da Rocha, H.R.; Hutyra, L.R.; Araujo, A.C.; Borma, L.S.; Christiffersen, B.; Cabral, O.M.R.; Camargo, P.B.; Cardoso, F.L.; Costa, A.C.L.; et al. What drives the seasonality of photosynthesis across the amazon basin? a cross-site analysis of eddy flux tower measurements from the Brasil flux network. Agric. For. Meteorol. 2013, 182, 128–144. [Google Scholar] [CrossRef] [Green Version]
  20. Saleska, S.R.; Didan, K.; Huete, A.R.; da Rocha, H.R. Amazon Forests Green-Up during 2005 Drought. Nature 2007, 318, 612. [Google Scholar] [CrossRef] [PubMed] [Green Version]
  21. Saleska, S.R.; Wu, J.; Guan, K.; Araujo, A.C.; Huete, A.; Nobre, A.D.; Restrepo-Coupe, N. Dry-season greening of Amazon forests. Nature 2016, 531, E4–E5. [Google Scholar] [CrossRef] [PubMed]
  22. Asner, G.P.; Alencar, A. Drought impacts on the Amazon forest: The remote sensing perspective. New Phytol. 2010, 187, 569–578. [Google Scholar] [CrossRef] [PubMed]
  23. Samanta, A.; Ganguly, S.; Hashimoto, H.; Devadiga, S.; Vermote, E.; Knyazikhin, Y.; Nemani, R.R.; Myneni, R.B. Amazon forests did not green-up during the 2005 drought. Geophys. Res. Lett. 2010, 37, 5. [Google Scholar] [CrossRef]
  24. Morton, D.C.; Nagol, J.; Carabajal, C.C.; Rosette, J.; Palace, M.; Cook, B.D.; Vermote, E.F.; Harding, D.J.; North, P.R.J. Amazon forests maintain consistent canopy structure and greenness during the dry season. Nature 2014, 506, 221–224. [Google Scholar] [CrossRef] [PubMed]
  25. Restrepo-Coupe, N.; Levine, N.M.; Christoffersen, B.O.; Albert, L.P.; Wu, J.; Costa, M.H.; Galbraith, D.; Imbuzeiro, H.; Martins, G.; Araujo, A.G.; et al. Do dynamic global vegetation models capture the seasonality of carbon fluxes in the Amazon basin? A data-model intercomparison. Glob. Chang. Biol. 2016, 23, 191–208. [Google Scholar] [CrossRef] [PubMed] [Green Version]
  26. Phillips, O.L.; Aragao, L.E.O.C.; Lewis, S.L.; Fisher, J.B.; Lloyd, J.; López-González, G.; Malhi, Y.; Monteagudo, A.; Peacock, J.; Quesada, C.A.; et al. Drought sensitivity of the Amazon rainforest. Science 2009, 323, 1344–1347. [Google Scholar] [CrossRef] [PubMed] [Green Version]
  27. Phillips, O.L.; van der Heijden, G.; Lewis, S.L.; López-González, G.; Aragao, L.E.O.C.; Lloyd, J.; Malhi, Y.; Monteagudo, A.; Almeida, S.; Dávila, E.A.; et al. Drought–mortality relationships for tropical forests. New Phytol. 2010, 187, 631–646. [Google Scholar] [CrossRef] [Green Version]
  28. Williamson, G.B.; Laurance, W.F.; Oliveira, A.A.; Delamônica, P.; Gascon, C.; Lovejoy, T.E.; Pohl, L. Amazonian tree mortality during the 1997 El Nino drought. Conserv. Biol. 2000, 14, 1538–1542. [Google Scholar] [CrossRef] [Green Version]
  29. Doughty, C.E.; Malhi, Y.; Araujo-Murakami, A.; Metcalfe, D.B.; Silva-Espejo, J.E.; Arroyo, L.; Heredia, J.P.; Pardo-Toledo, E.; Mendizabal, L.M.; Rojas-Landivar, V.D.; et al. Allocation trade-offs dominate the response of tropical forest growth to seasonal and interannual drought. Ecology 2014, 95, 1–6. [Google Scholar] [CrossRef]
  30. Janssen, T.; Fleischer, K.; Luyssaert, S.; Naudts, K.; Dolman, H. Drought resistance increases from the individual to the ecosystem level in highly diverse Neotropical rainforest: A meta-analysis of leaf, tree and ecosystem responses to drought. Biogeosciences 2020, 17, 2621–2645. [Google Scholar] [CrossRef]
  31. Janssen, T.; van der Velde, Y.; Hofhansl, F.; Luyssaert, S.; Naudts, K.; Driessen, B.; Fleischer, K.; Dolman, H. Drought effects on leaf fall, leaf flushing and stem growth in the Amazon forest: Reconciling remote sensing data and field observations. Biogeosciences 2021, 18, 4445–4472. [Google Scholar] [CrossRef]
  32. Naeem, S.; Bunker, D.E.; Hector, A.; Loreau, M.; Perrings, C. Biodiversity, Ecosystem Functioning, and Human Wellbeing: An Ecological and Economic Perspective; Oxford University Press: Oxford, UK, 2009; p. 388. [Google Scholar] [CrossRef] [Green Version]
  33. Hubau, W.; Lewis, S.L.; Phillips, O.L.; Affum-Baffoe, K.; Beeckman, H.; Cuní-Sanchez, A.; Daniels, A.K.; Ewango, C.E.N.; Fauset, S.; Mukinzi, M.; et al. Asynchronous carbon sink saturation in African and Amazonian tropical forests. Nature 2019, 579, 80–87. [Google Scholar] [CrossRef] [PubMed] [Green Version]
  34. Pacifici, M.; Foden, W.B.; Visconti, P.; Watson, J.E.; Butchart, S.H.; Kovacs, K.M.; Cheffers, B.R.; Hole, D.G.; Martin, T.G.; Akçakaya, H.R.; et al. Assessing species vulnerability to climate change. Nat. Clim. Chang. 2015, 5, 215–224. [Google Scholar] [CrossRef]
  35. Kissling, W.D.; Walls, R.; Bowser, A.; Jones, M.O.; Kattge, J.; Agosti, D.; Amengual, J.; Basset, A.; van Bodegom, P.M.; Cornelissen, J.H.C.; et al. Towards global data products of essential biodiversity variables on species traits. Nat. Ecol. Evol. 2018, 2, 1531–1540. [Google Scholar] [CrossRef] [Green Version]
  36. Marechaux, I.; Bartlett, M.K.; Sack, L.; Baraloto, C.; Engel, J.; Joetzjer, E.; Chave, J. Drought tolerance as predicted by leaf water potential at turgor loss point varies strongly across species within an Amazonian forest. Funct. Ecol. 2015, 29, 1268–1277. [Google Scholar] [CrossRef]
  37. Konings, A.; Gentine, P. Global variations in ecosystem-scale isohydricity. Glob. Chang. Biol. 2016, 23, 891–905. [Google Scholar] [CrossRef] [PubMed]
  38. Bartlett, M.; Scoffon, C.; Sack, L. The determinants of leaf turgor loss point and prediction of drought tolerance of species and biomes: A global meta-analysis. Ecol. Lett. 2012, 15, 393–405. [Google Scholar] [CrossRef]
  39. Choat, B.; Jansen, S.; Brodribb, T.J.; Cochard, H.; Delzon, S.; Bhaskar, R.; Bucci, S.J.; Field, T.S.; Gleason, S.M.; Hacke, U.G.; et al. Global convergence in the vulnerability of forests to drought. Nature 2012, 491, 752–756. [Google Scholar] [CrossRef] [PubMed] [Green Version]
  40. Clark, M.L. Comparison of simulated hyperspectral HyspIRI and multispectral Landsat 8 and Sentinel-2 imagery for multi-seasonal, regional land-cover mapping. Remote Sens. Environ. 2017, 200, 311–325. [Google Scholar] [CrossRef]
  41. Wallis, C.I.; Homeier, J.; Peña, J.; Brandl, R.; Farwig, N.; Bendix, J. Modeling tropical montane forest biomass, productivity and canopy traits with multispectral remote sensing data. Remote Sens. Environ. 2019, 225, 77–92. [Google Scholar] [CrossRef]
  42. Aguirre-Gutiérrez, J.; Rifai, S.; Shenkin, A.; Oliveras, I.; Bentley, L.P.; Svátek, M.; Giradin, C.A.J.; Both, S.; Riutta, T.; Berenguer, E.; et al. Pantropical modelling of canopy functional traits using Sentinel-2 remote sensing data. Remote Sens. Environ. 2021, 252, 112122. [Google Scholar] [CrossRef]
  43. Herrmann, I.; Berger, K. Remote and Proximal Assessment of Plant Traits. Remote Sens. 2021, 13, 1893. [Google Scholar] [CrossRef]
  44. Ma, X.; Migliavacca, M.; Wirth, C.; Bohn, F.J.; Huth, A.; Richter, R.; Mahecha, M.D. Monitoring Plant Functional Diversity Using the Reflectance and Echo from Space. Remote Sens. 2020, 12, 1248. [Google Scholar] [CrossRef] [Green Version]
  45. IPCC-SREX, Intergovernmental Panel on Climate Change. Managing the Risks of Extreme Events and Disasters to Advance Climate Change Adaptation: Special Report of the Intergovernmental Panel on Climate Change. 2012. Available online: https://www.ipcc.ch/pdf/special-reports/srex/SREX_Full_Report.pdf (accessed on 10 April 2021).
  46. Barros, F.V. Hydraulic Functioning and Drought Vulnerability of Two Tropical Forests. Ph.D. Thesis, Universidade Estadual de Campinas, Campinas, Brazil, 2017; 146p. [Google Scholar]
  47. Michiles, A.A.S. Taxas de Armazenamento Térmico na Biomassa e Balanço de Energia em Superfície para Áreas de Floresta de Terra Firme na Amazônia. Ph.D. Thesis, Instituto Nacional de Pesquisas Espaciais, São José dos Campos, Brazil, 2009; 185p. [Google Scholar]
  48. Sombroek, W. Spatial and Temporal Patterns of Amazon Rainfall. AMBIO A J. Hum. Environ. 2001, 30, 388–396. [Google Scholar] [CrossRef] [PubMed]
  49. Yang, J.; Tian, H.; Pan, S.; Chen, G.; Zhang, B.; Dangal, S. Amazon droughts and forest responses: Largely reduced forest photosynthesis but slightly increased canopy greenness during the extreme drought of 2015/2016. Glob. Chang. Biol. 2018, 24, 1919–1934. [Google Scholar] [CrossRef] [PubMed]
  50. Dalagnol, R.; Wagner, F.H.; Galvao, L.S.; Nelson, B.W.; Aragao, L.E.O.C. Life cycle of bamboo in southwestern Amazon and its relation to fire events. Biogeosciences Discuss 2018, 15, 6087–6104. [Google Scholar] [CrossRef] [Green Version]
  51. USGS. MOD16A2v006 Description. 2021. Available online: https://lpdaac.usgs.gov/products/mod16a2v006/ (accessed on 11 October 2021).
  52. NASA(National Aeronautics and Space Administration). Standardized Precipitation Index (SPI). 2018. Available online: https://gmao.gsfc.nasa.gov/research/subseasonal/atlas/SPI-html/SPI-description.html (accessed on 10 September 2021).
  53. Mckee, T.B.; Doesken, N.J.; Kleist, J. The relationship of drought frequency and duration to time scales. In Proceedings of the Conference on Applied Climatology, Boston, MA, USA, 17–22 January 1993; pp. 179–184. [Google Scholar]
  54. IRI/LDEO Climate Data Library. NOAA NCEP CPC PRECL v1p0 deg0p5 Rain: Monthly Mean of Daily Rainfall Data. 2021. Available online: http://iridl.ldeo.columbia.edu/SOURCES/.NOAA/.NCEP/.CPC/.PRECL/.v1p0/.deg0p5/.rain/ (accessed on 10 September 2021).
  55. Azevedo, G.B. Composição, Estrutura e Diversidade em Floresta Ombrófila na Reserva Biológica do Jaru-RO. Master’s Thesis, Universidade Federal de Mato Grosso, Cuiabá, Brazil, 2014. [Google Scholar]
  56. Dan, L.; Ferreira, B.G.A.; Siqueira, J.D.P.; Oliveira, M.M.; Ferreira, A.M. Floristic and phytosociology in dense “terra firme” rainforest in the Belo Monte Hydroelectric Plant influence area, Pará, Brazil. Braz. J. Biol. 2015, 75, 257–276. [Google Scholar] [CrossRef] [Green Version]
  57. Irvine, J.; Grace, J. Continuous measurement of water tensions in the xylem of trees based on the elastic properties of wood. Planta 1997, 202, 455–461. [Google Scholar] [CrossRef]
  58. Zweifel, R.; Item, H.; Häsler, R. Stem radius changes and their relation to stored water in stems of young norway spruce trees. Trees 2000, 15, 50–57. [Google Scholar] [CrossRef] [Green Version]
  59. Zweifel, R.; Zimmermann, L.; Newbery, D.M. Modelling tree water deficit from microclimate: An approach to quantifying drought stress. Tree Physiol. 2005, 25, 147–156. [Google Scholar] [CrossRef] [Green Version]
  60. Lyapustin, A.I.; Wang, Y.; Laszlo, I.; Hilker, T.; Hall, F.G.; Sellers, P.J.; Tucker, C.J.; Korkin, S.V. Multi-angle implementation of atmospheric correction for MODIS (MAIAC): 3. atmospheric correction. Remote Sens. Environ. 2012, 127, 385–393. [Google Scholar] [CrossRef]
  61. Huete, A.R.; Didan, K.; Miura, T.; Rodriguez, E.P.; Gao, X.; Ferreira, L.G. Overview of the radiometric and biophysical performance of the MODIS vegetation indices. Remote Sens. Environ. 2002, 83, 195–213. [Google Scholar] [CrossRef]
  62. Nijland, W.; Jong, R.; Jong, S.M.; Wulder, M.A.; Bater, C.W.; Coops, N.C. Monitoring plant condition and phenology using infrared sensitive consumer grade digital cameras. Agric. For. Meteorol. 2014, 184, 98–106. [Google Scholar] [CrossRef] [Green Version]
  63. Woebbecke, D.M.; Meyer, G.E.; Bargen, K.V.; Mortensen, D.A. Color indices for weed identification under various soil, residue, and lighting conditions. Trans. ASAE 1995, 38, 259–269. [Google Scholar] [CrossRef]
  64. Muler, R.A.S.; Moura, V.; Borma, L.S. Distribuição espaço-temporal da precipitação e SPI no estado de Rondônia (RO) por meio de técnicas de geoestatística. Rev. Geográfica Venez. 2018, 59, 246–260. [Google Scholar]
  65. Khanna, J.; Medvigy, D.; Fueglistaler, S.; Walko, R. Regional dry-season climate changes due to three decades of Amazonian deforestation. Nat. Clim. Chang. 2017, 7, 200–204. [Google Scholar] [CrossRef]
  66. Garzon, M.B.; Munoz, N.G.; Wigneron, J.P.; Moisy, C.; Fernandez-Manjarres, J.; Delzon, S. The legacy of water deficit on populations having experienced negative hydraulic safety margin. Glob. Ecol. Biogeogr. 2018, 27, 356. [Google Scholar] [CrossRef]
  67. Choat, B. Predicting thresholds of drought-induced mortality in woody plant species. Tree Physiol. 2013, 33, 669–671. [Google Scholar] [CrossRef] [PubMed] [Green Version]
  68. Zweifel, R. Radial stem variations: A source of tree physiological information not fully exploited yet. Plant Cell Environ. 2016, 39, 231–232. [Google Scholar] [CrossRef]
  69. Wagner, F.H.; Hérault, B.; Bonal, D.; Stahl, C.; Anderson, L.O.; Baker, T.R.; Becker, G.S.; Beeckman, H.; Souza, D.B.; Botosso, P.C.; et al. Climate seasonality limits leaf carbon assimilation and wood productivity in tropical forests. Biogeosciences 2016, 13, 2537–2562. [Google Scholar] [CrossRef] [Green Version]
  70. Krepkowski, J.; Bräuning, A.; Gebrekirstos, A.; Strobl, S. Cambial growth dynamics and climatic control of different tree life forms in tropical mountain forest in Ethiopia. Trees 2011, 25, 59–70. [Google Scholar] [CrossRef]
  71. Wagner, F.H.; Rossi, V.; Stahl, C.; Bonal, D.; Hérault, B. Asynchronism in leaf and wood production in tropical forests: A study combining satellite and ground-based measurements. Biogeosciences 2013, 10, 7307–7321. [Google Scholar] [CrossRef] [Green Version]
  72. Lopes, A.P.; Nelson, B.W.; Wu, J.; Graça, P.M.L.A.; Tavares, J.V.; Prohaska, N.; Martins, G.A.; Saleska, S.R. Leaf flush drives dry season green-up of the Central Amazon. Remote Sens. Environ. 2016, 182, 90–98. [Google Scholar] [CrossRef]
  73. Wu, J.; Albert, L.P.; Lopes, A.P.; restrepo-Coupa, N.; Hayek, M.; Wiedemann, K.T.; Guan, K.; Stark, S.C.; Christoffersen, B.; Prohaska, N.; et al. Leaf development and demography explain photosynthetic seasonality in Amazon evergreen forests. For. Ecol. 2016, 351, 972–976. [Google Scholar] [CrossRef] [Green Version]
  74. Sevanto, S.; Mcdowell, N.G.; Dickman, L.T.; Pangle, R.; Pockman, W.T. How do trees die? A test of the hydraulic failure and carbon starvation hypotheses. Plant Cell Environ. 2013, 37, 153–161. [Google Scholar] [CrossRef] [PubMed]
  75. Kumagai, T.; Porporato, A. Strategies of a Bornean tropical rainforest water use as a function of rainfall regime: Isohydric or anisohydric? Plant Cell Environ. 2012, 35, 61–71. [Google Scholar] [CrossRef]
  76. Hilel, D. Soil-water and soil-energy balances in the field. In Soil in the Environment; Academic Press: Cambridge, MA, USA, 2008; pp. 121–133. [Google Scholar]
  77. Larcher, W. Ecofisiologia Vegetal; Rima Artes e Textos: São Carlos, Brazil, 2000. [Google Scholar]
  78. Andrade, N.L.R.; Aguiar, R.G.; Sanches, L.; Alves, E.C.R.F.; Nogueira, J.S. Partição do saldo de radiação em áreas de floresta amazônica e floresta de transição Amazônia-Cerrado. Rev. Bras. Meteorol. 2009, 24, 346–355. [Google Scholar] [CrossRef]
  79. Huete, A.R.; Didan, K.; Shimabukuro, Y.E.; Ratana, P.; Saleska, S.R.; Hutyra, L.R.; Yang, W.; Nermani, R.R.; Myneni, R. Amazon rainforests green-up with sunlight in dry season. Geophys. Res. Lett. 2006, 33, 1–4. [Google Scholar] [CrossRef] [Green Version]
  80. Da Rocha, H.R.; Goulden, M.L.; Miller, S.D.; Menton, M.C.; Pinto, L.D.V.; Freitas, H.C.; Figueira, A.M.S. Seasonality of water and heat fluxes over a tropical Forest in eastern Amazônia. Ecol. Appl. 2004, 14, 22–32. [Google Scholar] [CrossRef]
  81. Fan, Y.; Miguez-Macho, G. Potential groundwater contribution to Amazon evapotranspiration. Hydrol. Earth Syst. Sci. 2010, 14, 2039–2056. [Google Scholar] [CrossRef] [Green Version]
  82. Nepstad, D.C.; Moutinho, P. The recovery of biomass, nutrient stocks, and deep soil function in secondary forests. In The Biogeochemistry of the Amazon Basin and Its Role in a Changing World; Oxford University Press: Oxford, UK, 2001; pp. 139–155. [Google Scholar]
  83. Oliveira, R.S.; Dawson, T.E.; Burgess, S.S.O.; Nepstad, D.C. Hydraulic redistribution in three Amazonian trees. Oecologia 2005, 145, 354–363. [Google Scholar] [CrossRef]
  84. Freire, G.A.P.; Ventura, D.J.; Fotopoulos, I.G.; Rosa, D.M.; Aguiar, R.A.; Araujo, A.C. Dinâmica sazonal de serapilheira em uma área de floresta de terra firme, Amazônia Ocidental. Nativa 2020, 8, 323–328. [Google Scholar] [CrossRef]
  85. Almeida, E.J.; Luizão, F.; Rodrigues, D.J. Produção de serrapilheira em florestas intactas e exploradas seletivamente no sul da Amazônia em função da área basal da vegetação e da densidade de plantas. Acta Amaz. 2015, 45, 157–166. [Google Scholar] [CrossRef] [Green Version]
  86. Rowland, L.; Costa, A.C.L.; Galbaith, D.R.; Oliveira, R.S.; Binks, O.J.; Oliveira, A.A.R.; Pullen, A.M.; Doughty, C.E. Metcalfe, D.B., Vasconcelos, S.S.; et al. Death from drought in tropical forests is triggered by hydraulics not carbon starvation. Nature 2015, 528, 119–122. [Google Scholar] [CrossRef] [PubMed] [Green Version]
  87. Guan, K.; Pan, M.; Li, H.; Wolf, A.; Wu, J.; Medvigy, D.; Caylor, K.K.; Sheffield, J.; Wood, E.F.; Malhi, Y.; et al. Photosynthetic seasonality of global tropical forests constrained by hydroclimate. Nat. Geosci. 2015, 8, 284–289. [Google Scholar] [CrossRef]
  88. Bertani, G.; Wagner, F.H.; Anderson, L.O.; Aragao, L.E.O.C. Chlorophyll fluorescence data reveals climate-related photosynthesis seasonality in Amazonian forests. Remote Sens. 2017, 9, 1275. [Google Scholar] [CrossRef] [Green Version]
  89. Moura, Y.M.; Hilker, T.; Lyapustin, A.I.; Galvao, L.S.; Santos, J.R.; Anderson, L.O.; Sousa, C.H.R.; Arai, E. Seasonality and drought effects of Amazonian forests observed from multi-angle satellite data. Remote Sens. Environ. 2015, 171, 278–290. [Google Scholar] [CrossRef]
  90. Galvão, L.S.; Breunig, F.M.; Santos, J.R.; Moura, Y.M. View-illumination effects on hyperspectral vegetation indices in the Amazonian tropical forest. Int. J. Appl. Earth Obs. Geoinf. 2013, 21, 291–300. [Google Scholar] [CrossRef]
  91. Moura, Y.; Galvao, L.S.; Hilker, T.; Wu, J.; Saleska, S.; Amaral, C.H.; Nelson, B.W.; Lopes, A.P.; Wiedeman, K.K.; Prohaska, N.; et al. Spectral analysis of amazon canopy phenology during the dry season using a tower hyperspectral camera and MODIS observations. ISPRS J. Photogramm. Remote Sens. 2017, 131, 52–64. [Google Scholar] [CrossRef]
  92. Jensen, J.R. Sensoriamento Remoto Do Ambiente: Uma Perspectiva em Recursos Terrestres; Parêntese: São José dos Campos, Brazil, 2009; p. 598. [Google Scholar]
  93. Ponzoni, F.J.; Shimabukuro, Y.E.; Kuplich, T.M. Sensoriamento Remoto da Vegetação, 2nd ed.; Oficina de Textos: São Paulo, Brazil, 2012. [Google Scholar]
  94. Anderson, L.O.; Aragao, L.E.O.C.; Shimabikuro, Y.E.; Almeida, S.; Huete, A. Fraction images for monitoring intra-annual phenology of different vegetation physiognomies in Amazonian. Int. J. Remote Sens. 2011, 32, 387–408. [Google Scholar] [CrossRef]
  95. Maeda, E.E.; Heiskanen, J.; Aragao, L.E.O.C.; Rinne, J. Can MODIS EVI monitor ecosystem productivity in the Amazon rainforest? Geophys. Res. Lett. 2014, 41, 1–8. [Google Scholar] [CrossRef]
  96. Bi, J.; Knyazikhin, Y.; Choi, S.; Park, T.; Barichivich, J.; Ciais, P.; Fu, R.; Ganguly, S.; Hall, F.; Hilker, T.; et al. Sunlight mediated seasonality in canopy structure and photosynthetic activity of Amazonian rainforests. Environ. Res. Lett. 2015, 10, 64014. [Google Scholar] [CrossRef] [Green Version]
  97. Bi, J.; Myneni, R.; Lyapustin, A.; Wang, Y.; Park, T.; Chi, C.; Yan, K.; Knyazikhin, Y. Amazon Forests’ Response to Droughts: A Perspective from the MAIAC Product. Remote Sens. 2016, 8, 356. [Google Scholar] [CrossRef] [Green Version]
  98. Sousa, C.H.R.; Hilker, T.; Waring, R.; Moura, Y.M.; Lyapustin, A. Progress in Remote Sensing of Photosynthetic Activity over the Amazon Basin. Remote Sens. 2017, 9, 48. [Google Scholar] [CrossRef] [PubMed] [Green Version]
Figure 1. Location of study area. PSP = LBA permanent sub-plot, where were made the forest inventory; ROI = region of interest; Source: shapefile of the Rondonia state and Rebio Jaru from https://downloads.ibge.gov.br (accessed on 1 December 2021).
Remotesensing 14 01733 g001
Figure 2. Temporal pattern of variables for the study series, RJA site. (A) Precipitation in black and evapotranspiration in red; (B) Water table depth in black and soil moisture in red; (C) Net radiation in black and temperature in red; (D) SPI6 index; (E) Total litter; (F) Stem growth; (G) EVI index in black and long-term EVI index in red; (H) Gcc index in black and long-term Gcc index in red.
Remotesensing 14 01733 g002
Figure 3. Relationship between in situ and remote sensing data, RJA site. (A) EVI × Stem growth; (B) EVI (2000–2017) × Stem growth (2015–2017) monthly long-term average; (C) Gcc (2000–2017) × Stem growth (2015–2017) monthly long-term average; (D) Gcc × Stem growth.
Remotesensing 14 01733 g003
Figure 4. Relationship between EVI, Gcc indices and total litter, RJA site. (A) Gcc (2000–2017) × total litter (2016–2018), monthly long-term average; (B) Gcc × EVI (Sep. 2015–Dec. 2017); (C) Total litter (2016–2018) × EVI (2000–2017) monthly long-term average (D) Total litter (2016–2018) × EVI (2000–2017) monthly long-term average, with 3 months lag in EVI.
Remotesensing 14 01733 g004
Figure 5. πTLP of the species sampled by diameter (DBH). Threshold based on [38].
Remotesensing 14 01733 g005
Figure 6. P50 of species sampled in RJA and threshold based on [39].
Remotesensing 14 01733 g006
Figure 7. Relationship between DBH and HSM of species sampled in RJA. (A) Relationship of DBH and HSM of all measured trees; (B) Relationship of DBH and HSM excluding two outlier points.
Remotesensing 14 01733 g007
Figure 8. Seasonal pattern based on the historical average of the variables. Ppt = precipitation (NOAA 1983/2015); Etp = evapotranspiration (MOD16A2 2001/17); Gr = stem growth (RJA 2015/17); Total Litter (RJA 2016/18); EVI (MODIS/MAIAC 2000/17); Gcc (MODIS/MAIAC 2000/17).
Remotesensing 14 01733 g008
Figure 9. Scheme of plant water supply via water table (average monthly), precipitation (average monthly) and soil moisture (average monthly).
Remotesensing 14 01733 g009
Table 2. Phytosociological parameters of the species sampled.
IDSpeciesCanopy
Positions
FamilyLeaf PhenologyRdGIVI
36Astronium lecointei DuckeDCAnacardiaceaeEG0.791.281.11 1
254Astronium lecointei DuckeDCEG1.35
152Protium tenuifolium (Engl.) Engl.DCBurseraceaeEG0.23 11.300.22 1
151Protium nitidifolium (Cuatrec.) DalyDCEG0.200.750.52 1
168Tetragastris altíssima (Aubl.) SwartsUEG1.04 11.252.69 1
288Licania hypoleuca Benth.UChrysobalanaceaeEG0.400.370.32
498Licania sprucei (Hook.f.) FritschDCEG0.401.050.33
284Licania sprucei (Hook.f.) FritschU0.52
382Anamalocalyx uleanus (Pax & K.Hoffm.) DuckeUEuphorbiaceaeEG12.90.434.35 1
380Sagotia brachysepala (Mull. Arg.) R. SeccoUEG0.01 20.520.01 2
379Sagotia brachysepala (Mull. Arg.) R. SeccoU
147Copaifera multijuga HayneDCFabaceaeEG2.961.863.78 1
31Copaifera multijuga HayneDCEG0.85
24Dialium guianense (Aublet.) SandwithDCEG1.191.665.03 1
328Dipteryx magnifica DuckeDCSD0.201.620.41
183Dipteryx odorata (Aublet) Willd.DCSD2.15 10.976.45 1
20Macrolobium suaveolens BenthDCSD4.351.760.10 1
29Tachigalichrysophylla (Poepp.) Zarucchi & Herend.DCEG3.360.672.76
177Tachigali chrysophylla (Poepp.) Zarucchi & Herend.DCEG0.64
180Tachigali chrysophylla (Poepp.) Zarucchi & Herend.DCEG1.58
102Swartzia ingifolia DuckeDCSD0.201.530.16
144Sterculia duckei E.L. Taylor ex J.A.C. Silva&M.F.SilvaDCMalvaceaeSD0.201.240.29
182Lueheopsis rosea (Ducke) BurretUEG0.140.650.92
286Cariniana decandra DuckeULecythidaceaeEG0.591.135.22 1
161Eschweilera coriacea (DC.) S.A.MoriDC0.200.940.24
381Virola michelii HeckelUMyristicaceaeEG1.380.411.08
27Minquartia guianensis Aubl.UOlacaceaeEG1.581.172.06
167Minquartia guianensis Aubl.U1.10
03Minquartia guianensis Aubl.U1.12
137Pouteria egleri EymaUSapotaceaeEG1.000.651.17
32Pouteria durlandii (Standl.) BaehniUEG0.58 10.880.45
Total (n = 31)36.0531.2539.67
Where: Rd = relative density (%); IVI = importance value index (%); G = basal area (m2.ha−1) (measurements performed by this research); DC = dominant canopy; U = understory; EG = evergreen; SD = semideciduous. 1 [55]; 2 genus was considered to be of importance based on [56].
Table 3. πTLP and P50 by diameter class, RJA site.
Diameter ClassπTLP (MPa)P50 (MPa)
TreesAverageσTreesAverageσ
DBH 10–20 cmsp = 5−2.290.63sp = 3−1.5071.028
DBH 20–30 cmsp = 5−1.790.69sp = 2−2.7800.537
DBH 30–40 cmsp = 6−1.930.55sp = 4−4.4860.503
DBH > 40 cmsp = 6−1.670.53sp = 1−4.71-
Where: σ = standard deviation; sp = specimen.
Publisher’s Note: MDPI stays neutral with regard to jurisdictional claims in published maps and institutional affiliations.

