
Multiannual Seafloor Dynamics around a Subtidal Rocky Reef Habitat in the North Sea
by
 ,
,
Jasper J. L. Hoffmann
1,* ,
,
Rune Michaelis
2,
Finn Mielck
1,
Alexander Bartholomä
3 and
Lasse Sander
1 1
Alfred-Wegener-Institute, Helmholtz Centre for Polar and Marine Research, Wadden Sea Station, 25992 List, Germany
2
Lower Saxon Wadden Sea National Park Authority, 26382 Wilhelmshaven, Germany
3
Senckenberg am Meer, 26382 Wilhelmshaven, Germany
*
Author to whom correspondence should be addressed.
Remote Sens. 2022, 14(9), 2069; https://0-doi-org.brum.beds.ac.uk/10.3390/rs14092069
Submission received: 15 March 2022
/
Revised: 22 April 2022
/
Accepted: 23 April 2022
/
Published: 26 April 2022
(This article belongs to the Special Issue Multibeam Echosounder Measurements – Addressing Variability and Expanding the Horizon)
Abstract
:Rocky reefs provide complex structures in the otherwise largely sand-dominated coastal North Sea. Therefore, these reefs are highly important natural habitats for the functioning of coastal ecosystems, as they provide shelter, refuge and nursery grounds for various mobile and sessile species. In the North Sea, the spatial distribution of these habitats has been intensively investigated over recent years. However, these studies generally provide static accounts of the current state of these reef systems, but limited data exist on the temporal variations in sediment dynamics at and around natural rocky reefs. In this study, we provide observations from a multiannual time series of hydroacoustic seafloor surveys conducted at an isolated rocky reef in the North Sea. We use multibeam bathymetry and side-scan sonar backscatter data in combination with video observations, sediment sampling, and sub-bottom profiler data to assess the long-term variations of the rocky reef system. The reef is located in water depths between 11 and 17 m with an areal extent of ~0.5 km2 and is surrounded by mobile sands. The topography of the rocky reef appears to create a distinct hydrodynamic system that permits mobile sands to settle or move into bathymetrical deeper parts of the reef. Our results suggest a very dynamic system surrounding the reef with large scale scouring, sediment reworking and transport, while the shallower central part of the reef remains stable over time. We demonstrate the importance of hydrodynamics and current scouring around reefs for the local variability in seafloor properties over time. These small-scale dynamics are likewise reflected in the spatial distribution of sessile species, which are less abundant in proximity to mobile sands. The hydroacoustic mapping and monitoring of seafloor dynamics at higher spatial and temporal resolutions presents an important future direction in the study of valuable coastal habitats.
1. Introduction
Rocky reefs are highly important habitats for the southern North Sea. In contrast to widespread sand-dominated areas, their complex topography and stable location provide settling grounds and shelter for a variety of mobile and sessile species [1]. Due to the high biodiversity and the ecological significance of these structurally complex habitats, rocky reefs are protected under the European Habitats Directive (HD 92/43/EEC annex 1 1170—reef habitats). They describe geogenic reefs as “… hard compact substrata on solid and soft bottoms, which arise from the sea floor in the sublittoral and littoral zone”. These reefs are extensively present in, e.g., the British part of the North Sea, while exposed rocks or boulder accumulations are rare in the south-eastern and western part of the North Sea (Figure 1). They predominantly occur on the Sylt Outer Reef, Helgoland, Borkum Reef Ground, Cleaver Bank or the Texel Rough [2,3]. Apart from Helgoland, rocky reefs in the North Sea are generally associated with exposed morainal material [2] that is mostly covered by Holocene marine sand deposits. Often, these rocky reefs form isolated ‘islands’ which are surrounded by vast areas of relatively mobile sand. In general, we will use the term ‘rocky reef’ to describe dense accumulations of ‘cobbles’ (64–256 mm) and ‘boulders’ (256–4096 mm) [4] in combination with biological assemblages as defined in the ‘Interpretation Manual of European Union Habitats’ [5]. Furthermore, grain-size parameters refer to the international classification (ISO 14688-1:2018) and were determined after Folk and Ward [6].
Recent research mainly focused on hard substrate and boulder detection techniques [7,8,9,10], as well as habitat biodiversity and ecology [1,11,12,13,14,15,16,17]. The general distribution of rocky reef complexes in the North Sea is, therefore, relatively well known, while data on their spatial heterogeneity, their complex hydro- and sediment dynamics and their temporal variability remains poorly understood. The sediment dynamics around boulders and reefs are thereby of particular importance for the local epibenthic communities and habitats [16].
The thickness of the mobile sand layer around boulders, as well as the seabed morphology, give valuable insights into the prevailing sediment transport system [18,19]. Currents around objects on the seafloor generally lead to scour marks as a result of turbulent flow and subsequent sediment erosion [20,21]. Not only do rocky reefs create unique habitats, but also the sediment scours around the reef influence the benthic community composition on the seafloor [22]. Although hard bottom substrates are relatively stable over time, coastal reef habitats cannot generally be regarded as static and immobile but rather have to be considered as dynamic environments that are changing on various timescales [23,24].
We present data from one of the longest rocky reef monitoring programmes in the North Sea. The given time series of hydroacoustic data covers an area ~10 km offshore the island of Sylt, where a subtidal rocky reef is exposed and surrounded by vast areas of fine to coarse-grained sands (Figure 1). The aim of this study is to: (1) determine the stability and the long-term variation of an isolated rocky reef complex in the North Sea; (2) identify sediment processes that affect sediment dynamics and biological communities around the reef system; (3) provide a geomorphological characterisation; and (4) investigate the spatial distribution and variation of epibenthic communities within the rocky reef complex.
2. Research Area
The North Sea is a shallow shelf sea between the British Isles, the European mainland and Scandinavia. The general geomorphology and substrates that dominate the modern seafloor of the German Bight, as part of the southern North Sea, are the product of a series of repeated glaciations, sea-level low stands and marine stages over the Pleistocene period. The Elsterian and Saalian glaciations built up large morainal complexes, with the latter forming the large-scale geomorphology of areas such as the Sylt Outer Reef, Borkum Reef Ground or the Texel Rough [26]. The ice coverage of the Weichselian glaciation did not reach the southern North Sea [27]. The corresponding global sea-level drop of approximately 120 m subaerially exposed large areas of the North Sea and shifted the coastline about 600 km to the West [28]. During this time, large-scale structures such as the Paleo Elbe Valley formed on the exposed seafloor [29]. The present-day seafloor sediments of the German Bight mainly consist of reworked sands of the Early Holocene, Pleistocene and Tertiary age overlying the morainal deposits [30,31]. These sands are periodically moved by semidiurnal near-bed tidal currents reaching velocities of 75 to 125 cm s−1 [32] and are regularly remobilized by storm-induced waves [33].
The island of Sylt is the westernmost and thus most exposed of the North Frisian Islands. Westerly winds and waves are dominant in the region [34]. The island consists of a Saalian geest core and experienced an estimated postglacial retreat of ~1.25 m y−1. This coastal erosion supplied much of the present-day seafloor sediment west of Sylt [31,35]. Morainal material in the west of Sylt is still present (e.g., Amrum Bank), but is mostly covered by marine sands. The typically east to west oriented sorted bedform pattern offshore Sylt [36] reflects the large-scale shore parallel tidal current regime. Storm surges with high wave impact mobilise the sediments and can temporally modify the characteristic of the bedforms west of Sylt [37].
The focus area of this study is located about ~10 km offshore from Sylt, where morainal material, including cobbles to large boulders, is exposed in water depths of 11–17 m, that according to Köster [35], was subaerially exposed until about 7000 year ago when it was flooded. Parts of this rocky reef complex were detected in a regional side-scan survey in 2008 and intensively monitored from 2016 onwards. According to Zeiler et al. [33], the general sediment transport in this region is towards the north and the reef is situated in an area of sediment depletion.
3. Methods
We used an interdisciplinary methodological approach that included a range of hydroacoustic devices with various frequencies in combination with camera investigations and seafloor sampling to achieve good regional coverage at the highest possible resolutions (Table 1). The studied subtidal rocky reef complex was surveyed at yearly intervals between 2016 and 2021, while a baseline was provided by data from an earlier regional SSS survey conducted in 2008 (Table 1). Due to weather constraints, some datasets were less noise affected than others, and sometimes data acquisition had to be postponed if needed.
3.1. Multibeam Echo Sounding (MBES)
Repeated multibeam bathymetry surveys were acquired using a hull-mounted dual-head shallow water multibeam system (ELAC Sonar (Kiel, Germany) Sea Beam 1000, 180 kHz) with a total of 126 beams per ping. The system was combined with a Coda Octopus F180 motion sensor and 2 DGPS antennas for accurate positioning. With a maximum swath width of 153° and a line spacing of 50 m, good coverage and overlap were achieved for the given water depth of the research area. The raw data were imported and post-processed using QPS Qimera 2.1.1 (Zeist, The Netherlands) multibeam data processing software. We manually cleaned the data for erroneous soundings. Sound velocity profiles were regularly collected using a Sea and Sun Technology 48M CTD (Trappenkamp, Germany). The sound velocity profiles were assigned to the multibeam files according to their time of acquisition. A final grid resolution of 1.5 m was achieved. All bathymetric datasets (2016–2021) were tide corrected using backwards modelled sea surface height data as described in Brüning et al. [38], which were provided by the Federal Maritime and Hydrographic Agency (Bundesamt für Seeschifffahrt und Hydrographie (BSH), Hamburg, Germany).
3.2. Side-Scan Sonar
In order to identify smaller structures (e.g., boulders, ripples) and to support the interpretation of sediment distribution around the rocky reef, we used 2 different side-scan sonar systems with different ranges and frequencies (Table 1). All data were acquired with a constant ship speed of 5 kn (2.6 m s−1) over ground to ensure a sufficient and regular ping spacing and along-track resolution. The survey data were recorded in the corresponding EdgeTech and YellowFin software packages and post-processed using SonarWiz 7 (Chesapeake Technology, Mountain View, CA, USA). We manually corrected the position of the towfish using the tow cable length as well as bathymetrical structures from the MBES data as references. Occasional misalignment between the heading of the towfish and the ship track (due to sideward currents) was similarly corrected for using bathymetrical structures.
3.2.1. Imagenex ‘YellowFin’
We operated the Imagenex YellowFin side-scan sonar at a centre frequency of 330 kHz with a range between 50 and 80 m. The 2 transducers had a beamwidth of 1.8° with an opening angle of 60° and were tilted downwards by 20°. The acquired data were of good quality and were stored in an .xtf file format. The across track resolution of the data was about 0.1 m. All mosaics were exported at this resolution while the data were interpolated between individual pings (along-track).
3.2.2. EdgeTech 4200 MP
Due to side-scan sonar availability, we had to swap the side-scan sonars for 1 year (2020) and used an Edgetech 4200 MP system. The chirp signal bandwidth was set to 234–247 kHz and the received signals were stored in a .jsf file format. The vertical beamwidth of the system was 50° with a horizontal beamwidth of 0.28°. At 300 kHz, the across track resolution was up to 3 cm. The EdgeTech was towed with a constant cable length similar to the other SSS at around 7 m above the seafloor. The range of the EdgeTech 4200MP was set to 60 m on each side.
3.3. Sub-Bottom Profiler
Information on subsurface sedimentary structures was acquired using an Innomar SES-2000 “light”. This parametric sub-bottom profiler operates with a primary frequency band of 85–115 kHz to create secondary low frequencies between 6–10 kHz. All data were depth converted using a constant sound velocity of 1500 m s−1. We used this device to obtain information about the sediment thickness covering the Pleistocene morainal material.
3.4. Camera
We used an underwater camera system (drop-cam) to obtain ground truth hydroacoustic information on the reef and the surrounding sediments. The video footage was additionally used to analyse sessile taxa living on the rocky reef. The system consists of 2 ahead-oriented cameras, a tail fin to passively rotate the system into the prevailing currents, four artificial light sources and a laser scaler for size reference. Survey speeds of ~1 kn (~0.5 m s−1) against the prevailing current ensured good manoeuvrability of the vessel. The online video feed enabled us to tow the underwater video system at a constant height of about 1 m above the seafloor, while the robust caging also allowed occasional drops onto the seafloor to obtain stationary footage. The ship’s DGPS system assured an accurate positioning of the camera on the seafloor.
To assess the effect of sediment transport on the sessile taxa richness, underwater video transects acquired in 2016 were investigated. Underwater videos were first transformed into still images and subsequently analysed for the presence of sessile taxa according to the method described in Michaelis et al. [16]. To calculate the distance of each investigated still image to the nearest sandy area within or around the reef, polygons of sandy areas were manually created on the side-scan sonar mosaic (acquired in 2016) using QGIS (version 3.16). The distance was then calculated using the plugin package “NNJoin” (version 3.1.3) and we subsequently calculated a linear regression model using the “lm”-function in R (version 4.1.2).
3.5. Grab Sampling
Seafloor sediment samples were taken to verify the acoustic response of the seafloor. In total, we collected 13 sediment samples using a HELCOM Van Veen grab sampler. The samples were scraped off the upper 2 cm of the sediment surface in the grab.
Prior to analysis, shell fragments (carbonates) and organic matter were removed from the samples with acetic acid and hydrogen peroxide. The grain size distribution of each sample was subsequently analysed using a CILAS 1180 laser-diffraction particle analyser (Cilas, Orleans, France). This instrument had a range resolution of 0.1 Phi with a bandwidth of 14.6–1.4 Phi (0.04–2500 µm). Grain size statistics were calculated in ‘Gradistat’ after Blott and Pye [39].
4. Results
4.1. General Characteristics and Habitat Properties
In the modern high-resolution side-scan sonar data, the exposed boulders can be clearly distinguished from the surrounding mobile fine- to coarse-grained sands (Figure 2). The general area of exposed rocks roughly aligns in a south-west to north-east orientation. In total, an area of nearly 0.5 km2 consisted of exposed cobbles and boulders. Within the general reef structure, small (up to 3000 m2) sandy patches occurred where mollusc shells, especially razor clams (Ensis spec.), accumulated. The grain size analysis showed a good correlation to the sediment properties inferred from the grayscale intensity of the side-scan mosaic. Fine sands correlated to a weak backscattering seafloor and lighter grey values in the mosaic, while a rougher and coarser-grained seafloor showed a strong backscatter characteristic and is shown in darker grey values. Two sediment samples were taken from the sandy patches within the rocky reef area in the north and south. We found the smallest grain-size distribution of the study area within the rocky reef, where small particles could settle and were protected in between the boulders. Very fine sands with silt and clay contents of over 25% accumulated between the cobbles and boulders in the centre of the rocky reef. Coarse- to very coarse-grained sands with up to 6% of very fine gravels were sampled in the south-east of the reef where they correlated with deeper bathymetrical depth. Fine and medium sands were present in between the coarse areas in the south-east and cover all of the seafloor north and west of the rocky reef.
While the area north-west of the rocky reef consisted of homogeneously distributed fine sands that covered the morainal material, the seafloor south-east of the reef was composed of highly variable grain sizes and heterogeneous material (Figure 2). Large bodies of coarse- to very coarse-grained sands stretched out from the boulder field towards the south-east. This trend was similarly visible in the bathymetric data, where the seafloor was comparatively flat without any morphology in the north-west of the rocky reef, in contrast to morphological highs and lows in the south-east (Figure 1). The coarser-grained sands correspond to bathymetrical lows, which are situated about 60 cm below the surrounding fine sands. The reef area spans over water depth between 11 and 17 m. The general water depth increases from the sides of the study area towards the rocky reef. The reef structure itself shows central highs, where boulders reach water depth of less than 12 m. These elevated parts are generally surrounded by the deepest parts of the study area, which extend down to ~17 m (Figure 1).
4.2. Temporal Variability
Despite differences in the quality of the survey data, the general distribution of sediment classes and structures remained visible in both the SSS and MBES data over the time period between 2016 and 2021. The morphology and backscatter characteristics of the central part of the reef were generally stable over the observed time period. The sandy and shelly patches within the reef showed only small variations in shape and size. While the central part of the reef appeared to be relatively stable over time, the edges and sides experienced temporal variations in sediment coverage. Especially the interaction between coarse- and fine-grained sands and the resulting morphology in the south-eastern part of the research area appeared particularly dynamic (Figure 3 and Figure 4). The upper part of Figure 3 and Figure 4 shows side-scan backscatter data, where darker grey values are indicative of coarse-grained sands and boulder accumulations. Individual boulders as well as accumulations of cobbles and boulders, can be clearly identified. The lower part of the figures displays the corresponding bathymetry. Figure 3 is located in the eastern part of the rocky reef, and while the hydroacoustic data from 2016 shows north to south oriented stretch of coarser material, an east to west elongated patch of coarse sands and deeper bathymetrical depth developed over time. Only minor changes in sediment coverage and bathymetry occurred between the years 2016 and 2018. Between the years 2018 and 2021, a distinct east-west trending depression in the seafloor was incised up to 70 cm into the surrounding fine-grained material and developed a length of about 110 m with a width of 25 m.
On the western side of the reef, north to south oriented stretch of coarse-grained material with several boulder accumulations is apparent in the hydroacoustic datasets of 2016 (Figure 4). This elongated patch of high backscatter intensities and deeper bathymetry shows a connection to the main reef structure at its northern end in 2016. In 2017, the elongated patch was already separated from the main reef and became smaller and smaller over time. The largest changes in sediment coverage occurred between the years 2018 and 2019, where large areas of the north to south-oriented coarse-grained patch disappeared. Additionally, the area covered by fine sand in between the main reef in the east and the isolated patch increases with time (as indicated by red scale line in Figure 4).
4.3. Mobile Sediment
Around the reef complex, we used sub-bottom profiler data to estimate sediment thickness above the partly exposed moraine deposits. The top of the morainal material is generally well visible in most profiles, although the reflection geometry is more ambiguous beneath the coarse-grained sands in the south of the research area. The surface of the moraine is characterised by strong but sometimes discontinuous reflections in the sub-bottom profiler data. The reflections from the seafloor are highest in areas where sands are dominant on the seafloor (Figure 5). In areas where the rocky reef material is exposed, seafloor reflections are generally lower and more vertically scattered. We do not observe any internal reflections of the rocky reef complex. The morphology of the moraine is most pronounced in areas where the moraine is exposed to sea seafloor. The relief of the presently buried parts of the moraine shows less vertical variation.
4.4. Taxa Richness and Distance to Sand Patches
In total, 415 still images were investigated for the presence of sessile taxa (Figure 6). The average number of sessile taxa per still image was 3.3, with all still images showing at least one and a maximum of six sessile taxa. These were composed of anthozoans, hydrozoans, polychaetes, bryozoans and a turf consisting of bryozoans or hydrozoans that could not be further identified. The average distance to a sand patch was 26.9 m (±25.6 m standard deviation). Some of the investigated stones observed on the still images were completely located within a sand patch, whilst others were located at the border or at a maximum of 120 m away from a sand patch. The linear regression model showed a highly significant but weak positive correlation between the taxa richness and the distance to a sand package (p < 0.001, R2 = 0.13).
5. Discussion
5.1. Temporal Variation
We find that the central parts of the rocky reef show no geomorphological variations over the observed time period. While this was to be expected in areas of cobble- and boulder-sized rock accumulations, the sediment dynamics of the Holocene sand cover on top of the outer sides of the morainal material were surprisingly energetic but unidirectional. Although fine sands are distributed homogeneously and flat on top of the moraine in the north-west of the reef, the south-eastern part of the reef appears highly dynamic with changing sediment patterns, sediment types and topography. We observe a slow advance of sand accumulating on top of the reef in the north-western part while new boulders and coarse materials are scoured free in the south-east (Figure 3 and Figure 4). In the north-western part, scour holes that exposed the morainal material in 2016 seem to be progressively covered and infilled by mobile sands (Figure 4). The opposite seems to occur on the eastern side, where current scouring seems to form an east to west oriented elongated depression, where morainal material becomes increasingly exposed. It seems likely that the exposure of previously sand-covered boulders initiates additional bottom current scouring, which exposes additional coarse-grained material. This process appears attenuated by the low morphological changes observed in the presently sand-covered areas of the moraine as observed in the sub-bottom profiler data. In contrast to less morphologically pronounced rocky reef habitats, where large parts of the reef are buried under sand and subsequently exposed on seasonal scales [40], we do not observe a seasonal but rather a long-term trend in sediment coverage.
Coarse-grained sands are solely observed in the south-eastern part of the reef. The sedimentary patterns in this region suggest that the reef induces a turbulent hydrodynamic system. Modelled tidal currents for this region show a constant laevorotary/anti-clockwise rotating current regime with persistent velocities between 25 and 30 cm s−1 [41]. However, the smaller-scaled current pattern will locally be altered and accelerated due to the reef’s morphology, which has been shown at a rocky reef near Helgoland [18]. However, the locally complex current pattern cannot explain the unidirectional sediment transport and scouring we observe. We, therefore, assume that similar to the storm-induced roughly north to south oriented ripples described by Mielck et al. [37] offshore Sylt, sediment redistribution around the reef occurs mainly due to waves and storm events. With the prevailing westerly winds and waves and with increasing turbulence, sediment transport directed towards the west seems likely. This is also indicated by the highly variable grain size distribution and strong morphology on the south-eastern side of the reef. In the case of a westward-oriented flow regime, a more turbulent and chaotic flow would be predicted on the lee side of the reef.
The coarse sands that extend from the reef towards the south-west seem to be reworked materials from the main outcropping moraine that is scoured out and transported towards the south-east of the study area. Because the tidal current around Sylt is generally rather shore-parallel orientated, only the wave direction perpendicular to the shore can explain the sediment transport towards the coast. A larger bedform pattern should reflect this after storm surges. Although the rocky reef complex investigated here is situated in an area of sediment depletion, where the mobile sand is thought to move north-westward [33], we find that sands are moving rather eastward in a turbulent hydrodynamic environment.
5.2. Morphology of the Reef
Scouring around artificial and natural reef structures plays an important role in local habitats and biological communities [22]. Scour marks are often used to infer the peak tidal flow direction of an area and can give indications about sediment transport [20]. The rocky reef studied here extends over an area of 0.5 km2, and generally, the sands surrounding the reef are situated at a shallower bathymetrical depth the further away from the rocky reef they occur. We analysed the bathymetry towards the topographic position of the reef compared to the surrounding sand-covered area. Therefore, the rocky reef areas, including a 50 m buffer, were removed from the bathymetry and subsequently interpolated using a spline interpolation. The resulting bathymetry was subtracted from the original, which provides an indication of the topographic position in relation to the surrounding sands (Figure 7). We defined the normal sediment height (NSH) as the general bathymetry with the removed and subsequently splined interpolated rocky reef.
Of the 0.5 km2 of exposed boulder accumulations, only ~24% are situated more than 20 cm above the interpolated sediment height across the reef. A total of 20% of the reef is within 20 cm above or below the NSH while the remaining 57% of the reef area is situated more than 20 cm below the NSH. This indicates that the majority of the reef was exposed or still is exposed due to bottom current scouring and removal of the covering mobile sand layer. In some areas, the rocky reef is exposed up to 2.5 m below the surrounding sediments, indicating removal or non-deposition of mobile sands in these troughs. It also suggests that the extent of the uncovered part of the rocky reef is mainly dependent on the hydrodynamics surrounding it. Patches of fine sands that have accumulated within the reef seem to be rather stationary and stable habitats. Sand “intrusions” with a connection to the surrounding sediment body seem to be more mobile and dynamic.
The central part of the reef, with the bulk of the high reaching peaks, the reef seems to be roughly NNE-SSW oriented (Figure 7). While scouring in the northern part seems to occur towards the east of the highest parts of the reef, the southern part appears to be scoured free from mobile sands more towards the west. This could partly be the result of smaller peaks of elevated cobble and boulder accumulations located in the south-west of the main reef structure.
We tracked the surface of outcropping moraine further beneath the surrounding sand using a sub-bottom profiler. The thin sediment coverage of often less than 1 m in the vicinity of the reef highlights the potential for additional exposure of the morainal material through the bottom current scouring of the mobile sands. The sediment cover slightly increases towards the northern part, while the southern part of the study area has a thinner sediment cover.
The morphology of the buried parts of the moraine is less pronounced compared to the exposed reef. It seems likely that the more even surface of the moraine with less morphology is subject to less sediment scouring and is, therefore, covered by Holocene sands. The sub-bottom profiling data shows that sand covering the moraine in this area generally does not exceed 2 m. This agrees with previous measurements from Zeiler et al. [33] as well as with sediment cores drilled a few kilometres offshore Sylt by Hoffmann [42].
5.3. Ecology
The distance to a sandy patch appears to influence the sessile taxa richness on the hard substrates (Figure 8). This could be an effect of the high sediment turnover rate that thus limits the growth or presence of sessile species [16]. The further away a hard substrate is located from a source of mobile sand, the higher the number of sessile taxa on the hard substrates. However, the correlation was only weak, which indicates that there are other important factors regulating the number of sessile taxa. Michaelis et al. [16] showed that the size of hard substrates plays an important role. Boulders are less prone to become completely covered by mobile sediments than cobbles. Hence, the taxa richness on boulders and large boulders can be higher, even though they might be located close or within a mobile sand package. It was further observed that the sessile taxa richness can be high at places with a dense aggregation of large boulders, boulders and intermediate cobbles. This might be caused by a shadowing effect against sand abrasion and enables the growth of different taxa even on cobbles, independent of the distance to a mobile sand patch. However, these factors could not be implemented in the analysis of the underwater videos in this study. In a spatial investigation of benthic communities across an isolated rocky reef in the Baltic sea, Beisiegel et al. [43] showed that the inner reef attracts more fish and higher coverage of sessile species. In contrast to observations from Beisiegel et al. [43], we found that taxa richness is rather dependent on the distance to mobile sand than on the centre of the reef complex.
The number of taxa observed in the videos is comparatively low due to the limits of the chosen underwater video method. Further investigations should be performed by divers to derive a better estimation of the taxa richness as a function of the size and aggregation of hard substrates. Dive transects would additionally be useful for repeated investigations of the same area, which proves difficult using tethered drop cameras.
6. Conclusions
The presented multiannual time series of hydroacoustic surveys facilitates a detailed description of a rocky reef complex in the North Sea. We show that rocky reefs, as marine landforms, have an influence on the local hydrodynamics and feedback, influencing the sediment distribution in the vicinity of the reef. The central main reef structure remains stable over time. It is the dynamic outer part, though, which seems to be affected by oceanic turbulence induced by the topography of the reef itself, which reveals sediment transport mechanisms that affect both the sessile taxa on the reef as well as the sediment composition surrounding it. Although the majority of the rocky reef is situated bathymetrically beneath the surrounding mobile sands, bottom current scouring inhibits the sand from covering low-lying parts of the reef. The reefs’ geomorphology is most pronounced in the areas where it is exposed on the seafloor, while the currently buried parts show only minor vertical variations in the depth of the underlying moraine surface.
In this study, we demonstrate the importance and value of morphological investigations and long-term hydroacoustic monitoring programs for isolated reef systems to better understand their development over time. The presented sediment dynamics around rocky reef habitats should be considered in the designation of protected areas and implemented in future monitoring concepts.
Author Contributions
Conceptualization, J.J.L.H. and L.S.; methodology, J.J.L.H., F.M. and R.M.; software, J.J.L.H. and R.M.; formal analysis, J.J.L.H. and A.B.; investigation, J.J.L.H., F.M. and R.M.; resources, F.M. and L.S.; writing—original draft preparation, J.J.L.H., L.S. and R.M.; writing—review and editing, J.J.L.H., R.M., A.B. and L.S.; visualization, J.J.L.H.; supervision, L.S. and A.B.; project administration, L.S. and A.B. All authors have read and agreed to the published version of the manuscript.
Funding
Funding for this project was received through the BMBF-funded ‘DAM pilot mission: Exclusion of mobile bottom-contact fishing in marine protected areas of the German EEZ of the North Sea and Baltic Sea’ [Grant no. 03F0847A].
Data Availability Statement
The entire hydroacoustic data and underwater videos as well as the grab sample analysis will be available on pangea.de and can be requested at [email protected].
Acknowledgments
We wish to thank Valentin Hildebrand and the crew of the research vessel Mya II for their excellent support and are further grateful for the valuable work of all colleagues deployed in field campaigns and laboratory analyses. We are thankful to the German Federal Maritime and Hydrographic Agency (BSH) for providing sea surface height data. We acknowledge support by the Open Access Publication Funds of Alfred-Wegener-Institut Helmholtz-Zentrum für Polar- und Meeresforschung.
Conflicts of Interest
The authors declare no conflict of interest.
References
- Osman, R.W. The Establishment and Development of a Marine Epifaunal Community. Ecol. Monogr. 1977, 47, 37–63. [Google Scholar] [CrossRef] [Green Version]
- Veenstra, H.J. Gravels of the southern North Sea. Mar. Geol. 1969, 7, 449–464. [Google Scholar] [CrossRef]
- Figge, K. Sedimentverteilung in der Deutschen Bucht; Deutsches Hydrographisches Institut: Hamburg, Germany, 1981. [Google Scholar]
- Wentworth, C.K. A Scale of Grade and Class Terms for Clastic Sediments. J. Geol. 1922, 30, 377–392. [Google Scholar] [CrossRef]
- European-Commission. Interpretation Manual of European Union Habitats. 2007. Available online: https://ec.europa.eu/environment/nature/legislation/habitatsdirective/docs/2007_07_im.pdf (accessed on 14 March 2022).
- Folk, R.L.; Ward, W.C. Brazos River bar [Texas]; a study in the significance of grain size parameters. J. Sediment. Res. 1957, 27, 3–26. [Google Scholar] [CrossRef]
- Papenmeier, S.; Hass, C. Detection of stones in marine habitats combining simultaneous hydroacoustic surveys. Geosciences 2018, 8, 279. [Google Scholar] [CrossRef] [Green Version]
- Feldens, P.; Darr, A.; Feldens, A.; Tauber, F. Detection of Boulders in Side Scan Sonar Mosaics by a Neural Network. Geosciences 2019, 9, 159. [Google Scholar] [CrossRef] [Green Version]
- Michaelis, R.; Hass, C.; Papenmeier, S.; Wiltshire, K.H. Automated stone detection on side-scan sonar mosaics using haar-like features. Geosciences 2019, 9, 216. [Google Scholar] [CrossRef] [Green Version]
- Diesing, M.; Green, S.L.; Stephens, D.; Lark, R.M.; Stewart, H.A.; Dove, D. Mapping seabed sediments: Comparison of manual, geostatistical, object-based image analysis and machine learning approaches. Cont. Shelf Res. 2014, 84, 107–119. [Google Scholar] [CrossRef] [Green Version]
- Beisiegel, K.; Darr, A.; Gogina, M.; Zettler, M.L. Benefits and shortcomings of non-destructive benthic imagery for monitoring hard-bottom habitats. Mar. Pollut. Bull. 2017, 121, 5–15. [Google Scholar] [CrossRef]
- Beisiegel, K.; Darr, A.; Zettler, M.L.; Friedland, R.; Gräwe, U.; Gogina, M. Spatial variability in subtidal hard substrate assemblages across horizontal and vertical gradients: A multi-scale approach using seafloor imaging. Mar. Ecol. Prog. Ser. 2020, 633, 23–36. [Google Scholar] [CrossRef]
- Kühne, S.; Rachor, E. The macrofauna of a stony sand area in the German Bight (North Sea). Helgol. Meeresunters. 1996, 50, 433–452. [Google Scholar] [CrossRef] [Green Version]
- Konar, B.; Iken, K. Competitive dominance among sessile marine organisms in a high Arctic boulder community. Polar Biol. 2005, 29, 61–64. [Google Scholar] [CrossRef]
- Coolen, J.W.P.; Bos, O.G.; Glorius, S.; Lengkeek, W.; Cuperus, J.; van der Weide, B.; Agüera, A. Reefs, sand and reef-like sand: A comparison of the benthic biodiversity of habitats in the Dutch Borkum Reef Grounds. J. Sea Res. 2015, 103, 84–92. [Google Scholar] [CrossRef]
- Michaelis, R.; Hass, C.; Mielck, F.; Papenmeier, S.; Sander, L.; Ebbe, B.; Gutow, L.; Wiltshire, K.H. Hard-substrate habitats in the German Bight (South-Eastern North Sea) observed using drift videos. J. Sea Res. 2019, 144, 78–84. [Google Scholar] [CrossRef]
- Michaelis, R.; Hass, C.; Mielck, F.; Papenmeier, S.; Sander, L.; Gutow, L.; Wiltshire, K.H. Epibenthic assemblages of hard-substrate habitats in the German Bight (south-eastern North Sea) described using drift videos. Cont. Shelf Res. 2019, 175, 30–41. [Google Scholar] [CrossRef]
- Bartholomä, A.; Capperucci, R.M.; Becker, L.; Coers, S.I.I.; Battershill, C.N. Hydrodynamics and hydroacoustic mapping of a benthic seafloor in a coarse grain habitat of the German Bight. Geo-Mar. Lett. 2020, 40, 183–195. [Google Scholar] [CrossRef]
- Galvez, D.S.; Papenmeier, S.; Hass, C.; Bartholomae, A.; Fofonova, V.; Wiltshire, K.H. Detecting shifts of submarine sediment boundaries using side-scan mosaics and GIS analyses. Mar. Geol. 2020, 430, 106343. [Google Scholar] [CrossRef]
- Caston, G.F. Wreck marks: Indicators of net sand transport. Mar. Geol. 1979, 33, 193–204. [Google Scholar] [CrossRef]
- Reineck, H.-E.; Singh, I.B. Scour Marks. In Depositional Sedimentary Environments; Springer: Berlin/Heidelberg, Germany, 1973; pp. 64–68. [Google Scholar]
- Callaway, A.; Smyth, J.; Brown, C.J.; Quinn, R.; Service, M.; Long, D. The impact of scour processes on a smothered reef system in the Irish Sea. Estuar. Coast. Shelf Sci. 2009, 84, 409–418. [Google Scholar] [CrossRef]
- Von Rönn, G.A.; Krämer, K.; Franz, M.; Schwarzer, K.; Reimers, H.-C.; Winter, C. Dynamics of Stone Habitats in Coastal Waters of the Southwestern Baltic Sea (Hohwacht Bay). Geosciences 2021, 11, 171. [Google Scholar] [CrossRef]
- Schrottke, K.; Schwarzer, K.; Fröhle, P. Mobility and transport directions of residual sediments on abrasion platforms in front of active cliffs (Southwestern Baltic Sea). J. Coast. Res. 2006, I, 459–464. [Google Scholar]
- BSH Meeresboden DGM. Available online: http://www.geoseaportal.de/ (accessed on 8 May 2020).
- Schwarzer, K.; Ricklefs, K.; Bartholomä, A.; Zeiler, M. Geological development of the North Sea and the Baltic Sea. Die Küste 2008, 74, 1–17. [Google Scholar]
- Ehlers, J.; Ehlers, J.; Gibbard, P.L.; Hughes, P.D. Quaternary Glaciations-Extent and Chronology: A Closer Look; Elsevier: Amsterdam, The Netherlands, 2011; Volume 15, ISBN 0444534474. [Google Scholar]
- Streif, H.-J. Nordsee und Küstenlandschaft-Beispiel einer dynamischen Landschaftsentwicklung. Nat. und Landsch. Zwischen Küste und Harz 2002, 20, 134–149. [Google Scholar]
- Papenmeier, S.; Hass, C. Revisiting the paleo elbe valley: Reconstruction of the holocene, sedimentary development on basis of high-resolution grain size data and shallow seismics. Geosciences 2020, 10, 505. [Google Scholar] [CrossRef]
- Hoselmann, C.; Streif, H. Mass balance study of Holocene sediment accumulation on the Lower Saxony coastal region. Z. Dtsch. Geol. Ges. 1997, 148, 431–445. [Google Scholar] [CrossRef]
- Ahrendt, K.; Tabat, W. Ein Vierteljahrhundert sedimentologische Forschung vor der Küste Sylts/Deutsche Bucht. Meyniana 1994, 46, 11–36. [Google Scholar]
- Mittelstaedt, E.; Lange, W.; Soetje, K.C. Die Strömungen der Deutschen Bucht; Deutsches Hydrographisches Institut: Hamburg, Germany, 1983; p. 141. [Google Scholar]
- Zeiler, M.; Schulz-Ohlberg, J.; Figge, K. Mobile sand deposits and shoreface sediment dynamics in the inner German Bight (North Sea). Mar. Geol. 2000, 170, 363–380. [Google Scholar] [CrossRef]
- Ahrendt, K. Expected effect of climate change on Sylt island: Results from a multidisciplinary German project. Clim. Res. 2001, 18, 141–146. [Google Scholar] [CrossRef]
- Köster, R. Dreidimensionale Kartierung des Seegrundes vor den nordfriesischen Inseln. In DFG Forschungsber. “Sandbewegung im Küstenraum”; DFG: Bonn, Germany, 1979; pp. 146–168. [Google Scholar]
- Murray, A.B.; Thieler, E.R. A new hypothesis and exploratory model for the formation of large-scale inner-shelf sediment sorting and “rippled scour depressions”. Cont. Shelf Res. 2004, 24, 295–315. [Google Scholar] [CrossRef]
- Mielck, F.; Holler, P.; Bürk, D.; Hass, C. Interannual variability of sorted bedforms in the coastal German Bight (SE North Sea). Cont. Shelf Res. 2015, 111, 31–41. [Google Scholar] [CrossRef]
- Brüning, T.; Li, X.; Schwichtenberg, F.; Lorkowski, I. An operational, assimilative model system for hydrodynamic and biogeochemical applications for German coastal waters. Hydrogr. Nachr. 2021, 118, 6–15. [Google Scholar] [CrossRef]
- Blott, S.J.; Pye, K. GRADISTAT: A grain size distribution and statistics package for the analysis of unconsolidated sediments. Earth Surf. Process. Landf. 2001, 26, 1237–1248. [Google Scholar] [CrossRef]
- Figurski, J.D.; Freiwald, J.; Lonhart, S.I.; Storlazzi, C.D. Seasonal sediment dynamics shape temperate bedrock reef communities. Mar. Ecol. Prog. Ser. 2016, 552, 19–29. [Google Scholar] [CrossRef] [Green Version]
- Dick, S. Gezeitenströmungen um Sylt Numerische Untersuchungen zur halbtägigen Hauptmondtide (M2). Dtsch. Hydrogr. Z. 1987, 40, 25–44. [Google Scholar] [CrossRef]
- Hoffmann, D. Zur Geologie des Seegebietes westlich von Sylt. Meyniana 1971, 21, 25–31. [Google Scholar]
- Beisiegel, K.; Tauber, F.; Gogina, M.; Zettler, M.L.; Darr, A. The potential exceptional role of a small Baltic boulder reef as a solitary habitat in a sea of mud. Aquat. Conserv. Mar. Freshw. Ecosyst. 2019, 29, 321–328. [Google Scholar] [CrossRef]
Figure 1.
(A): Bathymetry of the German North Sea (adapted with permission from [25]) with gravelly and stony areas in black after Figge [3] and the location of the working area (in red). (B): Bathymetric overview of the study area ~10 km offshore the island of Sylt.

Figure 2.
Side-scan sonar image of the working area (2016) with sediment grain size analysis of Van Veen grab sampler. The area of boulder accumulations is delineated in orange.
Figure 2.
Side-scan sonar image of the working area (2016) with sediment grain size analysis of Van Veen grab sampler. The area of boulder accumulations is delineated in orange.

Figure 3.
Closeup of side-scan backscatter (top) and multibeam bathymetry (bottom). The east side of the working area shows the migration of sand and the scouring around newly exposed boulders over a six-year time span.
Figure 3.
Closeup of side-scan backscatter (top) and multibeam bathymetry (bottom). The east side of the working area shows the migration of sand and the scouring around newly exposed boulders over a six-year time span.

Figure 4.
Closeup of side-scan backscatter (top) and multibeam bathymetry (bottom) on the west side of the working area show how previously exposed reef becomes increasingly covered with sand.
Figure 4.
Closeup of side-scan backscatter (top) and multibeam bathymetry (bottom) on the west side of the working area show how previously exposed reef becomes increasingly covered with sand.

Figure 5.
Sub-bottom profiler track across the study area (Location in Figure 1). The thickness of the mobile sand layer on top of the morainal material (indicated by the dashed line) in the area rarely exceeds 2 m.
Figure 5.
Sub-bottom profiler track across the study area (Location in Figure 1). The thickness of the mobile sand layer on top of the morainal material (indicated by the dashed line) in the area rarely exceeds 2 m.

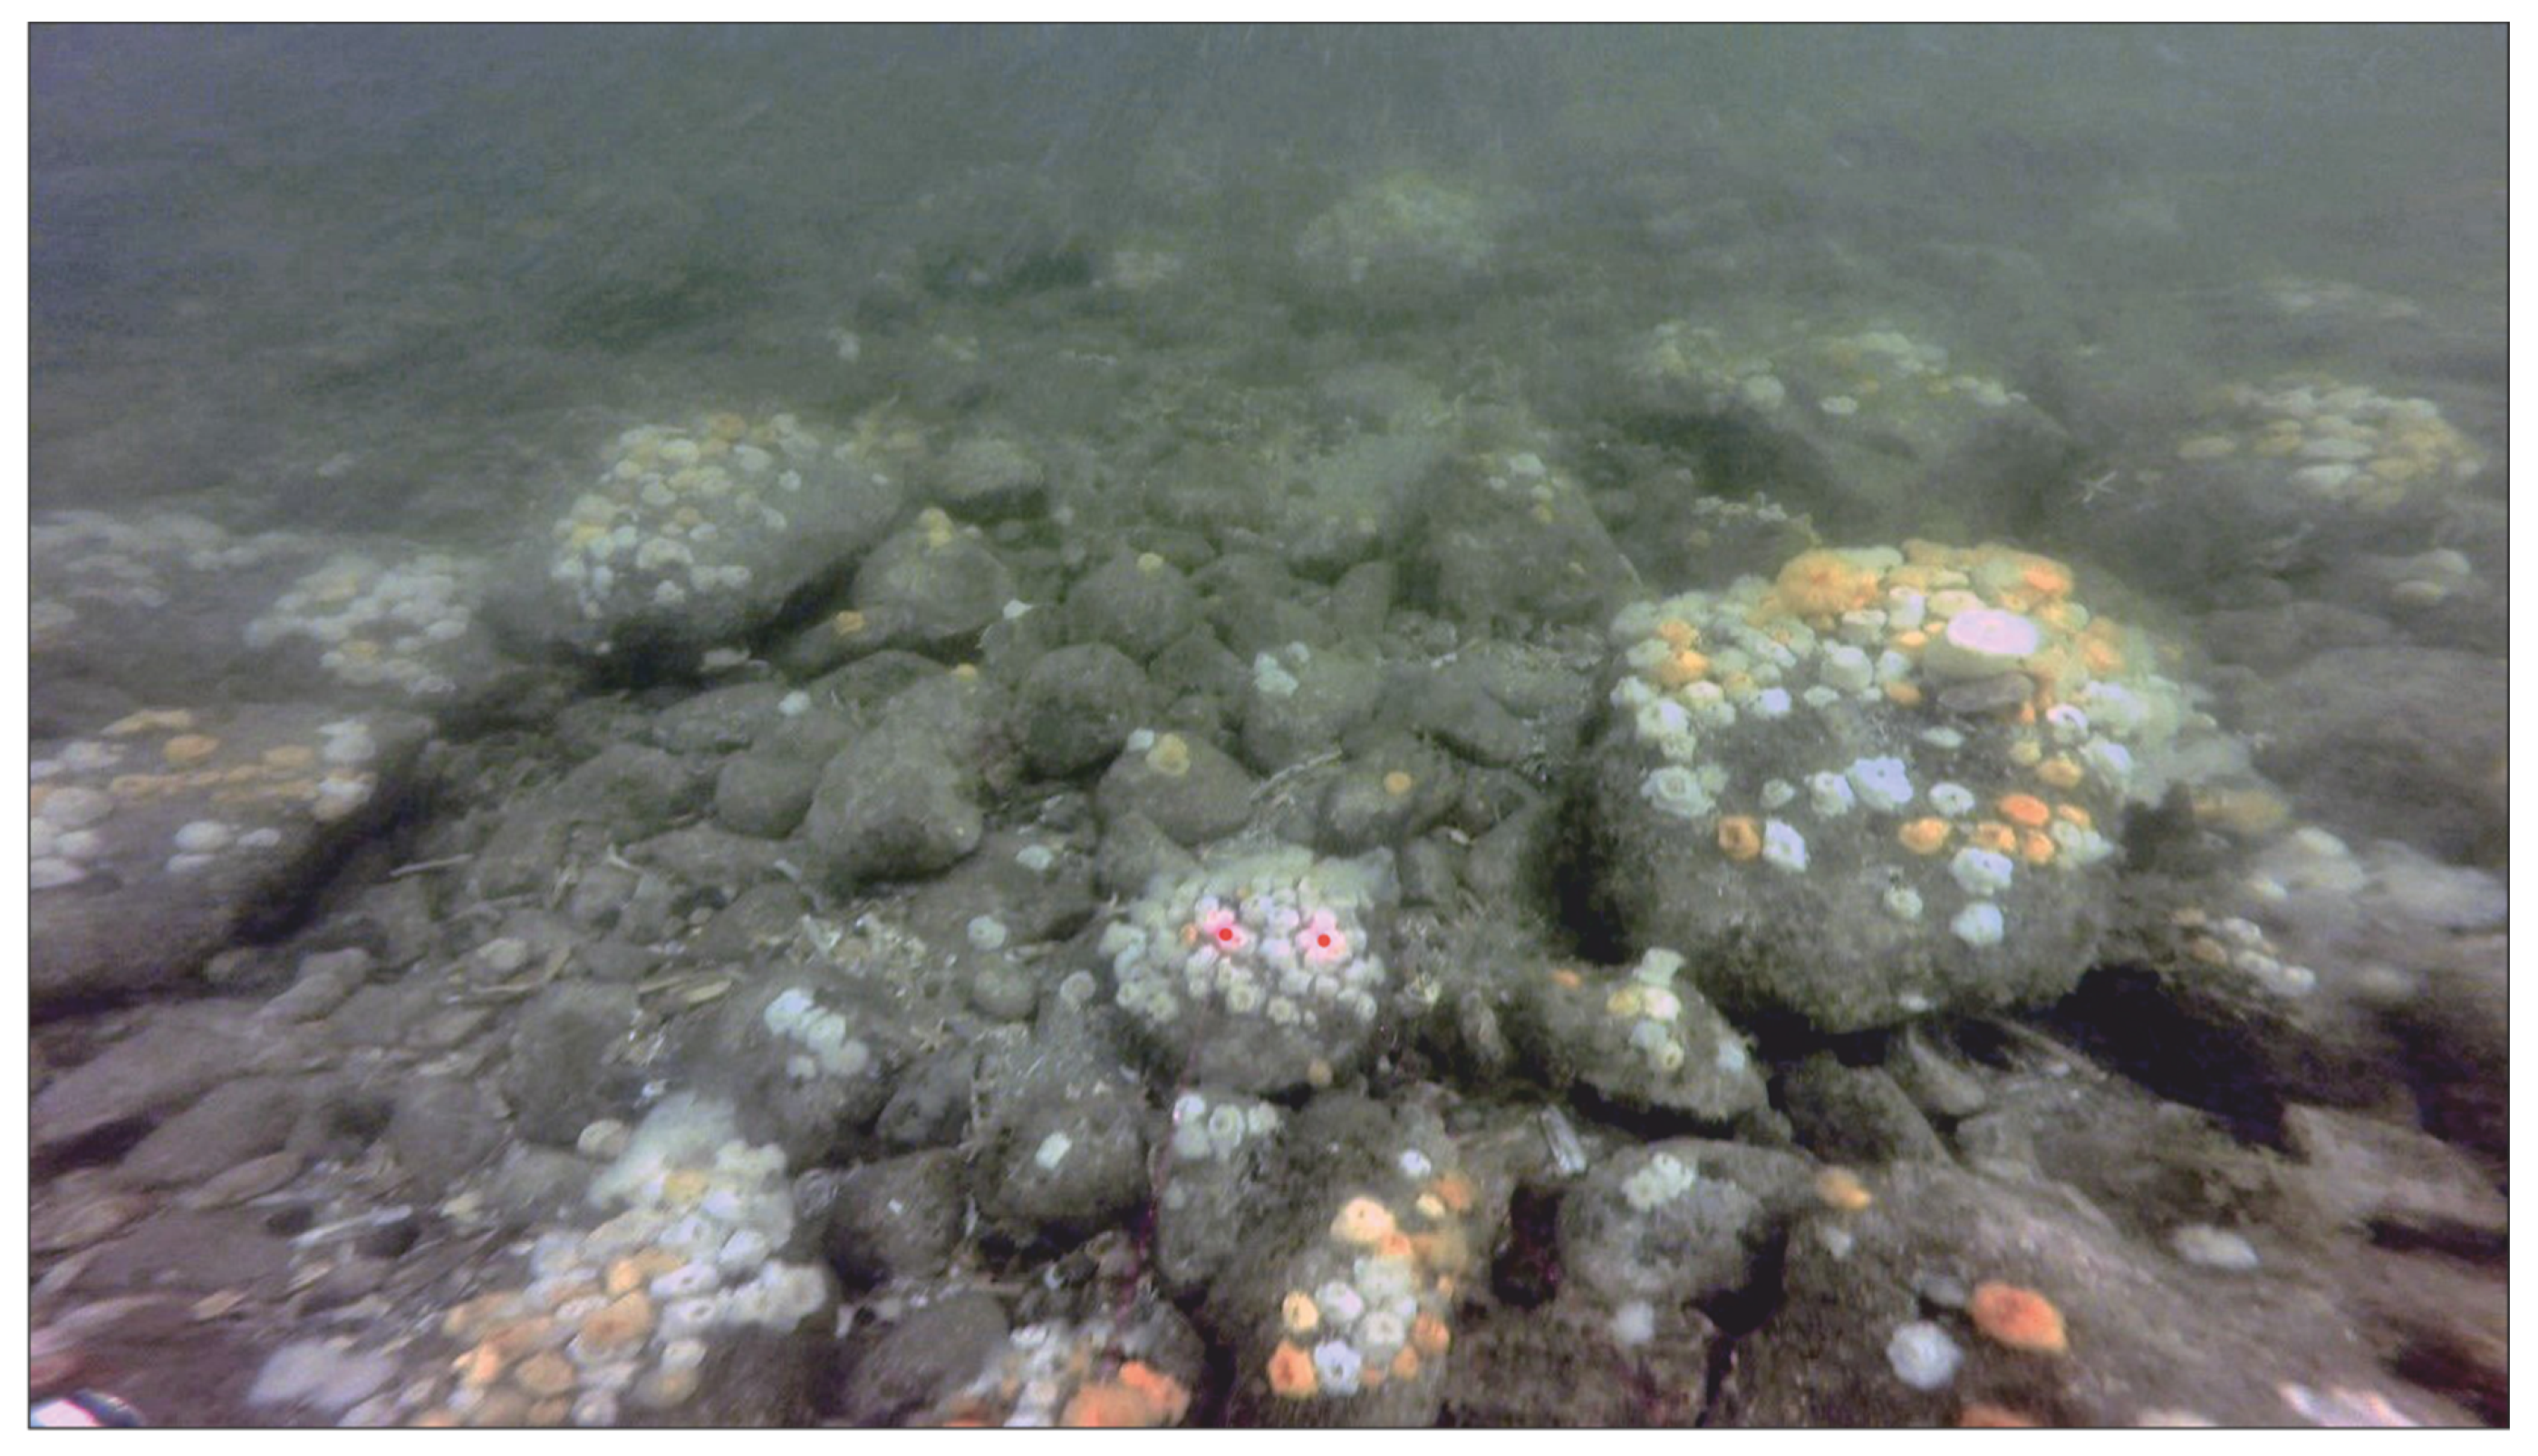
Figure 6.
Representative image from the rocky reef. Red markers in the centre of the image are spaced 10 cm apart from each other.
Figure 6.
Representative image from the rocky reef. Red markers in the centre of the image are spaced 10 cm apart from each other.

Figure 7.
Areas within the rocky reef that are bathymetrically above or below the ‘normal sediment height’ (NSH).
Figure 7.
Areas within the rocky reef that are bathymetrically above or below the ‘normal sediment height’ (NSH).

Figure 8.
Abundance of sessile taxa across the rocky reef. The richness decreases toward the sandy patches.
Figure 8.
Abundance of sessile taxa across the rocky reef. The richness decreases toward the sandy patches.


Table 1.
Overview of the different datasets acquired over the last 13 years. MBES—Multibeam Echo Sounder, YF—YellowFin.
Table 1.
Overview of the different datasets acquired over the last 13 years. MBES—Multibeam Echo Sounder, YF—YellowFin.
| Year (Month) | MBES | YF | EdgeTech | Video | Grab Samples | SES-2000 |
|---|---|---|---|---|---|---|
| 2008/2009 | x | |||||
| 2016 (September) | x | x | x | |||
| 2017 (May) | x | x | ||||
| 2018 (January) | x | x | x | |||
| 2019 (November) | x | |||||
| 2020 (April) | x | x | ||||
| 2021 (June) | x | x | x |
Publisher’s Note: MDPI stays neutral with regard to jurisdictional claims in published maps and institutional affiliations. |
© 2022 by the authors. Licensee MDPI, Basel, Switzerland. This article is an open access article distributed under the terms and conditions of the Creative Commons Attribution (CC BY) license (https://creativecommons.org/licenses/by/4.0/).
Share and Cite
MDPI and ACS Style
Hoffmann, J.J.L.; Michaelis, R.; Mielck, F.; Bartholomä, A.; Sander, L. Multiannual Seafloor Dynamics around a Subtidal Rocky Reef Habitat in the North Sea. Remote Sens. 2022, 14, 2069. https://0-doi-org.brum.beds.ac.uk/10.3390/rs14092069
AMA Style
Hoffmann JJL, Michaelis R, Mielck F, Bartholomä A, Sander L. Multiannual Seafloor Dynamics around a Subtidal Rocky Reef Habitat in the North Sea. Remote Sensing. 2022; 14(9):2069. https://0-doi-org.brum.beds.ac.uk/10.3390/rs14092069
Chicago/Turabian StyleHoffmann, Jasper J. L., Rune Michaelis, Finn Mielck, Alexander Bartholomä, and Lasse Sander. 2022. "Multiannual Seafloor Dynamics around a Subtidal Rocky Reef Habitat in the North Sea" Remote Sensing 14, no. 9: 2069. https://0-doi-org.brum.beds.ac.uk/10.3390/rs14092069
Note that from the first issue of 2016, this journal uses article numbers instead of page numbers. See further details here.