Article

A Comparison of Spectral Bin Microphysics versus Bulk Parameterization in Forecasting Typhoon In-Fa (2021) before, during, and after Its Landfall

Department of Atmosphere Science and Engineering, College of Meteorology and Oceanography, National University of Defense Technology, Changsha 410073, China
*
Author to whom correspondence should be addressed.
Submission received: 21 March 2022 / Revised: 17 April 2022 / Accepted: 29 April 2022 / Published: 30 April 2022
(This article belongs to the Special Issue Tropical Cyclone Remote Sensing)

Abstract

:
Typhoon In-Fa hit continental China in July 2021 and caused an unprecedented rainfall amount, making it a typical case to examine the ability of numerical models in forecasting landfalling typhoons. The record-breaking storm was simulated using a 3-km-resolution weather research and forecast (WRF) model with spectral bin microphysics scheme (BIN) and two-moment seven-class bulk parameterization scheme (BULK). The simulations were then separated into three different typhoon landfall periods (i.e., pre-landfall, landfall, and post-landfall). It was found that typhoon intensity prediction is sensitive to microphysical schemes regardless of landfall periods, while typhoon track prediction tends to be more (less) sensitive to microphysical schemes after (before) typhoon landfall. Moreover, significant differences exist between BIN and BULK schemes in simulating the storm intensity, track, and rainfall distribution. BIN scheme simulates stronger (weaker) typhoon intensity than BULK scheme after (before) landfall, while BULK scheme simulates typhoon moving faster (slower) than BIN scheme before (after) landfall. BIN scheme produces much more extensive and homogeneous typhoon rainbands than BULK scheme, whereas BULK scheme produces stronger (weaker) rainfall in the typhoon inner (outer) rainbands. The possible reasons for such differences are discussed. At present, the ability of WRF and other mesoscale models to accurately simulate the typhoon precipitation hydrometeors is still limited. To evaluate the performances of BIN and BULK schemes of WRF model in simulating the condensed water in Typhoon In-Fa, the observed microwave brightness temperature and radar reflectivity from the core observatory of Global Precipitation Mission (GPM) satellite are directly used for validation with the help of a satellite simulator. It is suggested that BIN scheme has better performance in estimating the spatial structure, overall amplitude, and precise location of the condensed water in typhoons before landfall. During typhoon landfall, the performance of BIN scheme in simulating the structure and location of the condensate is close to that of BULK scheme, but the condensate intensity prediction by BIN scheme is still better; BULK scheme performs even better than BIN scheme in the prediction of condensate structure and location after typhoon landfall. Both schemes seem to have poorer performances in simulating the spatial structure of precipitation hydrometeors during typhoon landfall than before/after typhoon landfall. Moreover, BIN scheme simulates more (less) realistic warm (cold) rain processes than BULK scheme, especially after typhoon landfall. BULK scheme simulates more cloud water and larger convective updraft than BIN scheme, and this is also reported in many model studies comparing BIN and BULK schemes.

1. Introduction

Typhoons, generated in the Western Pacific basin, frequently strike the surrounding countries such as China, Japan, South Korea, and Philippines [1]. Their landfalls can cause massive economic losses and sudden mortality over ample coastal areas in these countries. For instance, super-typhoon Lekima affected many provinces and regions over eastern China in August 2019. More than 14 million people were affected, thousands of houses were destroyed, and the direct economic loss reaches CNY ~52 billion (USD ~8 billion) [2]. The landfall time is an important turning point in a typhoon’s life cycle as its structure, intensity, track, and associated precipitation distribution would all undergo a series of changes [3].
Parameterization of microphysical processes is instrumental for the accurate modeling of landfalling typhoons [4,5,6,7,8,9,10]. There remain significant sensitivities of the models to the use of different mixing and cloud parameterizations, whether or not the numerical core can simulate the dynamics of the atmosphere correctly [11,12]. So far, there have been many ways to parameterize the precipitation microphysics [13,14], wherein the bulk parameterization (hereinafter BULK) and the spectral bin microphysics (hereinafter BIN) are still the two most popular ones. BIN scheme possesses the most sophisticated representations of microphysical processes, which generally performs better than BULK scheme in simulating realistic cloud properties and surface precipitation [15,16,17,18]. Hence, BIN scheme used to be treated as a benchmark for calibration and improvement of the BULK scheme [19,20]. However useful, BIN scheme is not perfect as compared to long-term Tropical Rainfall Measurement Mission (TRMM) satellite observations [15,21].
Performance evaluation of various microphysical schemes in the mesoscale numerical models, such as the Weather Research and Forecasting (WRF) model [22], is of crucial significance for improving typhoon forecasts. Although in recent years Asian scholars have made considerable efforts on typhoon simulation and evaluation [7,8,9,10], there are relatively fewer studies focusing on the simulation differences of typhoon during its different landfall periods (e.g., before, during, and after landfall). In particular, due to the lack of effective observations in the past, especially over the vast oceans, little is known about the performance of various microphysical models in forecasting typhoons during the different periods of their landfall.
Observations from microwave satellites such as the advanced Global Precipitation Mission (GPM) satellite [23] permit the testing of microphysical assumptions with unprecedented capabilities [10,21,24,25,26,27]. Satellite observations of microwave radiation are highly sensitive to cloud and precipitation particles in the atmosphere. These particles (called hydrometeors) scatter, absorb, and emit radiation depending on their mass, composition, shape, internal structure, and orientation. Therefore, microwave observations have applications including weather forecasting, geophysical retrieval, and model validation [21]. To simulate these observations requires a scattering-capable radiative transfer model, which maps from the simulated physical state to the satellite-consistent observables. As an early attempt, Wu et al. [10] used the state-of-the-art Goddard Satellite Data Simulation Unit (G-SDSU) simulator [28,29] to evaluate 7-class bulk microphysical schemes in forecasting Typhoon Lekima (2019), based on observations from the advanced GPM satellite and an S-band ground-based radar. The effects of different microphysics options on WRF-simulated brightness temperatures/radar reflectivities were explored, and the WRF double-moment 7-class (WDM7) scheme [30] was identified as the best in simulating Typhoon Lekima near landfall. However, the differences between BULK schemes and BIN schemes have not yet been investigated in Wu et al. [10]. Previous studies concerning BIN scheme versus BULK scheme in typhoon (hurricane) forecast are also insufficient and limited due to the lack of using the advanced microwave satellite observation and radiative transfer model.
As an extension of Wu et al. [10], this study further explores the differences between BIN and BULK schemes in the simulation of landfalling Typhoon In-Fa (2021), with continuous assistance from the advanced GPM observations and G-SDSU simulator. Typhoon In-Fa hit eastern China in July 2021 and set a record for the longest residence time of storms landing in China ever (~95 h), which caused record-breaking rain, extensive flooding, and power outages, forcing the Chinese authorities to launch the highest (level-I) emergency response for natural disaster relief [31]. Meanwhile, the GPM satellite saw the extreme rainfall of Severe Typhoon In-Fa before, during, and after its landfall, which provides us a precious opportunity to compare BIN scheme versus BULK scheme in forecasting Typhoon In-Fa during different periods of its landfall. We believe remote sensing technology can play an active role to advance the understanding and improvement of the microphysical representations in modeling typhoons. Moreover, studies on tropical cyclones in the Pacific basin will be beneficial to the balance of the current research bias toward the North Atlantic area.

2. Data and Methodology

2.1. Experimental Design

Typhoon In-fa (2021) is simulated by using the state-of-the-art Advanced Research Weather Research and Forecasting (WRF-ARW) Model version 4.2.2 [22], which is extensively utilized for purposes of both operational forecast and research. The model is configured with two two-way interactive nested domains. The outer domain has a horizontal grid spacing of 9-km and consists of 250 × 255 grid points, while the inner domain has a horizontal grid spacing of 3-km and consists of 325 × 313 grid points. The temporal resolutions for these two domains are 60-min and 15-min, respectively. Thus, for higher resolution regions, more frequent model outputs can be obtained. This could be very useful in two ways: first, it contributes to the time matching between satellite overpasses and WRF simulations; second, it helps to analyze the evolution of a simulated typhoon system. In the following research, only the high resolution data from inner domain are utilized.
Notably, the outer domain is fixed during the entire forecast period, whereas the inner domain moves with time so that it remains centered on the typhoon. The vortex following algorithm identifies the typhoon center based on a set of ‘‘fix locations’’ that depict minima in sea level pressure and geopotential height or maxima in wind speed and vorticity in the lower troposphere. The typhoon center is defined as the mean of these fixed locations. The model top is set to 50 hPa with 46 unevenly distributed levels following Wu et al. [10]. Please refer to Figure S1 in the supplementary material for visualized domain settings. Note that similar model configurations have also been adopted by Khain et al. [16] in the simulations of hurricanes Katrina (2005) and Debbie (2006) and have been proved to capture their characteristics well.
The simulation lasted for 120 h from 1200 UTC 22 July to 1200 UTC 27 July 2021. The first six hours are treated as spin-up time. The initial and boundary conditions are acquired from 0.25° × 0.25° 6-hourly final global tropospheric analysis of the National Centers for Environmental Prediction (NCEP/FNL, https://rda.ucar.edu/datasets/ds083.3, accessed on 12 December 2021). The selected parameterization schemes are presented in Table 1. Note the Tiedtke scheme [32,33] is activated for cumulus convection only in the outer domain.

2.2. BIN and BULK Schemes

Other physics options remaining fixed, two microphysical schemes, namely the HUJI (Hebrew University of Jerusalem, Israel) spectral bin microphysics scheme, full version [37], and the WDM7 bulk parameterization scheme [30] are selected to represent the BIN and BULK scheme for comparison, respectively. Both of them contain seven microphysical species (i.e., water vapor, cloud droplet, raindrop, ice crystal, snow, graupel, and hail), while in the BIN scheme, three types of ice-crystal shapes (column, dendrite, and plate) are further separated. Other 7-class bulk microphysical schemes (e.g., the Goddard 4-ice [20], Milbrandt [38], NSSL [39], or WSM7 [30] schemes) are not selected because none of them show better performances than WDM7 scheme in typhoon simulation, as reported by Wu et al. [10].
The drop size distribution (DSD) in BULK scheme is typically assumed to follow a three-parameter gamma distribution: N(D) = N0Dµexp(-ΛD), wherein N(D) (m3 mm1) denotes the droplet concentration per unit volume in the diameter interval, N0 (mm−1-μ m−3) denotes the intercept parameter, µ (dimensionless) denotes the shape parameter, and Λ (mm1) denotes the slope parameter. Note µ is usually set to a constant in BULK scheme, and the gamma distribution is reduced to exponential distribution if µ = 0. Λ and/or N0 are then adjusted to yield prognosticated water content. In contrast, the BIN scheme explicitly predicts N(D) through discretization over 33 mass bins, and the ratio between two adjacent bins is set to a constant of 2. Table 2 gives a further introduction of the differences between the two schemes. Generally, BIN scheme predicts both the mixing ratio and the number concentration, but BULK scheme predicts the number concentration only for liquid-phase hydrometeors (cloud and rain). Note the same microphysical scheme is used on both grid meshes. In both schemes, the aerosol activation is set to follow the Twomey formula [40], and the initial aerosol concentration is set to 100 cm−3 (a typical value for maritime atmosphere).

2.3. GPM Observations and G-SDSU Simulator

GPM satellite happened to see Typhoon In-Fa before (2021/0722/2202 UTC), during (2021/0725/1144 UTC), and after (2021/0727/1105 UTC) its landfall at eastern China, which enabled us to verify the model performances of BIN and BULK schemes in simulating the severe storm during its different landfall periods. There are two important microwave sensors onboard the core observatory of GPM. One is the passive microwave imager named GPM Microwave Imager (GMI), and another is the active microwave radar named Dual-frequency Precipitation Radar (DPR). To evaluate the simulation of typhoon hydrometeors, the 89 GHz brightness temperature product (version 5) of GMI is used. As one of the most advanced Microwave Imager available, GMI takes advantage of coincident data at seven frequencies with both vertical and horizontal polarization channels: 10.6, 18.7, 23, 37, 89, 166, and 183 GHz [23]. The swath width of GMI is approximately 885 km with a footprint of 7.2 × 4.4 km for 89 GHz channel, making it well-suited for model evaluation due to the wide sampling range. In addition, three-dimensional attenuation-corrected reflectivity product (version 6) measured from the DPR is also used for typhoon hydrometeors evaluation. DPR is the very first spaceborne radar with double frequencies (Ku and Ka), wherein Ku-band radar reflectivity has a wider swath width of approximately 245 km and a horizontal resolution of about 5 km, and thus is used for our analysis.
The famous G-SDSU model (available online at https://earth.gsfc.nasa.gov/meso/models/g-sdsu, accesses on 1 March 2022) is a widely used fast model for comparison between GPM satellite observations and simulated data in signal space. It represents the emission and scattering of microwave radiation or radar reflectivity from hydrometeors based on their mass, composition (potentially including water, ice, and air), shape, internal structure, and orientation [29]. We set the same microphysical assumptions in G-SDSU code as in the WRF microphysical schemes, and it was then configured to simulate radiances or backscattering signals fields of GPM satellite at the WRF horizontal resolution of the inner domain (3 km) and next spatially-averaged to match the resolution of GMI (7.2 × 4.4 km) or DPR (5 km) instruments.

2.4. Model Evaluation Methods

Accurate estimates of the spatial structure as well as the precise location of the condensed water are crucial to predicting the development of a storm [41]. Even when detailed microphysical parameterizations are presented in the WRF model, the skill of the model in exactly pinpointing the typhoon rainbands is still limited. Therefore, it is necessary to evaluate and improve the model’s ability in estimating the structure and location of the condensed water.
Structure-amplitude-location (SAL) score proposed by Heini et al. [42] and updated by Wu et al. [10] is thereby introduced here. SAL score is an advanced object-based statistic that evaluates the difference between simulated and observed variables from three key aspects: structure (S), amplitude (A), and location (L). It was originally developed to evaluate quantitative precipitation forecasts [42], and further updated to evaluate the simulation of radiation variables [10]. Thus, in this study we use SAL score to evaluate the simulated brightness temperature related to typhoons (hurricanes). It is worth noting that a threshold should be specified to identify coherent objects of condensed water in the calculation of SAL, and 250 K is taken as the object threshold for evaluating brightness temperature according to Wu et al. [10]. More specifically, the object can be recognized only when its brightness temperature is smaller than 250 K. The SAL score used herein is calculated via Equations (1)–(6) in Wu et al. [10].
Besides the SAL evaluation, the Taylor diagram, proposed by Taylor [43], was also used in this research, which is particularly useful in evaluating various models. Three statistics, namely standard deviation, correlation coefficient, and root-mean-square error (RMSE), are ingeniously displayed in the Taylor diagram at the same time due to the unique geometrical relationship among them. All three statistics are calculated in a point-wise manner over the whole domain of interest. Note that the model results in the Taylor diagram are further normalized by the reference observed variable of brightness temperature to eliminate influence from dimension. Thus, the standard deviation of observation is always set to 1.0.

3. Results

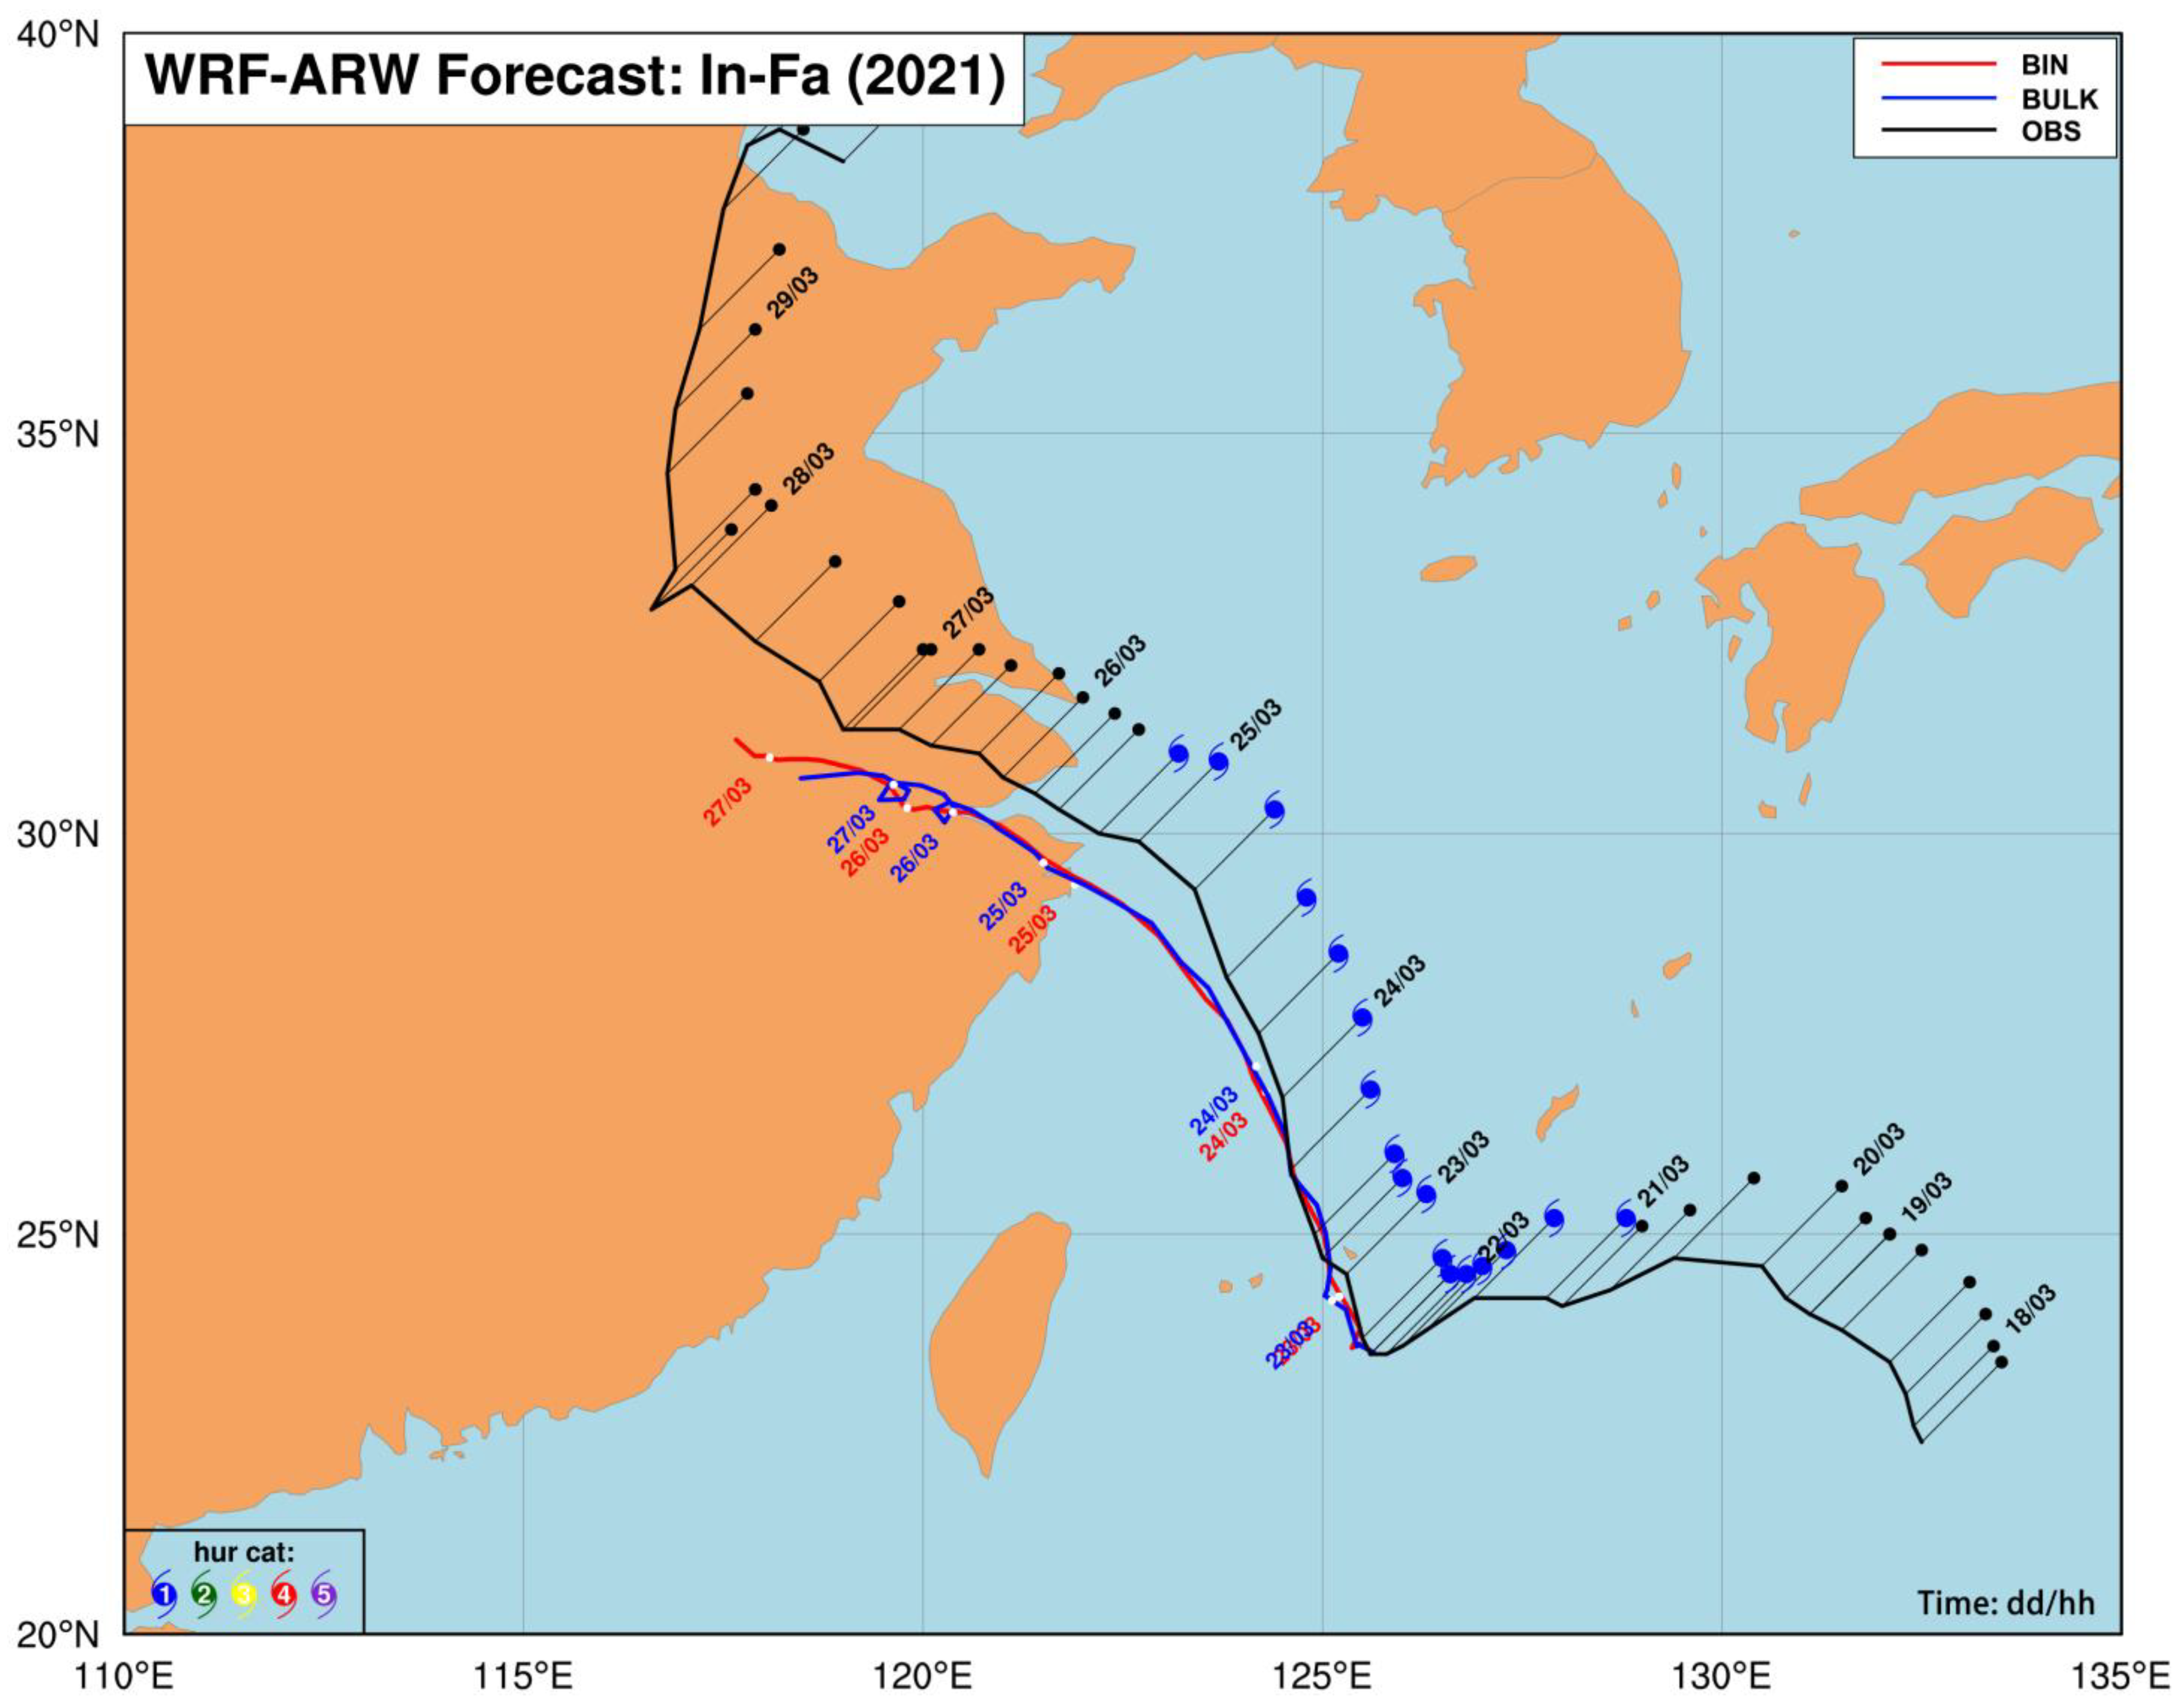
3.1. Evaluation of Typhoon Track and Intensity

The simulation of the typhoon track plays a fundamental role in typhoon modeling studies, as it is the basis for simulating structures of typhoon surface precipitation and cloud hydrometeors. Trajectory errors might result from the inaccuracy of balanced initial conditions, absence of favorable environmental variables, and/or inadequacy of other physical processes. Figure 1 suggests that the simulated tracks resembled the best track archived by China Meteorological Administration (CMA) before typhoon landfall, while the track difference between simulation and observation becomes much more obvious during and after typhoon landfall. Comparing BIN and BULK schemes, the simulated typhoon by BULK (BIN) scheme moved faster than the simulated typhoon by BIN (BULK) scheme before (after) landfall (also see Figure S1), which is probably related to the different simulations of typhoon structure and intensity in these schemes. As suggested in Figure S1, the simulated typhoon by BIN scheme possesses more intact structure after typhoon landfall, while the simulated typhoon by BULK scheme shows stronger inner core intensity before typhoon landfall. Moreover, it could be further inferred from Figure 1 that the track forecasts tend to have more (less) sensitivity to the choice of microphysical schemes after (before) typhoon landfall, which could be related to the rather weak large-scale flow (e.g., the subtropical high) during Typhoon In-Fa’s landfall as documented in Wu et al. [31], so that vortex motions that represent self-propagation can be much clearly modulated by microphysics [44]. However, we will not put too much emphasis on that, as it could be case-dependent.
Figure 2 further shows the temporal evolution of minimum central pressure and maximum surface wind for observations and simulations, respectively. From simulated central pressure of both schemes, the typhoon intensity is overestimated (underestimated) before (after) 0900 UTC 25 July. Relatively, the simulated pressure of BIN scheme is much closer to the observed values. For simulated maximum wind, both schemes underestimate typhoon intensity after 1400 UTC 24 July. Overall, BIN scheme performs better than BULK scheme in simulating typhoon intensity including both pressure and wind. Based on the aforementioned results of simulated track and intensity, it seems that the simulations with BIN scheme were somewhat superior to those with BULK scheme. The explicit BIN scheme offered more faithful representations of the complex microphysical processes in the given weather system (Table 2). The changing microphysics schemes did not have a major impact on track forecasts but did affect the simulated intensity. How do and what kinds of microphysical processes determine typhoon intensity? More in-depth analysis will be conducted in the evaluation of typhoon precipitation hydrometeors based on GPM satellite observations.

3.2. Evaluation of Typhoon Precipitation Hydrometeors

3.2.1. Comparison of BIN and BULK Schemes in Simulating Surface Rainfall

Precipitation is an important metric for the evaluation of model performance [46]. Thus, we compared the 1-h precipitation tendency of moving nest domain for Typhoon In-Fa simulations with BIN and BULK schemes (Figure S1). The spatial distribution of simulated surface precipitation is also shown in Figure 3, during the different periods of its landfall. For the precipitation pattern, the associated spatial extent of simulated surface precipitation by BIN scheme is basically larger than that of simulated surface precipitation by BULK scheme before typhoon landfall, while more isolated precipitation clusters can be found in the simulation with BULK scheme after typhoon landfall. Moreover, before typhoon landfall, it is notable that the simulated typhoon by BULK scheme exhibited stronger precipitation over the inner rainband than the simulated typhoon by BIN scheme, whereas for the outer spiral rainbands, the simulation by BULK scheme shows noticeably less precipitation. Given that the intensity of northwest Pacific cyclone was highly correlated with surface precipitation within the inner cores of the cyclone [47], it may have led to a stronger typhoon intensity with lower central pressure of simulation by BULK scheme than the simulation by BIN scheme (Figure 2a).
Overall, the BIN scheme is able to produce much more extensive and homogeneous typhoon rainbands than BULK scheme (especially before typhoon landfall when its structure is still intact), which is similar to the simulation results of a midlatitude summertime squall line in Li et al. [48,49]. Considering the lack of ground precipitation observation, especially at sea, herein we only give the simulated results. Observations of precipitation physics offered by GMI and DPR provide new analytical capabilities to investigate the model performance in forecasting typhoon physics during different periods of its landfall. Nevertheless, the satellite retrieval algorithms usually adopt different physical assumptions from numerical models to estimate precipitation [29], making them inappropriate for accurate model evaluation. Hence in the next sections, with the help of G-SDSU simulator, a satellite-consistent assessment of simulated hydrometeors is conducted based on direct satellite observed radiance.

3.2.2. Satellite-Consistent Assessment of Simulated Hydrometeors

Overall Assessment

The radiance data from GMI satellite is used to investigate the temporal and spatial characteristics of simulated hydrometeors in Typhoon In-Fa (2021) during different periods of its landfall (pre-landfall, landfall, and post-landfall). Figure 4 shows the WRF-simulated 89 GHz horizontally polarized brightness temperature based on G-SDSU at 2200 UTC 22 July, 1145 UTC 25 July, and 1100 UTC 27 July. Correspondingly, the nearest observations at 2202 UTC 22 July, 1144 UTC 25 July, and 1105 UTC 27 July are also included for comparison. The brightness temperature at 89 GHz is sensitive to both liquid phase and solid phase hydrometeors—the lower the brightness temperature is, the more hydrometeors exist (mainly frozen particles)—which reflects the overall forward scattering of hydrometeors in the typhoon cloud and precipitation. As shown in Figure 4, WRF simulations generally overestimate the radiance intensity in comparison to observations, which could be related to the considerations of more abundant solid particles (ice, snow, graupel, and hail) in the two microphysical schemes. Comparing different landfall periods, the features and locations of simulated typhoon rainbands could basically capture the trends represented in the observation before and after typhoon landfall, while during typhoon landfall, the simulation performances show large discrepancy as compared to observations.
Comparing BIN and BULK schemes, it seems that the BIN scheme shows better performances than BULK scheme in simulating Typhoon In-Fa before its landfall (Figure 4a). Although both schemes overestimate the radiance intensity near typhoon center, the simulation with BIN scheme shows less overestimation than the simulation with BULK scheme. Besides, BULK scheme seems to underestimate the radiance intensity in the outermost region of the storm. However, BULK scheme appears to have better performances than BIN scheme in simulating Typhoon In-Fa after its landfall (Figure 4c). In contrast with BIN scheme, the typhoon rainband’s structure and location are better captured by BULK scheme, especially for the inner rainbands located at 30°N–33°N and outer rainbands located at 27°N–28°N. Both schemes show similar performances in simulating Typhoon In-Fa during its landfall (Figure 4b). Further comparison among three different periods of typhoon landfall will be carried out in the following sections.

Statistical Assessment

Figure 5 shows the Taylor diagram of BIN and BULK models compared to GMI satellite observation of brightness temperature. As described in the Methodology section, the Taylor diagram can provide three useful statistics in one single chart (i.e., the normalized standard deviation, the weighted correlation coefficient, and the normalized RMSE). Before typhoon landfall, BIN scheme exhibits better simulation results than BULK scheme with a spatial correlation coefficient of about 0.20 (0.27 for BULK), a normalized standard deviation of about 1.35 (1.95 for BULK), and an RMSE of about 1.50 (2.00 for BULK). During typhoon landfall, BIN scheme still has better performances but the distance between BIN and BULK schemes on the Taylor diagram (denoted by the difference of their RMSE) shrinks (with an RMSE of about 1.30 for BIN while 1.50 for BULK), which suggests that the performance of BULK scheme is improving gradually. After typhoon landfall, BULK scheme shows more advantages with a spatial correlation coefficient close to 0.13 (0.19 for BIN), a normalized standard deviation around 1.50 (1.70 for BIN), and an RMSE smaller than BIN scheme, about 1.70 (1.85 for BIN).
SAL statistics can be used to evaluate the forecast skill score of different microphysical models in three important aspects of typhoon condensate (i.e., structure, amplitude, and location). Figure 6 shows the SAL score of BIN and BULK schemes based on the calculation method in Section 2.4. As suggested in Figure 6a, BIN shows better similarity with observations before typhoon landfall, which is consistent with the results in Figure 5—that BIN scheme has smaller RMSE value than BULK scheme. During typhoon landfall (Figure 6b), BIN scheme still has better forecast performance than BULK scheme, except for the condensate structure forecast. After typhoon landfall (Figure 6c), BULK scheme shows great improvements in both condensate structure and location forecasts and even overwhelms BIN scheme. The Taylor diagram in Figure 5 also exhibits a similar trend—that the performance of BULK scheme is improving gradually. Comparing three periods of pre-landfall, landfall, and post-landfall (Figure 6a–c), the condensate structure and location forecast performances of BIN (BULK) scheme get worse (better) gradually, while BIN scheme shows absolute advantage on the amplitude prediction of condensed water. It is also notable that structure score is much higher than amplitude score or location score regardless of different landfall periods, and this is consistent with the findings in Wu et al. [10] that structure forecast of typhoon hydrometeors needs more attention and improvement. From the current view, the spatial structure of simulated condensate is either more uniform than observation (before/after typhoon landfall) or more discrete than observation (during landfall).

Physical Assessment

  • Azimuthal structure of typhoon precipitation hydrometeors
In this section, we first utilize the GMI observed and WRF simulated 89 GHz brightness temperatures to examine the azimuthal structure of the forecast typhoon cloud and precipitation for BIN and BULK schemes. Figure 7 presents the azimuthal mean brightness temperature distributions within a radius of 500 km from the typhoon center at different periods of landfall. The observed typhoon center was obtained from the CMA BST data, while the simulated typhoon center was determined by the grid point with the minimum central pressure.
As shown in Figure 7a, the observed brightness temperature before typhoon landfall presents a curve of double peaks, with the primary peak occurring near a radius of 100 km and the secondary peak occurring near a radius of 200 km. The simulated curves of brightness temperature for both BIN and BULK schemes also exhibit the double-peak structure, but BIN scheme simulates closer brightness temperature values to observations as compared to BULK scheme. During typhoon landfall (Figure 7b), the observed curve of brightness temperature shows a single peak near a radius of 70 km, while both simulated curves of brightness temperature show multi-peak structure, indicating a relatively poor performance in typhoon structure forecast during landfall, and in agreement with the analysis of horizontal distribution of brightness temperature in Figure 4. After typhoon landfall (Figure 7c), the observed curve of brightness temperature shows weak fluctuation characteristics. The simulation with BULK scheme well resembles such characteristics, while BIN scheme simulates too much fluctuation. Besides, the simulated brightness temperature of BIN scheme (with a peak value close to 240 K) is significantly colder as compared to that of BULK scheme (with values generally greater than 270 K), indicating less forward scattering of radiation due to more abundant ice-phase particles in simulation with BIN scheme. This implies that for typhoon landing, BULK scheme appears to possess greater advantages than BIN scheme in simulating ice-phase particles and cold rain processes, which could be closely related to their different configuration of microphysical assumptions as already suggested in Table 2.
Overall, the forecast skill of typhoon outer rainband is the best, the eyewall prediction comes second, and the prediction performance of inner rainband is the worst. This is consistent with the statistical results from SAL—that typhoon structure prediction needs more improvements, especially for the prediction of inner rainband. The results suggest that the cloud microphysics schemes had the largest impact on the typhoon inner rainband forecast, which could stem from the complicated microphysical processes observed in inner rainband area [2]. Similar findings have also been reported in the simulation of Typhoon Lekima (2019) by Wu et al. [10]. More analysis will be carried out in the following paragraphs by using DPR observations.
  • Vertical structure of typhoon precipitation hydrometeors
The vertical structures of the typhoon precipitation from spaceborne radar observation and WRF simulation are compared in Figure 8 in the form of domain-averaged reflectivity profiles. It is notable from the vertical profiles in Figure 8 that the simulated reflectivities above an altitude of ~5 km are generally larger than the corresponding observational results, manifesting more vigorous convection and moisture in simulations, thus leading to higher concentration of ice-phase hydrometeors with larger reflectivity. The simulated reflectivities beneath an altitude of ~5 km are generally smaller than the corresponding observational results, possibly due to less production of raindrops in simulations. Comparing three different landfall periods (Figure 8a–c), it is not difficult to find that as typhoon landing, the simulation with BULK (BIN) scheme gets closer to observation in the upper (lower) troposphere, which might indicate that BULK scheme gradually becomes superior (inferior) to BIN scheme in simulating cold (warm) rain processes and solid (liquid) phase particles. This not only confirms the evaluation results of 89 GHz brightness temperatures (which is more sensitive to solid-phase particles than liquid phase particles) mentioned earlier, but further demonstrates that BIN scheme can well simulate typhoon intensity (Figure 2), possibly because of its advantages in simulating warm rain processes and liquid phase particles.
In addition, the radar reflectivity profile from spaceborne radar observation shows a distinct peak at an altitude of ~5 km in Figure 8. As reported in Wu et al. [31], the stratiform precipitation accounts for about 78% of the total precipitation in Typhoon In-Fa (2021), based on a large amount of ground disdrometer measurements (please see Table 3 in Wu et al., [31]). Stratiform rain is characterized with a “bright band” zone (at an altitude of ~5 km) in its vertical reflectivity structure (please see Figure 10 in Wu et al., [31]), mainly due to the melting behavior of ice particles (such as snow and graupel) that greatly strengthens the backscattering ability. Hence, the height of bright band zone usually indicates the melting level. This explains the observed peak reflectivity near the melting level (~5 km) in Figure 8. As for the simulations, it can be also noticed in Figure 8 that both schemes can simulate the peak reflectivity value near the melting layer. However, BIN schemes generally show closer peak value to observations as compared to BULK scheme, and this also helps explain why BIN scheme has better performances in simulating warm rain processes than BULK scheme.
Previous studies also found that simulated typhoons (hurricanes) had the fastest intensification when using only warm rain microphysics [4,5,50]. Compared with BULK scheme, BIN scheme is likely able to simulate more liquid-phase particles (mainly raindrops) after typhoon landfall, which quickly fall out and hydrostatically produce the lower pressure (Figure 2a) [5]. To confirm that, Figure 9 further presents the vertical profiles of domain-averaged mixing ratio for different hydrometeor species. It is notable in Figure 9a,b that BULK scheme simulates much more super-cooled cloud water while relatively fewer snow crystals than BIN scheme, and especially after typhoon landfall, the snow crystal simulated by BIN scheme is almost twice as much as that simulated by BULK scheme. Meanwhile, both schemes simulate scarce amounts of graupels (≤0.05 g kg1, not shown here). This explains why BIN scheme simulates stronger radar reflectivity than BULK scheme in the upper troposphere, especially during the post-landfall period (Figure 8c), hence resulting in an overestimation of cold rain processes. In the lower troposphere, however, the situation reverses. As the storm lands, the rainwater simulated by BULK scheme is gradually reduced and even less than that simulated by BIN scheme (Figure 9c), leading to a lower reflectivity in the lower troposphere (Figure 8c) and possibly an underestimation of warm rain processes. In general, BULK scheme shows potential advantages in simulating solid-phase particles (mainly snow crystals) as well as cold rain processes in the upper troposphere, which is believed to be closely associated with the much larger amount of hail simulated by BULK scheme than BIN scheme (Figure 9d). As reported in Wu et al. [10], the hail category contributes to the prevention of excessive amounts of snow crystals. In contrast, BIN scheme can be better at simulating warm rain processes and liquid-phase particles in the lower troposphere, especially after typhoon landfall, making it superior to BULK scheme in simulating typhoon intensity. However, BIN scheme is not perfect, as when compared to GPM-DPR we observed vertical reflectivity profiles (Figure 8), and it can be further improved by weakening (strengthening) the cold (warm) rain processes. Both this study and Wu et al. [10] suggest that the simulation of warm rain processes by BULK scheme needs essential improvement, and BIN scheme may help to improve BULK scheme.

4. Discussion

First, we shall discuss the connection between precipitation microphysics and dynamics. The maximum vertical velocity and averaged relative humidity of simulations with BIN and BULK schemes are thereby calculated and shown in Figure 10. It is indicated that the convective updraft of BULK scheme is generally larger than that of the BIN scheme, while the water vapor content of BIN scheme is higher than that of BULK scheme. As reported in previous studies [17,48,49,51,52], BULK scheme typically simulates larger vertical velocities and stronger convective precipitation (weaker stratiform precipitation) than BIN scheme. This effect can be attributed to some characteristic properties of the schemes. Different from the spectral bin microphysics, the application of saturation adjustment, the excessive freezing of large drops, as well as the overestimated residential time of large hydrometeors within clouds in many bulk parameterization schemes may cause an overestimation of latent heat release, and hence may lead to an overestimation of vertical velocity and convective rainfall [51]. Despite the updraft simulated by BULK scheme being stronger than BIN scheme, the water vapor content is relatively lower, which may help explain the fewer snow crystals forming at higher levels (Figure 9b). In addition, the lower humidity of BULK scheme than of BIN scheme, especially after typhoon landfall, could contribute to an enhanced evaporation process of raindrops [48,49], which helps explain the less rainwater of BULK scheme.
Second, the importance of hail category is discussed. The stronger brightness temperature (representing the forward scattering of mainly solid-phase particles) of BULK scheme is probably caused by hail, due to the much higher hail content of BULK scheme than that of BIN scheme (Figure 9d). By conducting a comparative experiment between WDM6 scheme and WDM7 scheme, Figure 11 further compares the simulated hydrometeors of BULK scheme without hail and with hail. Note that both schemes have the same microphysical assumptions, except that WDM7 scheme has an additional ice category (hail). It can be inferred in Figure 11 that hail plays an important role in decreasing the excessive mass of snow and graupel, which might contribute to the more realistic simulation of radar reflectivity in the upper air (Figure 8c) and the corresponding cold rain processes by BULK scheme than BIN scheme [10].
Third, the future avenue to improve BULK scheme is discussed. Considering the much higher computational cost of BIN scheme than that of BULK scheme (the computational cost of BIN scheme is at least twenty times higher than that of BULK scheme in this study, please refer to the Appendix A for more information), BULK scheme will still be the priority in the operational weather forecasting models. However, BULK scheme needs essential improvement in the simulation of warm rain processes as we’ve analyzed earlier. In addition, it is also notable in the vertical reflectivity profiles (Figure 8) that BULK scheme shows abnormally lower simulated values than the observed near the melting level, which can partially explain its poorer performances than BIN scheme in simulating warm rain processes. As reported in Lei et al. [53], BULK scheme (WDM6 scheme) has systematic bias in the prediction of warm rain hydrometeors, and high concentration of small raindrops tends to appear near the 0 °C layer as validated against airborne observations. To confirm that, we give the number concentration of warm rain hydrometeors in typhoon simulations as shown in Figure 12. One can notice that BULK scheme (WDM7 scheme) produces abnormally high raindrop number concentrations at an altitude around the melting level (Figure 12a), possibly due to the fast melting processes of snow, graupel, and hail [53]. Meanwhile, the cloud drop number concentrations of BULK scheme are significantly higher than that of BIN scheme (Figure 12b), probably because of the saturation adjustment strategy in BULK scheme. Khain et al. [17] also revealed that the saturation adjustment applied in computing condensation/evaporation in bulk schemes is largely responsible for the major discrepancies in simulating cloud water content. Other reasons might include the differences in aerosol activation and cloud drop evaporation between the two schemes. BIN scheme implements more complex descriptions of aerosol distribution and aerosol-cloud interaction (Table 2), making it superior to BULK scheme in simulating warm rain hydrometeors. Overall, to further improve the prediction of warm rain hydrometeors by BULK scheme, we need to modify the melting process of solid-phase particles, the condensation/evaporation process of liquid-phase particles, and the aerosol-related processes based on direct cloud microphysics observations.
Finally, several comparative studies have been done between BIN and BULK schemes in simulating typhoon/hurricane using cloud-resolving models or mesoscale models. Most of the results prove that BIN scheme usually performs better than BULK scheme, whether in real-case or idealized simulations. However, our study shows that BULK scheme could perform better than BIN scheme in the simulation of typhoon after landfall. Considering that minimal research has been carried out before in China on the sensitivity of typhoons to bulk and bin microphysics, and few studies attempt to compare the model performances during different typhoon landfall periods, our conclusions, as a pioneer study, could be very preliminary and case-dependent. More typhoon cases are needed in the future to validate our results. There is one thing for sure, however—that the BIN scheme is not perfect (regardless of its high computational cost) and it may overestimate (underestimate) the cold (warm) rain processes of typhoon hydrometeors as suggested from the comparison of WRF-simulated and DPR-observed vertical reflectivity profiles (Figure 8). Moreover, the performance of BIN scheme could be even worse than that of BULK scheme sometimes (e.g., in the simulation of cold rain processes after typhoon landfall), and both microphysical schemes will be improved gradually with the progress of observation techniques [21,54]. Apart from microphysics, other factors such as the underlying surface (land-sea contrast) and terrain (friction) may also influence the precipitation of landfalling typhoons, which is beyond the scope of this study and will be investigated in future research.

5. Conclusions

The record-breaking Typhoon In-Fa (2021) was simulated using the WRF-ARW 4.2.2 with two typical microphysical schemes: a well-established BULK scheme and a spectral BIN scheme that explicitly resolves the DSD. Identical initial and environmental conditions were seeded in WRF to ensure that the sensitivities of the simulations are attributed only to the different representations of cloud microphysics. Significant differences between BIN and BULK schemes were found in simulating the storm before, during, and after its landfall. With the assistance of a fast radiative transfer model, the performances of precipitation hydrometeors simulation by the two schemes were directly evaluated through comparison with observations from the advanced GMI and DPR instruments onboard GPM satellite. The major conclusions are presented as follows:
  • Typhoon intensity prediction is quite sensitive to microphysical schemes, and BIN scheme performs better than BULK scheme in forecasting typhoon intensity as validated with CMA best track data. Typhoon track prediction is more (less) sensitive to microphysical schemes after (before) typhoon landfall, which can be attributed to the weakening of large-scale flow with typhoon landing, so that vortex motions that represent self-propagation can be more clearly modulated by microphysics. As for typhoon rainfall prediction, BIN scheme produces much more extensive and homogeneous typhoon rainbands than BULK scheme, whereas BULK scheme produces stronger (weaker) rainfall in the typhoon inner (outer) rainbands.
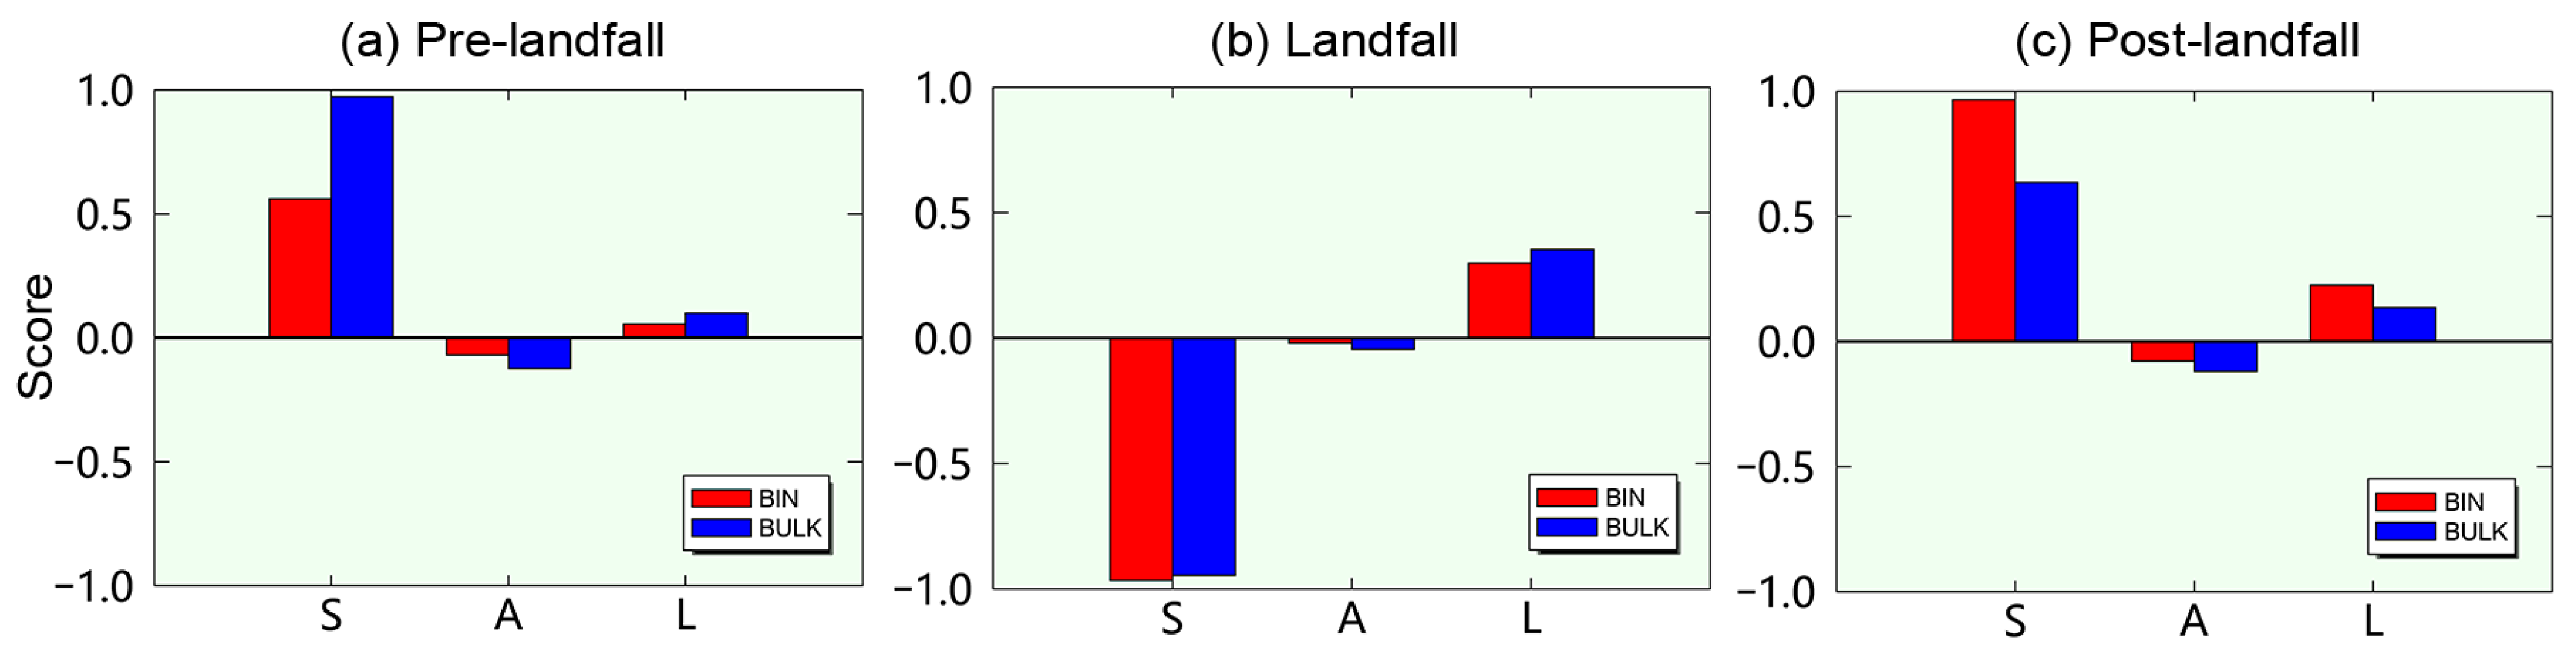
  • According to the SAL forecast skill score, BIN scheme shows better performance in estimating the spatial structure, overall amplitude, and precise location of the condensed water in typhoons before landfall. During typhoon landfall, the performance of BIN scheme in simulating the structure and location of the condensate is close to that of BULK scheme, but the condensate intensity prediction by BIN scheme is still better. BULK scheme performs even better than BIN scheme in the prediction of condensate structure and location after typhoon landfall.
  • The Taylor diagram also suggests that BIN scheme shows more advantages with a smaller RMSE value than BULK scheme in simulating brightness temperature before typhoon landfall (1.50 for BIN, 2.00 for BULK). During typhoon landfall, BIN scheme still has better performances than BULK scheme, but the difference of their RMSE values shrinks (1.30 for BIN, 1.50 for BULK), which suggests that the performance of BULK scheme is improving gradually. After typhoon landfall, BULK scheme shows more advantages with an RMSE smaller than BIN scheme (1.85 for BIN, 1.70 for BULK).
  • Simulations of the azimuthal profile of brightness temperature are validated against the corresponding GMI observations, and it is indicated that the forecast skill of typhoon inner (outer) rainbands is worst (best). Meanwhile, BIN (BULK) scheme better simulates the azimuthal structure of typhoon hydrometeors before (after) landfall, and it is relatively more difficult for both schemes to simulate the azimuthal structure of hydrometeors during typhoon landfall.
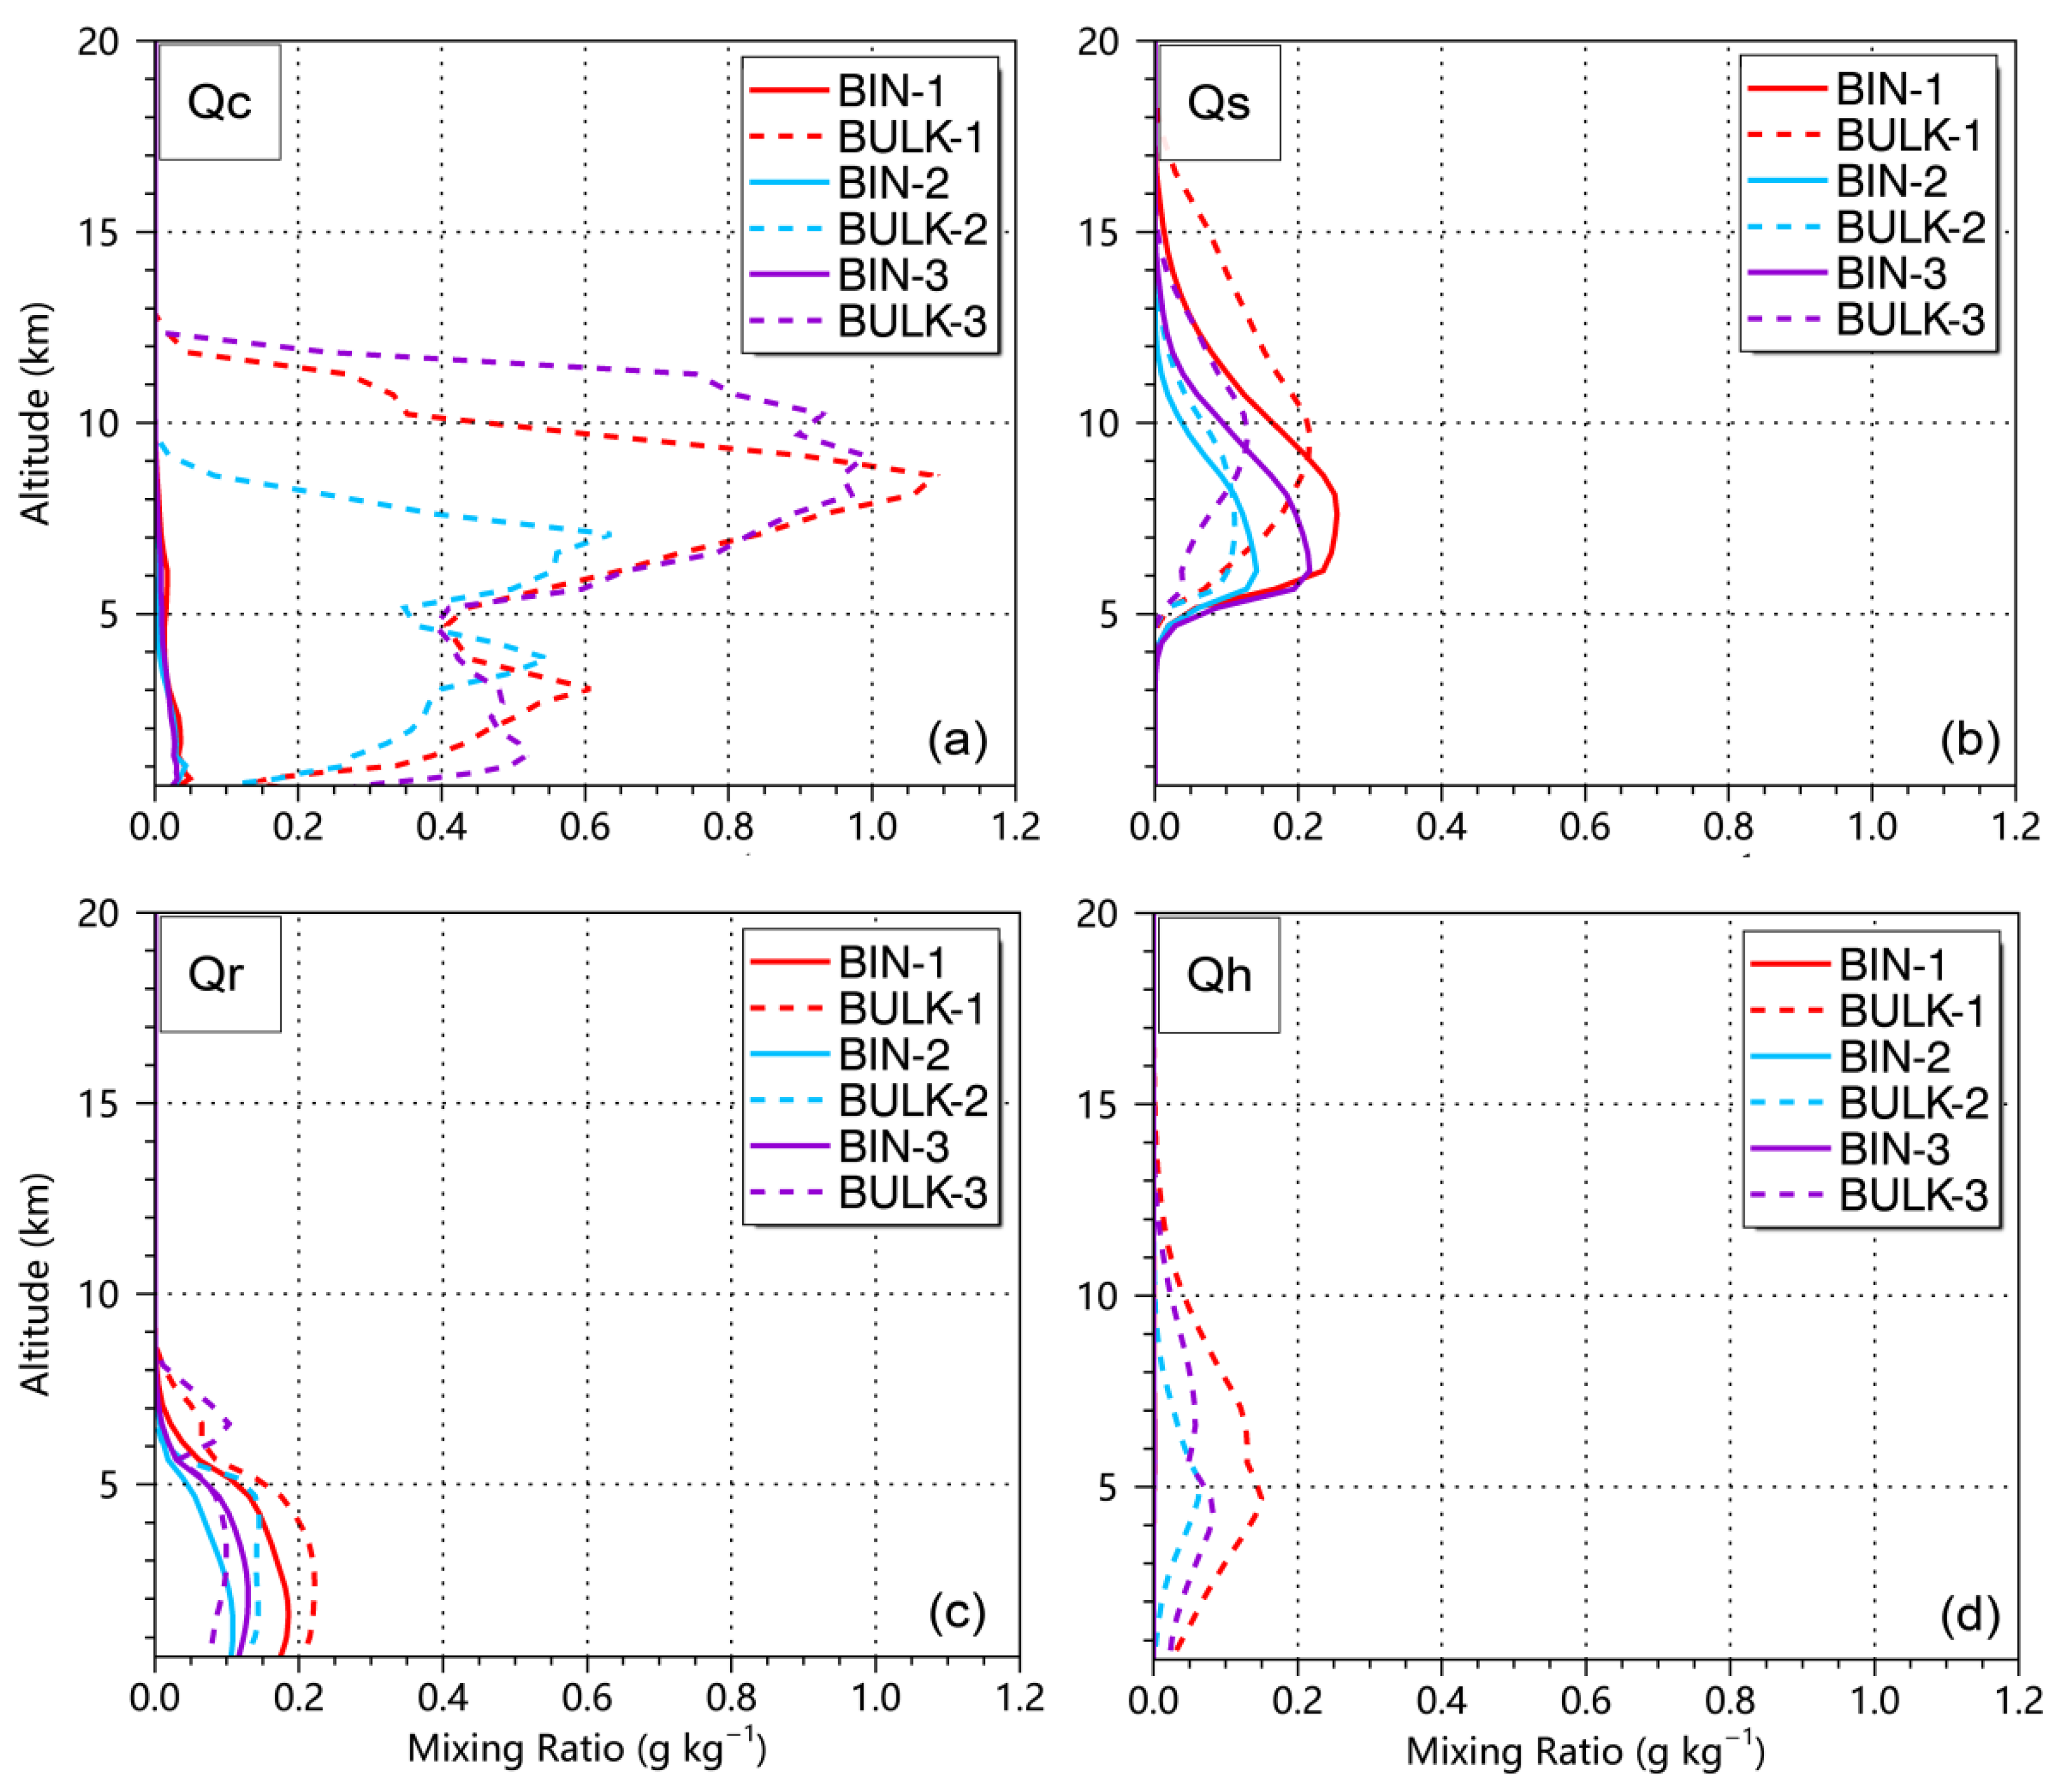
  • Simulations of the vertical profile of radar reflectivity are validated against the corresponding DPR observations, and it is indicated that, with the storm landing, BULK scheme shows worse performance than BIN scheme in simulating warm rain processes. This is because BULK scheme simulates less rainwater with lower humidity than BIN scheme after typhoon landfall, which possibly leads to stronger evaporation of rainwater. However, the BULK scheme is more advantageous in simulating cold rain processes after typhoon landfall, possibly due to its ability in simulating more hailstones that effectively consume the excessive amount of snow crystals.
  • BIN scheme might overestimate the cold rain processes while underestimate the warm rain processes in typhoon simulation, and BULK scheme shows limitations in simulating the warm rain processes, such as melting of ice particles and evaporation of liquid particles. Meanwhile, BULK scheme is noted to simulate more cloud water and larger convective updraft than BIN scheme, probably due to the widespread application of saturation adjustment in bulk parameterizations, and similar conclusions have also been reported in many model studies comparing BIN and BULK schemes.

Supplementary Materials

The following is available online at https://0-www-mdpi-com.brum.beds.ac.uk/article/10.3390/rs14092169/s1, Figure S1: 1-h precipitation tendency of the moving nest domain for Typhoon In-Fa simulations with BIN and BULK schemes from 22 July 2021 to 27 July 2021.

Author Contributions

Conceptualization, Z.W. and Y.Z.; methodology, Z.W.; software, L.Z.; validation, Y.Z., Z.W. and L.Z.; formal analysis, Z.W.; investigation, Z.W.; resources, Y.Z.; data curation, H.Z.; writing—original draft preparation, Z.W.; writing—review and editing, Y.Z.; visualization, H.Z.; supervision, Y.Z.; project administration, L.Z.; funding acquisition, L.Z. All authors have read and agreed to the published version of the manuscript.

Funding

This research was funded by the National Natural Science Foundation of China [grant numbers 42075080, 41975066].

Data Availability Statement

GPM satellite data can be obtained from the Goddard Earth Sciences Data and Information Services Center (GES DISC): https://disc.gsfc.nasa.gov, accessed on 1 January 2022. FNL reanalysis data can be obtained from the National Center for Atmospheric Research (NCAR) via https://rda.ucar.edu/datasets/ds083.3/, accessed on 2 January 2022. The current version of the WRF model is available from the GitHub: https://github.com/wrf-model/WRF, accessed on 16 July 2021. The input/output data, namelist files, and scripts to run the WRF simulation in this study is publicly accessible on the Harvard Dataverse at https://0-doi-org.brum.beds.ac.uk/10.7910/DVN/RXFGZC, accessed on 16 March 2022.

Conflicts of Interest

The authors declare no conflict of interest. The funders had no role in the design of the study; in the collection, analyses, or interpretation of data; in the writing of the manuscript, or in the decision to publish the results.

Appendix A

The appendix contains details about the computational cost of the WRF simulations with BIN and BULK schemes. In this study, all the simulations were executed on a supercomputer located in Beijing, China, which was equipped with the 2.35 GHz AMD EPYC 7452 Processor and the internal memory of 256 G. The WRF (version 4.2.2) was built with intel compiler (version 17.0.5) and intel MPI (Message Passing Interface) library (version 2017.5) pre-installed on the supercomputer. Then, 6 nodes with 384 processors (64 cores per node) were used for parallel processing during the WRF run. As a result, the computational cost of BIN scheme simulation was at least twenty times higher than that of BULK scheme simulation in this study. More specifically, it took ~55 h computational time for five-day WRF simulation with BIN scheme, while ~2.5 h computational time for the same simulation with BULK scheme. Note in the BIN scheme simulation, we allowed the model to additionally write the drop number of each size bins for various hydrometeor species as auxiliary output files, which were required for the simulation of satellite signals in G-SDSU simulator. This may increase the computational cost of BIN scheme simulation.

References

  1. Magee, A.D.; Kiem, A.S.; Chan, J.C. A new approach for location-specific seasonal outlooks of typhoon and super typhoon frequency across the Western North Pacific region. Sci. Rep. 2021, 11, 19439. [Google Scholar] [CrossRef]
  2. Wu, Z.; Huang, Y.; Zhang, Y.; Zhang, L.; Lei, H.; Zheng, H. Precipitation characteristics of typhoon Lekima (2019) at landfall revealed by joint observations from GPM satellite and S-band radar. Atmos. Res. 2021, 260, 105714. [Google Scholar] [CrossRef]
  3. Zhang, W.; Zhang, Y.; Zhou, X. Lightning activity and precipitation characteristics of Typhoon Molave (2009) around its landfall. Acta Meteorol. Sin. 2013, 27, 742–757. [Google Scholar] [CrossRef]
  4. Yang, M.; Ching, L. A modeling study of Typhoon Toraji (2001): Physical parameterization sensitivity and topographic effect. Terr. Atmos. Oceanic Sci. 2005, 16, 177–213. [Google Scholar] [CrossRef] [Green Version]
  5. Tao, W.K.; Shi, J.J.; Chen, S.S.; Lang, S.; Lin, P.-L.; Hong, S.-Y.; Peters-Lidard, C.; Hou, A. The impact of microphysical schemes on hurricane intensity and track. Asia-Pac. J. Atmos. Sci. 2011, 47, 1–16. [Google Scholar] [CrossRef]
  6. Li, J.; Wang, G.; Lin, W.; He, Q.; Feng, Y.; Mao, J. Cloud-scale simulation study of Typhoon Hagupit (2008) Part II: Impact of cloud microphysical latent heat processes on typhoon intensity. Atmos. Res. 2013, 120, 202–215. [Google Scholar] [CrossRef]
  7. Zhang, Y.; Wang, Y.; Liu, G.; Guo, J.; Yang, Y.; Li, R.; Fu, Y.; Liu, L. Satellite-based assessment of various cloud microphysics schemes in simulating typhoon hydrometeors. Adv. Meteorol. 2019, 2019, 3168478. [Google Scholar] [CrossRef]
  8. Xu, H.; Zhang, D.; Li, X. The impacts of microphysics and terminal velocities of graupel/hail on the rainfall of Typhoon Fitow (2013) as seen from the WRF model simulations with several microphysics schemes. J. Geophys. Res. Atmos. 2021, 126, e2020JD033940. [Google Scholar] [CrossRef]
  9. Wu, D.; Zhang, F.; Chen, X.; Ryzhkov, A.; Zhao, K.; Kumjian, M.R.; Chen, X.; Chan, P.-W. Evaluation of microphysics schemes in tropical cyclones using polarimetric radar observations: Convective precipitation in an outer rainband. Mon. Wea. Rev. 2021, 149, 1055–1068. [Google Scholar] [CrossRef]
  10. Wu, Z.; Zhang, Y.; Xie, Y.; Zhang, L.; Zheng, H. Radiance-Based Assessment of Bulk Microphysics Models with Seven Hydrometeor Species in Forecasting Super-typhoon Lekima (2019) near Landfall. Atmos. Res. 2022, 273, 106173. [Google Scholar] [CrossRef]
  11. Tan, I.; Storelvmo, T.; Zelinka, M.D. Observational constraints on mixed-phase clouds imply higher climate sensitivity. Science 2016, 352, 224–227. [Google Scholar] [CrossRef] [PubMed] [Green Version]
  12. Cesana, G.; Suselj, K.; Brient, F. On the dependence of cloud feedbacks on physical parameterizations in WRF aquaplanet simulations. Geophys. Res. Lett. 2017, 44, 10762–10771. [Google Scholar] [CrossRef]
  13. Tapiador, F.J.; Sánchez, J.-L.; García-Ortega, E. Empirical Values and Assumptions in the Microphysics of Numerical Models. Atmos. Res. 2019, 215, 214–238. [Google Scholar] [CrossRef]
  14. Morrison, H.; van Lier-Walqui, M.; Fridlind, A.M.; Grabowski, W.W.; Harrington, J.Y.; Hoose, C.; Korolev, A.; Kumjian, M.R.; Milbrandt, J.A.; Pawlowska, H.; et al. Confronting the challenge of modeling cloud and precipitation microphysics. J. Adv. Model. Earth Syst. 2020, 12, e2019MS001689. [Google Scholar] [CrossRef] [PubMed]
  15. Li, X.; Tao, W.K.; Matsui, T.; Liu, C.; Masunaga, H. Improving a spectral bin microphysical scheme using TRMM satellite observations. Quart. J. Roy. Meteor. Soc. 2010, 136, 382–399. [Google Scholar] [CrossRef] [Green Version]
  16. Khain, A.; Lynn, B. Simulation of tropical cyclones using a mesoscale model with spectral bin microphysics. In Recent Hurricane Research—Climate, Dynamics, and Societal Impacts; Lupo, A.R., Ed.; Intech: London, UK, 2011; pp. 197–227. [Google Scholar]
  17. Khain, A.P.; Beheng, K.D.; Heymsfield, A.; Korolev, A.; Krichak, S.O.; Levin, Z.; Pinsky, M.; Phillips, V.; Prabhakaran, T.; Teller, A.; et al. Representation of microphysical processes in cloud-resolving models: Spectral (bin) microphysics versus bulk parameterization. Rev. Geophys. 2015, 53, 247–322. [Google Scholar] [CrossRef]
  18. Lee, H.; Baik, J.-J. A Comparative Study of Bin and Bulk Cloud Microphysics Schemes in Simulating a Heavy Precipitation Case. Atmosphere 2018, 9, 475. [Google Scholar] [CrossRef] [Green Version]
  19. Lang, S.; Tao, W.-K.; Chern, J.-D.; Wu, D.; Li, X. Benefits of a 4th ice class in the simulated radar reflectivities of convective systems using a bulk microphysics scheme. J. Atmos. Sci. 2014, 71, 3583–3612. [Google Scholar] [CrossRef]
  20. Tao, W.-K.; Wu, D.; Lang, S.; Chern, J.; Peters-Lidard, C.; Fridlind, A.; Matsui, T. High-resolution NU-WRF simulations of a deep convective-precipitation system during MC3E: Further improvements and comparisons between Goddard microphysics schemes and observations. J. Geophys. Res. 2016, 121, 1278–1305. [Google Scholar] [CrossRef]
  21. Tapiador, F.; Navarro, A.; Levizzani, V.; García-Ortega, E.; Huffman, G.; Kidd, C.; Kucera, P.; Kummerow, C.; Masunaga, H.; Petersen, W.; et al. Global Precipitation Measurements for Validating Climate Models. Atmos. Res. 2017, 197, 1278–1305. [Google Scholar] [CrossRef]
  22. Skamarock, C.; Klemp, B.; Dudhia, J.; Gill, O.; Liu, Z.; Berner, J.; Wang, W.; Powers, J.G.; Duda, M.G.; Barker, D.M.; et al. A description of the advanced research WRF model Version 4. In NCAR Technical Note NCAR/TN-475+STR; National Science Foundation: Alexandria, VA, USA, 2019; p. 145. [Google Scholar]
  23. Hou, A.Y.; Kakar, R.K.; Neeck, S.; Azarbarzin, A.A.; Kummerow, C.D.; Kojima, M.; Oki, R.; Nakamura, K.; Iguchi, T. The global precipitation measurement mission. Bull. Am. Meteorol. Soc. 2014, 95, 701–722. [Google Scholar] [CrossRef]
  24. Tapiador, F.J.; Turk, F.; Petersen, W.; Hou, A.Y.; García-Ortega, E.; Machado, L.A.; Angelis, C.F.; Salio, P.; Kidd, C.; Huffman, G.J.; et al. Global Precipitation Measurement: Methods, Datasets and Applications. Atmos. Res. 2012, 104–105, 70–97. [Google Scholar] [CrossRef]
  25. Hristova-Veleva, S.; Li, P.P.; Knosp, B.; Vu, Q.; Turk, F.J.; Poulsen, W.L.; Haddad, Z.; Lambrigtsen, B.; Stiles, B.W.; Shen, T.-P.; et al. An eye on the storm: Integrating a wealth of data for quickly advancing the physical understanding and forecasting of tropical cyclones. Bull. Am. Meteorol. Soc. 2020, 101, E1718–E1742. [Google Scholar] [CrossRef]
  26. Hristova-Veleva, S.; Haddad, Z.; Chau, A.; Stiles, B.W.; Turk, F.J.; Li, P.P.; Knosp, B.; Vu, Q.; Shen, T.-P.; Lambrigtsen, B.; et al. Impact of microphysical parameterizations on simulated hurricanes—using multi-parameter satellite data to determine the particle size distributions that produce most realistic storms. Atmosphere 2021, 12, 154. [Google Scholar] [CrossRef]
  27. Ikuta, Y.; Satoh, M.; Sawada, M.; Kusabiraki, H.; Kubota, T. Improvement of the Cloud Microphysics Scheme of the Mesoscale Model at the Japan Meteorological Agency Using Spaceborne Radar and Microwave Imager of the Global Precipitation Measurement as Reference. Mon. Wea. Rev. 2021, 149, 3803–3819. [Google Scholar] [CrossRef]
  28. Matsui, T.; Iguchi, T.; Li, X.; Han, M.; Tao, W.K.; Petersen, W.; L’Ecuyer, T.; Meneghini, R.; Olson, W.; Kummerow, C.D.; et al. GPM satellite simulator over ground validation sites. Bull. Am. Meteorol. Soc. 2013, 94, 1653–1660. [Google Scholar] [CrossRef]
  29. Matsui, T.; Santanello, J.; Shi, J.J.; Tao, W.K.; Wu, D.; Peters-Lidard, C.; Kemp, E.; Chin, M.; Starr, D.; Sekiguchi, M.; et al. Introducing multisensor satellite radiance-based evaluation for regional Earth System modeling. J. Geophys. Res. 2014, 119, 8450–8475. [Google Scholar] [CrossRef]
  30. Bae, S.Y.; Hong, S.Y.; Tao, W.K. Development of a single-moment cloud microphysics scheme with prognostic hail for the weather research and forecasting (WRF) model. Asia-Pac. J. Atmos. Sci. 2018, 55, 233–245. [Google Scholar] [CrossRef]
  31. Wu, Z.; Zhang, Y.; Zhang, L.; Zheng, H.; Huang, X. A Comparison of Convective and Stratiform Precipitation Microphysics of the Record-breaking Typhoon In-Fa (2021). Remote Sens. 2022, 14, 344. [Google Scholar] [CrossRef]
  32. Tiedtke, M. A comprehensive mass flux scheme for cumulus parameterization in large-scale models. Mon. Wea. Rev. 1989, 117, 1779–1800. [Google Scholar] [CrossRef] [Green Version]
  33. Zhang, C.X.; Wang, Y.Q.; Hamilton, K. Improved representation of boundary layer clouds over the Southeast Pacific in ARW-WRF using a modified tiedtke cumulus parameterization scheme. Mon. Wea. Rev. 2011, 139, 3489–3513. [Google Scholar] [CrossRef] [Green Version]
  34. Janjić, Z.I. The step-mountain eta coordinate model: Further developments of the convection, viscous sublayer, and turbulence closure schemes. Mon. Wea. Rev. 1994, 122, 927–945. [Google Scholar] [CrossRef] [Green Version]
  35. Iacono, M.J.; Delamere, J.S.; Mlawer, E.J.; Shephard, M.W.; Clough, S.A.; Collins, W.D. Radiative forcing by long-lived greenhouse gases: Calculations with the AER radiative transfer models. J. Geophys. Res. Atmos. 2008, 113, D13103. [Google Scholar] [CrossRef]
  36. Tewari, M.; Chen, F.; Wang, W.; Dudhia, J.; LeMone, M.A.; Mitchell, K.; Ek, M.; Gayno, G.; Wegiel, J.; Cuenca, R.H. Implementation and verification of the unified Noah land−surface model in the WRF model Paper. In WRF Model Development and Applications, Proceedings of the 20th Conference on Weather Analysis and Forecasting/16th Conference on Numerical Weather Prediction; American Meteorological Society: Seattle, WA, USA, 2004; pp. 2165–2170. [Google Scholar]
  37. Khain, A.; Pokrovsky, A.; Pinsky, M.; Seifert, A.; Phillips, V. Simulation of effects of atmospheric aerosols on deep turbulent convective clouds using a spectral microphysics mixed-phase cumulus cloud model. Part I: Model description and possible applications. J. Atmos. Sci. 2004, 61, 2963–2982. [Google Scholar] [CrossRef] [Green Version]
  38. Milbrandt, J.A.; Yau, M.K. A multimoment bulk microphysics parameterization. Part I: Analysis of the role of the spectral shape parameter. J. Atmos. Sci. 2005, 62, 3051–3064. [Google Scholar] [CrossRef] [Green Version]
  39. Mansell, E.R.; Ziegler, C.L.; Bruning, E.C. Simulated electrification of a small thunderstorm with two-moment bulk microphysics. J. Atmos. Sci. 2010, 67, 171–194. [Google Scholar] [CrossRef]
  40. Twomey, S. The nuclei of natural cloud formation: The supersaturation in natural clouds and the variation of cloud droplet concentrations. Pure Appl. Geophys. 1959, 43, 243–249. [Google Scholar] [CrossRef]
  41. Tapiador, F.J.; Navarro, A.; Martín, R.; Hristova-Veleva, S.; Haddad, Z.S. Predicting Tropical Cyclone Rapid Intensification from Satellite Microwave Data and Neural Networks. IEEE Trans. Geosci. Remote Sens. 2022, 60, 4205213. [Google Scholar] [CrossRef]
  42. Heini, W.; Marcus, P.; Martin, H.; Frei, C. SAL-a novel quality measure for the verification of quantitative precipitation forecasts. Mon. Wea. Rev. 2008, 136, 4470–4487. [Google Scholar]
  43. Taylor, K.E. Summarizing multiple aspects of model performance in a single diagram. J. Geophys. Res. 2001, 106, 7183–7192. [Google Scholar] [CrossRef]
  44. Fovell, R.G.; Su, H. Impact of cloud microphysics on hurricane track forecasts. Geophys. Res. Lett. 2007, 34, L24810. [Google Scholar] [CrossRef] [Green Version]
  45. Lu, X.Q.; Yu, H.; Ying, M.; Zhao, B.K.; Zhang, S.; Lin, L.M.; Bai, L.; Wan, R. Western North Pacific Tropical Cyclone Database Created by the China Meteorological Administration. Adv. Atmos. Sci. 2021, 38, 690–699. [Google Scholar] [CrossRef]
  46. Tapiador, F.J.; Roca, R.; Del Genio, A.; Dewitte, B.; Petersen, W.; Zhang, F. Is Precipitation a Good Metric for Model Performance? Bull. Am. Meteorol. Soc. 2019, 100, 223–233. [Google Scholar] [CrossRef] [PubMed]
  47. Deshpande, M.S.; Pattnaik, S.; Salvekar, P.S. Impact of cloud parameterization on the numerical simulation of a super cyclone. Ann. Geophys. 2012, 30, 775–795. [Google Scholar] [CrossRef] [Green Version]
  48. Li, X.; Tao, W.K.; Khain, A.P.; Simpson, J.; Johnson, D.E. Sensitivity of a cloud-resolving model to bulk and explicit bin microphysical schemes. Part I: Comparisons. J. Atmos. Sci. 2009, 66, 3–21. [Google Scholar] [CrossRef]
  49. Li, X.; Tao, W.-K.; Khain, A.P.; Simpson, J.; Johnson, D.E. Sensitivity of a cloud-resolving model to bulk and explicit bin microphysical schemes, Part II: Cloud microphysics and storm dynamics interactions. J. Atmos. Sci. 2009, 66, 22–40. [Google Scholar] [CrossRef] [Green Version]
  50. Li, X.; Pu, Z. Sensitivity of numerical simulation of early rapid intensification of hurricane Emily (2005) to cloud microphysical and planetary boundary layer parameterization. Mon. Wea. Rev. 2008, 136, 4819–4838. [Google Scholar] [CrossRef]
  51. Khain, A.; Lynn, B. Simulation of a supercell storm in clean and dirty atmosphere using weather research and forecast model with spectral bin microphysics. J. Geophys. Res. 2009, 114, D19209. [Google Scholar] [CrossRef]
  52. Yin, L.; Ping, F.; Mao, J. A comparative study between bulk and bin microphysical schemes of a simulated squall line in East China. Atmos. Sci. Lett. 2017, 18, 195–206. [Google Scholar] [CrossRef] [Green Version]
  53. Lei, H.; Guo, J.; Chen, D.; Yang, J. Systematic bias in the prediction of warm-rain hydrometeors in the WDM6 microphysics scheme and modifications. J. Geophys. Res. Atmos. 2020, 125, e2019JD030756. [Google Scholar] [CrossRef]
  54. Tapiador, F.J.; Villalba-Pradas, A.; Navarro, A.; García-Ortega, E.; Lim, K.-S.S.; Kim, K.; Ahn, K.D.; Lee, G. Future Directions in Precipitation Science. Remote Sens. 2021, 13, 1074. [Google Scholar] [CrossRef]
Figure 1. WRF-ARW simulated Typhoon In-Fa tracks during the time from 1200 UTC 22 July to 1200 UTC 27 July 2021, as compared with the CMA best track data [45]. The simulated tracks are marked with white dots at 0300 UTC each day from 23 to 27 July 2021. The corresponding times are also labeled on the observed track for comparison. Following the Saffir–Simpson Hurricane Scale, the observed typhoon intensity is depicted with different hurricane categories (from cat-1 to cat-5). The blue/green/yellow/red/purple cyclone symbols represent category-1/-2/-3/-4/-5 hurricane, respectively. The black solid dots represent tropical storm or tropical depression. Note the format of time on the map is dd/hh.
Remotesensing 14 02169 g001
Figure 2. Temporal evolution of (a) minimum central pressure (hPa) and (b) maximum surface wind (m s−1).
Remotesensing 14 02169 g002
Figure 3. 1-h rainfall tendency (unit: mm) of moving nest domain for the simulated Typhoon In-Fa before, during, and after its landfall.
Remotesensing 14 02169 g003
Figure 4. GMI satellite observation and WRF model simulation of brightness temperature (K) for Typhoon In-Fa (2021) during three different landfall periods.
Remotesensing 14 02169 g004
Figure 5. Taylor diagram comparing simulated brightness temperature (K) from BIN and BULK schemes at three different landing stages. The dashed purple curve represents normalized standard deviation of the observations, the dotted pale-blue curves represent the centered RMSE, and the solid pale-green lines represent correlation coefficients.
Remotesensing 14 02169 g005
Figure 6. SAL score comparing simulated brightness temperature from BIN and BULK schemes for Typhoon In-Fa (2021) during the periods of (a) pre-landfall, (b) landfall, and (c) post-landfall.
Remotesensing 14 02169 g006
Figure 7. Azimuthal mean brightness temperature (K) distributions of GMI satellite observation and WRF simulations for Typhoon In-Fa (2021) during three different landfall periods.
Remotesensing 14 02169 g007
Figure 8. Domain-averaged vertical profiles of attenuation-corrected radar reflectivity (Zku) derived from both GPM DPR observation and WRF model simulation for Typhoon In-Fa (2021) during three different landfall periods. Note only the grid points with reflectivity are considered, and those grid points with no-reflectivity are ignored. The Ku-band radar reflectivity is calculated via Equation (4) in Wu et al. [2].
Remotesensing 14 02169 g008
Figure 9. Domain-averaged vertical profiles of (a) cloud water, (b) snow, (c) rainwater, and (d) hail mixing ratio (g kg−1) during three different periods of typhoon landfall. The symbol Qx (x = c, s, r, h) represents the mixing ratio of each hydrometeor species, and the appending digits -1, -2, and -3 in the legend represent the periods before, during, and after landfall, respectively.
Remotesensing 14 02169 g009
Figure 10. The maximum vertical velocity (m s−1) versus averaged relative humidity (%) from WRF simulations using BIN and BULK schemes. The square symbols represent pre-landfall stage, the circle symbols represent landfall stage, and the triangle symbols represent post-landfall stage.
Remotesensing 14 02169 g010
Figure 11. Domain-averaged vertical profiles of (a) snow and (b) graupel mixing ratio (g kg−1) during three different periods of typhoon landfall. The symbol Qx (x = s, g) represents the mixing ratio of each hydrometeor species, and the appending digits -1, -2, and -3 in the legend represent the periods before, during, and after landfall, respectively. Note WDM6 scheme is the same as WDM7 scheme, but without the hail category.
Remotesensing 14 02169 g011
Figure 12. Domain-averaged vertical profiles of (a) raindrop and (b) cloud droplet number concentration (kg−1) during three different periods of typhoon landfall. The symbol Nx (x = r, c) represents the number concentration of each hydrometeor species, and the appending digits -1, -2, and -3 in the legend represent the periods before, during, and after landfall, respectively.
Remotesensing 14 02169 g012
Table 1. Basic parameterization scheme options for experimental design.
Scheme TypeScheme NameRelated Document
Boundary layerMellor-Yamada-JanjicJanjić [34]
Long-wave radiationRRTMGIacono et al. [35]
Short-wave radiationRRTMGIacono et al. [35]
Land surfaceunified NoahTewari et al. [36]
Surface layerMonin-ObukhovJanjić [34]
Table 2. BIN versus BULK: different description of microphysics.
DescriptionBINBULK
DSDSolving a system of kinetic equations for DSDThe DSD is prescribed in the form of exponential distribution or gamma distribution
AerosolsAerosol budget, transport of aerosols, size distribution of CCN, cloud–aerosol interactionFractional aerosol budget, transport of aerosols, size distribution of CCN, cloud–aerosol interaction
Condensation/
evaporation
The diffusion growth/evaporation equations are usedNo equation for diffusion growth or evaporation; the strategy of saturation adjustment is utilized
CollisionsStochastic collision equations are usedSimplified equations are used
SedimentationDifferential fall velocity depending on
particle size, shape, and air density
The bulk fall velocity for the same type of particles
Melting/
freezing
The shape of DSD changes
during these nonlinear processes
The shape of DSD remains fixed
during the highly nonlinear processes
Publisher’s Note: MDPI stays neutral with regard to jurisdictional claims in published maps and institutional affiliations.

