Communication

Augmentation-Based Methodology for Enhancement of Trees Map Detalization on a Large Scale

1
Skolkovo Institute of Science and Technology, 143026 Moscow, Russia
2
Institute of Information Technology and Data Science, Irkutsk National Research Technical University, 664074 Irkutsk, Russia
3
Public Joint-Stock Company (PJSC) Sberbank of Russia, ESG Department, 127006 Moscow, Russia
*
Author to whom correspondence should be addressed.
Submission received: 21 March 2022 / Revised: 2 May 2022 / Accepted: 6 May 2022 / Published: 9 May 2022

Abstract

:
Remote sensing tasks play a very important role in the domain of sensing and measuring, and can be very specific. Advances in computer vision techniques allow for the extraction of various information from remote sensing satellite imagery. This information is crucial in making quantitative and qualitative assessments for monitoring of forest clearing in protected areas for power lines, as well as for environmental analysis, in particular for making assessments of carbon footprint, which is a highly relevant task. Solving these problems requires precise segmentation of the forest mask. Although forest mask extraction from satellite data has been considered previously, no open-access applications are able to provide the high-detailed forest mask. Detailed forest masks are usually obtained using unmanned aerial vehicles (UAV) that set particular limitations such as cost and inapplicability for vast territories. In this study, we propose a novel neural network-based approach for high-detailed forest mask creation. We implement an object-based augmentation technique for a minimum amount of labeled high-detailed data. Using this augmented data we fine-tune the models, which are trained on a large forest dataset with less precise labeled masks. The provided algorithm is tested for multiple territories in Russia. The F 1 - s c o r e , for small details (such as individual trees) was improved to 0.929 compared to the baseline score of 0.856 . The developed model is available in an SAAS platform. The developed model allows a detailed and precise forest mask to be easily created, which then be used for solving various applied problems.

1. Introduction

Artificial intelligence has already been successfully applied to solve various practical problems, in particular tasks related to the automatization of sensing processes and increasing their precision [1,2]. With the appearance of new technologies that allow high-quality imaging data to be obtained, the amount of collected imaging data has increased; this leads to demands for the development of effective tools for image data processing. One of the industrial and scientific domains that requires such tools is remote sensing [3,4]. Remote sensing data is widely used in various environmental studies that include measuring of the carbon footprint, for which it is crucial to obtain precise forest masks, boundaries of agriculture fields, type of crops, etc. Computer vision algorithms, in particular convolutional neural networks (CNN), can automatically process this data. The vital information such as environmental and vegetation state [5], forest inventory characteristics [6], and agriculture crop yield [7] can be effectively extracted by CNNs. Commonly, the first step in environmental studies is obtaining forest masks [8,9]. The existing satellite-based approaches for obtaining forest masks work well for vast territories where it is not important to detect and quantify small details. The usual spatial resolution for open-access landcover maps is more than 10 m [10]. Using such datasets, it is possible to create forest masks with sufficient accuracy on a large scale and make an adequate assessments of forest reserves. However, current approaches usually are not intended to detect small details such as individual trees, groups of trees, or meadows. Moreover, commonly used metrics for accuracy assessment of automatically generated forest masks do not take into account these small details in an adequate manner, for the following reason. Separate trees or groups of trees represent a tiny proportion of the target forest class, which is why the impact of detection accuracy for small objects on the overall metrics is low. Thus, a high prediction score for the entire territory does not necessarily mean high performance on small details.
For particular tasks, it is essential to obtain a detailed forest mask that approximates areas of forest. One such task is the monitoring of protected zones or natural reserves, where the territory of interest is too narrow and each small group of trees has to be taken into account [11,12]. In [13], the authors showed the importance of trees outside forests for ecosystem functions and ways to improve assessments based on aerial stereo images. In such cases, unmanned aerial vehicles (UAV) or aerial photography are usually used to obtain higher detail [14]. Obtaining the detailed forest mask on large scales is quite a challenging task, and it is common to merge data with different resolutions and from different sources [15]. The main limitation of the UAV-based approach is its cost and the difficulty of its implementation for vast territories on a country-wide scale [16]. Another datasource is satellite imagery with high spatial resolution, such as WorldView, Spot, RapidEye, and Planet. These data sources are often used to detect the crown of individual trees, which in turn can be considered in a detailed forest mask. WorldView images were used for forest cover estimation in [17,18], while RapidEye data were considered in [19,20]. However, these data are more expensive than low or medium spatial resolution satellite images.
The example of low resolution data for making large scale estimations of forest masks is described in [21], where the authors used image data collected by the MODIS mission, which has a resolution of 250 m [22] (Moderate Resolution Imaging Spectroradiometer). Using a medium resolution (10–30 m) is most frequent because of the availability of open-access data and comprehensive frameworks for data processing. For example, in [23] the authors show an approach for forest mask creation over European forests using optical Sentinel-2 data. In [24], the authors monitor forest degradation in South Asian forest ecosystems by implementing Sentinel-2 and Landsat imagery. Deforestation monitoring tasks using data from Sentinel-1, PALSAR-2 and Landsat data are discussed in [25]. The data fusion and preprocessing techniques for aerial and Sentinel-2 data are shown in [26], where the authors calculated the forest cover map for German territory and showed the accuracy of their proposed method by comparison with National forest inventory data. One major problem is deforestation connected to illegal logging. In [27,28], the authors propose and validate approaches for deforestation monitoring using Sentinel-2 data. A time series of images can be used for environmental monitoring and planning of sustainable management. In [29], the authors showed the potential of using, time series of Landsat and Sentinel-1A SAR images to identify and map mangrove forests. Time series of images can be used to detect forest degradation caused by natural reasons, anthropogenically-influenced climate change, damage by insects, etc., [30].
In this study, we propose a neural network-based approach for predicting the detailed forest mask using Basemap RGB images. We use a small dataset with detailed labelling of individual trees to fine-tune a CNN model that was initially trained on a large dataset with less accurate labels (masks) for individual trees or groups of trees. The novelty of our study includes the implementation of the object-based augmentation (OBA) technique for new training sample generation. This approach increases the amount of training data significantly and allows for the creation of physically meaningful data samples, which is important in remote sensing data analysis. The main contributions of this paper are:
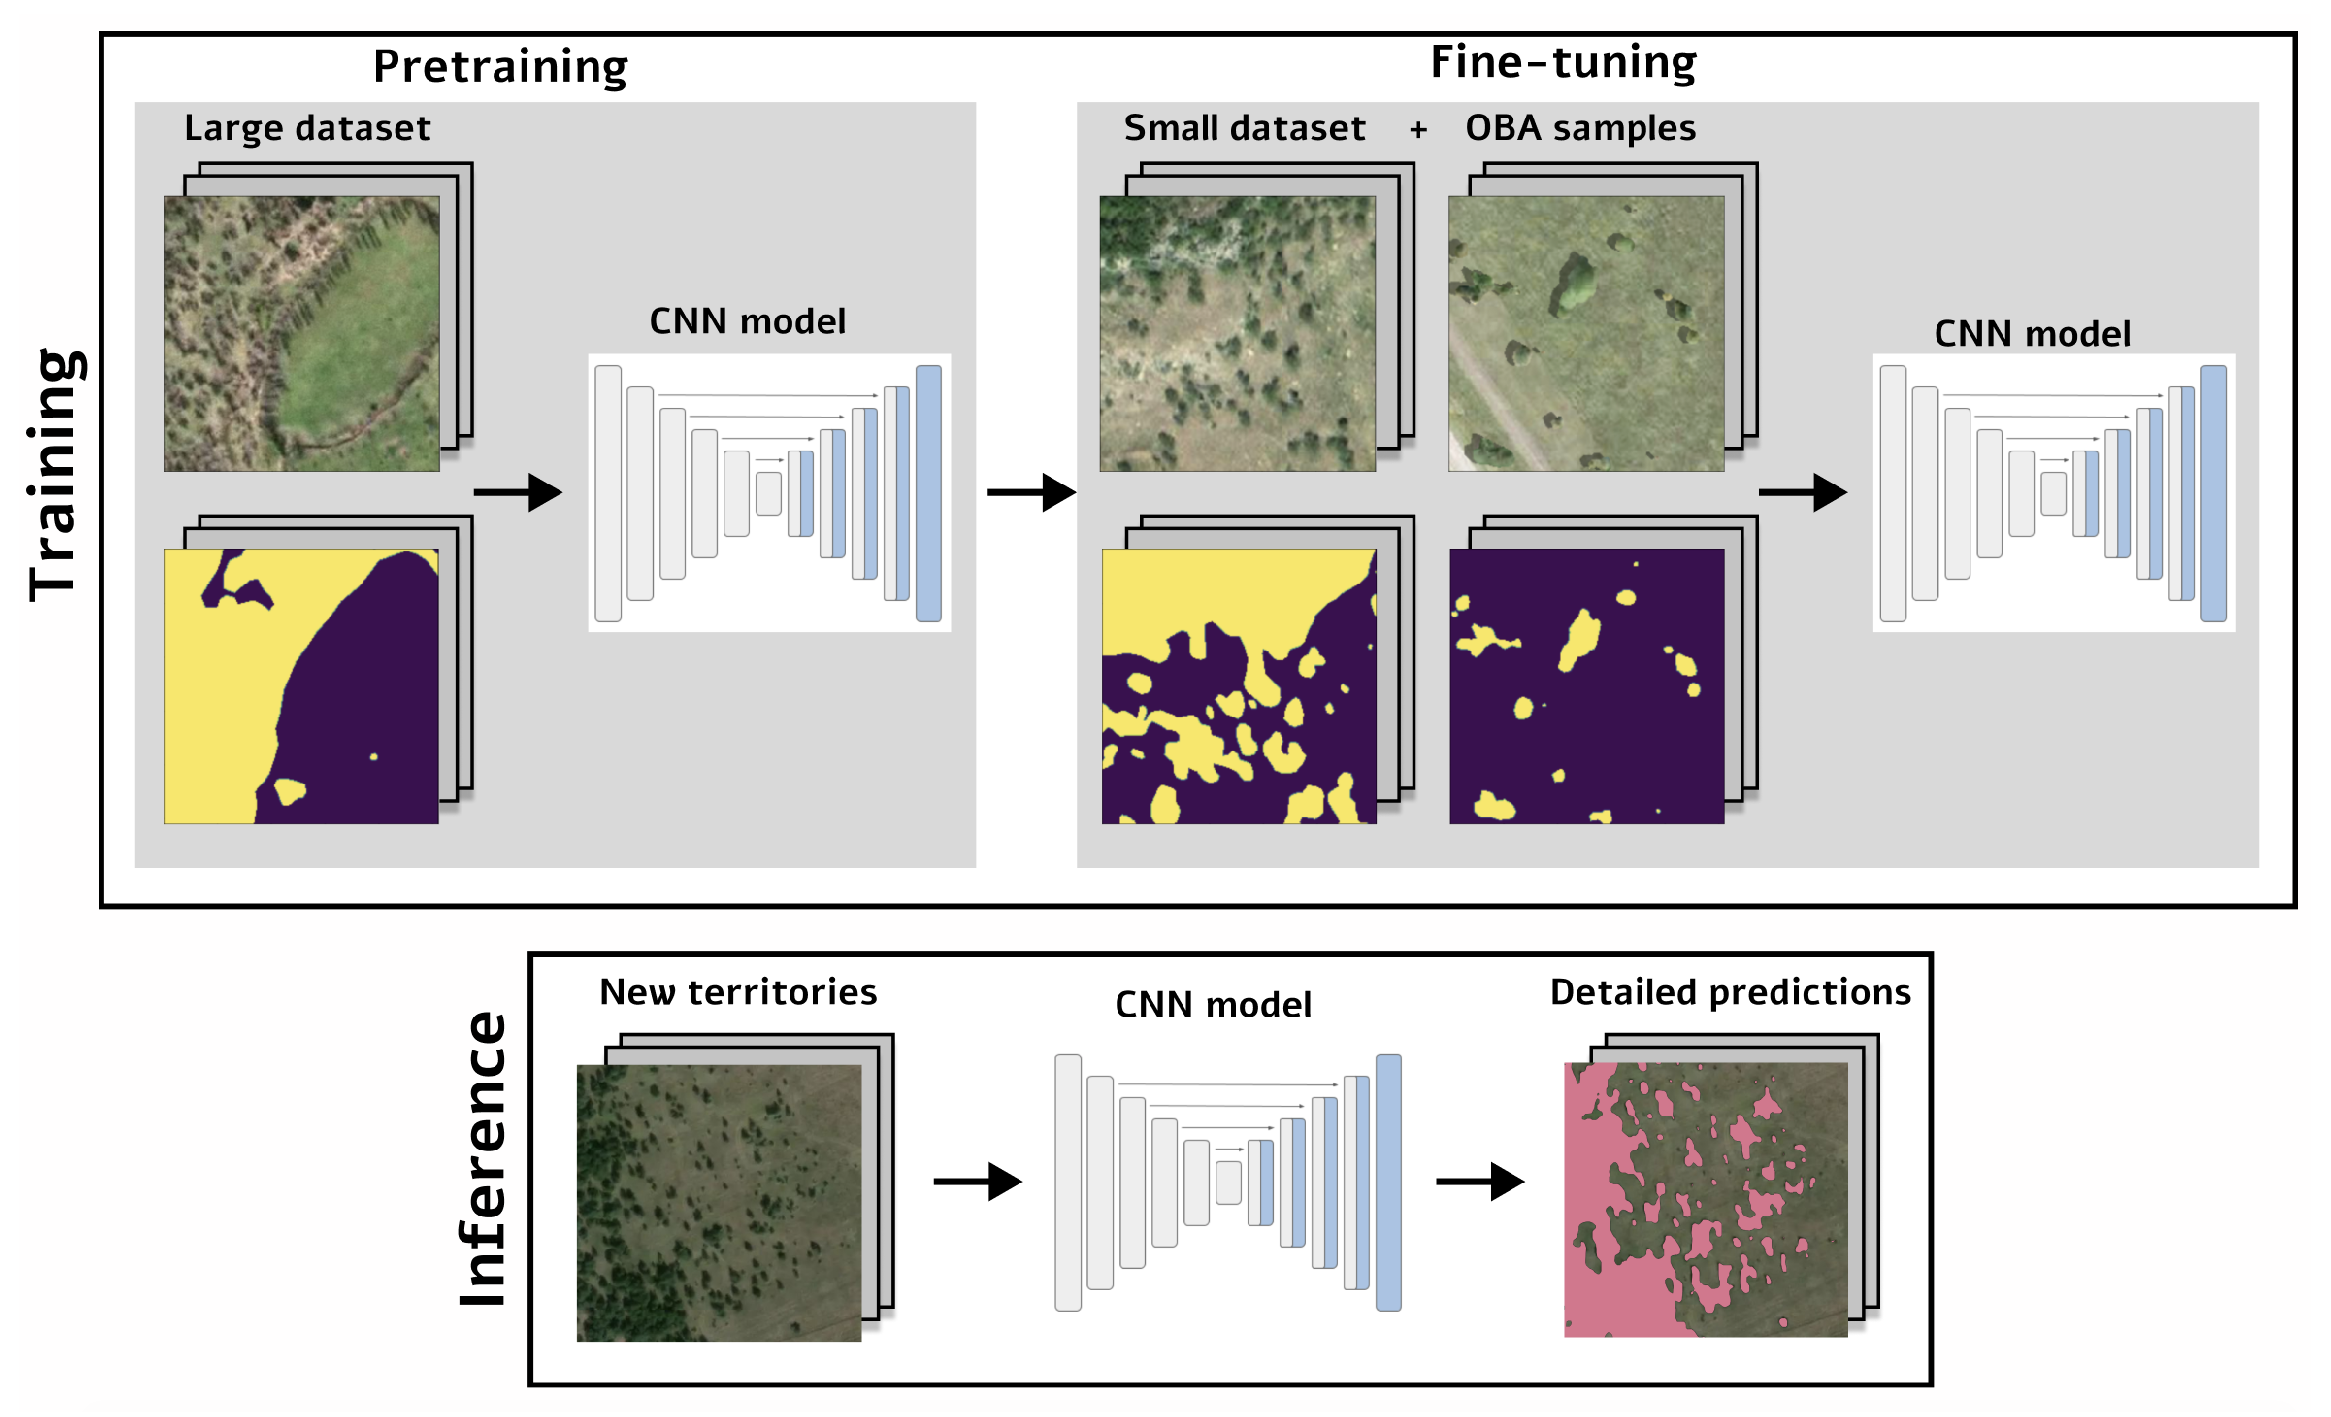
  • We propose and validate a pipeline for detailed forest mask segmentation using CNN
  • We provide an open-access tool for detailed forest mask segmentation that can be used for environmental studies, which is available in an SAAS platform through the link provided [31].
The paper is organized as follows: Section 2 describes the characteristics of the datasets used in the present study and the methodology of the proposed solution and validation approach; Section 3 shows the obtained detailed tree maps and compares them with the baseline maps; Section 4 presents concluding remarks and plans for the possible future development of the developed methodology.

2. Materials and Methods

In this study, we considered two datasets. The first was large and lacking in precision markup for small details, while the second represented a smaller area with each individual tree presented in markup.

2.1. Large Dataset

For the large dataset, we collected data covering more than 500.000 hectares. The study area was located in the Republic of Tatarstan, Russia. There were about 45 % hectares of forest and 65 % hectares covered by other landcover types (lawns, fields, etc.) and manmade objects (roads and buildings). We used a cloud-free composite orthophotomap provided by mapbox [32] via tile-based map service. The imagery was derived from different satellite images obtained by the WorldView satellites series, consisting of three pansharpened spectral channels (RGB). The spatial resolution was about 0.5 m per pixel, depending on the observation latitude. All images were taken during the summer period in 2018. The manual markup for this region was produced based on the aforementioned images. It was first presented in a vector GEOJSON format (as polygons coordinates), then converted into georeferenced rasters (binary masks) with spatial resolutions equal to the satellite data resolution. The study area was split into training, validation, and testing regions at a respective proportion of 70 % , 15 % , 15 % .

2.2. Detailed Small Dataset

We used a high-quality small dataset with precision individual tree masks for an area in Dagestan, Russia. The environmental conditions differ from the large dataset territory in that sandy surfaces partially cover the area. The manual markup was performed for satellite images from the mapbox basemap service, with an acquisition date in the summer period of the 2020. The spatial resolution properties of satellite images were the same as for the large dataset. The entire area was 4.000 hectares, of which approximately 40 % was forest cover. The final forest mask was presented in both raster (binary mask) and vector (polygon coordinates) format. The number of individual trees in the training dataset with an area smaller than 300 pixels was 6387. The test area included more than 2000 individual trees. Each subset was represented by the individual image and area.
Our solution for forest segmentation included two consecutive steps, which are shown in Figure 1. The first was model training on the large dataset in order to learn important feature representation. Then, the model was fine-tuned on the smaller and more detailed dataset that was preprocessed with an object-based augmentation technique.

2.3. Baseline Forest Segmentation

For the baseline forest segmentation, we used a large dataset. Training samples were cropped randomly from the entire study territory. Standard color and geometrical transformations (random rotation, brightness, contrast, saturation adjustment, etc.) were implemented for each sample. A neural network was trained to identify pixels belonging to the class “forest” by minimizing the binary cross-entropy loss function
L ( y , y ^ ) = 1 N i = 1 N y i l o g ( y i ^ ) + ( 1 y i ) l o g ( 1 y i ^ ) ,
where N is the number of target mask pixels, y is the target mask, and y ^ is the model prediction. For the baseline forest segmentation we used the following implementations of the CNNs: UNet [33], FPN [34], and DeepLab [35]. The details of CNN training are discussed in Section 2.6. Model implementation was based on the repository in [36].

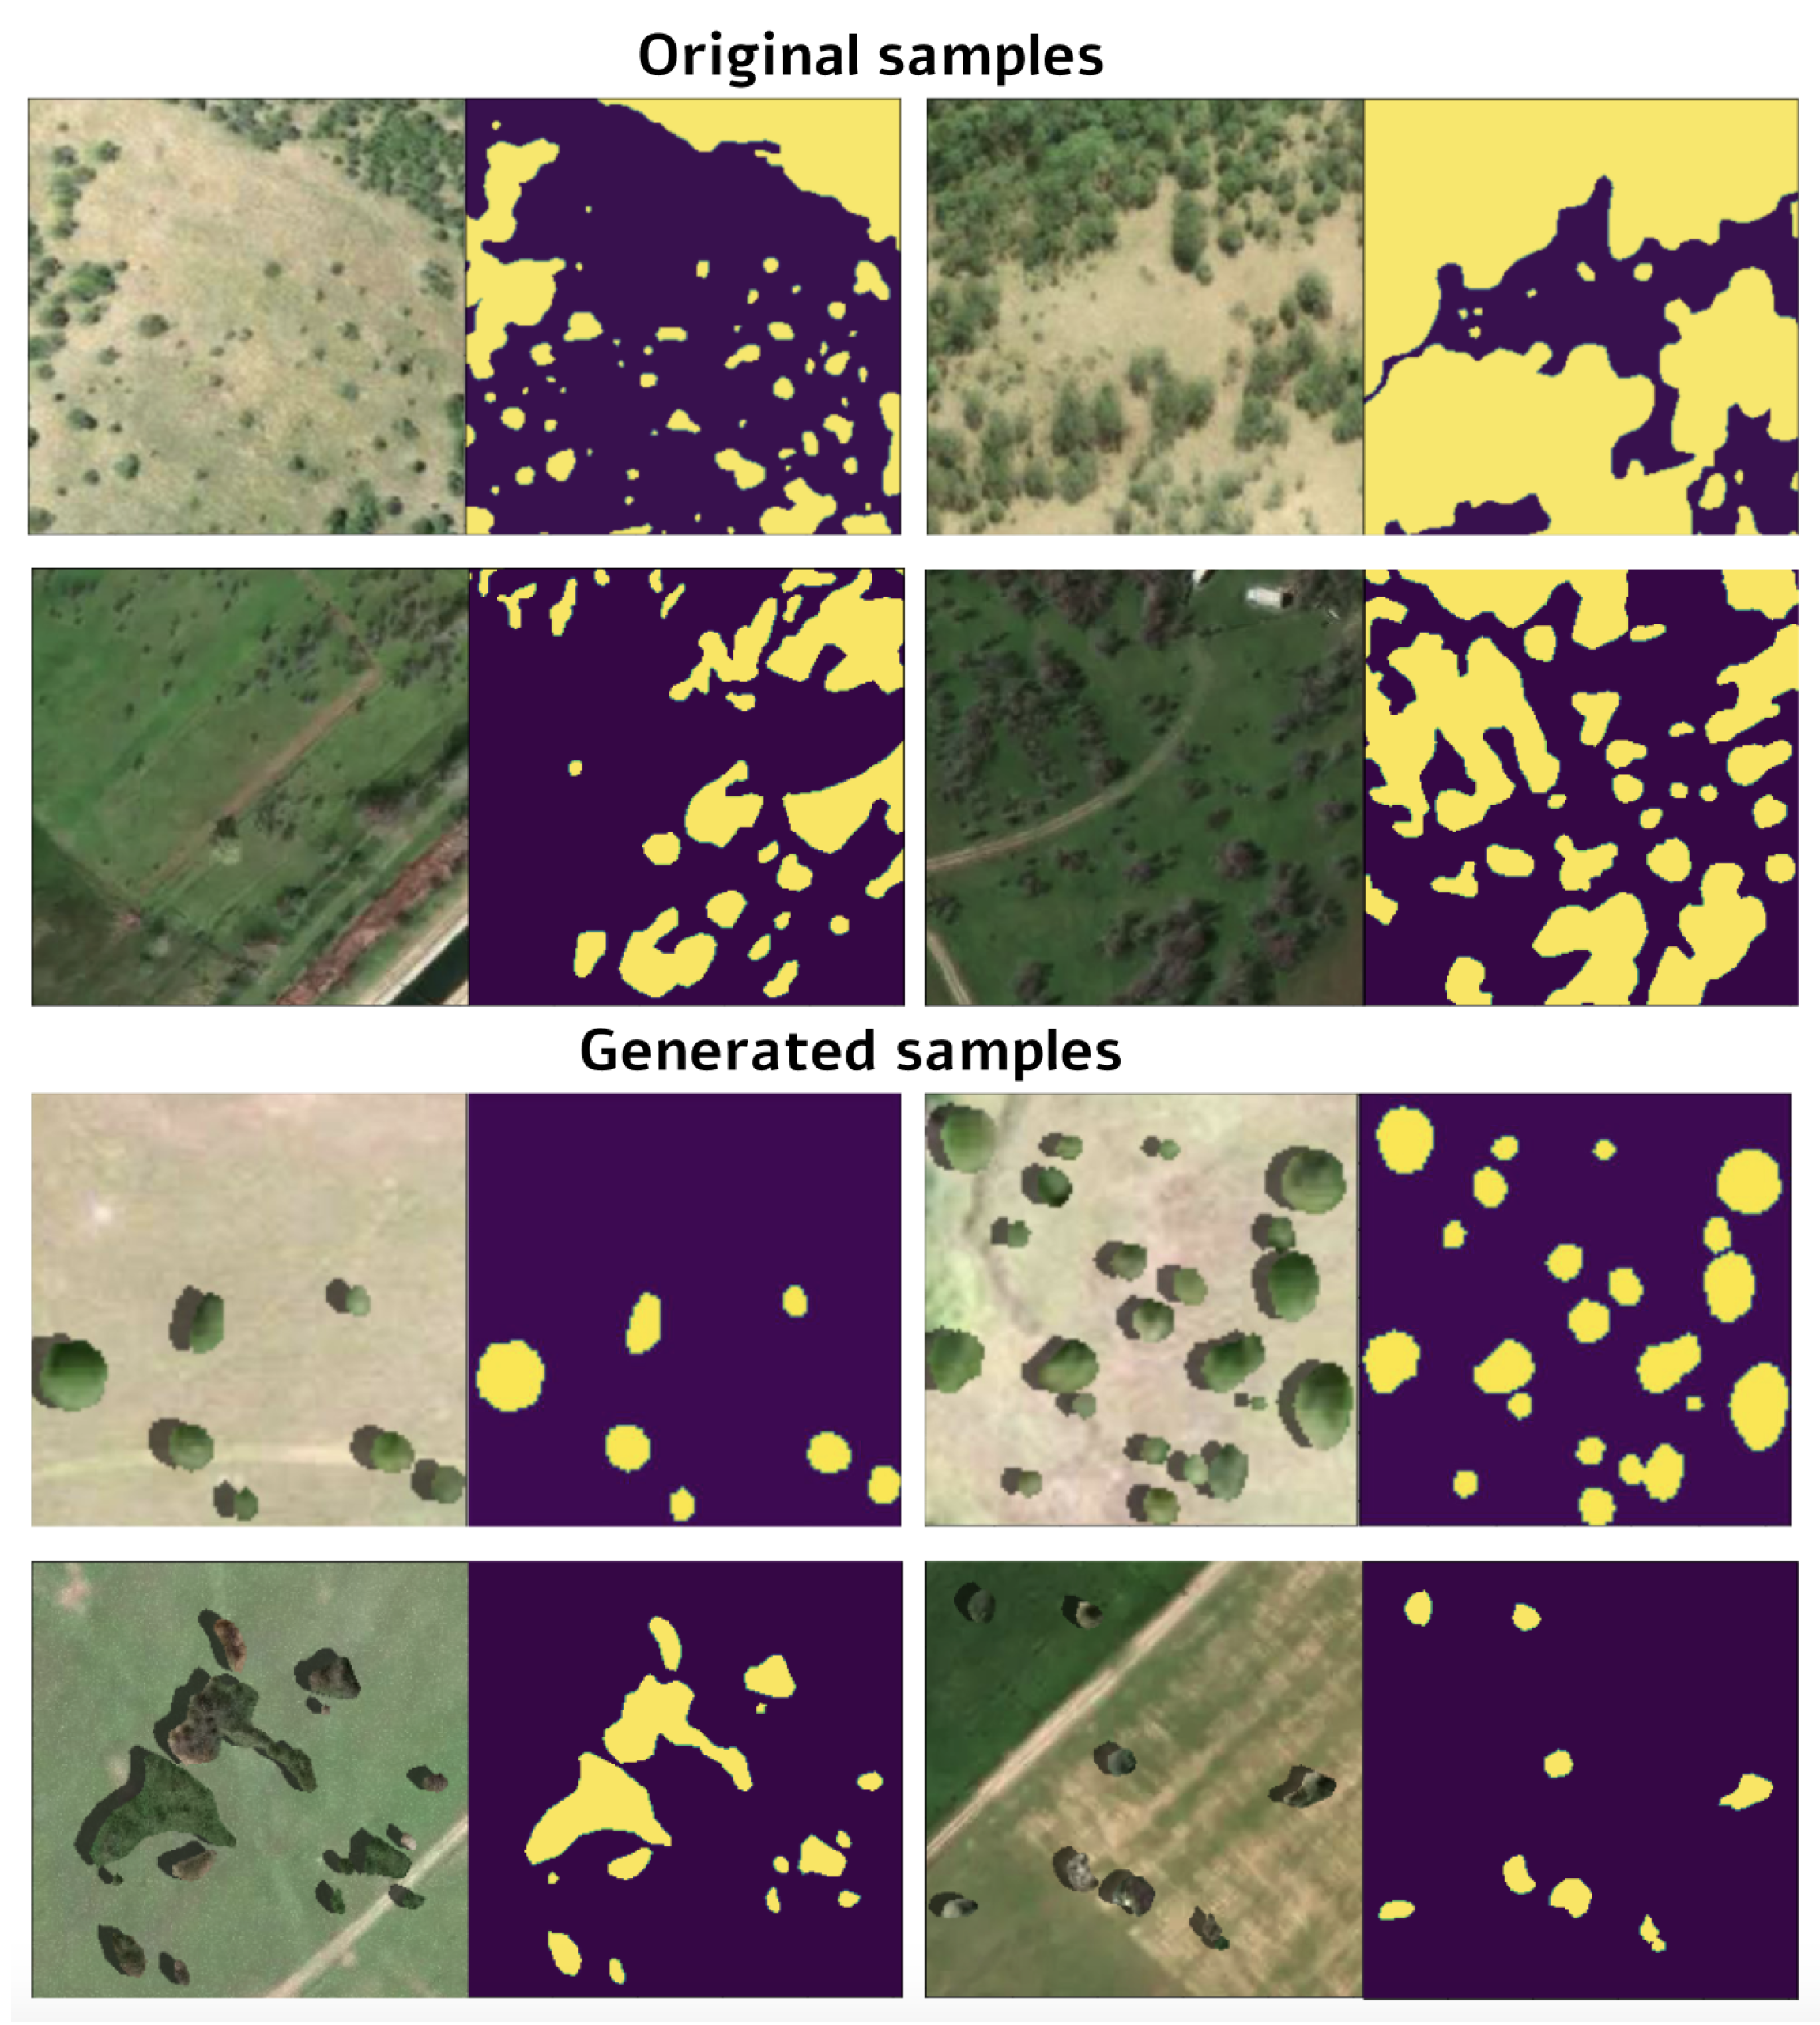
2.4. Object-Based Augmentation

After baseline training, we fine-tuned the model using a small dataset and the following augmentation approach.
The object-based augmentation approach has been previously proposed for the remote sensing domain in [37] for solving segmentation tasks. For the forest segmentation problem, we provided the following augmentation scheme, the algoritmic implementation of which can be found at the following link [38]. The initial detailed markup included both large areas and individual tree masks. In the first stage, we created a list of individual trees selected by the area according to the threshold. The threshold was established empirically and was equal to 300 pixels. Selected individual trees were ascribed IDs associated with coordinates and instance masks. During the augmentation step, the object’s ID was selected. The object (individual tree) was cropped according to its boundary. Then, shadows were added to make the generated sample more realistic. The footprint of an object was used to add a shadow. The contrast and saturation of shadows were varied in order to extend the variability of the training instances. Moreover, each individual tree could be augmented using classical color and geometrical transformations. For this task, the Albumentations package [39] was leveraged. The cropped and transformed individual trees were then merged with a new background. The background was randomly selected from the initial satellite image or from new images from another geographical location. The main requirement for the background crop was the absence of the target objects. The selected background patch was augmented using geometrical and color transformations. The final step of new training sample generation was background and target object merging. A number of objects was selected randomly for each patch from a predefined range. The maximum number was defined empirically and set to 30 according to the patch size and target object size. Intersection between the objects was restricted. It is possible that a neural network can fit exactly against generated data and lose essential properties of the original images. To avoid this, we used generated samples with a probability of 0.4 and original samples with a probability of 0.6 . Both the original and generated samples were prepared during the training time and did not require extra memory to store patches. Examples of the generated and original samples are presented in Figure 2.
The OBA approach was compared with two alternative approaches, namely, classical augmentation (random rotation, brightness, contrast, saturation adjustment) as described in [37] (Simple_augm) and training without any image transformations (Baseline_no_augm).
Object-wise sampling was performed for all experiments with model fine-tuning on the small dataset, as this is a more powerful sampling technique for spatially distributed data in the remote sensing domain, especially in the case of target objects with coordinates [40]. In this approach, instead of cropping random patches from an image the target objects’ IDs were selected and then cropped according to their coordinates. This allowed us to form a training batch for a convolutional neural network with more valuable instances when target objects such as individual trees were rare in the study area and unevenly distributed. Object-wise sampling was alternated with a classical random cropping in order not to preserve only small objects in the training data. The probability of the object-wise sampling was set to 0.8 .

2.5. Different Dataset Size

We considered the following subsets of the training dataset in order to evaluate the effect of the dataset’s size on the prediction quality: the entire dataset size, 2/3, and 1/3 of the entire training dataset. The chosen subset was used to train the model, while the testing area was permanent and the same for all experiments. We analyzed three and two different dataset splits for the experiments with 1/3 and 2/3 of the entire dataset size, respectively. The final results were defined as an average for each training subset.

2.6. Experimental Setup

For the baseline model, we considered the following convolutional neural network architectures: U-Net [33], DeepLab [35], and FPN [34] with Inception [41] encoder. Each experiment was run with the same training parameters. The batch size was equal to 20, and the patch size was set to 256 256 pixels. There were 20 epochs with 200 steps. For each epoch, there were 4000 random patches (with size 256 256 pixels) obtained using object-wise sampling or classical random cropping from the training areas. After each epoch, the validation score was estimated. Early stopping was employed after the model reached the plateau with patience 5 epochs. According to the validation score, the best model was then considered in order to compute metrics in the test area. The RMSprop optimizer was used, with a learning rate of 0.001 . All experiments used Keras [42].
According to the previous stage, the best model among all considered architectures was employed for fine-tuning on the small dataset. The same training parameters (patch and batch sizes, training epochs number, etc.) were employed. As distinct from the first stage experiments, model weights were already pretrained on the large dataset. Therefore, the model was trained to solve individual tree segmentation and detailed forest mask prediction, which is a more complicated task.

2.7. Evaluation

To evaluate the performance of the proposed models we used the general F 1 - s c o r e , which is widely used in remote sensing tasks [5]. This allowed us to assess prediction quality for the entire test area. This metric is more focused on huge territories with forest cover.
P r e c i s i o n = T P T P + F P R e c a l l = T P T P + F N F 1 = T P T P + 1 2 ( F P + F N )
where T P is True Positive (number of correctly classified pixels of the given class), F P is False Positive (number of pixels classified as the given class while in fact being of another class, and F N is False Negative (number of pixels of the given class missed by the method).
To assess the quality of our model, we estimated the average IoU between the predicted masks and the ground truth masks as follows:
IoU = Area of Overlap Area of Union ,
and Area of Overlap and Area of Union are computed between the ground truth and the predicted masks. In order to predict the forest mask, we used test images as an input for the trained neural network. As an output, a neural network predicts a binary mask, which we compared with the labelled binary mask and used to calculate different metrics. For example, prediction quality ( F 1 - s c o r e ), was calculated for each image in the test set. The overall prediction quality stated for each of the models is the average of the F 1 - s c o r e , for all images in the test set.

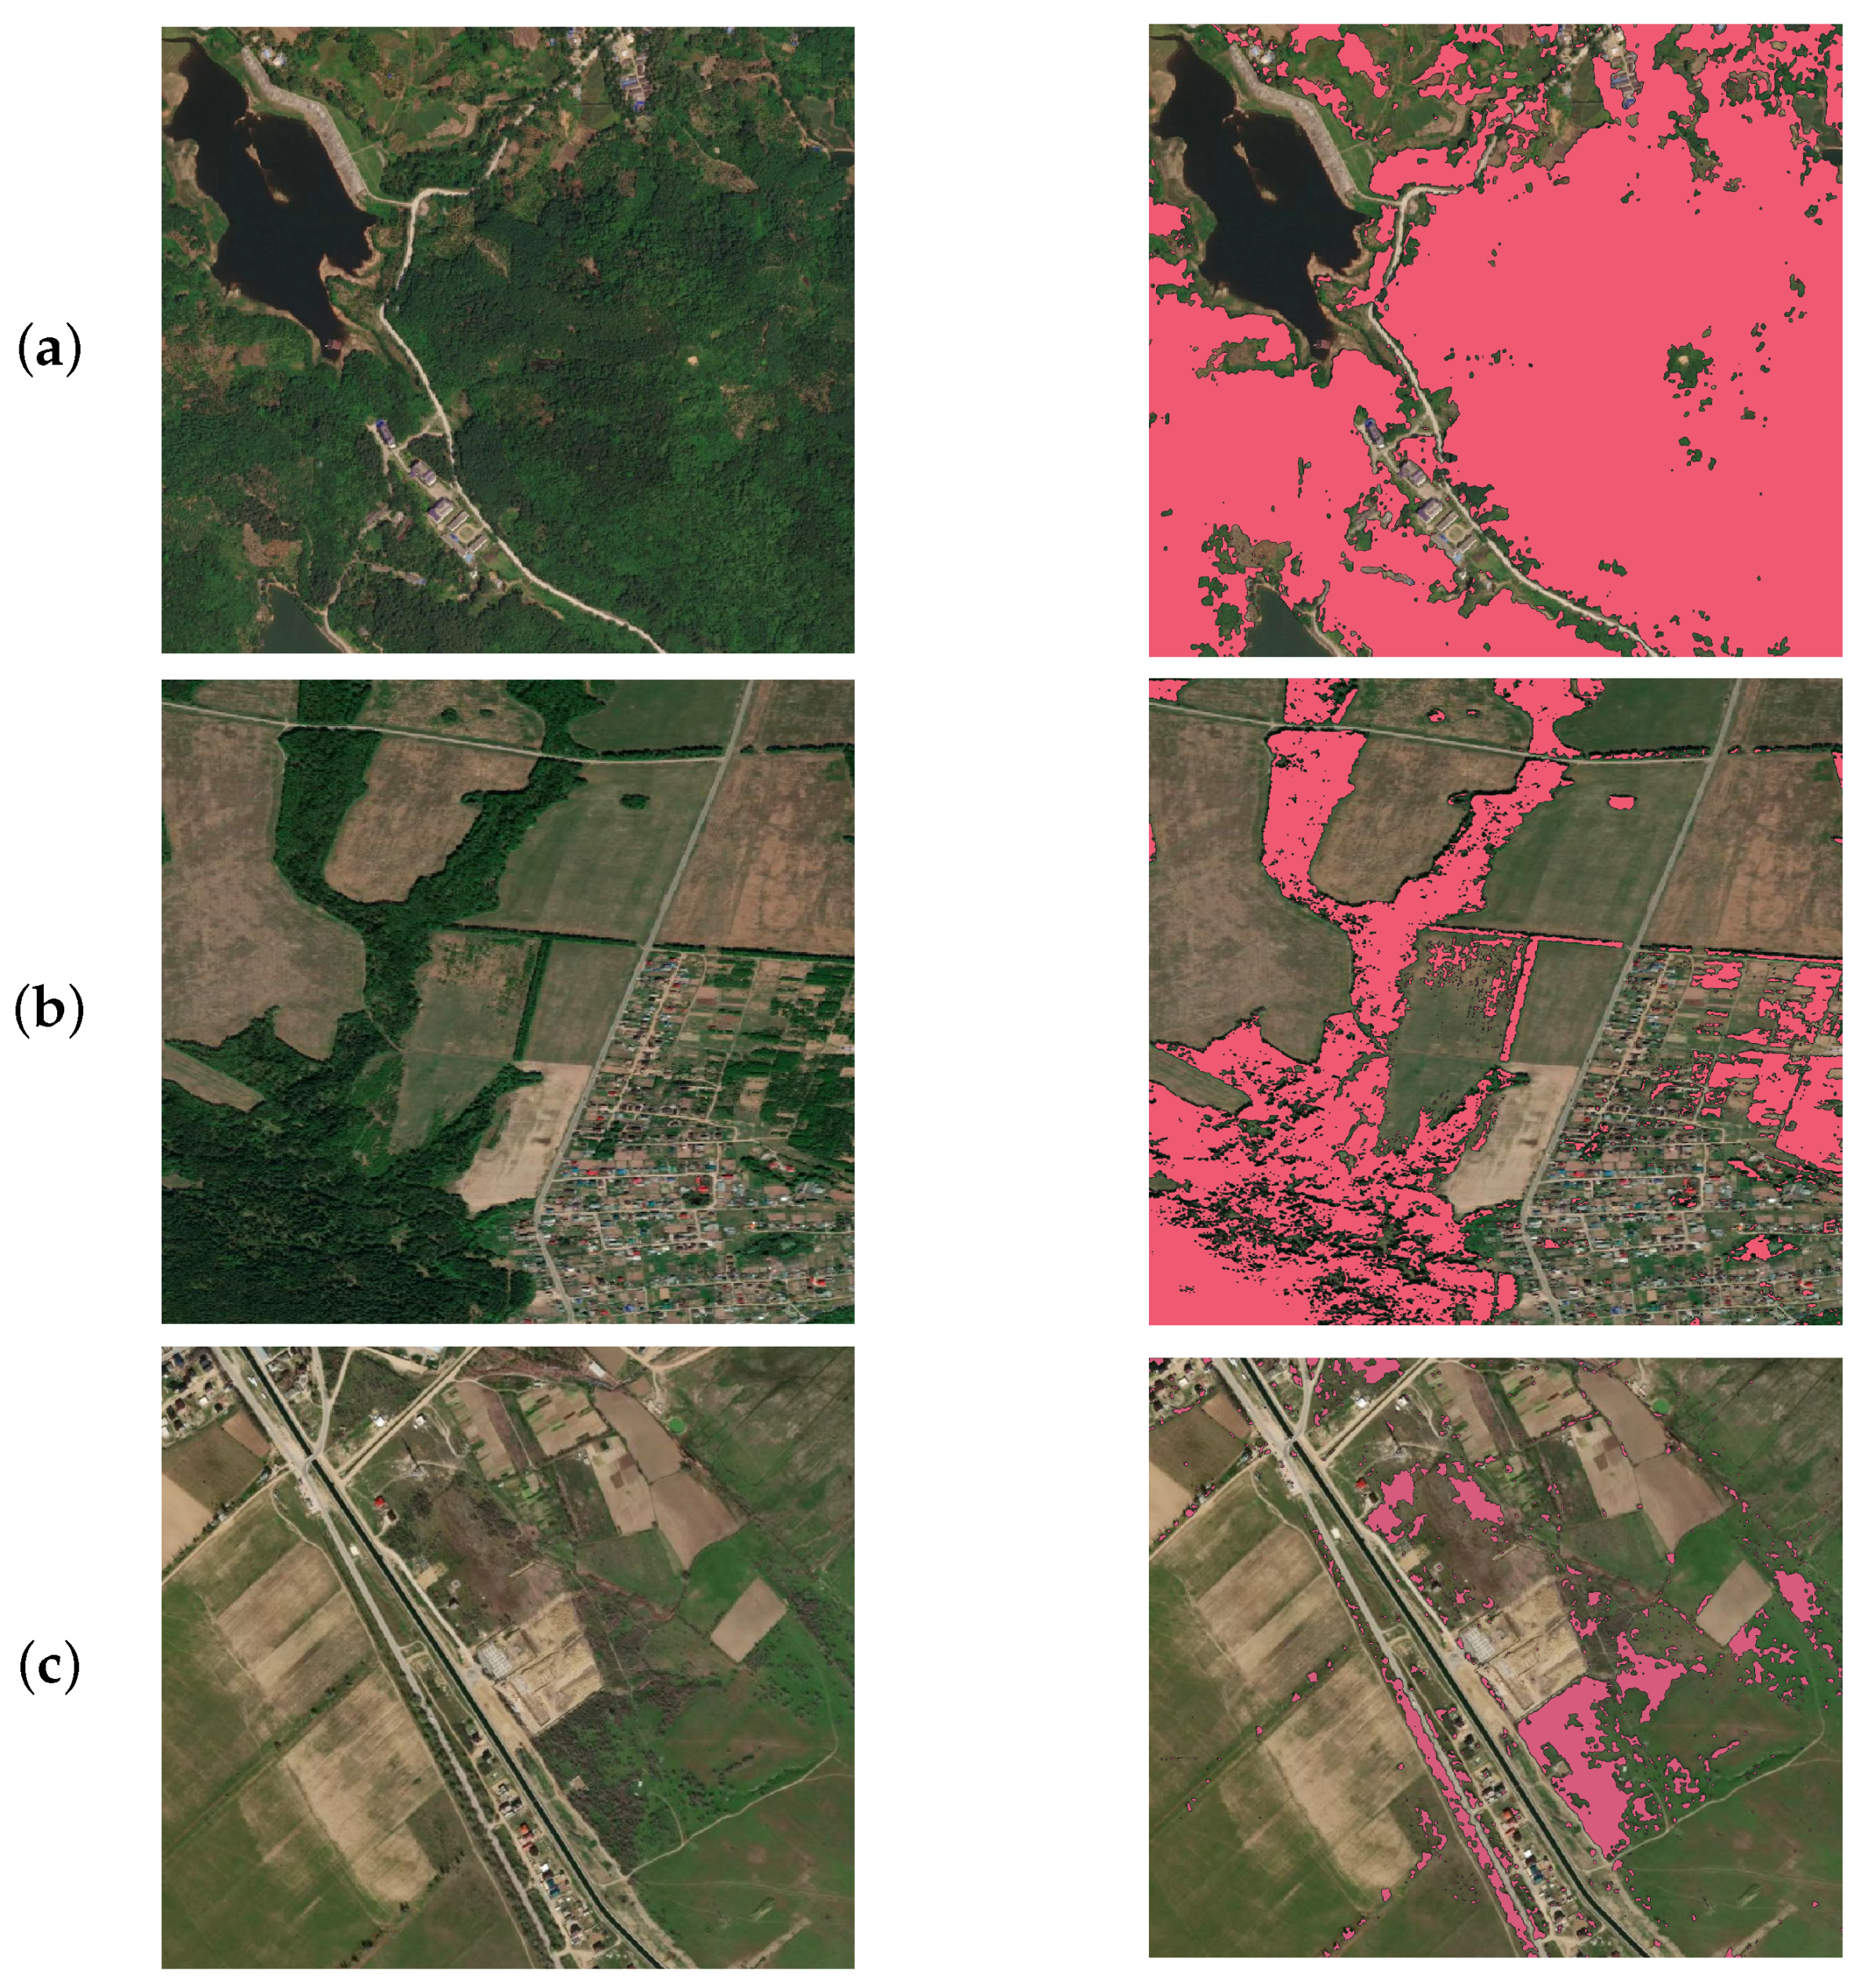
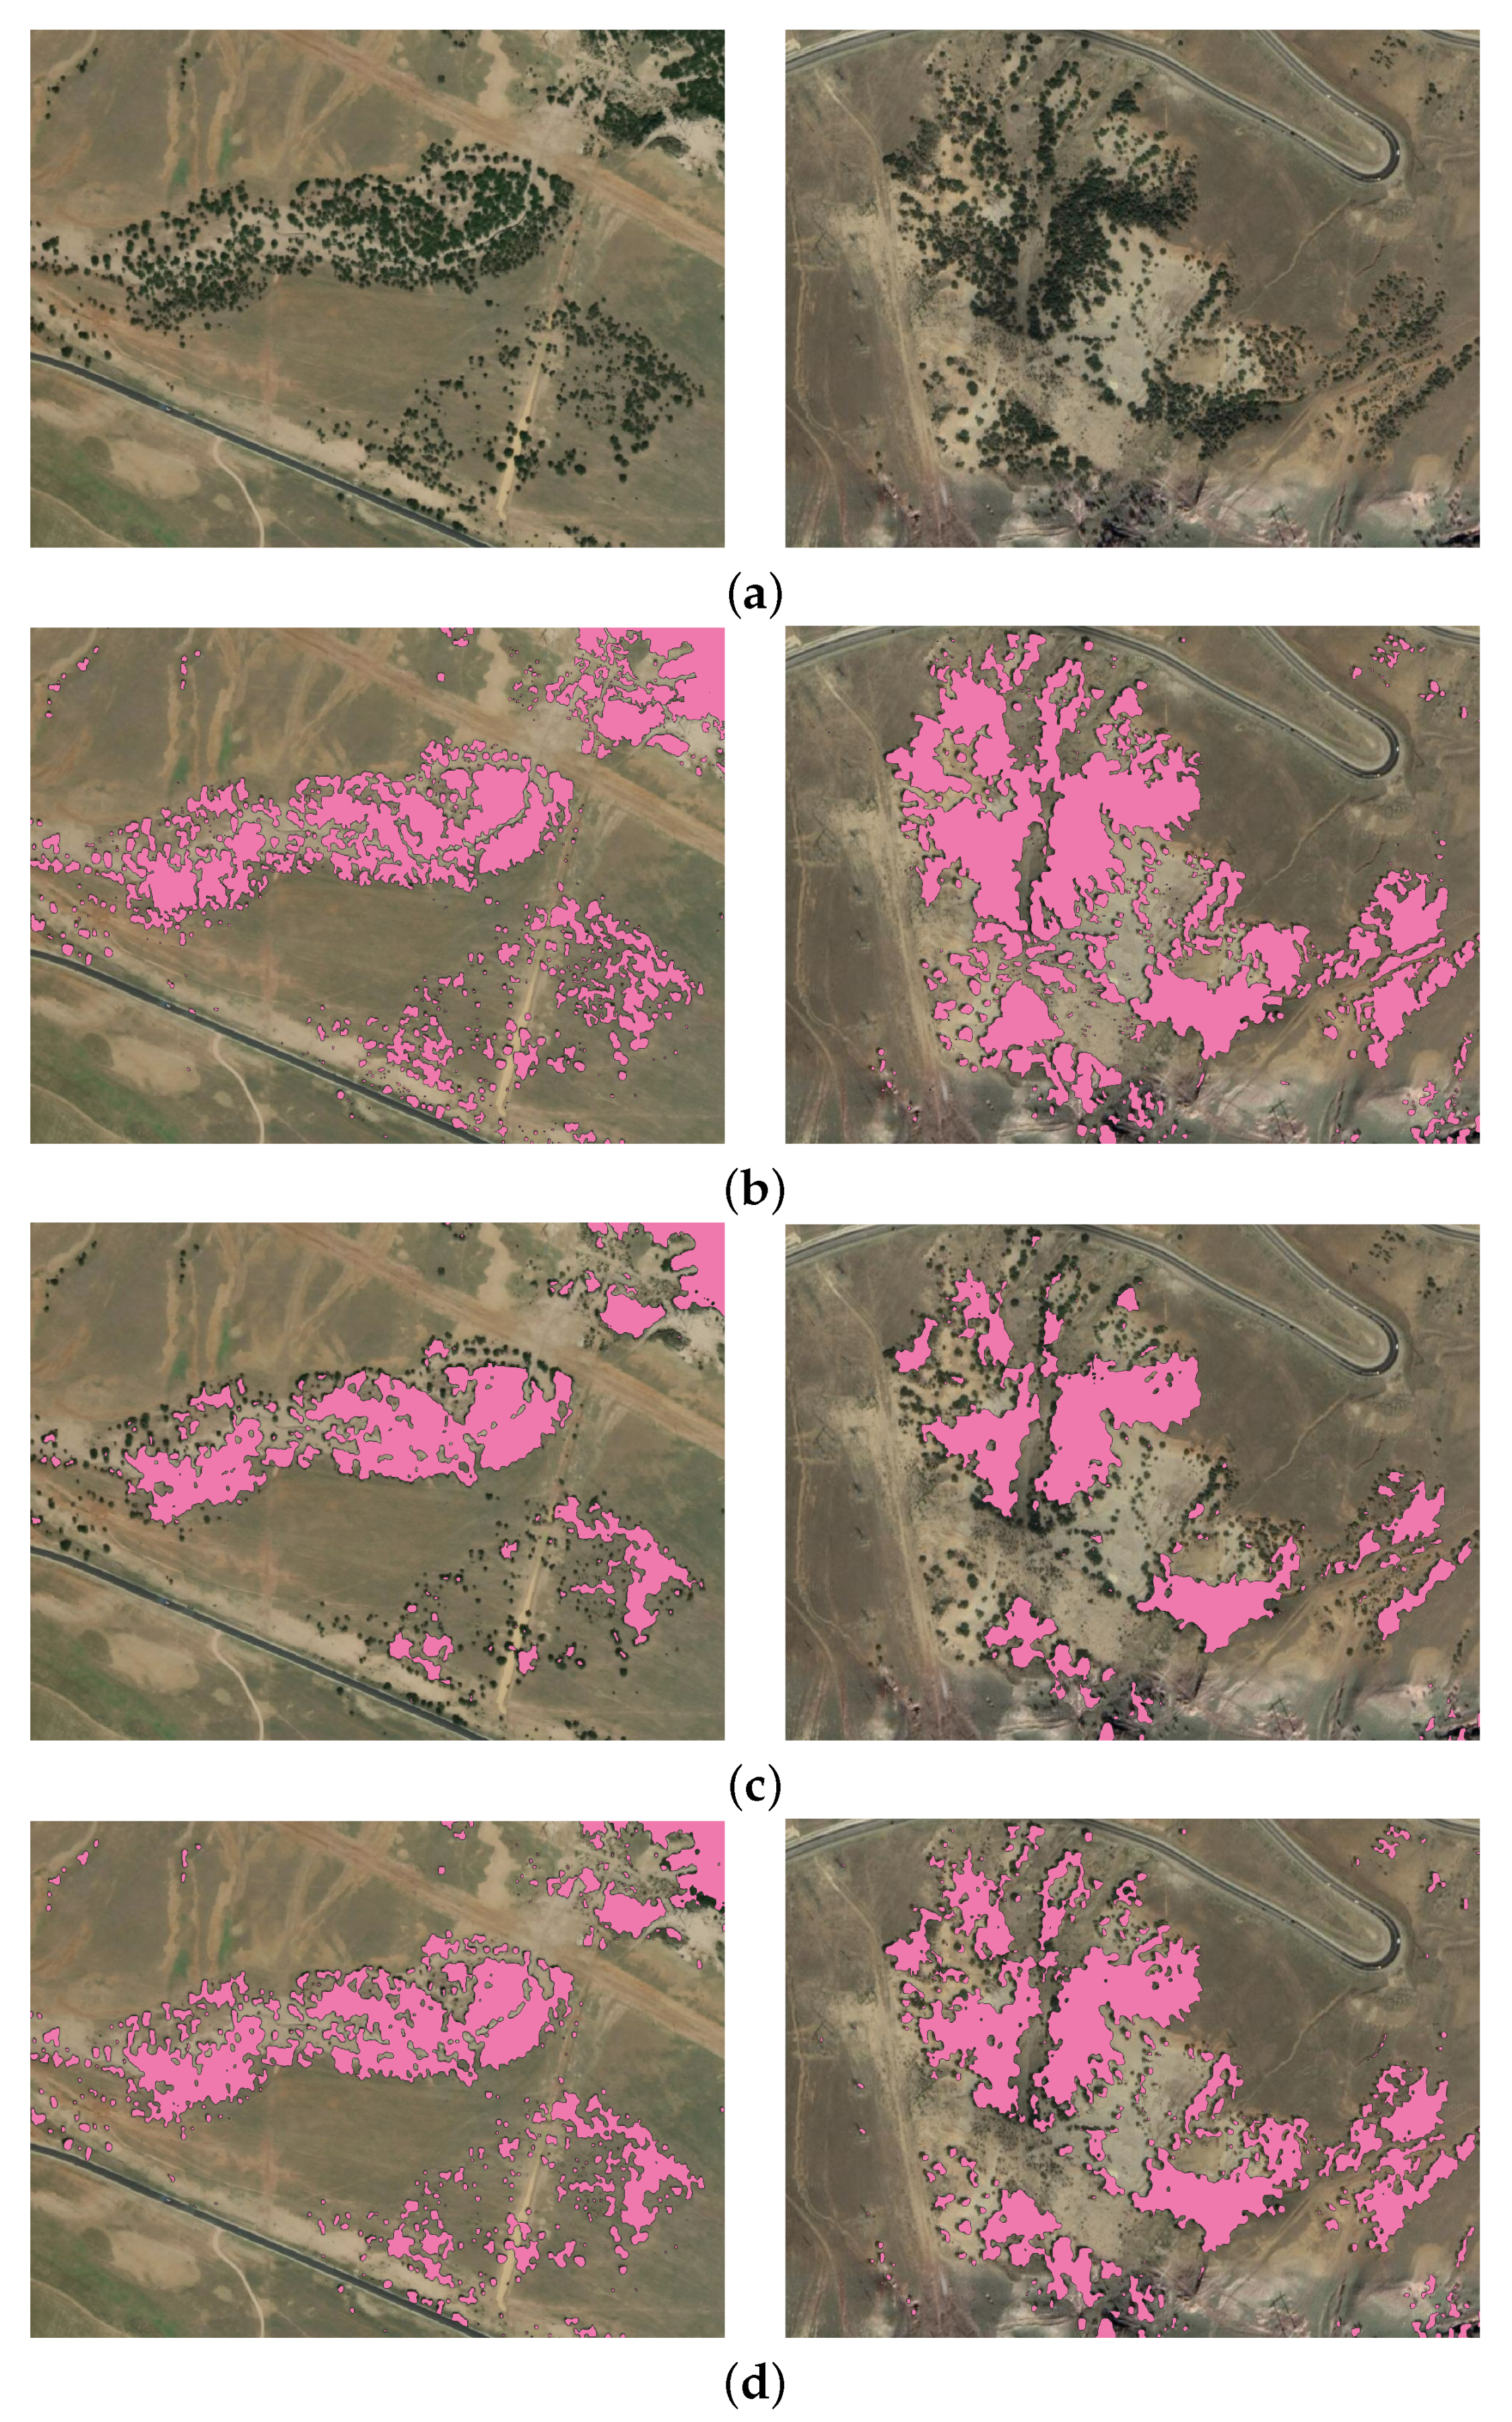
3. Results and Discussion

Figure 3 shows the result of the implementation of the first methodological step, namely, the performance on the test data of the model trained on the large dataset (U-Net). It should be noted that the overall model performance is appropriate in terms of metrics (see Table 1) as well as by visual comparison; moreover, test images were taken from different parts of the world and represent complex environments. However, the model performance could be improved for better detection of stand-alone trees. The results of the model performance after fine-tuning on the small dataset (for which implementation of object-based augmentation was implemented) is shown in Figure 4. For the training procedure, we generated about 72,000 patches for the first dataset and about 28,000 patches for the second dataset. From Figure 4, it can be clearly seen that the predicted forest mask (see Figure 4d) is very similar to the ground truth (see Figure 4b), and the separate trees are much better detected compared to the baseline model (see Figure 4c). The F 1 scores for the baseline and improved models are presented in Table 2, with the best score being F 1 = 0.929 . The prediction quality for the initial large dataset using the fine-tuned model improved ( F 1 = 0.971 ). Moreover, it should be noticed from Table 2 that when using 1/3 of the whole dataset and implementing OBA in the training procedure the F 1 = 0.913 , which is higher than when using the whole dataset for training the baseline model ( F 1 = 0.888 ). This means that our proposed approach is highly relevant in view of the limited amount of high quality labelled remote sensing data.
The proposed approach allows us to obtain more precise results than the forest cover masks available through OSM serves for particular areas. Examples of generated maps are presented in Figure 5 and Figure 6. Available open-access forest masks should be updated regularly to include both newly cultivated forests and tree felling. Although trees within built-up areas can be missed in open-access maps, they are crucial for environmental analysis.
The obtained results confirmed the potential of the OBA approach for environmental studies. One of the promising direction for future study is applying precision forest mask for more accurate deforestation analysis. It can be also used for forest species classification as this task usually requires forest boundaries.
A detailed forest mask can be combined with other landcover classes and man-made objects such as the building segmentation task discussed in [37]. A promising extension of this research could be the implementation of visual transformers [43] for solving segmentation tasks using remote sensing data. The wide potential of implementing a similar augmentation approach coupled with special image collection techniques for synthetic data generation to improve neural network performance has been shown in a recent study [44]. In this study involving segmentation of damage to apples, the authors improved the F1-score by up to 4% compared with common augmentation techniques. The authors used DeepLab as the base model for comparing different augmentation techniques. Despite the demonstrated strength of the proposed method, we should take into account its limitations in processing natural scene images. We should carefully use the different types of trees in order to mix them and create the new scene, and trees and scenes should be taken from approximately one period of the year.
Basemap image use makes this approach cost-effective, and high spatial resolution provides significant features for the CNN-based model at the same time. Therefore, this data type is quite competitive with multispectral satellite images which have wider spectral range at lower spatial resolutions. The OBA approach for small precise datasets can be studied for multispectral images to solve other challenges combining RGB bands and vegetation indexes. For instance, NDVI (Normalized Difference Vegetation Index) for deforestation problems was implemented in [45].

4. Conclusions

High-resolution detailed forest masks are essential for environmental studies. However, in practice such maps are not available for large country-scale territories. Here, we have presented a novel pipeline for forest mask creation using very high spatial resolution basemap RGB images. CNN training included an object-based augmentation approach to achieve more accurate predictions of individual trees and small groups of trees. The created map showed high quality and detalization on various test territories, including in Russia and China. Model prediction showed robustness for regions with complex environmental structures. The provided approach aimed to minimize the need for labeled training data. For the test area used in this study, the F1-score for small details was 0.929 compared with a score of 0.856 for the baseline approach. The created forest mask is now available for large-scale and precise environmental studies as part of the open-access platform. As a possible evolution of the current study, we are planning to implement automated selection of hyperparameters and thresholds for augmentation techniques and to use our approach for solving further tree classification tasks.

Author Contributions

Conceptualization, S.I., D.S., S.S.; methodology, S.I.; software, S.I., A.T.; validation, S.I., V.I., A.T.; formal analysis, S.I., A.T., D.S.; investigation, S.I.; writing—original draft preparation, S.I., D.S.; visualization, S.I., D.S., A.T.; data curation, A.T.; writing—review and editing, S.I., I.O., D.S., V.I., S.S.; supervision, I.O. All authors have read and agreed to the published version of the manuscript.

Funding

This work was supported by the Analytical center under the RF Government (subsidy agreement 000000D730321P5Q0002, Grant No. 70-2021-00145 02.11.2021).

Acknowledgments

The authors acknowledge the use of the Skoltech CDISE supercomputer Zhores [46] in obtaining the results presented in this paper.

Conflicts of Interest

The authors declare no conflict of interest.

References

  1. Cheng, X.; Yu, J. RetinaNet with Difference Channel Attention and Adaptively Spatial Feature Fusion for Steel Surface Defect Detection. IEEE Trans. Instrum. Meas. 2020, 70, 1–11. [Google Scholar] [CrossRef]
  2. Shan, Y.; Yao, X.; Lin, H.; Zou, X.; Huang, K. Lidar-Based Stable Navigable Region Detection for Unmanned Surface Vehicles. IEEE Trans. Instrum. Meas. 2021, 70, 1–13. [Google Scholar] [CrossRef]
  3. Yu, J.; Peng, X.; Li, S.; Lu, Y.; Ma, W. A Lightweight Ship Detection Method in Optical Remote Sensing Image under Cloud Interference. In Proceedings of the 2021 IEEE International Instrumentation and Measurement Technology Conference (I2MTC), Glasgow, UK, 17–20 May 2021; IEEE: Piscataway, NJ, USA, 2021; pp. 1–6. [Google Scholar]
  4. Angelini, M.G.; Costantino, D.; Di Nisio, A. ASTER image for environmental monitoring Change detection and thermal map. In Proceedings of the 2017 IEEE International Instrumentation and Measurement Technology Conference (I2MTC), Turin, Italy, 22–25 May 2017; IEEE: Piscataway, NJ, USA, 2017; pp. 1–6. [Google Scholar]
  5. Kattenborn, T.; Leitloff, J.; Schiefer, F.; Hinz, S. Review on Convolutional Neural Networks (CNN) in vegetation remote sensing. ISPRS J. Photogramm. Remote Sens. 2021, 173, 24–49. [Google Scholar] [CrossRef]
  6. Illarionova, S.; Trekin, A.; Ignatiev, V.; Oseledets, I. Neural-Based Hierarchical Approach for Detailed Dominant Forest Species Classification by Multispectral Satellite Imagery. IEEE J. Sel. Top. Appl. Earth Obs. Remote Sens. 2020, 14, 1810–1820. [Google Scholar] [CrossRef]
  7. Nevavuori, P.; Narra, N.; Lipping, T. Crop yield prediction with deep convolutional neural networks. Comput. Electron. Agric. 2019, 163, 104859. [Google Scholar] [CrossRef]
  8. Hirschmugl, M.; Deutscher, J.; Sobe, C.; Bouvet, A.; Mermoz, S.; Schardt, M. Use of SAR and optical time series for tropical forest disturbance mapping. Remote Sens. 2020, 12, 727. [Google Scholar] [CrossRef] [Green Version]
  9. Li, H.; Hu, B.; Li, Q.; Jing, L. CNN-Based Tree Species Classification Using Airborne Lidar Data and High-Resolution Satellite Image. In Proceedings of the IGARSS 2020–2020 IEEE International Geoscience and Remote Sensing Symposium, Waikoloa, HI, USA, 26 September–2 October 2020; IEEE: Piscataway, NJ, USA, 2020; pp. 2679–2682. [Google Scholar]
  10. Malinowski, R.; Lewiński, S.; Rybicki, M.; Gromny, E.; Jenerowicz, M.; Krupiński, M.; Nowakowski, A.; Wojtkowski, C.; Krupiński, M.; Krätzschmar, E.; et al. Automated production of a land cover/use map of Europe based on Sentinel-2 imagery. Remote Sens. 2020, 12, 3523. [Google Scholar] [CrossRef]
  11. Flores-Martínez, J.J.; Martínez-Pacheco, A.; Rendón-Salinas, E.; Rickards, J.; Sarkar, S.; Sánchez-Cordero, V. Recent forest cover loss in the core zones of the Monarch Butterfly Biosphere Reserve in Mexico. Front. Environ. Sci. 2019, 7, 167. [Google Scholar] [CrossRef]
  12. Thomas, N.; Baltezar, P.; Lagomasino, D.; Stovall, A.; Iqbal, Z.; Fatoyinbo, L. Trees outside forests are an underestimated resource in a country with low forest cover. Sci. Rep. 2021, 11, 7919. [Google Scholar] [CrossRef]
  13. Malkoç, E.; Rüetschi, M.; Ginzler, C.; Waser, L.T. Countrywide mapping of trees outside forests based on remote sensing data in Switzerland. Int. J. Appl. Earth Obs. Geoinf. 2021, 100, 102336. [Google Scholar] [CrossRef]
  14. Qiu, Z.; Feng, Z.K.; Wang, M.; Li, Z.; Lu, C. Application of UAV photogrammetric system for monitoring ancient tree communities in Beijing. Forests 2018, 9, 735. [Google Scholar] [CrossRef] [Green Version]
  15. D’Amico, G.; Vangi, E.; Francini, S.; Giannetti, F.; Nicolaci, A.; Travaglini, D.; Massai, L.; Giambastiani, Y.; Terranova, C.; Chirici, G. Are we ready for a National Forest Information System? State of the art of forest maps and airborne laser scanning data availability in Italy. IForest-Biogeosci. For. 2021, 14, 144. [Google Scholar] [CrossRef]
  16. Otero, V.; Van De Kerchove, R.; Satyanarayana, B.; Martínez-Espinosa, C.; Fisol, M.A.B.; Ibrahim, M.R.B.; Sulong, I.; Mohd-Lokman, H.; Lucas, R.; Dahdouh-Guebas, F. Managing mangrove forests from the sky: Forest inventory using field data and Unmanned Aerial Vehicle (UAV) imagery in the Matang Mangrove Forest Reserve, peninsular Malaysia. For. Ecol. Manag. 2018, 411, 35–45. [Google Scholar] [CrossRef]
  17. Karlson, M.; Reese, H.; Ostwald, M. Tree crown mapping in managed woodlands (parklands) of semi-arid West Africa using WorldView-2 imagery and geographic object based image analysis. Sensors 2014, 14, 22643–22669. [Google Scholar] [CrossRef] [PubMed]
  18. Wagner, F.H.; Sanchez, A.; Aidar, M.P.; Rochelle, A.L.; Tarabalka, Y.; Fonseca, M.G.; Phillips, O.L.; Gloor, E.; Aragao, L.E. Mapping Atlantic rainforest degradation and regeneration history with indicator species using convolutional network. PLoS ONE 2020, 15, e0229448. [Google Scholar] [CrossRef] [PubMed] [Green Version]
  19. Marx, A.; Tetteh, G.O. A forest vitality and change monitoring tool based on RapidEye imagery. IEEE Geosci. Remote Sens. Lett. 2017, 14, 801–805. [Google Scholar] [CrossRef]
  20. Miettinen, J.; Stibig, H.J.; Achard, F. Remote sensing of forest degradation in Southeast Asia—Aiming for a regional view through 5–30 m satellite data. Glob. Ecol. Conserv. 2014, 2, 24–36. [Google Scholar] [CrossRef]
  21. Hansen, M.C.; Shimabukuro, Y.E.; Potapov, P.; Pittman, K. Comparing annual MODIS and PRODES forest cover change data for advancing monitoring of Brazilian forest cover. Remote Sens. Environ. 2008, 112, 3784–3793. [Google Scholar] [CrossRef]
  22. Terra & Aqua Moderate Resolution Imaging Spectroradiometer (MODIS). Available online: https://modis.gsfc.nasa.gov/about/ (accessed on 20 November 2021).
  23. Fernandez-Carrillo, A.; de la Fuente, D.; Rivas-Gonzalez, F.; Franco-Nieto, A. A Sentinel-2 unsupervised forest mask for European sites. In Proceedings of the Earth Resources and Environmental Remote Sensing/GIS Applications X. International Society for Optics and Photonics, Strasbourg, France, 9–12 September 2019; Volume 11156, p. 111560Y. [Google Scholar]
  24. Mondal, P.; McDermid, S.S.; Qadir, A. A reporting framework for Sustainable Development Goal 15: Multi-scale monitoring of forest degradation using MODIS, Landsat and Sentinel data. Remote Sens. Environ. 2020, 237, 111592. [Google Scholar] [CrossRef]
  25. Reiche, J.; Hamunyela, E.; Verbesselt, J.; Hoekman, D.; Herold, M. Improving near-real time deforestation monitoring in tropical dry forests by combining dense Sentinel-1 time series with Landsat and ALOS-2 PALSAR-2. Remote Sens. Environ. 2018, 204, 147–161. [Google Scholar] [CrossRef]
  26. Ganz, S.; Adler, P.; Kändler, G. Forest Cover Mapping Based on a Combination of Aerial Images and Sentinel-2 Satellite Data Compared to National Forest Inventory Data. Forests 2020, 11, 1322. [Google Scholar] [CrossRef]
  27. Pałaś, K.W.; Zawadzki, J. Sentinel-2 Imagery Processing for Tree Logging Observations on the Białowieża Forest World Heritage Site. Forests 2020, 11, 857. [Google Scholar] [CrossRef]
  28. Bragagnolo, L.; da Silva, R.V.; Grzybowski, J.M.V. Amazon forest cover change mapping based on semantic segmentation by U-Nets. Ecol. Informat. 2021, 62, 101279. [Google Scholar] [CrossRef]
  29. Chen, B.; Xiao, X.; Li, X.; Pan, L.; Doughty, R.; Ma, J.; Dong, J.; Qin, Y.; Zhao, B.; Wu, Z.; et al. A mangrove forest map of China in 2015: Analysis of time series Landsat 7/8 and Sentinel-1A imagery in Google Earth Engine cloud computing platform. ISPRS J. Photogramm. Remote Sens. 2017, 131, 104–120. [Google Scholar] [CrossRef]
  30. Fernandez-Carrillo, A.; Patočka, Z.; Dobrovolnỳ, L.; Franco-Nieto, A.; Revilla-Romero, B. Monitoring bark beetle forest damage in Central Europe. A remote sensing approach validated with field data. Remote Sens. 2020, 12, 3634. [Google Scholar] [CrossRef]
  31. Mapflow.ai. 2021. Available online: https://mapflow.ai/ (accessed on 10 February 2022).
  32. Mapbox Service. Available online: https://www.mapbox.com/ (accessed on 29 April 2022).
  33. Ronneberger, O.; Fischer, P.; Brox, T. U-net: Convolutional networks for biomedical image segmentation. In Proceedings of the International Conference on Medical Image Computing and Computer-Assisted Intervention, Munich, Germany, 5–9 October 2015; Springer: Berlin/Heidelberg, Germany, 2015; pp. 234–241. [Google Scholar]
  34. Lin, T.Y.; Dollár, P.; Girshick, R.; He, K.; Hariharan, B.; Belongie, S. Feature pyramid networks for object detection. In Proceedings of the IEEE Conference on Computer Vision and Pattern Recognition, Honolulu, HI, USA, 21–26 July 2017; pp. 2117–2125. [Google Scholar]
  35. Chen, L.C.; Papandreou, G.; Kokkinos, I.; Murphy, K.; Yuille, A.L. Deeplab: Semantic image segmentation with deep convolutional nets, atrous convolution, and fully connected crfs. IEEE Trans. Pattern Anal. Mach. Intell. 2017, 40, 834–848. [Google Scholar] [CrossRef] [Green Version]
  36. Yakubovskiy, P. Segmentation Models. 2021. Available online: https://github.com/qubvel/segmentation_models (accessed on 20 November 2021).
  37. Illarionova, S.; Nesteruk, S.; Shadrin, D.; Ignatiev, V.; Pukalchik, M.; Oseledets, I. Object-Based Augmentation for Building Semantic Segmentation: Ventura and Santa Rosa Case Study. In Proceedings of the 2021 IEEE/CVF International Conference on Computer Vision Workshops (ICCVW), Montreal, BC, Canada, 11–17 October 2021; IEEE: Piscataway, NJ, USA, 2021; pp. 1659–1668. [Google Scholar]
  38. Illarionova, S. Satellite Object Augmentation. 2021. Available online: https://github.com/LanaLana/satellite_object_augmentation (accessed on 20 November 2021).
  39. Buslaev, A.; Iglovikov, V.I.; Khvedchenya, E.; Parinov, A.; Druzhinin, M.; Kalinin, A.A. Albumentations: Fast and Flexible Image Augmentations. Information 2020, 11, 125. [Google Scholar] [CrossRef] [Green Version]
  40. Illarionova, S.; Trekin, A.; Ignatiev, V.; Oseledets, I. Tree Species Mapping on Sentinel-2 Satellite Imagery with Weakly Supervised Classification and Object-Wise Sampling. Forests 2021, 12, 1413. [Google Scholar] [CrossRef]
  41. Szegedy, C.; Ioffe, S.; Vanhoucke, V.; Alemi, A.A. Inception-v4, inception-resnet and the impact of residual connections on learning. In Proceedings of the Thirty-First AAAI Conference on Artificial Intelligence, San Francisco, CA, USA, 4–9 February 2017. [Google Scholar]
  42. Keras. 2020–2021. Available online: https://keras.io/ (accessed on 20 November 2021).
  43. Wu, B.; Xu, C.; Dai, X.; Wan, A.; Zhang, P.; Yan, Z.; Tomizuka, M.; Gonzalez, J.; Keutzer, K.; Vajda, P. Visual transformers: Token-based image representation and processing for computer vision. arXiv 2020, arXiv:2006.03677. [Google Scholar]
  44. Nesteruk, S.; Illarionova, S.; Akhtyamov, T.; Shadrin, D.; Somov, A.; Pukalchik, M.; Oseledets, I. XtremeAugment: Getting More From Your Data Through Combination of Image Collection and Image Augmentation. IEEE Access 2022, 10, 24010–24028. [Google Scholar] [CrossRef]
  45. Skole, D.L.; Samek, J.H.; Mbow, C.; Chirwa, M.; Ndalowa, D.; Tumeo, T.; Kachamba, D.; Kamoto, J.; Chioza, A.; Kamangadazi, F. Direct Measurement of Forest Degradation Rates in Malawi: Toward a National Forest Monitoring System to Support REDD+. Forests 2021, 12, 426. [Google Scholar] [CrossRef]
  46. Zacharov, I.; Arslanov, R.; Gunin, M.; Stefonishin, D.; Bykov, A.; Pavlov, S.; Panarin, O.; Maliutin, A.; Rykovanov, S.; Fedorov, M. “Zhores”—Petaflops supercomputer for data-driven modeling, machine learning and artificial intelligence installed in Skolkovo Institute of Science and Technology. Open Eng. 2019, 9, 512–520. [Google Scholar] [CrossRef] [Green Version]
Figure 1. Proposed pipeline for CNN model training.
Remotesensing 14 02281 g001
Figure 2. Examples of original and generated samples and tree masks. In the generated samples, new various backgrounds were used to achieve greater diversity and to combine trees’ images and masks from different areas. Artificially added shadows provide more realistic images associated with semantic segmentation masks.
Remotesensing 14 02281 g002
Figure 3. Raw images (left) and predictions (right) for different territories: (a) Baoting Li and Miao Autonomous County, Hainan, China, 18°29 24.0 N 109°35 24.0 E; (b) Zelenodolsky District, Republic of Tatarstan, Russia, 55°55 48.0 N 48°44 24.0 E; (c) Republic of Dagestan, Russia, 43°01 09.1 N 47°19 28.2 E.
Remotesensing 14 02281 g003
Figure 4. Forest segmentation results for Republic of Tatarstan test territories: (a) input image; (b) ground truth; (c) small dataset fine-tuned without OBA; (d) small dataset fine-tuned with OBA.
Remotesensing 14 02281 g004
Figure 5. Input image from new region outside training site, Zelenodolsky District, Republic of Tatarstan, Russia, 55°55 48.0 N 48°44 24.0 E (composite orthophotomap provided by Mapbox, acquisition date: 20 March 2022) (a); Open Street Map (acquisition date: 20 March 2022) (b); forest segmentation results of the final CNN model fine-tuned with OBA (c).
Remotesensing 14 02281 g005
Figure 6. Input image from new region outside training site, Wickwar, England, 51°36 26.7 N, 2°23 17.1 W (composite orthophotomap provided by Google, acquisition date: 30 April 2022) (a); Open Street Map (acquisition date: 30 April 2022) (b); forest segmentation results of the final CNN model fine-tuned with OBA (c).
Remotesensing 14 02281 g006
Table 1. Forest segmentation results for baseline model on two datasets.
Large DatasetSmall Dataset
PrecisionRecallF1PrecisionRecallF1
U-Net0.9650.9630.9640.8620.8510.856
FPN0.9610.9580.9590.8560.8490.852
DeepLab0.9630.9620.9620.8560.8540.855
Table 2. Augmentation approaches comparison for different training set sizes on the small dataset using fine-tuned U-Net with Inception encoder (F1-scores for the test areas from small dataset and large dataset).
Baseline_no_augmSimple_augmOBA
Training set size1/32/311/32/311/32/31
F1-score
Small dataset test0.8610.8660.8710.8670.8750.8880.9130.9210.929
Large dataset test0.9560.9590.9620.9640.9650.9670.9660.9690.971
Precision
Small dataset test0.8630.8650.8720.8690.8770.8890.9150.9220.931
Large dataset test0.9550.9610.9650.9650.9660.9690.9640.9720.973
Recall
Small dataset test0.860.8670.8710.8660.8730.8870.9110.9210.928
Large dataset test0.9570.9580.9590.9630.9640.9650.9680.9670.97
IoU
Small dataset test0.7540.7610.7680.7740.7830.7990.8510.8560.867
Large dataset test0.8350.8470.8560.8780.8840.8910.8950.8990.912
Publisher’s Note: MDPI stays neutral with regard to jurisdictional claims in published maps and institutional affiliations.

