
Satellite-Based Analysis of Spatiotemporal Wildfire Pattern in the Mongolian Plateau

Abstract
:
1. Introduction
2. Materials and Methods
2.1. Study Area
2.2. Data Source and Processing

2.3. Wildfire Pattern Analysis
3. Results
3.1. Temporal Pattern
3.1.1. Inter-Annual Trend
3.1.2. Intra-Annual Pattern
3.2. Spatial Distribution
3.3. The Changing Trend of Wildfire Pattern
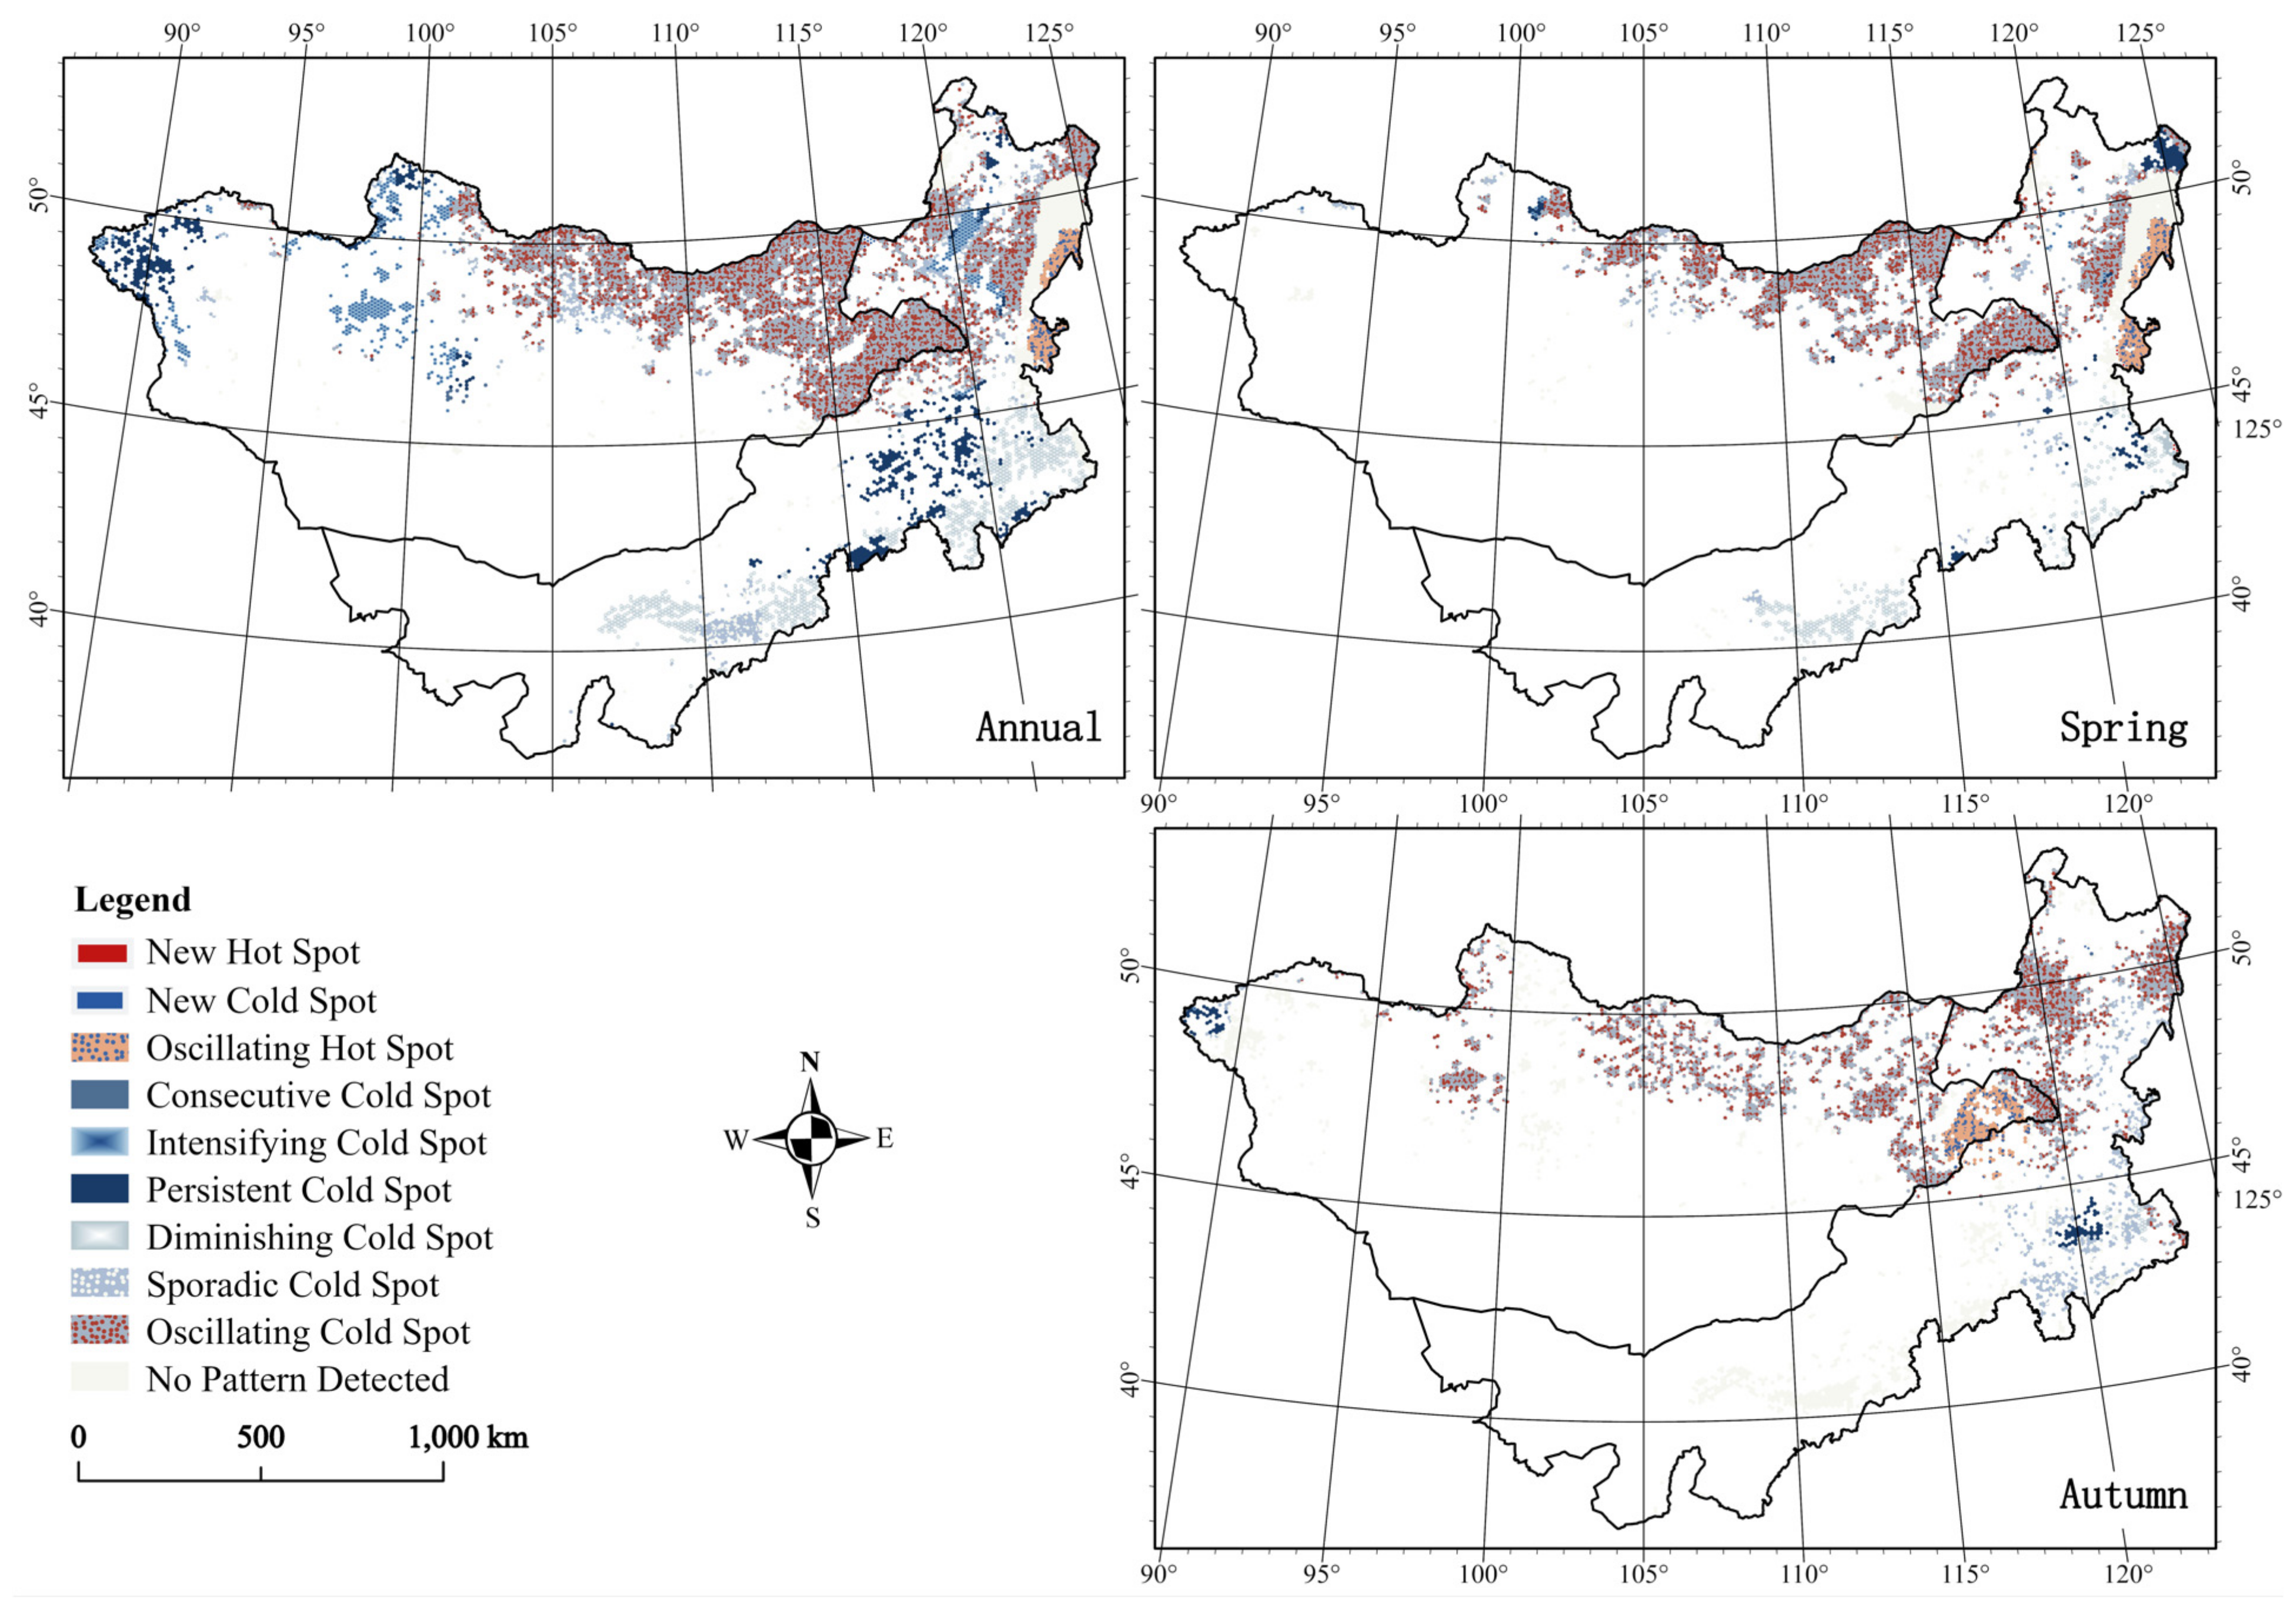
 ), which was defined as a statistically significant cold spot for the final time step interval, with a history of also being a statistically significant hot spot during a prior time step. Less than 90% of the time step intervals have been statistically significant cold spots. This trend accounts for 55.6% of annual fires, 59.8% of spring fires, and 57.7% of autumn fires (Supplementary Materials Figure S3 and Figure 6). The changing trend of wildfires in an oscillating decreasing trend mainly occurred in the northern forest in Selenge and the steppe in Khentii, Dornod, and Sukhbaatar aimags, especially the regions near the Mongolia–Russia and Mongolia–China borders. Fires in the southern parts of the Great Xing’an Mountain region also showed an oscillating decreasing trend. The second trend was sporadic cold spot (
 ), which was defined as a statistically significant cold spot for the final time step interval, with a history of also being an on-again and off-again cold spot. Less than 90% of the time step intervals have been statistically significant cold spots, and none of the time step intervals have been statistically significant hot spots. This trend accounts for 6.2% of annual fires, 4.8% of spring fires, and 10.7% of autumn fires (Supplementary Materials Figure S3 and Figure 6). The changing trend of wildfires in a sporadic decreasing mode mainly occurred in southeastern parts of Inner Mongolia, China. The third trend was oscillating hot spot (
 ), which was defined as a statistically significant hot spot for the final time step interval, which has a history of also being a statistically significant cold spot during a prior time step. Less than 90% of the time step intervals have been statistically significant hot spots. This trend accounts for 2.7% in annual fires, 5.7% in spring fires, and 6.2% in autumn fires (Supplementary Materials Figure S3 and Figure 6). The changing trend of wildfires in a sporadic increasing mode mainly occurred in a southern region of Dornod aimag in spring, and in eastern parts of the Great Xing’an Mountain in China in autumn. The final trend was persistent cold spot (
 ), which was defined as a location that has been a statistically significant cold spot for 90% of the time step intervals, with no discernible trend in the intensity of clustering of counts over time. This trend accounts for 9.7% of annual fires, 3.9% of spring fires, and 10.7% of autumn fires (Supplementary Materials Figure S3 and Figure 6). The changing trend of wildfires in a persistent decreasing mode mainly occurred in the Xilingol League of Inner Mongolia, China, and the northeastern part of Mongolia.
 4. Discussion
5. Conclusions
Supplementary Materials
Author Contributions
Funding
Data Availability Statement
Acknowledgments
Conflicts of Interest
References
- Pausas, J.G.; Keeley, J.E. Wildfires and global change. Front. Ecol. Environ. 2021, 19, 387–395. [Google Scholar] [CrossRef]
- Bowman, D.; Kolden, C.A.; Abatzoglou, J.T.; Johnston, F.H.; van der Werf, G.R.; Flannigan, M. Vegetation fires in the Anthropocene. Nat. Rev. Earth Environ. 2020, 1, 500–515. [Google Scholar] [CrossRef]
- Xu, R.B.; Yu, P.; Abramson, M.J.; Johnston, F.H.; Samet, J.M.; Bell, M.L.; Haines, A.; Ebi, K.L.; Li, S.S.; Guo, Y.M. Wildfires, Global Climate Change, and Human Health. N. Engl. J. Med. 2020, 383, 2173–2181. [Google Scholar] [CrossRef] [PubMed]
- Melia, N.; Dean, S.; Pearce, H.G.; Harrington, L.; Frame, D.J.; Strand, T. Aotearoa New Zealand’s 21st-Century Wildfire Climate. Earths Future 2022, 10, e2022EF002853. [Google Scholar] [CrossRef]
- Ward, M.; Carwardine, J.; Watson, J.E.M.; Pintor, A.; Stuart, S.; Possingham, H.P.; Rhodes, J.R.; Carey, A.R.; Auerbach, N.; Reside, A.; et al. How to prioritize species recovery after a megafire. Conserv. Biol. 2022, 36, e13936. [Google Scholar] [CrossRef]
- Wu, D.Y.; Niu, X.Y.; Chen, Z.Q.; Chen, Y.; Xing, Y.X.; Cao, X.Y.; Liu, J.z.; Wang, X.; Pu, W. Causes and Effects of the Long-Range Dispersion of Carbonaceous Aerosols From the 2019-2020 Australian Wildfires. Geophys. Res. Lett. 2022, 49, e2022GL099840. [Google Scholar] [CrossRef]
- Yuan, S.; Bao, F.; Zhang, X.; Li, Y. Severe Biomass-Burning Aerosol Pollution during the 2019 Amazon Wildfire and Its Direct Radiative-Forcing Impact: A Space Perspective from MODIS Retrievals. Remote Sens. 2022, 14, 2080. [Google Scholar] [CrossRef]
- Buotte, P.C.; Levis, S.; Law, B.E.; Hudiburg, T.W.; Rupp, D.E.; Kent, J.J. Near-future forest vulnerability to drought and fire varies across the western United States. Glob. Chang. Biol. 2019, 25, 290–303. [Google Scholar] [CrossRef] [Green Version]
- Burke, M.; Driscoll, A.; Heft-Neal, S.; Xue, J.; Burney, J.; Wara, M. The changing risk and burden of wildfire in the United States. Proc. Natl. Acad. Sci. USA 2021, 118, e2011048118. [Google Scholar] [CrossRef]
- Hyde, A.S.; Verstraeten, B.S.E.; Olson, J.K.; King, S.; Bremault-Phillips, S.; Olson, D.M. The Fort McMurray Mommy Baby Study: A Protocol to Reduce Maternal Stress Due to the 2016 Fort McMurray Wood Buffalo, Alberta, Canada Wildfire. Front. Public Health 2021, 9, 685. [Google Scholar] [CrossRef]
- Skakun, R.; Castilla, G.; Metsaranta, J.; Whitman, E.; Rodrigue, S.; Little, J.; Groenewegen, K.; Coyle, M. Extending the National Burned Area Composite Time Series of Wildfires in Canada. Remote Sens. 2022, 14, 3050. [Google Scholar] [CrossRef]
- Allan, R.P.; Arias, P.A.; Berger, S.; Canadell, J.G.; Cassou, C.; Chen, D.; Cherchi, A.; Connors, S.L.; Coppola, E.; Cruz, F.A.; et al. Climate Change 2021: The Physical Science Basis; Cambridge University: Cambridge, UK, 2021. [Google Scholar]
- Zhongming, Z.; Linong, L.; Xiaona, Y.; Wangqiang, Z.; Wei, L. Climate Risk Country Profile: Mongolia. 2021. Available online: https://www.adb.org/publications/climate-risk-country-profile-mongolia (accessed on 30 June 2021).
- Neupert, R.F. Population, nomadic pastoralism and the environment in the Mongolian Plateau. Popul. Environ. 1999, 20, 413–441. [Google Scholar] [CrossRef]
- Rao, M.P.; Davi, N.K.; D D’Arrigo, R.; Skees, J.; Nachin, B.; Leland, C.; Lyon, B.; Wang, S.-Y.; Byambasuren, O. Dzuds, droughts, and livestock mortality in Mongolia. Environ. Res. Lett. 2015, 10, 74012. [Google Scholar] [CrossRef]
- Zhang, P.; Jeong, J.H.; Yoon, J.H.; Kim, H.; Wang, S.Y.S.; Linderholm, H.W.; Fang, K.Y.; Wu, X.C.; Chen, D.L. Abrupt shift to hotter and drier climate over inner East Asia beyond the tipping point. Science 2020, 370, 1095–1099. [Google Scholar] [CrossRef]
- Bai, Y.; Li, S.; Liu, M.; Guo, Q. Assessment of vegetation change on the Mongolian Plateau over three decades using different remote sensing products. J. Environ. Manag. 2022, 317, 115509. [Google Scholar] [CrossRef]
- Nanzad, L.; Zhang, J.H.; Tuvdendorj, B.; Nabil, M.; Zhang, S.; Bai, Y. NDVI anomaly for drought monitoring and its correlation with climate factors over Mongolia from 2000 to 2016. J. Arid. Environ. 2019, 164, 69–77. [Google Scholar] [CrossRef]
- Tao, S.L.; Fang, J.Y.; Zhao, X.; Zhao, S.Q.; Shen, H.H.; Hu, H.F.; Tang, Z.Y.; Wang, Z.H.; Guo, Q.H. Rapid loss of lakes on the Mongolian Plateau. Proc. Natl. Acad. Sci. USA 2015, 112, 2281–2286. [Google Scholar] [CrossRef] [Green Version]
- Kimura, R.; Moriyama, M. Use of A MODIS Satellite-Based Aridity Index to Monitor Drought Conditions in Mongolia from 2001 to 2013. Remote Sens. 2021, 13, 2561. [Google Scholar] [CrossRef]
- Saladyga, T.; Hessl, A.; Nachin, B.; Pederson, N. Privatization, Drought, and Fire Exclusion in the Tuul River Watershed, Mongolia. Ecosystems 2013, 16, 1139–1151. [Google Scholar] [CrossRef] [Green Version]
- Bao, G.; Bao, Y.L.; Bao, Y.H.; Amarjargal; Hang, Y.L. Spatiotemporal Variations in Fire Behavior in the Mongolian Plateau during 2001-2012. Adv. Intel. Sys. Res. 2014, 102, 507–511. [Google Scholar]
- John, R.; Chen, J.; Ou-Yang, Z.-T.; Xiao, J.; Becker, R.; Samanta, A.; Ganguly, S.; Yuan, W.; Batkhishig, O. Vegetation response to extreme climate events on the Mongolian Plateau from 2000 to 2010. Environ. Res. Lett. 2013, 8, 35033. [Google Scholar] [CrossRef]
- Zhao, H.; Zhang, Z.X.; Ying, H.; Chen, J.H.; Zhen, S.; Wang, X.; Shan, Y.L. The spatial patterns of climate-fire relationships on the Mongolian Plateau. Agric. For. Meteorol. 2021, 308, 108549. [Google Scholar] [CrossRef]
- Danilin, I.M.; Tsogt, Z. Dynamics of structure and biological productivity of post-fire larch forests in the Northern Mongolia. Contemp. Probl. Ecol. 2014, 7, 158–169. [Google Scholar] [CrossRef]
- Nasanbat, E.; Lkhamjav, O.; Balkhai, A.; Tsevee-Oirov, C.; Purev, A.; Dorjsuren, M. A spatial distributionmap of the wildfire risk in Mongolia using decision support system. Int. Arch. Photogramm. Remote Sens. Spat. Inf. Sci. 2018, 42, 357–362. [Google Scholar] [CrossRef] [Green Version]
- Kazato, M.; Soyollham, B. Forest-steppe fires as moving disasters in the Mongolia-Russian borderland. J. Contemp. East Asia Stud. 2022, 11, 22–45. [Google Scholar] [CrossRef]
- van der Werf, G.R.; Randerson, J.T.; Giglio, L.; Collatz, G.J.; Mu, M.; Kasibhatla, P.S.; Morton, D.C.; DeFries, R.S.; Jin, Y.; van Leeuwen, T.T. Global fire emissions and the contribution of deforestation, savanna, forest, agricultural, and peat fires (1997–2009). Atmos. Chem. Phys. 2010, 10, 11707–11735. [Google Scholar] [CrossRef] [Green Version]
- Giglio, L.; Csiszar, I.; Justice, C.O. Global distribution and seasonality of active fires as observed with the Terra and Aqua Moderate Resolution Imaging Spectroradiometer (MODIS) sensors. J. Geophys. Res. Biogeosci. 2006, 111. [Google Scholar] [CrossRef]
- Loboda, T.V.; Hoy, E.E.; Giglio, L.; Kasischke, E.S. Mapping burned area in Alaska using MODIS data: A data limitations-driven modification to the regional burned area algorithm. Int. J. Wildland Fire 2011, 20, 487–496. [Google Scholar] [CrossRef]
- Giglio, L.; Boschetti, L.; Roy, D.P.; Humber, M.L.; Justice, C.O. The Collection 6 MODIS burned area mapping algorithm and product. Remote Sens. Environ. 2018, 217, 72–85. [Google Scholar] [CrossRef]
- Giglio, L.; Randerson, J.T.; van der Werf, G.R. Analysis of daily, monthly, and annual burned area using the fourth-generation global fire emissions database (GFED4). J. Geophys. Res. Biogeosci. 2013, 118, 317–328. [Google Scholar] [CrossRef] [Green Version]
- Artes, T.S.; Oom, D.; De Rigo, D.; Durrant, T.H.; Maianti, P.; Liberta, G.; San-Miguel-Ayanz, J. A global wildfire dataset for the analysis of fire regimes and fire behaviour. Sci. Data 2019, 6, 296. [Google Scholar] [CrossRef]
- Boschetti, L.; Roy, D.P.; Giglio, L.; Huang, H.; Zubkova, M.; Humber, M.L. Global validation of the collection 6 MODIS burned area product. Remote Sens. Environ. 2019, 235, 111490. [Google Scholar] [CrossRef]
- Rodrigues, J.A.; Libonati, R.; Pereira, A.A.; Nogueira, J.M.P.; Santos, F.L.M.; Peres, L.F.; Santa Rosa, A.; Schroeder, W.; Pereira, J.M.C.; Giglio, L.; et al. How well do global burned area products represent fire patterns in the Brazilian Savannas biome? An accuracy assessment of the MCD64 collections. Int. J. Appl. Earth Obs. 2019, 78, 318–331. [Google Scholar] [CrossRef]
- Giglio, L.; Schroeder, W.; Justice, C.O. The collection 6 MODIS active fire detection algorithm and fire products. Remote Sens. Environ. 2016, 178, 31–41. [Google Scholar] [CrossRef] [Green Version]
- Rihan, W.; Zhao, J.; Zhang, H.; Guo, X.; Ying, H.; Deng, G.; Li, H. Wildfires on the Mongolian Plateau: Identifying drivers and spatial distributions to predict wildfire probability. Remote Sens. 2019, 11, 2361. [Google Scholar] [CrossRef] [Green Version]
- Wenfeng, C.; Hongyan, Z.; Kunpeng, X.; Yuhai, B. Spatiotemporal patterns and trends of the Mongolian Plateau wildfires. Природа Внутренней Азии 2017, 4, 13–25. [Google Scholar]
- Esri. Sentinel-2 10 m Land Use/Land Cover Time Series. Available online: https://www.arcgis.com/home/item.html?id=d3da5dd386d140cf93fc9ecbf8da5e31 (accessed on 10 February 2022).
- Na, L.; Zhang, J.Q.; Bao, Y.L.; Bao, Y.B.; Na, R.S.; Tong, S.Q.; Si, A.; Na, L.; Zhang, J.; Bao, Y.; et al. Himawari-8 Satellite Based Dynamic Monitoring of Grassland Fire in China-Mongolia Border Regions. Sensors 2018, 18, 276. [Google Scholar] [CrossRef] [Green Version]
- Dionne, R.; Shulman, D. Mongolia Wildfire Assessment; United States Forest Service: Washington, DC, USA, 1996; pp. 1–13. [Google Scholar]
- Darren, J.; Byambasuren, O.; Babler, M. Fire Management Assessment of the Eastern Steppe, Mongolia; The Nature Conservancy: Arlington, VA, USA, 2009; pp. 1–42. [Google Scholar]
- Farukh, M.A.; Hayasaka, H.; Mishigdorj, O. Recent tendency of Mongolian wildland fire incidence: Analysis using MODIS hotspot and weather data. J. Nat. Disaster Sci. 2009, 31, 23–33. [Google Scholar] [CrossRef] [Green Version]
- Dashtseren, A.; Temuujin, K.; Westermann, S.; Batbold, A.; Amarbayasgalan, Y.; Battogtokh, D. Spatial and Temporal Variations of Freezing and Thawing Indices From 1960 to 2020 in Mongolia. Front. Earth Sci. 2021, 9, 713498. [Google Scholar] [CrossRef]
- Munkhjargal, M.; Yadamsuren, G.; Yamkhin, J.; Menzel, L. The Combination of Wildfire and Changing Climate Triggers Permafrost Degradation in the Khentii Mountains, Northern Mongolia. Atmosphere-Basel 2020, 11, 155. [Google Scholar] [CrossRef] [Green Version]
- Moritz, M.A.; Batllori, E.; Bradstock, R.A.; Gill, A.M.; Handmer, J.; Hessburg, P.F.; Leonard, J.; McCaffrey, S.; Odion, D.C.; Schoennagel, T.; et al. Learning to coexist with wildfire. Nature 2014, 515, 58–66. [Google Scholar] [CrossRef] [PubMed]


Disclaimer/Publisher’s Note: The statements, opinions and data contained in all publications are solely those of the individual author(s) and contributor(s) and not of MDPI and/or the editor(s). MDPI and/or the editor(s) disclaim responsibility for any injury to people or property resulting from any ideas, methods, instructions or products referred to in the content. |
© 2022 by the authors. Licensee MDPI, Basel, Switzerland. This article is an open access article distributed under the terms and conditions of the Creative Commons Attribution (CC BY) license (https://creativecommons.org/licenses/by/4.0/).
Share and Cite
Bao, Y.; Shinoda, M.; Yi, K.; Fu, X.; Sun, L.; Nasanbat, E.; Li, N.; Xiang, H.; Yang, Y.; DavdaiJavzmaa, B.; et al. Satellite-Based Analysis of Spatiotemporal Wildfire Pattern in the Mongolian Plateau. Remote Sens. 2023, 15, 190. https://0-doi-org.brum.beds.ac.uk/10.3390/rs15010190
Bao Y, Shinoda M, Yi K, Fu X, Sun L, Nasanbat E, Li N, Xiang H, Yang Y, DavdaiJavzmaa B, et al. Satellite-Based Analysis of Spatiotemporal Wildfire Pattern in the Mongolian Plateau. Remote Sensing. 2023; 15(1):190. https://0-doi-org.brum.beds.ac.uk/10.3390/rs15010190
Chicago/Turabian StyleBao, Yulong, Masato Shinoda, Kunpeng Yi, Xiaoman Fu, Long Sun, Elbegjargal Nasanbat, Na Li, Honglin Xiang, Yan Yang, Bulgan DavdaiJavzmaa, and et al. 2023. "Satellite-Based Analysis of Spatiotemporal Wildfire Pattern in the Mongolian Plateau" Remote Sensing 15, no. 1: 190. https://0-doi-org.brum.beds.ac.uk/10.3390/rs15010190