
A Calibration Method for Large-Footprint Full-Waveform Airborne Laser Altimeter without a Calibration Field

1
National-Local Joint Engineering Laboratory of Geo-Spatial Information Technology, Hunan University of Science and Technology, Xiangtan 411201, China
2
School of Earth Sciences and Geospatial Information Engineering, Hunan University of Science and Technology, Xiangtan 411201, China
3
Academy of Inventory and Planning, National Forestry and Grassland Administration, Beijing 100714, China
4
State Key Laboratory of Information Engineering in Surveying, Mapping and Remote Sensing, Wuhan University, Wuhan 430079, China
*
Author to whom correspondence should be addressed.
Remote Sens. 2023, 15(11), 2789; https://0-doi-org.brum.beds.ac.uk/10.3390/rs15112789
Submission received: 5 April 2023
/
Revised: 23 May 2023
/
Accepted: 24 May 2023
/
Published: 27 May 2023
(This article belongs to the Special Issue Theory and Applications of Satellite Laser Altimetry in Oceanography and Limnology)
Abstract
:The geometrical measurement precision of laser spots is affected by the deviation between the parameters of the laser altimeter and the laboratory measurement results, and the inversion accuracy of surface object height is also limited. The measurement parameters and the load state can be obtained by calibration of the laser altimeter system. Usually, ground detectors are deployed to calibrate the measurement parameters of the laser altimeter, including the divergence angle and the energy distribution of the laser beam. A calibration method for a laser footprint spot without a calibration field was proposed in this paper, focused on the airborne large-footprint laser altimeter system. The geometric parameters of the laser spot were calibrated through the laser echo waveforms of a specific terrain. The experimental results show that geometric calibration of the large-footprint laser altimeter can be achieved in the area of the step surface. The divergence angle of the laser beams obtained from the six experimental areas is 4.604 ± 0.359 mRad, and the consistency of the energy distribution from each laser spot reaches 92.67%. A new method of on-orbit calibration and verification is provided for the satellite laser altimeter system.
1. Introduction
Laser altimetry technology is an active remote sensing method that can quickly and efficiently obtain three-dimensional surface information. Full-waveform laser altimeter systems can not only accurately calculate surface elevation but can also obtain the spatial structure information of the Earth’s surface features, including height, slope, and distribution [1,2,3]. This technology has been widely applied in forestry investigation and biomass estimation [4,5,6,7,8]. In 2003, the National Aeronautics and Space Administration (NASA) first carried the large-footprint laser altimeter system with full-waveform recording capability to the Ice, Cloud, and land Elevation Satellite (ICESat) for global surface observation [9,10,11]. Before that, the United States carried out experiments on airborne large-footprint laser altimeter systems, such as SLICER and LVIS [12,13,14]. Since then, the airborne laser altimeter system has been used to cooperate with the satellite many times to complete on-orbit testing. In 2018, the altimeter system of the Global Ecosystem Dynamics Investigation (GEDI) was installed at the International Space Station, mainly for the measurement of the vertical structure of forests [15,16]. In November 2019, the GF-7 satellite was launched with two linear system laser altimeters, which opened the exploration of full-waveform large-footprint laser altimetry in China [17,18,19,20]. Recently, the Terrestrial Ecosystem Carbon Inventory Satellite, dedicated to forest resource surveys, has been launched, carrying a five-beam lidar load for acquiring high-precision three-dimensional structures of forests at large footprints [21,22]. To verify the performance of the laser altimeter system, the National Forestry and Grassland Administration, together with scientific research institutes, carried out the development and flight testing of an airborne large-footprint laser altimeter system. The system integrates a laser altimeter, aerial camera, aerial inertial navigation system, high stability platform, and other equipment to form the set of the large-footprint airborne laser altimeter system [23,24,25,26]. By the flight tests of the airborne large-footprint laser altimeter system, the performance indexes of the satellite laser altimeter system are verified.
Due to a deviation between the geometrical parameters of the laser altimeter system in the on-orbit working state and the laboratory measurement results, the satellite’s initial laser geometric precision is low, which seriously restricts the accuracy of laser geometric positioning and surface object height measurement. Accurate geometric parameters can be obtained by ground calibration to evaluate the load state and improve the accuracy of laser geometric positioning and ranging. To calibrate the parameters of the laser altimeter, including optical axis pointing, the divergence angle, and the energy distribution of the laser beam, the most effective way is currently to receive the signals emitted by the laser by deploying ground detectors to determine the geometric and energy characteristics of the laser spot [27,28,29]. Because the solution has high real-time requirements for calibration, it is necessary to ensure that the laser altimeter system and the ground calibration work simultaneously. Some scholars have developed a non-real-time laser calibration processing method that depends on the fluctuant terrain. Tang et al. [30] realized the position prediction of laser footprints on the ground using a terrain matching method with the pyramid search strategy. Zhang et al. [31] constructed a calibration model of laser optical axis pointing by using the terrain fluctuation to constrain orbit laser ranging. Yue et al. [32] realized the positioning in the footprint using the elevation structure information of the waveform and the digital surface model (DSM). Based on this work, a calibration method of the laser footprint spot without a calibration field is proposed in this paper. It is intended to calibrate the geometric parameters of the laser spot by the characteristics of the laser echo waveform of a specific terrain [33] to improve the geometric measurement precision of the large-footprint laser altimeter system.
2. The Airborne Large-Footprint Laser Altimeter System
The National Forestry and Grassland Administration has carried out test experiments in conjunction with research institutes to test the performance and index of the airborne large-footprint laser altimeter system. The airborne large-footprint laser altimeter system is designed with reference to the load of the carbon satellite and developed by a 1:4 scaling ratio. The system integrates the aerial camera, large-footprint laser altimeter, inertial navigation system, high stability platform, control and storage units, etc. The design architecture of the system is shown in Figure 1.
The laser altimeter and Position Orientation System (POS) are integrated on the high stability platform, which receives the attitude information sent by the POS, corrects the platform pointing in real time, and controls the laser altimeter and aerial camera to always point to the lower point of the machine. The laser altimeter receives the pulse per second (PPS) signals sent by the POS to complete the consistency correction of the time system. Under the trigger of the pulse, the laser altimeter emits laser pulses (1064 nm) at a repetition frequency of 40 Hz for surface object detection. The technical parameters of the large-footprint laser altimeter are shown in Table 1.
The designed route height of the airborne system is about 3000 m from the ground, and the flight speed is designed to be 400 km/h. It can be estimated that the laser spot diameter on the ground is about 15 m, and the spacing between adjacent laser spot centers is less than 3 m. The characteristics of the large-footprint laser measurement data are shown in Table 2.
3. Methods
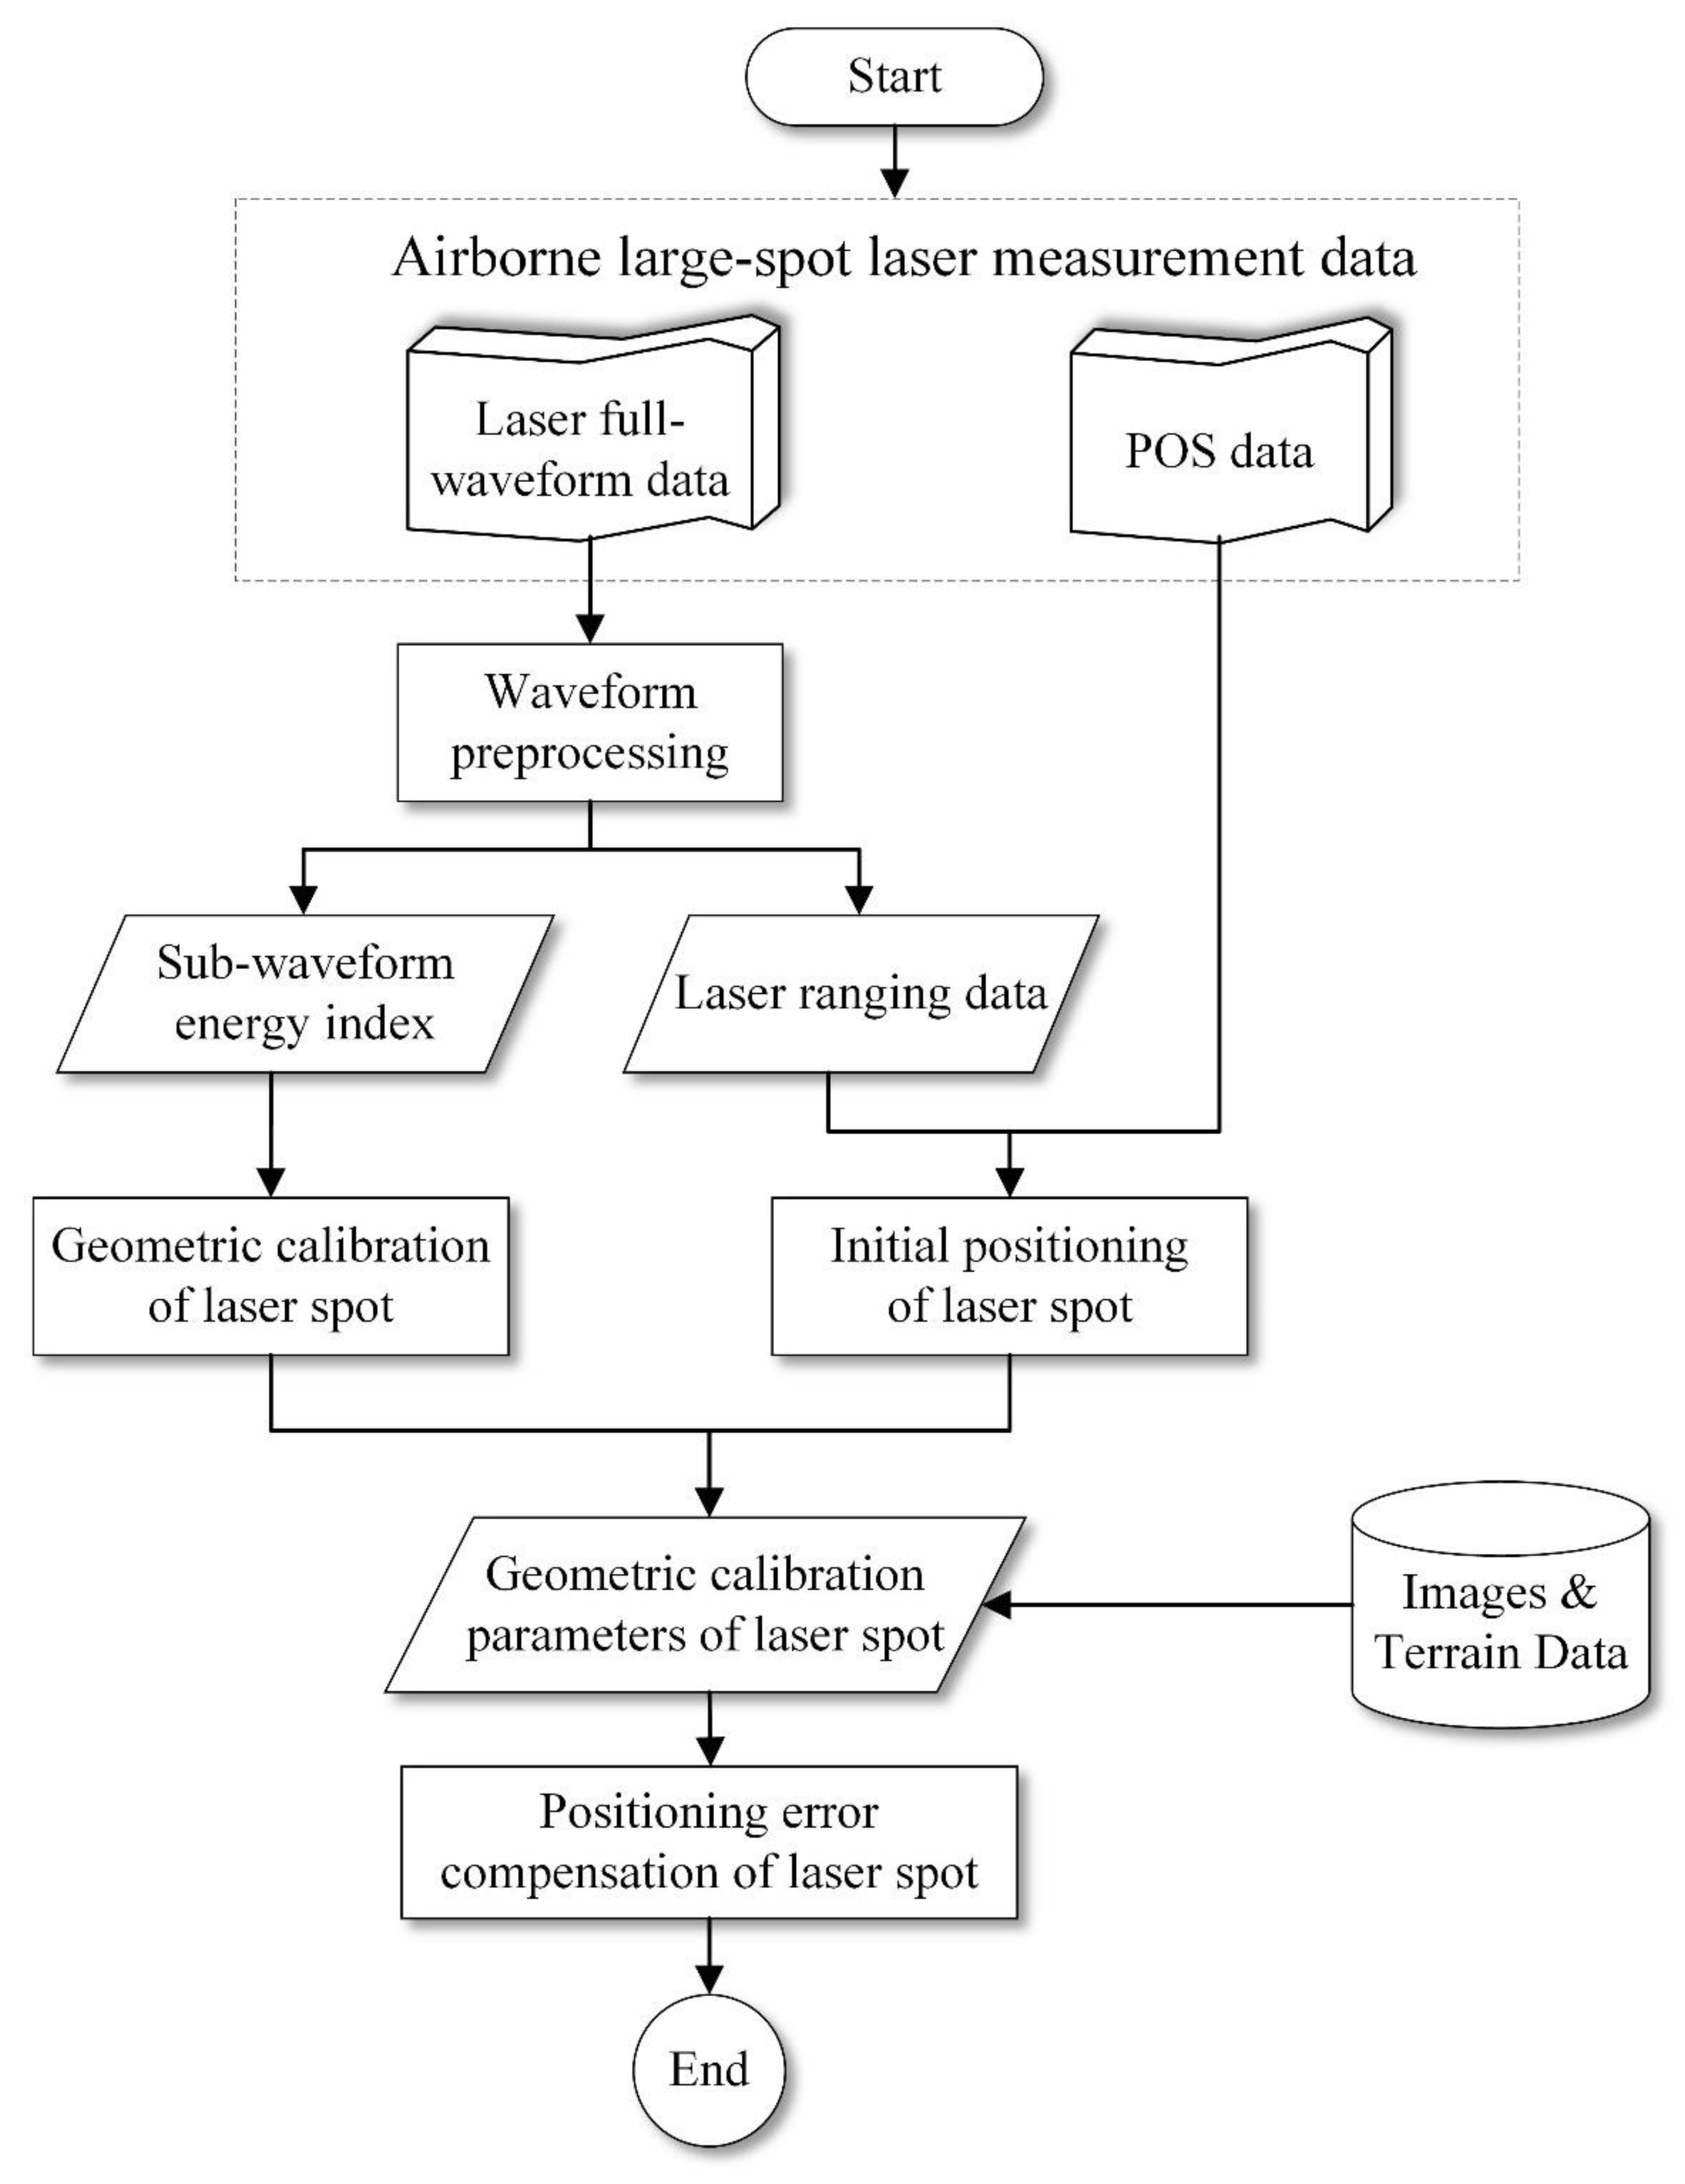
The geometric parameters of the laser spot are calibrated by using the characteristics of the laser echo waveforms of a specific terrain without ground calibration equipment. Firstly, the ground position of the laser spot is determined by the laser positioning model, and then the energy distribution of the footprint spot is inverted by combining the energy indexes of the full waveform data, from which the geometric calibration parameters of the laser spot can be obtained. The technical process of the method is shown in Figure 2.
3.1. Geometric Positioning of the Laser Spot
The geometric positioning model of the airborne large-footprint laser spot is constructed according to the basic principle of laser altimetry. As shown in Figure 3, the reference datum of the measurement is determined first. Here, the Earth’s centroid position point O is the origin of the reference coordinate system, and the geocentric coordinate system O–XYZ is the WGS84 coordinate system. The airborne platform coordinate system OF–XFYFZF is defined as follows: the origin OF is the geometric reference point of the airborne platform; the coordinate axis XF points to the flight direction of the aircraft; the coordinate axis ZF is located in the plane of the track and perpendicular to the XF axis, which points to the ground; the coordinate axis YF is perpendicular to the plane of the track, and the pointing follows the right-hand rule. To construct the geometric relationship between the airborne platform and the reference datum, the navigation coordinate system N–XNYNZN is defined as follows: taking the point N under the aircraft as the origin, the coordinate axis XN is perpendicular to the coil and points to the east; the coordinate axis YN is perpendicular to the normal direction and points to the north; and the coordinate axis ZN points to the zenith. The aircraft POS can record the position and attitude information of the airborne platform in real time. The point OG in Figure 3 is the corrected GPS antenna center position, which overlaps with the geometric reference point OF of the airborne platform by default. The attitude information of the platform records the angle change between the platform coordinate system and the navigation coordinate system.
The geometric positioning model of the airborne large-footprint laser spot is constructed as shown in Formula (1):
where is the geographical coordinate of the laser positioning point P; is the position coordinate of the platform reference point at the time of the laser emission signal; L is the laser ranging value; R is the attitude matrix between the airborne platform and the measurement reference base; is the offset between the laser altimeter measurement reference point and the platform reference point; is the pointing correction of the laser optical axis in the platform coordinate system.
3.2. Calibration of the Laser Spot
The energy distribution and size of the laser spot are the main parameters for verifying laser altimeter performance, as well as for determining the exact direction of the outgoing laser pulse from the optical axis in the position of the laser spot. The laser altimeter geometric positioning model uses the optical axis to calculate the position information of the geometric center of the spot, which is difficult to describe with the characteristics of the large-footprint laser footprint. It is not conducive to the inversion of surface object height with the laser waveform. In the process of the laser altimeter working in orbit, the load state and the geometric parameters will be different from laboratory measurement results. To obtain the energy distribution of the laser spot, it is necessary to carry out the calibration of the spot energy distribution. This study intends to invert the geometry and energy distribution information of the laser footprint spot by using the characteristics of laser echo waveforms.
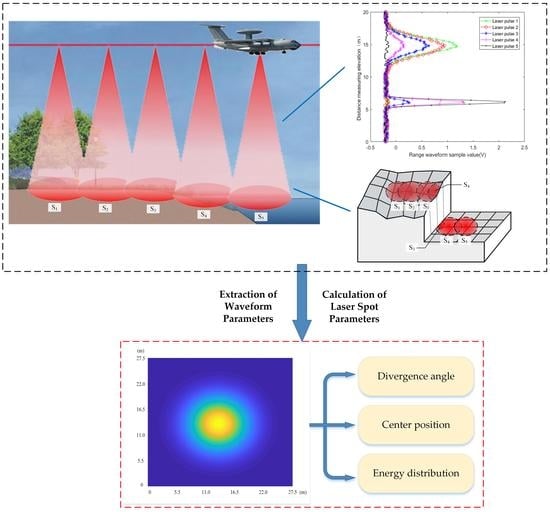
Normally, laser emission pulses are signals that obey a Gaussian function distribution, and the echoes received by the detector are the effect of the superposition of signals reflected from different surfaces. For a flat, bare surface, the echo waveform obtained by the detector is a single-peak Gaussian signal. For a certain slope or undulating surface, the echo waveform will be broadened. For a surface area covered by forest vegetation or urban buildings, the laser spot detection range has a significant elevation difference in the vertical direction of the ground object, and then the laser echo signal will appear as a complex waveform of multiple Gaussian signals superpositioned. Assuming that there is a specific measurement terrain, namely, a step surface with an elevation difference in the along-track direction, and that there is a single surface with consistent reflectivity and elevation fluctuation, when the laser altimeter transmitting frequency is large enough, the signals emitted from the surface can be recorded sequentially by the echo energy reflected from the specific terrain, as shown in Figure 4.
According to the working characteristics of the airborne large-footprint laser altimeter, the laser spot diameter is about 15 m on the ground; the overlap rate of adjacent laser spots is close to 80%; and the spacing between adjacent laser spot centers is between 2 to 3 m. There will be multiple different laser pulse energies reflected on the same surface. The geometric and energy parameters of the laser spot can be calibrated by using the reflected echo energy of the same surface.
3.3. Extraction of Waveform Parameters
To characterize the information of the laser reflection energy of a specific terrain, the energy index of the laser waveform is defined as follows, with the energy intensity integration from the starting moment to the peak moment of each effective laser waveform signal, as shown in Figure 5. The laser spot irradiates to the surface where there is an elevation difference in the vertical direction of the surface object, and the laser echo signal appears as a waveform with multiple peaks. It is necessary to decompose the echo signal to obtain the echo energy index of a specific surface.
The flow of laser waveform preprocessing is shown in Figure 6. The position of the inflection points and peaks are firstly estimated by the characteristic points of the waveform, and the waveform containing multiple peaks is decomposed. Then, the Gaussian fitting of the sub-waveform is performed, using the least squares method to further refine the laser sub-waveform characteristic parameters, which are used to solve the metric parameters involving the energy index of the waveform.
Not all frames of the laser echo waveform data are valid signals. In the process of waveform parameter extraction, it is necessary to determine the range of its valid signals for laser echo waveform fitting. The initial parameters of the model need to be predetermined, and the initial estimated parameter values are substituted into the model for least squares iteration to solve for the optimal parameters of the model.
Assuming that the laser sub-waveform conforms to a one-dimensional Gaussian function distribution, the intensity value of the laser sub-waveform signal g(t) with time series is given in Formula (2):
where is the waveform peak strength parameter, and is the waveform broadening parameter.
Then, the peak position time tP of the laser sub-waveform can be solved by its first derivative :
The inflection point of the laser sub-waveform, namely, the starting time tS, and the ending time tE of the waveform are solved by its second derivative :
The energy index E(g) of the laser sub-waveform is determined by integrating the signal intensity between the waveform starting time tS and the peak position time tP:
The energy index of this sub-waveform is the backscattered energy obtained after the laser beam shines down on the specified terrain. Then, with the movement of the airborne platform, the backscattered energy of the successive laser beams shining down on the same specified surface will form a complete laser spot. The energy distribution inside the spot can be gradually calculated, just as in computerized tomography.
3.4. Calculation of Laser Spot Parameters
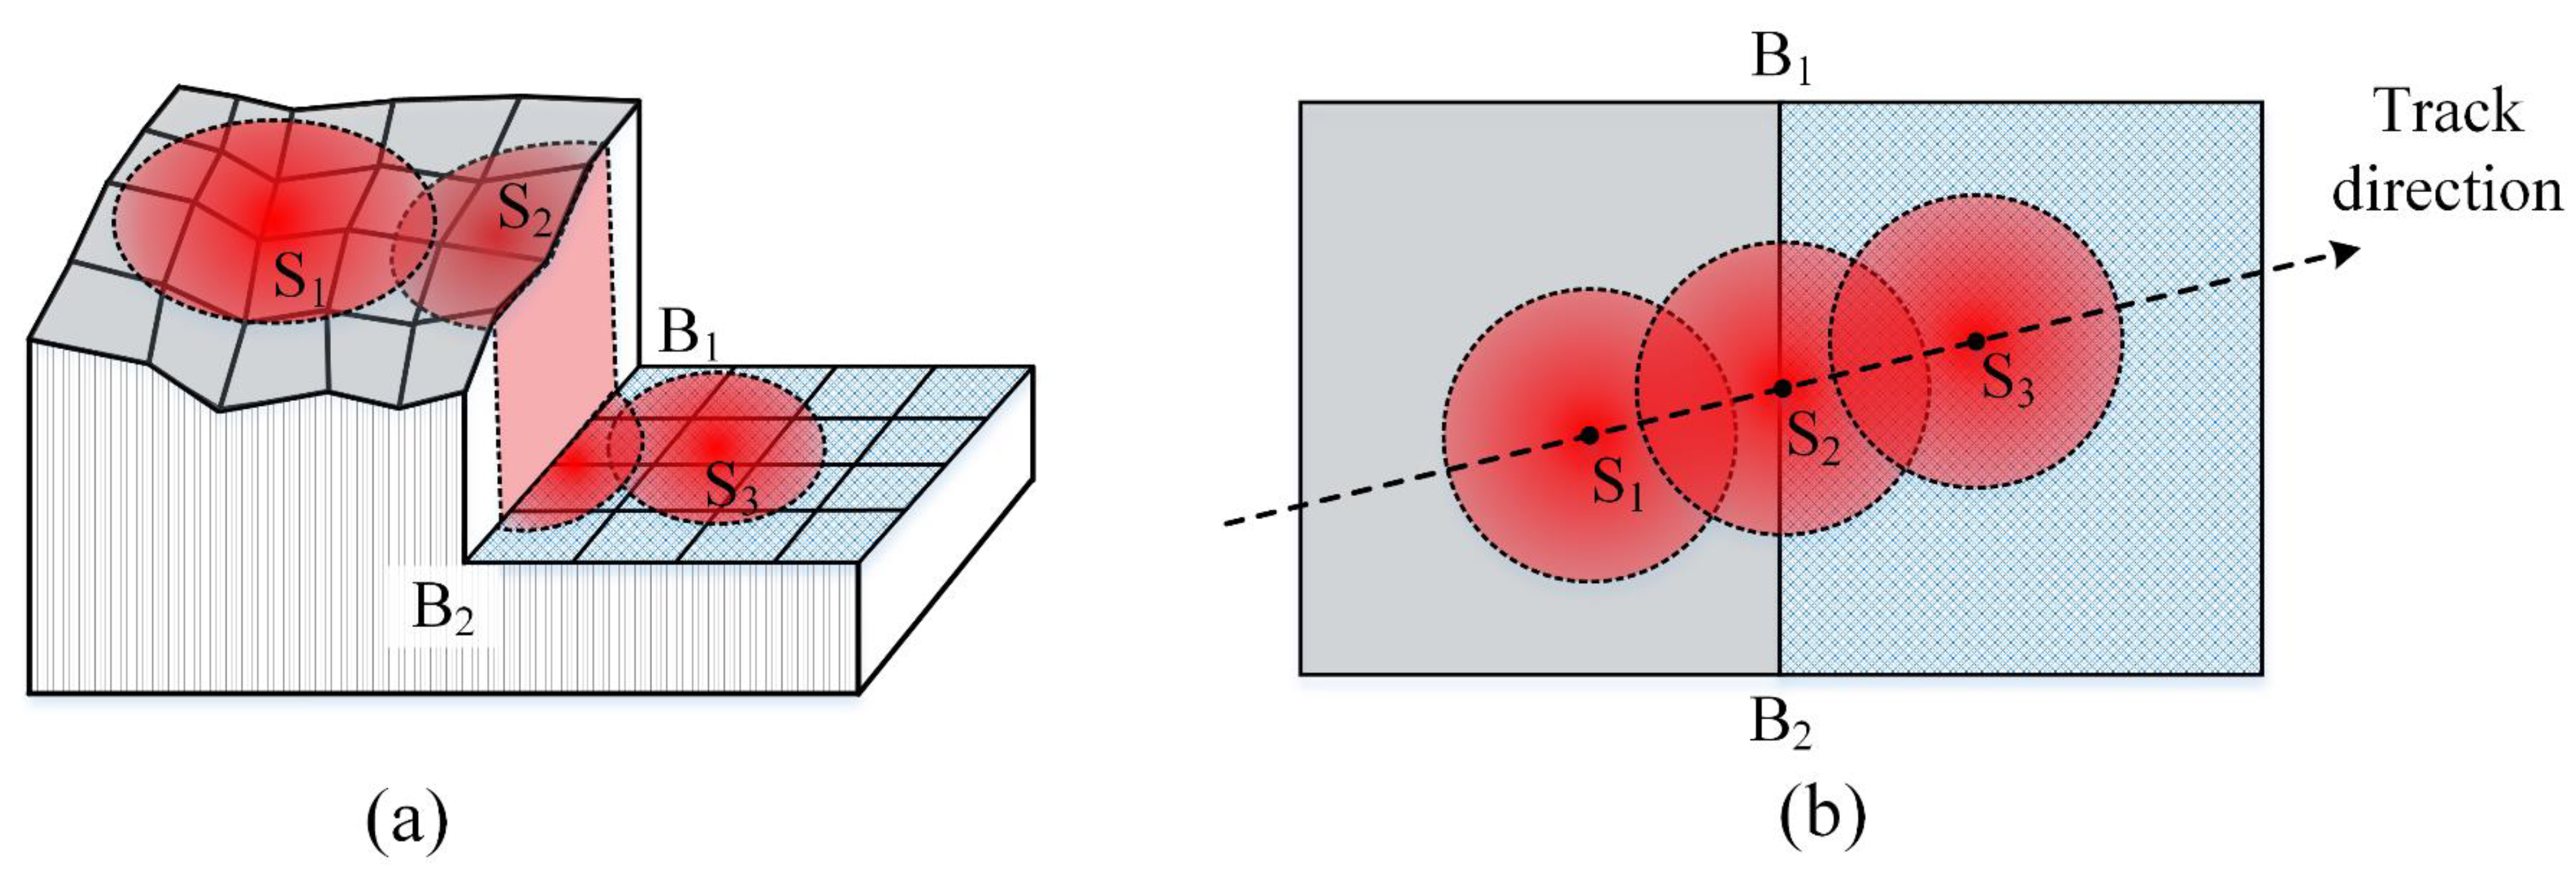
The spot formed by the laser emission beam irradiating to the ground is diffuse. Usually, a two-dimensional Gaussian function is used to fit the spot energy distribution to classify the elevation of the survey area in the laser footprint spot. The reflected waveform signal of the spot on a specific surface is used to invert the spot energy parameters and establish the correlation between the laser waveform and the spot energy distribution. Due to the step surface area showing more than one effective wave peak signal, it is easier to distinguish the reflection waveform signal from different surfaces. Assuming that the laser beam sequence [Sn] is irradiated upon the step surface area (as shown in Figure 7), the waveform signal reflected by a specific flat surface is [Wn], and the laser sub-waveform energy index is .
The spacing between adjacent laser spot centers is known to be d, and the angle between the along-track direction and the step surface boundary line B1B2 is . Then, the energy distribution of the laser spot can be expressed as Formula (6):
A fitting method is needed to obtain the complete energy distribution of the laser spot from the discrete energy index. The spot energy distribution is obtained by a Gaussian fitting method to extract the parameters of the laser spot.
4. Results
4.1. Data
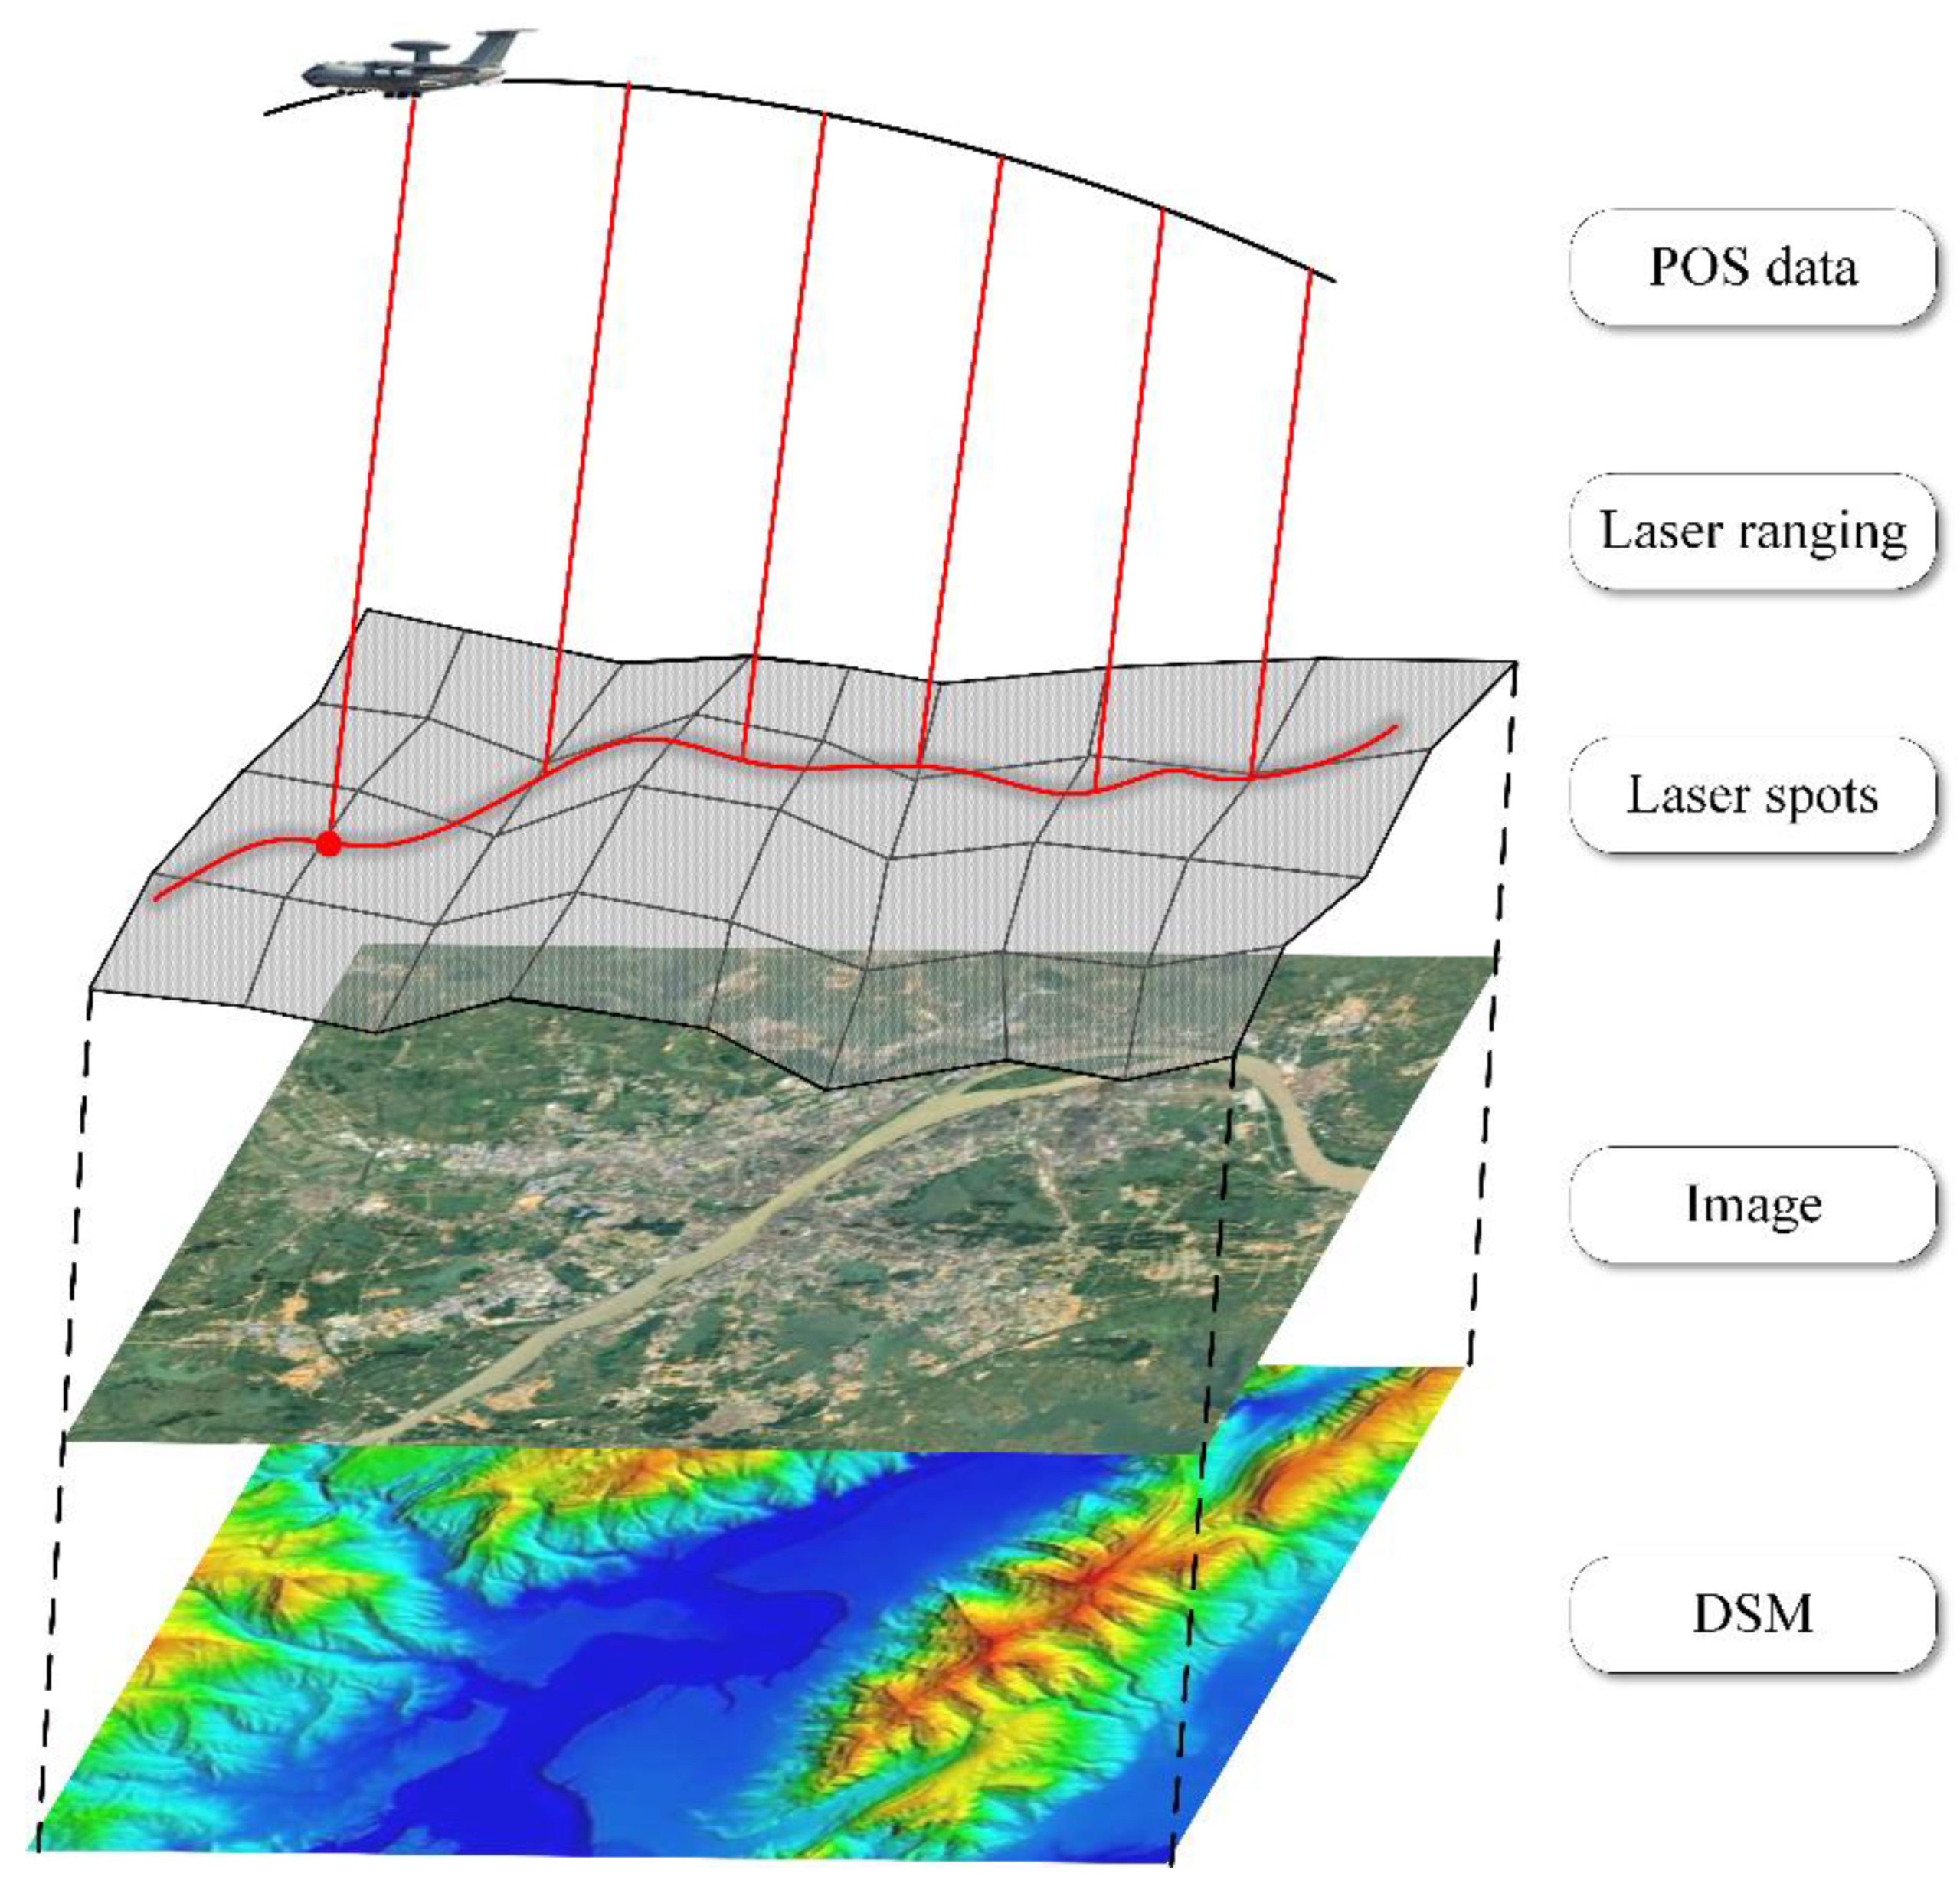
The high-precision POS integrated with the airborne large-footprint laser altimeter system can record the platform’s position and attitude data in real time. The laser altimeter system can completely record the full-waveform data of the transmitted and echo signals, which can be used not only to accurately calculate the elevation of the surface but also to obtain the spatial structure information of the vegetation in the forest area, including the heights of trees and the slope and fluctuation of the surface. The laser ranging data calculated from the full-waveform data combined with the POS data can be used to obtain the position information of the laser footprint spot. During the experiment, high-resolution image data and lidar point cloud data of the survey area were acquired simultaneously and were used to assist in verifying the performance and index of the large-footprint laser load. The data collection for this experiment is shown in Figure 8.
The experimental area is located in the northwest of Hunan Province, across Zhangjiajie, Changde, Xiangxi Autonomous Prefecture, and other regions. In the experimental area, three routes in the east, two routes in the southwest, and four routes in the west were planned according to the distribution of forest land. After completing the measurement task, the flight crossed through an urban area to complete the self-calibration of the load. The experimental data in this study mainly use the 10th route and 11th route of the large-footprint laser measurement data, which are mainly located near urban areas and contain different feature types such as buildings, farmland, and water, as shown in Figure 9.
4.2. Experiments and Results
This study performs geometric calibration and verification of laser spots by using full-waveform data from the laser altimeter without ground detectors, focused on the airborne large-footprint laser altimeter system. Experimental data include the full-waveform data measured by the large-footprint laser altimeter and the high-precision DSM data of the survey area.
Flat terrain areas are selected for the validation experiments to ensure that at least one laser beam can completely irradiate the flat surface and that there is a step change in the elevation of the surface in the along-track direction. A total of six flat terrain areas were selected as experimental areas, and the types of surface objects were mainly river shorelines and road edges, as shown in Figure 10.
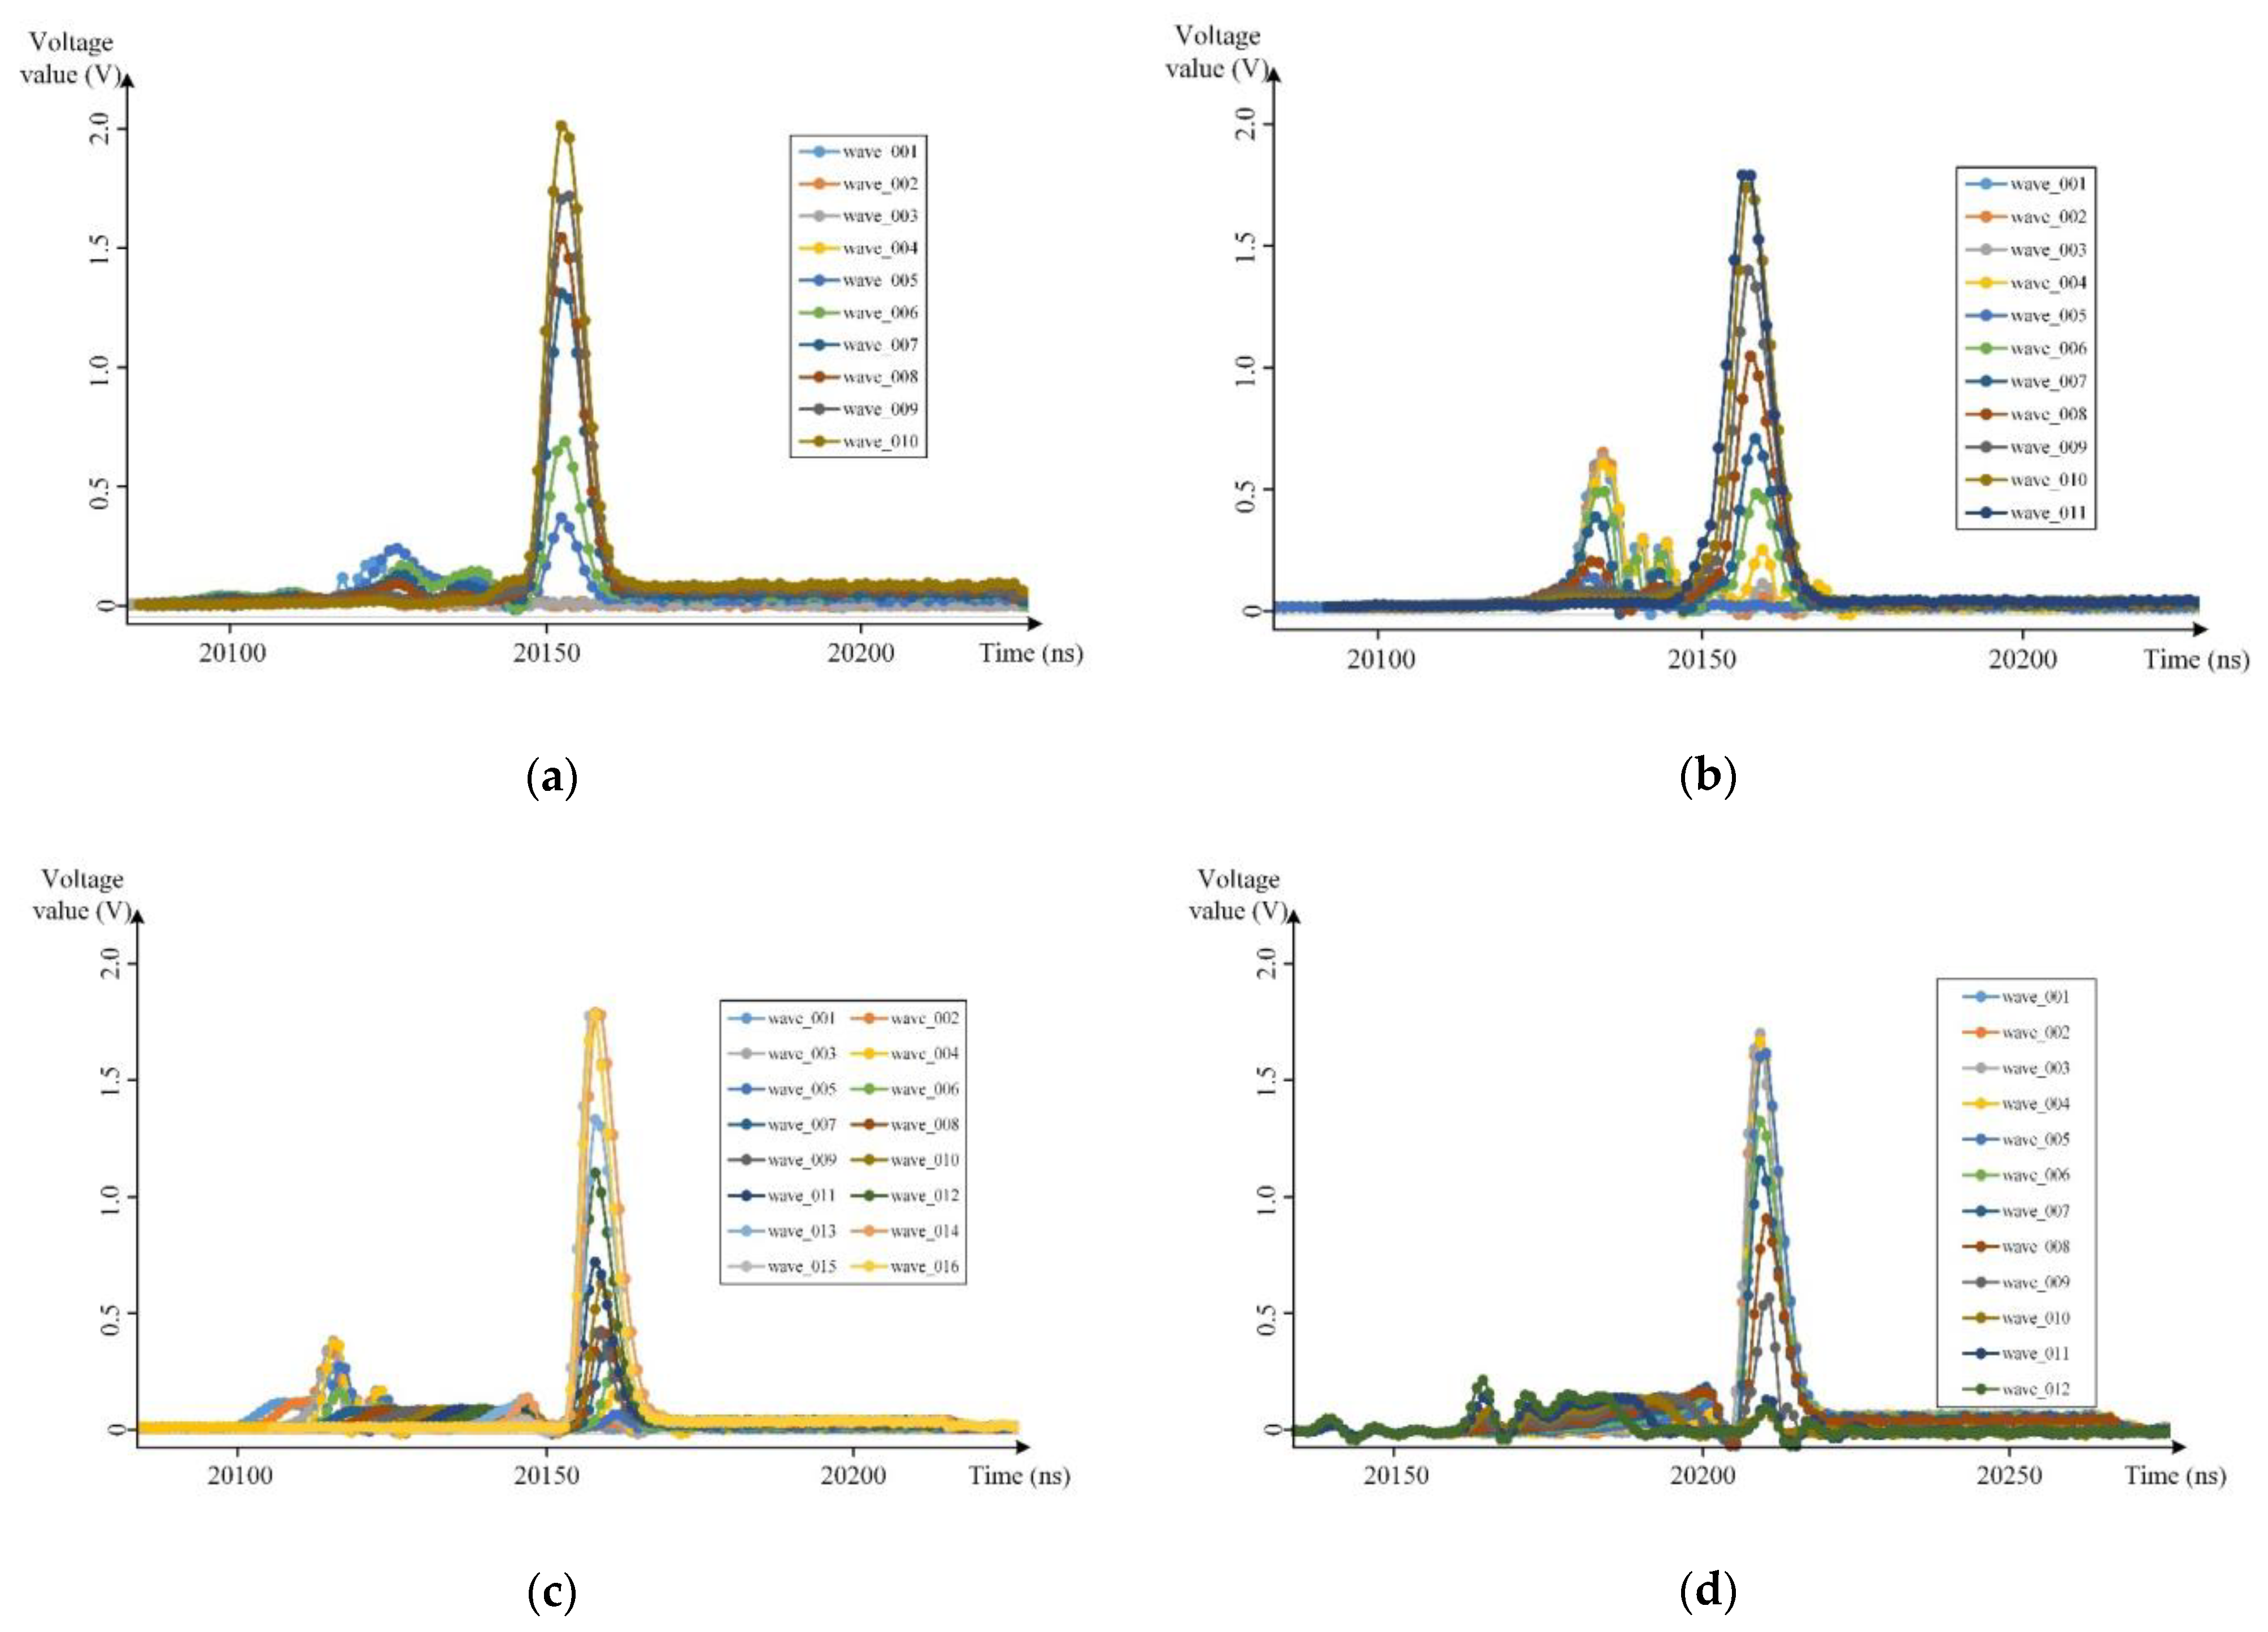
The waveforms of the above six groups of experimental areas were screened and preprocessed to obtain the precise location information of the laser footprint spot and intercept the effective signal part of the laser waveform. The laser echo waveform data of the experimental areas are shown in Figure 11.
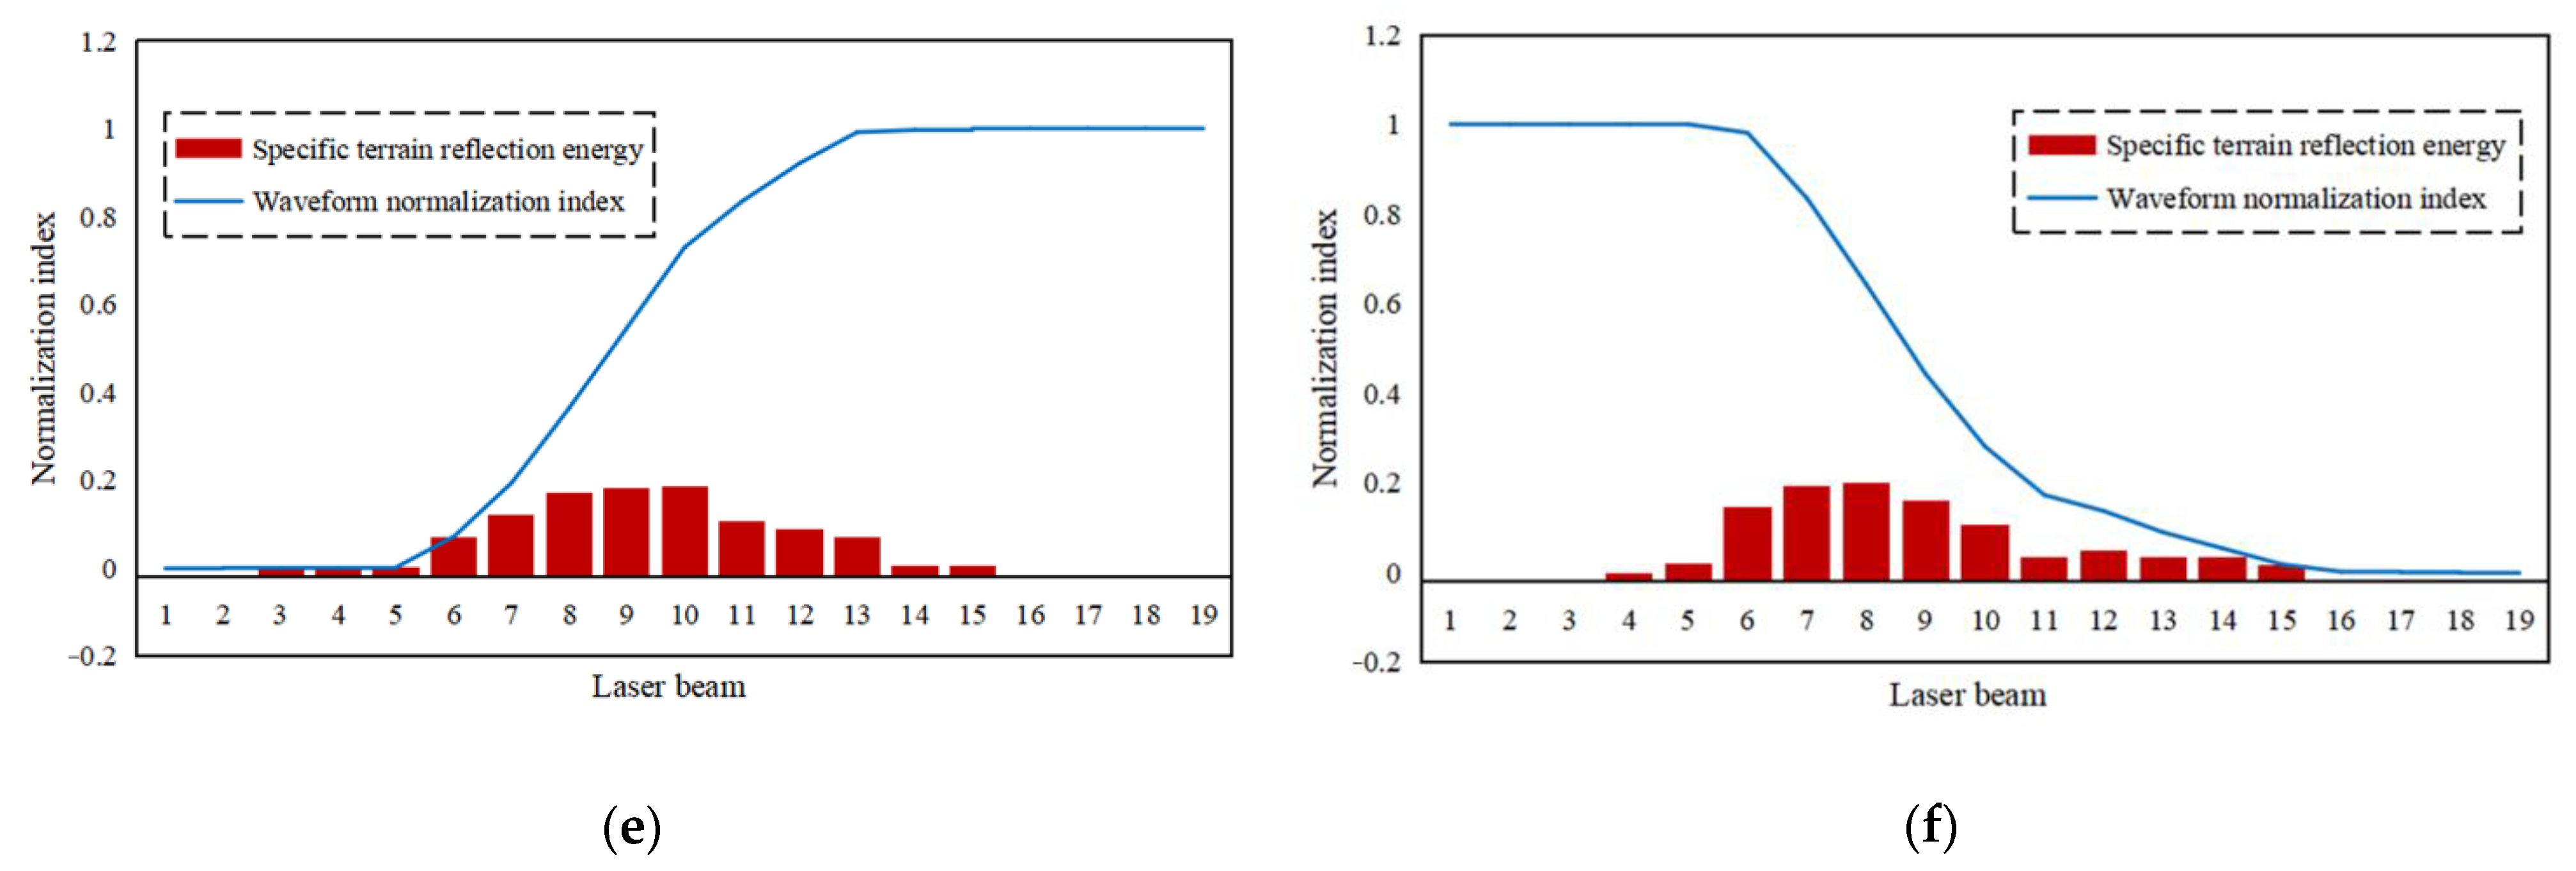
Combining the position of laser footprint spots on the ground and waveform characteristics, the echo waveforms are decomposed, and their energy indexes for the specific terrains are extracted. Because the reflectivity of the laser beam irradiated to the ground surface is different in different experimental areas, we normalized the energy index of laser waveforms in each area in order to ensure the consistency of the echo waveform energy index in the six experimental areas. The results are shown in Figure 12.
The energy index of each laser beam is fitted according to the energy distribution model (see Formula (6)) of the laser spot, and 1/e2 of the spot energy distribution is used as the detection boundary to obtain the results of the characteristic parameters of the airborne laser spots, as shown in Table 3. The fitting results of the airborne laser spots, as shown in Figure 13.
4.3. Accuracy Analysis
Due to the differences in surface emissivity, the energy distribution of the six groups of laser spots obtained in the above experiments is inconsistent. To further evaluate the effectiveness of the laser spot, the consistency of any two of the six groups of laser spots was evaluated separately. The energy distribution of the spot was first normalized, and the correlation coefficient of any two groups of the spot energy normalization matrix was evaluated. The evaluation results were shown in Table 4.
From the statistical results, it can be found that the energy distribution consistency of any two groups of laser spots is in the range of 84.88% to 99.67%, where the mean and standard deviation of the laser spot energy distribution consistency is 92.67% ± 5.28%.
5. Discussion
Calibration of the airborne laser spot parameters can be achieved by using the method in this paper, including the divergence angle, the center position, and the energy distribution of the laser spots. Based on the above experiments, the average divergence angle of the laser beam is 4.604 mRad, and the standard deviation is 0.359 mRad. Usually, the laboratory uses the spot data on photographic film to measure the divergence angle of the laser altimeter, but the measured data utilized here are the signal edge of the laser emission beam. After this flight test, an additional experiment is added to verify the calibration parameters by comparing the test data with the laser spot data collected in the laboratory, as shown in Figure 14. The divergence angle of the laser beam is 4.85 mRad, using the laser spot image collected in the laboratory.
The calibration process in this study does not depend on a calibration field but the determination of the spot energy distribution boundary by using the reflected energy of the laser beam on the ground. There are some differences between the two methods of measuring the divergence angle of the laser beam. The reflected signal through the laser spot will inevitably lead to a sharp reduction in energy, and the definition of the spot edge is still calculated according to the 1/e2 of the energy distribution as the basis for the solution, so the calculated divergence angle of the laser beam is slightly smaller than the design parameter. In this regard, the consistency of the spot energy distribution in each of the six experimental areas is evaluated compared to the laser spot image collected in the laboratory, as shown in Table 5.
The consistency of the six spots’ energy distribution is between 91% and 96%, compared to a laser spot image collected in the laboratory. From the results in Table 4 and Table 5, the method proposed in this paper can be used to calibrate the geometric parameters of the large-footprint laser altimeter, and the energy distribution of the acquired laser spot still has a high consistency, due to the influence of external environmental factors such as surface reflectivity and noise.
6. Conclusions
This study of calibration methods without calibration fields was carried out, utilizing an airborne large-footprint laser altimeter. The detection of laser spots using the step surface boundary was proposed to obtain the geometric measurement parameters of the laser altimeter, and a validation of the feasibility of the method was conducted. The following conclusions were drawn.
- The geometric parameter calibration of the large-footprint laser altimeter can be achieved in the area of the step surface, complementing the laser calibration field. It greatly improves the efficiency of the on-orbit calibration for the laser altimeter and provides a reference for the inversion of vegetation height with the laser measurement data;
- The feasibility of the method in this paper was verified by experiments of airborne large-footprint laser altimetry. The divergence angle of the laser beam obtained from the six experimental areas was slightly smaller than the design parameter, and the consistency of the energy distribution from each laser spot reached 92.67%.
In this paper, we propose a laser spot calibration method based on a step surface without a calibration field to verify the load performance of the airborne large-footprint laser altimeter system for forestry survey. This study lays a foundation for the next large-scale forestry surveys using the airborne large-footprint laser altimeter system and provides a new idea for the on-orbit calibration and verification of subsequent carbon satellite laser altimeter systems.
Author Contributions
S.L. and Q.Y. proposed the methodology and wrote the manuscript. G.Z. contributed to improving the methodology and is the corresponding author. A.F. helped edit and improve the manuscript. Q.Y. contributed to methodological testing. All authors have read and agreed to the published version of the manuscript.
Funding
This research was supported by the project of the National Natural Science Foundation of China (No. 41901400), the project of the Scientific Research Fund of Hunan Provincial Education Department (No. 2023JJ30233), and the project of the Education Department Science Project of Hunan Province (Grant No. 20C0800).
Data Availability Statement
The data are not publicly available due to privacy restrictions.
Acknowledgments
We would like to sincerely thank the reviewers and editors for their helpful comments and insightful suggestions.
Conflicts of Interest
The authors declare no conflict of interest.
References
- Li, J.; Fan, C.; Chu, Y.; Zhang, S. Using ICESAT altimeter data to determine the Antarctic ice sheet elevation model. Geomat. Inf. Sci. Wuhan Univ. 2008, 33, 226–228. [Google Scholar]
- Zhuang, W.; Mountrakis, G. An accurate and computationally efficient algorithm for ground peak identification in large footprint waveform LiDAR data. ISPRS-J. Photogramm. Remote Sens. 2014, 95, 81–92. [Google Scholar] [CrossRef]
- Nie, S.; Wang, C.; Xi, X.; Li, G.; Luo, S.; Yang, X.; Wang, P.; Zhu, X. Exploring the influence of various factors on slope estimation using large-footprint LiDAR data. IEEE Trans. Geosci. Remote Sens. 2018, 56, 6611–6621. [Google Scholar] [CrossRef]
- Duncanson, L.; Niemann, K.; Wulder, M. Estimating forest canopy height and terrain relief from GLAS waveform metrics. Remote Sens. Environ. 2010, 114, 138–154. [Google Scholar] [CrossRef]
- Wang, X.; Huang, H.; Gong, P.; Liu, C.; Li, C.; Li, W. Forest canopy height extraction in rugged areas with ICESAT/GLAS data. IEEE Trans. Geosci. Remote Sens. 2013, 52, 4650–4657. [Google Scholar] [CrossRef]
- Fayad, I.; Baghdadi, N.; Bailly, J.-S.; Barbier, N.; Gond, V.; El Hajj, M.; Fabre, F.; Bourgine, B. Canopy height estimation in French Guiana with LiDAR ICESat/GLAS data using principal component analysis and random forest regressions. Remote Sens. 2014, 6, 11883–11914. [Google Scholar] [CrossRef]
- Li, Z.; Liu, Q.; Pang, Y. Review on forest parameters inversion using LiDAR. J. Remote Sens. 2016, 20, 1138–1150. [Google Scholar]
- Wang, Y.; Ni, W.; Sun, G.; Chi, H.; Zhang, Z.; Guo, Z. Slope-adaptive waveform metrics of large footprint lidar for estimation of forest aboveground biomass. Remote Sens.Environ. 2019, 224, 386–400. [Google Scholar] [CrossRef]
- Schutz, B.E.; Zwally, H.J.; Shuman, C.A.; Hancock, D.; DiMarzio, J.P. Overview of the ICESat mission. Geophys. Res. Lett. 2005, 32, L21S01. [Google Scholar] [CrossRef]
- Yi, D.; Zwally, H.J.; Sun, X. ICESat measurement of Greenland ice sheet surface slope and roughness. Ann. Glaciol. 2005, 42, 83–89. [Google Scholar] [CrossRef]
- Brenner, A.C.; DiMarzio, J.P.; Zwally, H.J. Precision and accuracy of satellite radar and laser altimeter data over the continental ice sheets. IEEE Trans. Geosci. Remote Sens. 2007, 45, 321–331. [Google Scholar] [CrossRef]
- Jansma, P.; Mattioli, G.; Matias, A. Slicer laser altimetry in the eastern Caribbean. Surv. Geophys. 2001, 22, 561–579. [Google Scholar] [CrossRef]
- Park, T.; Kennedy, R.E.; Choi, S.; Wu, J.; Lefsky, M.A.; Bi, J.; Mantooth, J.A.; Myneni, R.B.; Knyazikhin, Y. Application of physically-based slope correction for maximum forest canopy height estimation using waveform lidar across different footprint sizes and locations: Tests on LVIS and GLAS. Remote Sens. 2014, 6, 6566–6586. [Google Scholar] [CrossRef]
- Li, X.; Xu, K.; Xu, L. Within-footprint roughness measurements using ICESat/GLAS waveform and LVIS elevation. Meas. Sci. Technol. 2016, 27, 125012. [Google Scholar] [CrossRef]
- Duncanson, L.; Neuenschwander, A.; Hancock, S.; Thomas, N.; Fatoyinbo, T.; Simard, M.; Silva, C.A.; Armston, J.; Luthcke, S.B.; Hofton, M. Biomass estimation from simulated GEDI, ICESat-2 and NISAR across environmental gradients in Sonoma County, California. Remote Sens.Environ. 2020, 242, 111779. [Google Scholar] [CrossRef]
- Silva, C.A.; Duncanson, L.; Hancock, S.; Neuenschwander, A.; Thomas, N.; Hofton, M.; Fatoyinbo, L.; Simard, M.; Marshak, C.Z.; Armston, J. Fusing simulated GEDI, ICESat-2 and NISAR data for regional aboveground biomass mapping. Remote Sens. Environ. 2021, 253, 112234. [Google Scholar] [CrossRef]
- Li, G.; Guo, J.; Tang, X.; Ye, F.; Zuo, Z.; Liu, Z.; Chen, J.; Xue, Y. Preliminary quality analysis of GF-7 satellite laser altimeter full waveform data. Int. Arch. Photogramm. Remote Sens. 2020, 43, 129–134. [Google Scholar] [CrossRef]
- Tang, X.; Xie, J.; Liu, R.; Huang, G.; Zhao, C.; Zhen, Y.; Tang, H.; Dou, X. Overview of the GF-7 laser altimeter system mission. Earth Space Sci. 2020, 7, e2019EA000777. [Google Scholar] [CrossRef]
- Xie, J.; Huang, G.; Liu, R.; Zhao, C.; Dai, J.; Jin, T.; Mo, F.; Zhen, Y.; Xi, S.; Tang, H. Design and data processing of China’s first spaceborne laser altimeter system for earth observation: GaoFen-7. IEEE J. Sel. Top. Appl. Earth Obs. Remote Sens. 2020, 13, 1034–1044. [Google Scholar] [CrossRef]
- Li, S.; Zhang, G.; Fan, X. Rigorous Sensor Model of Gaofen-7 Satellite Laser Altimeter Based on Coupled Footprint Camera. IEEE J. Sel. Top. Appl. Earth Obs. Remote Sens. 2023, 16, 1815–1826. [Google Scholar] [CrossRef]
- ZHANG, X.; MAO, Y.; MO, F. Overall Design of Terrestrial Ecosystem Carbon Inventory Satellite. Spa. Rec. Remote Sens. 2022, 43, 16–26. [Google Scholar]
- Zhang, X.; Wu, Y. Design of Laser Transmitter for Terrestrial Ecosystem Carbon Inventory Satellite’s Multi-beam LiDAR. Spacecr. Rec. Remote Sens. 2022, 43, 59–67. [Google Scholar]
- Wu, F.; Gao, X.; Pan, C.; Sun, Z.; Wang, L.; Liu, Y. Design and application of forest detecting based on airborne large-footprint LiDAR system. For. Res. Manag. 2018, 4, 125–132. [Google Scholar] [CrossRef]
- Hu, Y.; Wu, F.; Sun, Z.; Lister, A.; Gao, X.; Li, W.; Peng, D. The laser vegetation detecting sensor: A full waveform, large-footprint, airborne laser altimeter for monitoring forest resources. Sensors 2019, 19, 1699. [Google Scholar] [CrossRef] [PubMed]
- Chen, X. Waveform Processing and Accuracy Verification of Airborne Large-Footprint LiDAR System. Master’s Thesis, Wuhan University, Wuhan, China, 2019. [Google Scholar]
- Sun, Z.; Wu, F.; Gao, X.; Gao, J.; Hu, Y. Estimation of Forest Canopy Height Based on Large-Footprint Airborne LiDAR Data. For. Res. Manag. 2020, 3, 111–117. [Google Scholar] [CrossRef]
- Tang, X.; Xie, J.; Fu, X.; Mo, F.; Li, S.; Dou, X. ZY3-02 laser altimeter on-orbit geometrical calibration and test. Acta Geod. Et Cartogr. Sin. 2017, 46, 714–723. [Google Scholar]
- Tang, X.; Xie, J.; Mo, F.; Dou, X.; Li, X.; Li, S.; Li, S.; Huang, G.; Fu, X.; Liu, R. GF-7 dual-beam laser altimeter on-orbit geometric calibration and test verification. Acta Geod. Cartogr. Sin. 2021, 50, 384–395. [Google Scholar]
- Liu, Y.; Gao, X.; He, Y.; Cui, C.; Gao, J.; Yu, J.; Cai, L.; Wu, F. Calibration and Validation of National Forest and Grassland Inventory Airborne Large-Footprint LiDAR. For. Res. Manag. 2021, 2, 52–56. [Google Scholar] [CrossRef]
- Tang, X.; Xie, J.; Mo, F.; Zhu, G.; Dou, X.; Zhang, Q.; Li, G.; Ouyang, S. Footprint location prediction method of ZY3-02 altimeter. Acta Geod. Cartogr. Sin. 2017, 46, 866–873. [Google Scholar]
- ZHANG, G.; LI, S.; HUANG, W.; LI, D. Geometric calibration and validation of ZY3-02 satellite laser altimeter system. Geomat. Inf. Sci. Wuhan Univ. 2017, 42, 1589–1596. [Google Scholar]
- YUE, C.; SUN, S.; HE, H. A Positioning Method in Footprint of Space-Borne Laser Altimeter. Geomat. Inf. Sci. Wuhan Univ. 2019, 44, 586–592. [Google Scholar]
- Li, S.; Li, C.; Zhang, G.; Wang, Y. Geometric calibration of satellite laser altimeters based on waveform matching. Photogramm. Rec. 2021, 36, 104–123. [Google Scholar] [CrossRef]
Figure 1.
The airborne large-footprint laser altimeter system.

Figure 2.
Main process of geometric calibration for airborne large-footprint laser altimeter.

Figure 3.
Schematic diagram of geometric positioning for the airborne laser altimeter.

Figure 4.
Schematic diagram of the laser spot’s distribution in step terrain.

Figure 5.
Schematic diagram of the laser waveform’s energy index. The black line indicates the original laser waveform and the red line indicates the waveform after Gaussian fitting.
Figure 5.
Schematic diagram of the laser waveform’s energy index. The black line indicates the original laser waveform and the red line indicates the waveform after Gaussian fitting.

Figure 6.
Preprocessing process of laser waveforms.

Figure 7.
Schematic diagram of the laser spot’s energy index in step terrain from a stereoscopic (a) and top (b) viewpoint.
Figure 7.
Schematic diagram of the laser spot’s energy index in step terrain from a stereoscopic (a) and top (b) viewpoint.

Figure 8.
Data of the airborne large-footprint laser altimeter system.

Figure 9.
Experimental area and image of airborne laser spots.

Figure 10.
Laser points distribution in the six (a–f) experimental areas.


Figure 11.
Laser waveforms in the six (a–f) experimental areas.


Figure 12.
The normalized index of (a–f) laser waveforms.


Figure 13.
Fitting results of (a–f) the airborne laser spots.

Figure 14.
The laser spot measured in the laboratory.


Table 1.
Technical parameters of the airborne large-footprint laser altimeter system.
| Equipment | Parameter | Value |
|---|---|---|
| Laser altimeter | Laser wavelength | 1064 nm |
| Pulse energy | 2 mJ | |
| Divergence angle | 5 mrad | |
| FWHM | 2.0~3.0 ns | |
| Pulse repetition rate | 40 Hz | |
| Telescope | Diameter | 100 mm |
| FOV | 6 mrad | |
| Electronic system | Sampling frequency | 1.0 GHz |
Table 2.
Measured parameters of the airborne large-footprint laser altimeter.
| Flight Altitude | Flight Speed | Spot Diameter | Adjacent Spot Centers Spacing |
|---|---|---|---|
| 3 km | 110 m/s | 15 m | ~2.75 m |
Table 3.
Parameters of the airborne laser spots.
| Experimental Areas | Flight Altitude (m) | Angle ε (°) | Adjacent Spot Centers Spacing (m) | Fitting Spot Diameter (m) | Divergence Angle (mRad) |
|---|---|---|---|---|---|
| Aera_01 | 3043.35 | 59.64 | 2.73 | 12.98 | 5.06 |
| Aera_02 | 3043.95 | 52.69 | 1.83 | 12.33 | 4.81 |
| Aera_03 | 3040.65 | 74.98 | 1.88 | 10.98 | 4.29 |
| Aera_04 | 3046.51 | 70.23 | 2.07 | 10.58 | 4.12 |
| Aera_05 | 3002.55 | 82.71 | 1.58 | 12.22 | 4.83 |
| Aera_06 | 2956.05 | 86.11 | 1.76 | 11.21 | 4.51 |
Table 4.
Consistency of the laser spot’s energy distribution.
| Spot Matrix Consistency | Aera_01 | Aera_02 | Aera_03 | Aera_04 | Aera_05 | Aera_06 |
|---|---|---|---|---|---|---|
| Aera_01 | 100% | 89.50% | 98.52% | 84.88% | 99.94% | 89.13% |
| Aera_02 | 90.50% | 100% | 91.84% | 95.82% | 90.55% | 99.66% |
| Aera_03 | 98.55% | 91.11% | 100% | 86.56% | 98.60% | 90.74% |
| Aera_04 | 86.87% | 95.99% | 88.15% | 100% | 86.92% | 96.31% |
| Aera_05 | 99.94% | 89.56% | 98.58% | 84.95% | 100% | 89.19% |
| Aera_06 | 90.20% | 99.67% | 91.53% | 96.17% | 90.25% | 100% |
Table 5.
Consistency of energy distribution between six spots and the measured spot in the laboratory.
Table 5.
Consistency of energy distribution between six spots and the measured spot in the laboratory.
| Spot Matrix Consistency | Aera_01 | Aera_02 | Aera_03 | Aera_04 | Aera_05 | Aera_06 |
|---|---|---|---|---|---|---|
| Measured spot in the labora-tory | 94.34% | 95.75% | 95.74% | 91.39% | 94.40% | 95.40% |
Disclaimer/Publisher’s Note: The statements, opinions and data contained in all publications are solely those of the individual author(s) and contributor(s) and not of MDPI and/or the editor(s). MDPI and/or the editor(s) disclaim responsibility for any injury to people or property resulting from any ideas, methods, instructions or products referred to in the content. |
© 2023 by the authors. Licensee MDPI, Basel, Switzerland. This article is an open access article distributed under the terms and conditions of the Creative Commons Attribution (CC BY) license (https://creativecommons.org/licenses/by/4.0/).
Share and Cite
MDPI and ACS Style
Li, S.; Yu, Q.; Fu, A.; Zhang, G. A Calibration Method for Large-Footprint Full-Waveform Airborne Laser Altimeter without a Calibration Field. Remote Sens. 2023, 15, 2789. https://0-doi-org.brum.beds.ac.uk/10.3390/rs15112789
AMA Style
Li S, Yu Q, Fu A, Zhang G. A Calibration Method for Large-Footprint Full-Waveform Airborne Laser Altimeter without a Calibration Field. Remote Sensing. 2023; 15(11):2789. https://0-doi-org.brum.beds.ac.uk/10.3390/rs15112789
Chicago/Turabian StyleLi, Shaoning, Qifan Yu, Anmin Fu, and Guo Zhang. 2023. "A Calibration Method for Large-Footprint Full-Waveform Airborne Laser Altimeter without a Calibration Field" Remote Sensing 15, no. 11: 2789. https://0-doi-org.brum.beds.ac.uk/10.3390/rs15112789
Note that from the first issue of 2016, this journal uses article numbers instead of page numbers. See further details here.