
UAV, GNSS, and InSAR Data Analyses for Landslide Monitoring in a Mountainous Village in Western Greece

 , , ,
, , ,
Abstract
:1. Introduction
2. Study Area
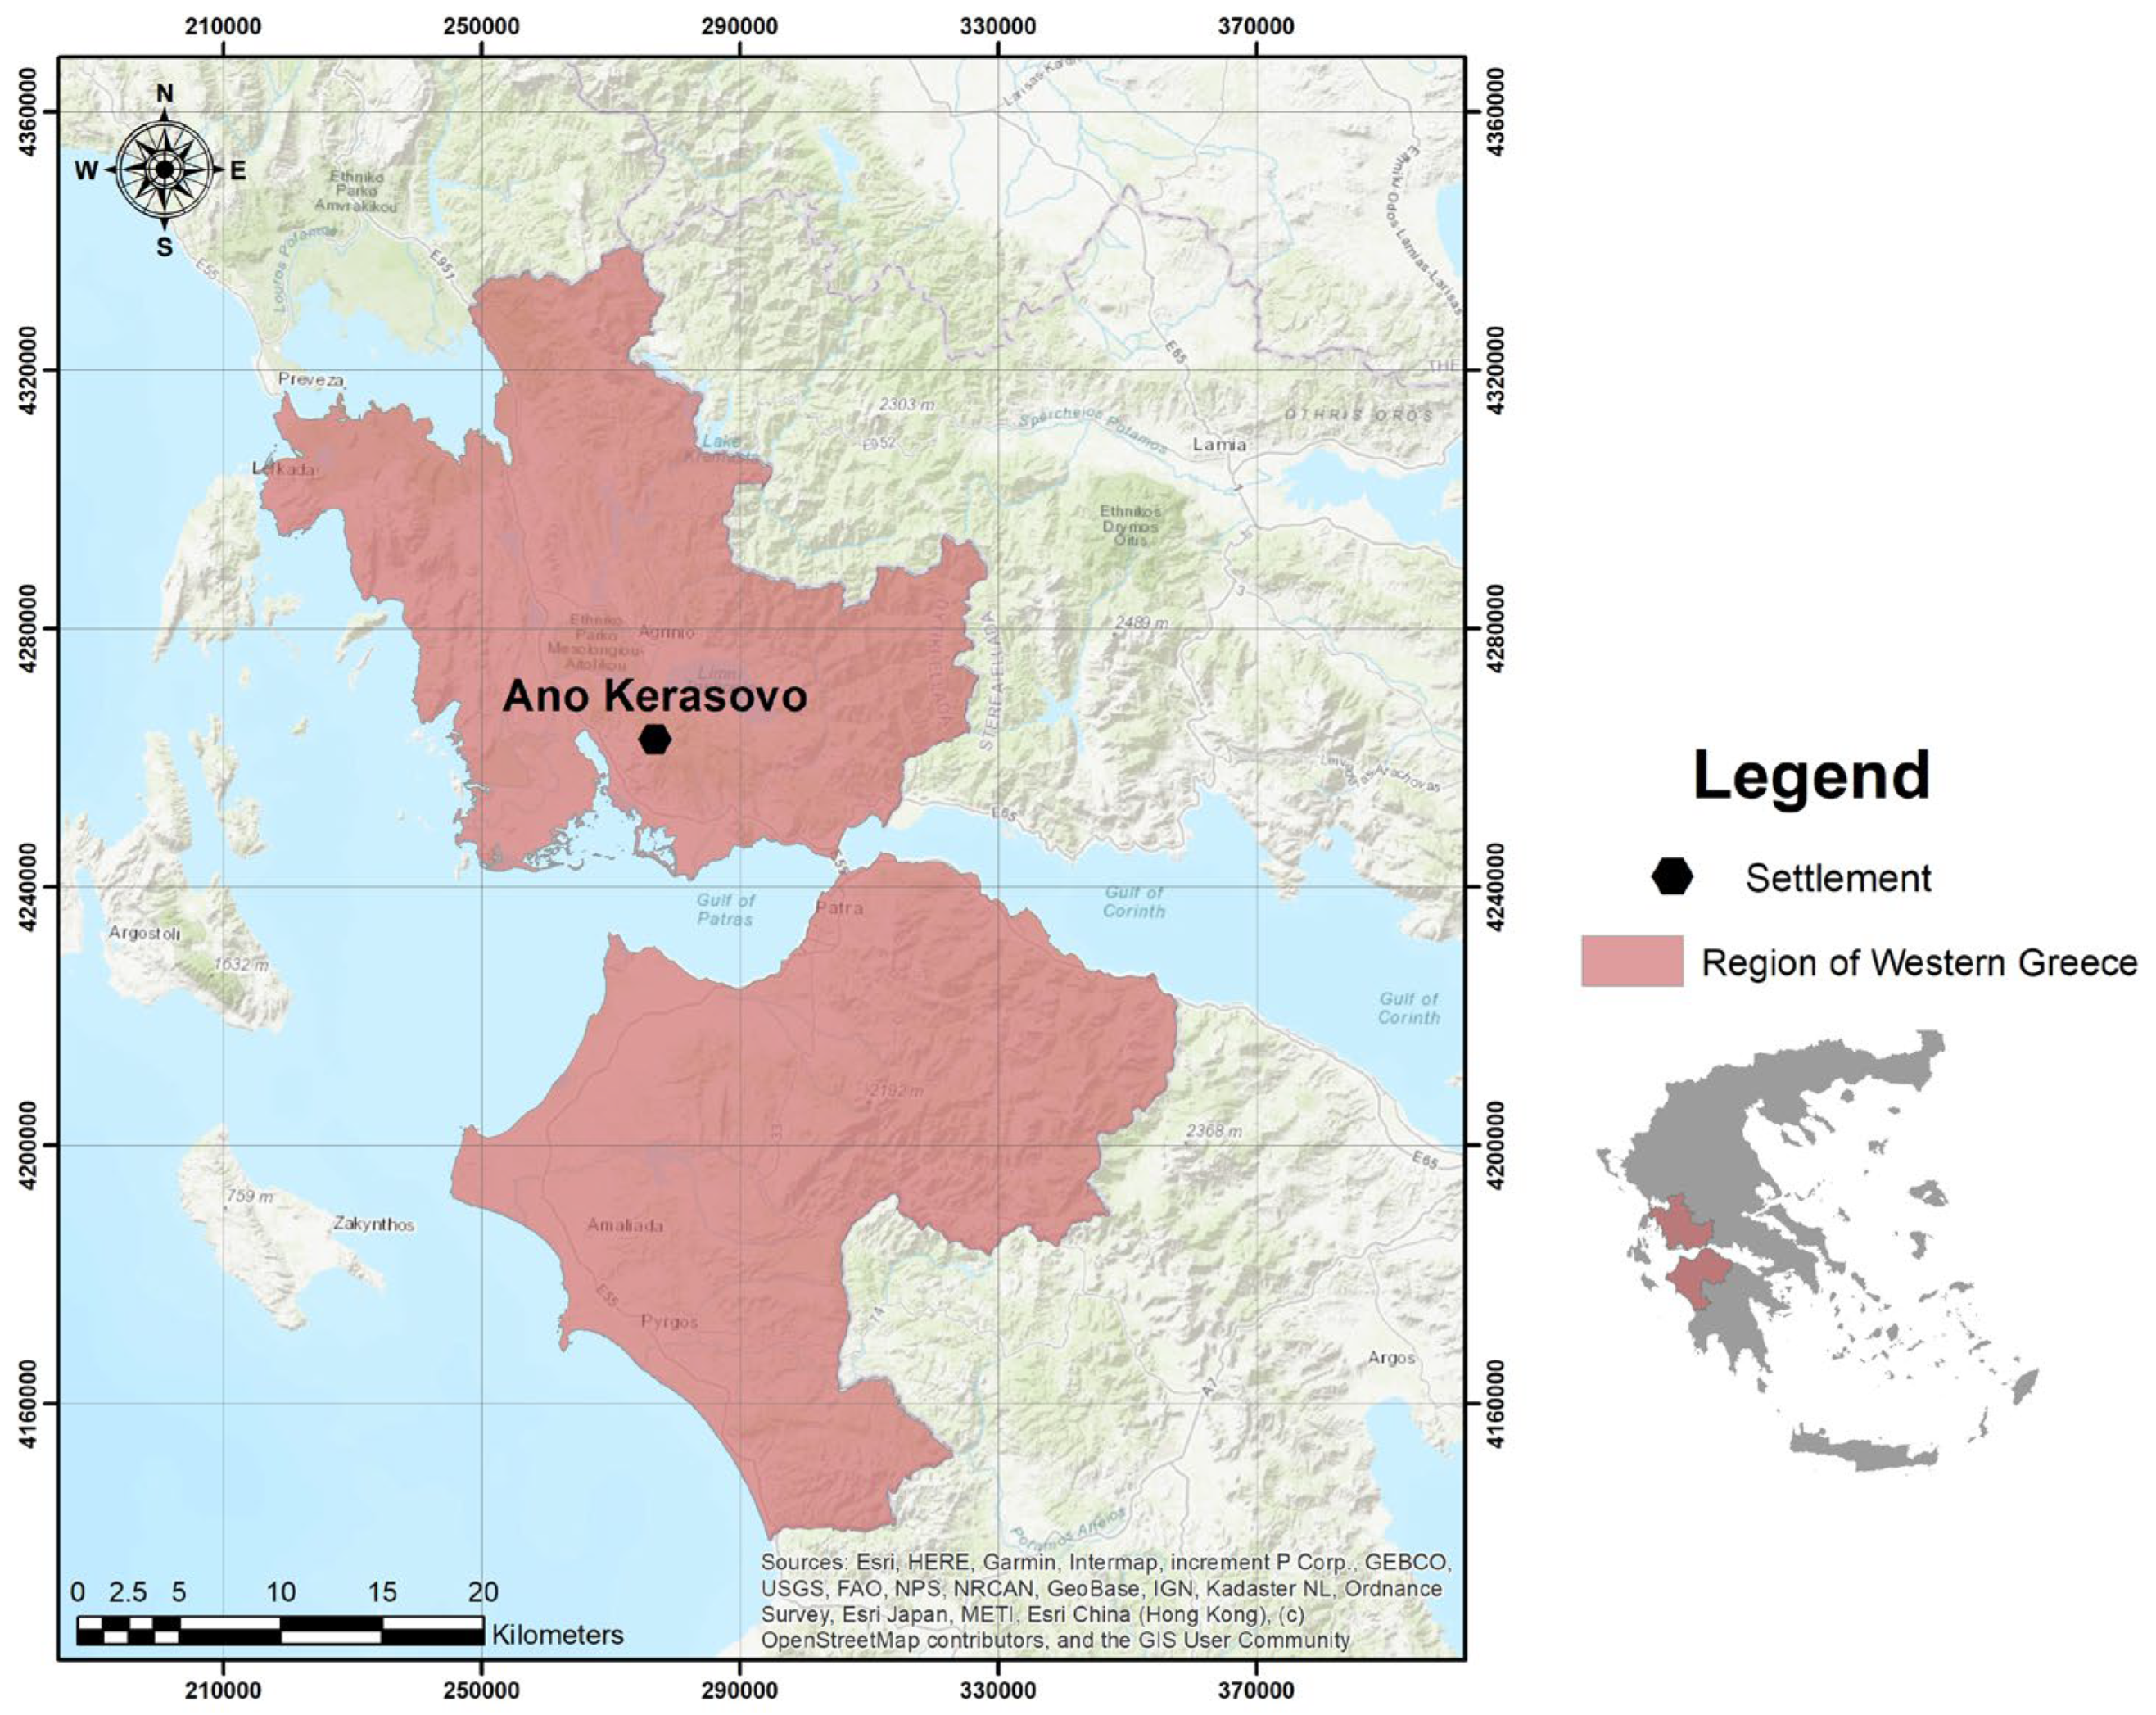
2.1. Location and Geological Setting
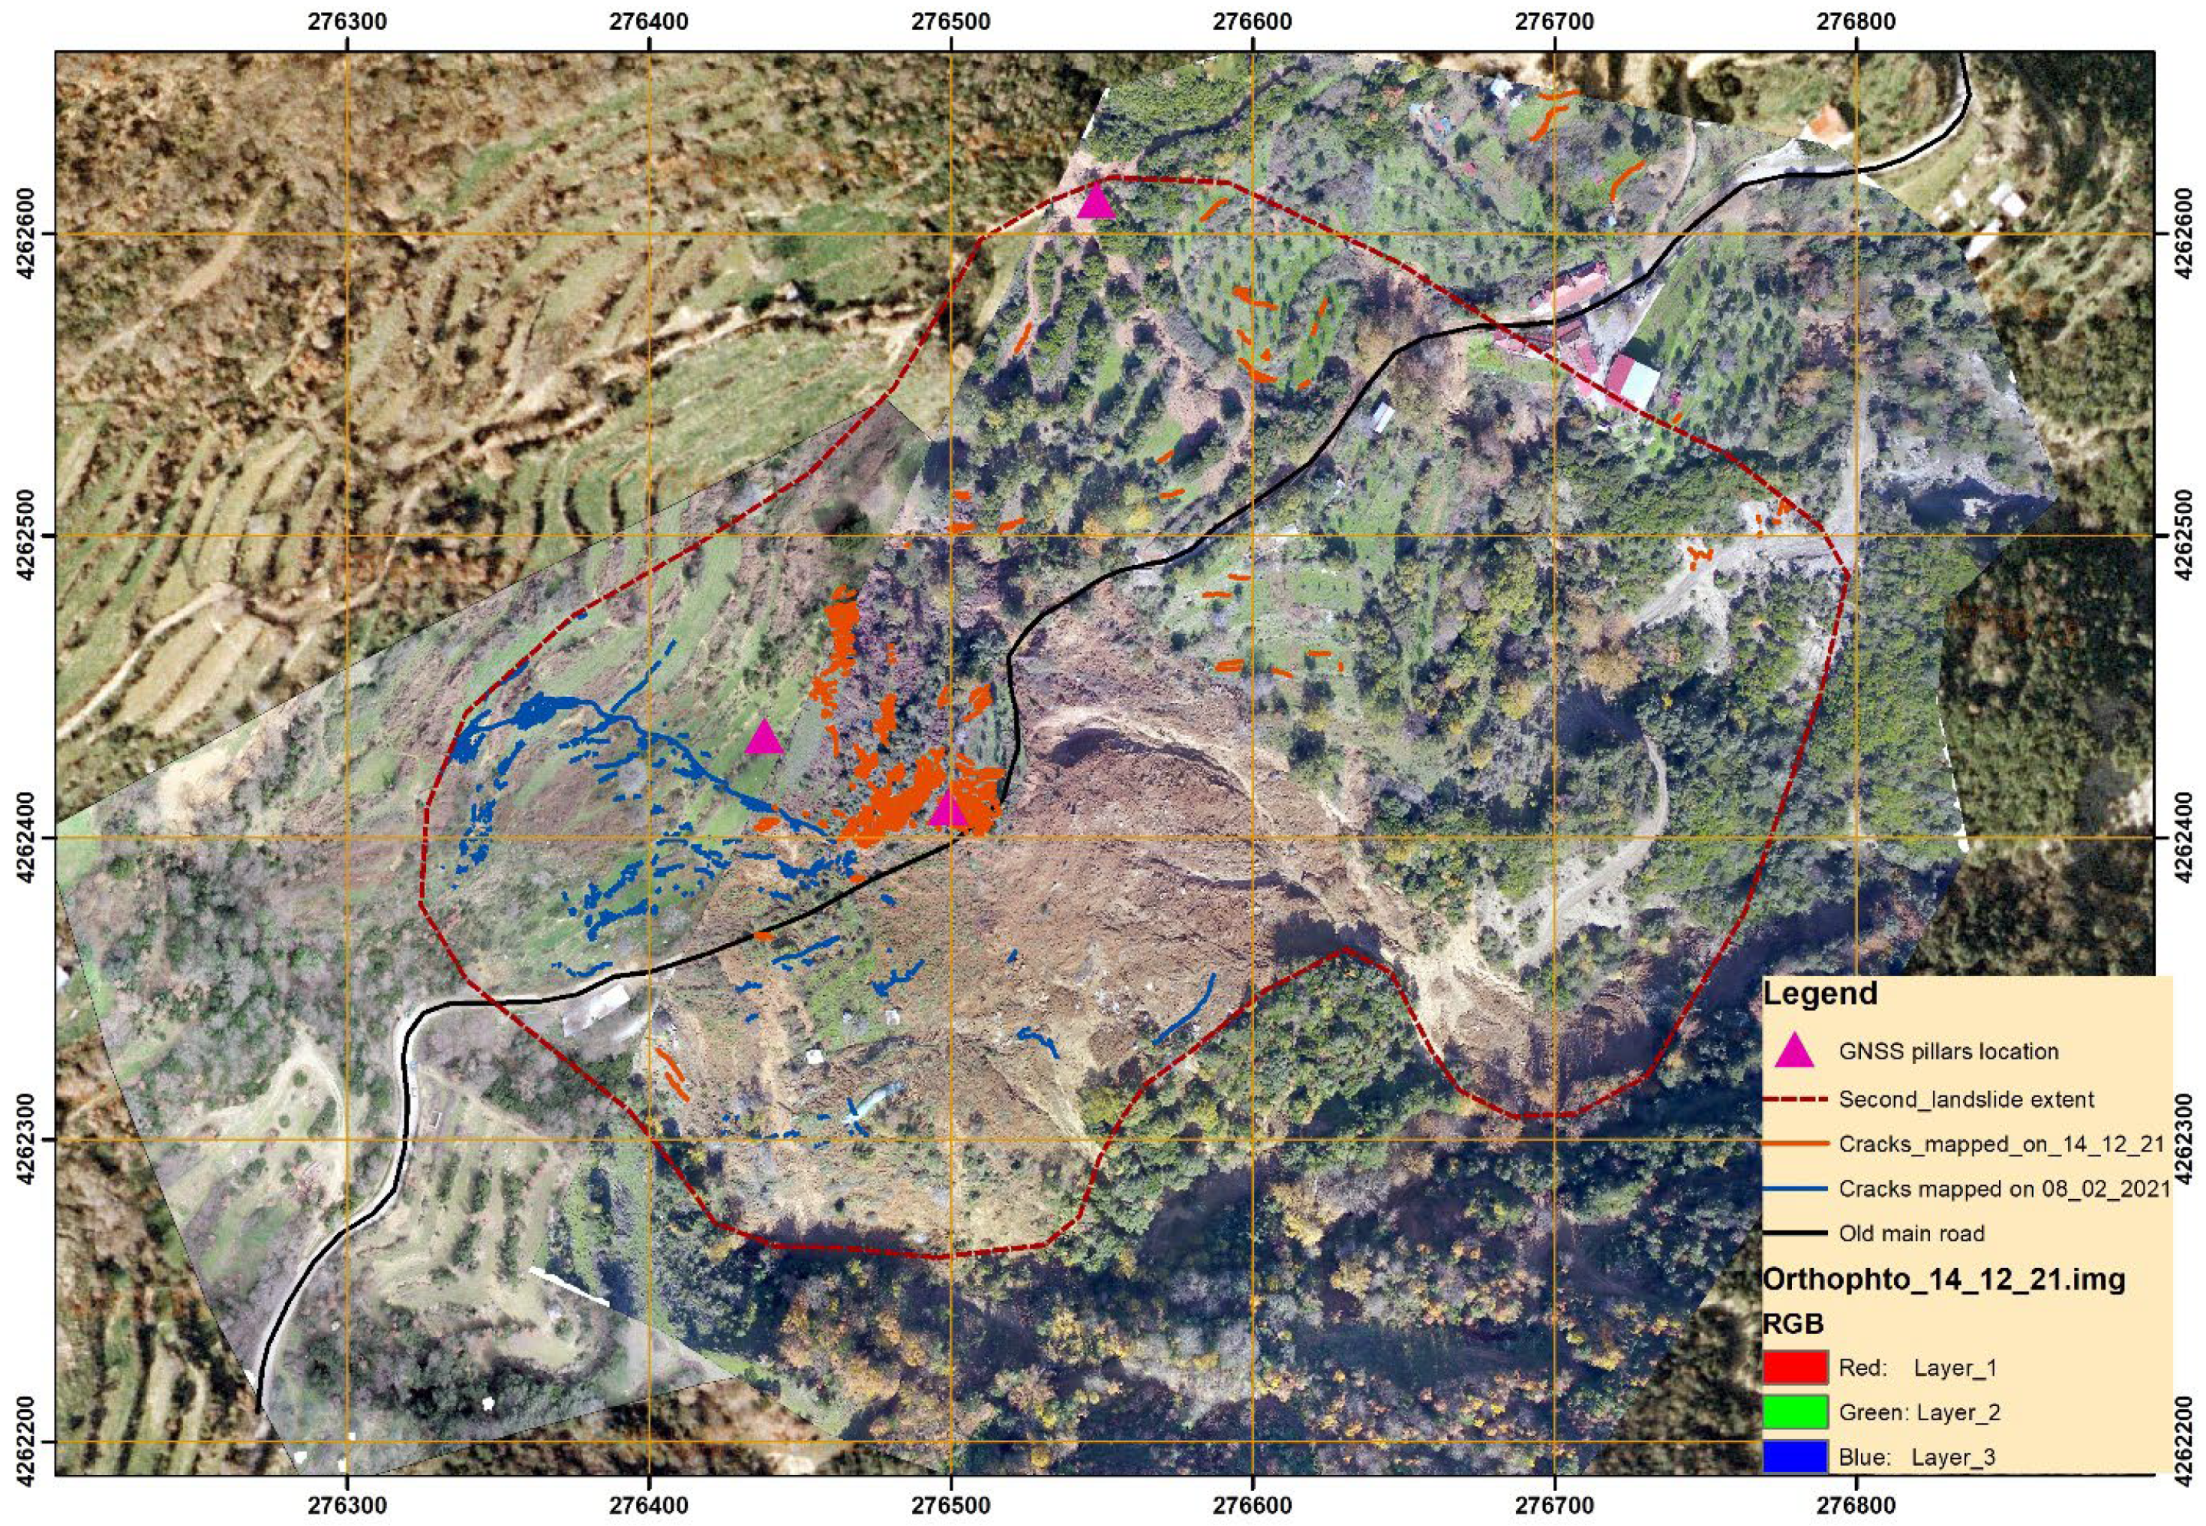
2.2. Description of Instabilities and Surveying Campaigns
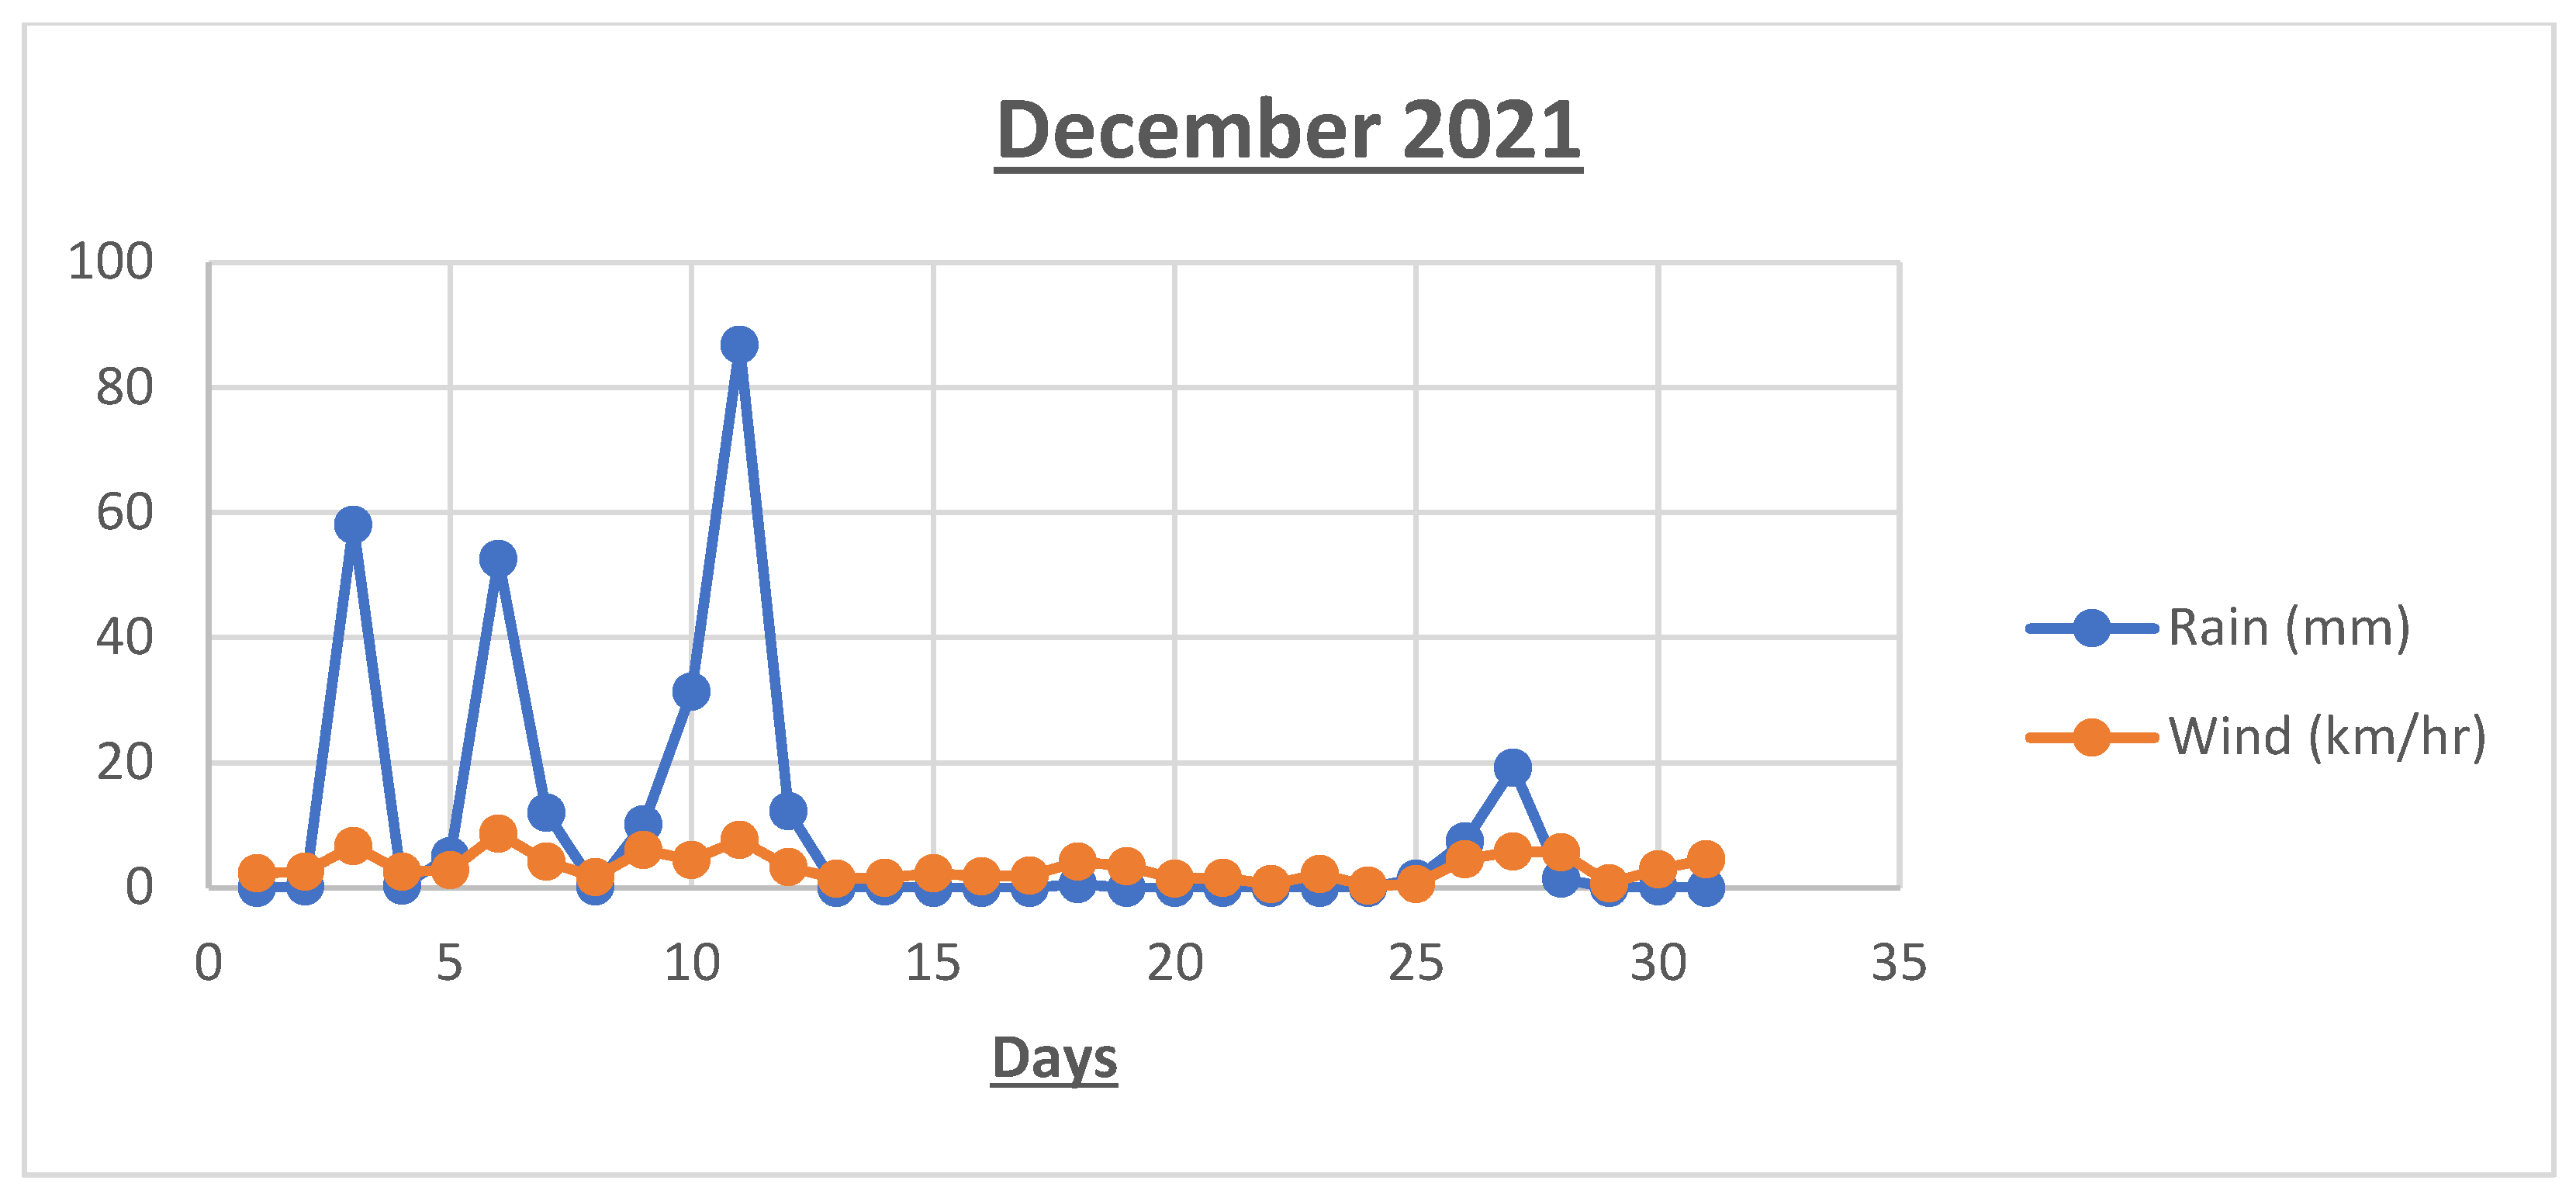
2.3. Meteorological Information
3. Datasets and Methods
4. Results
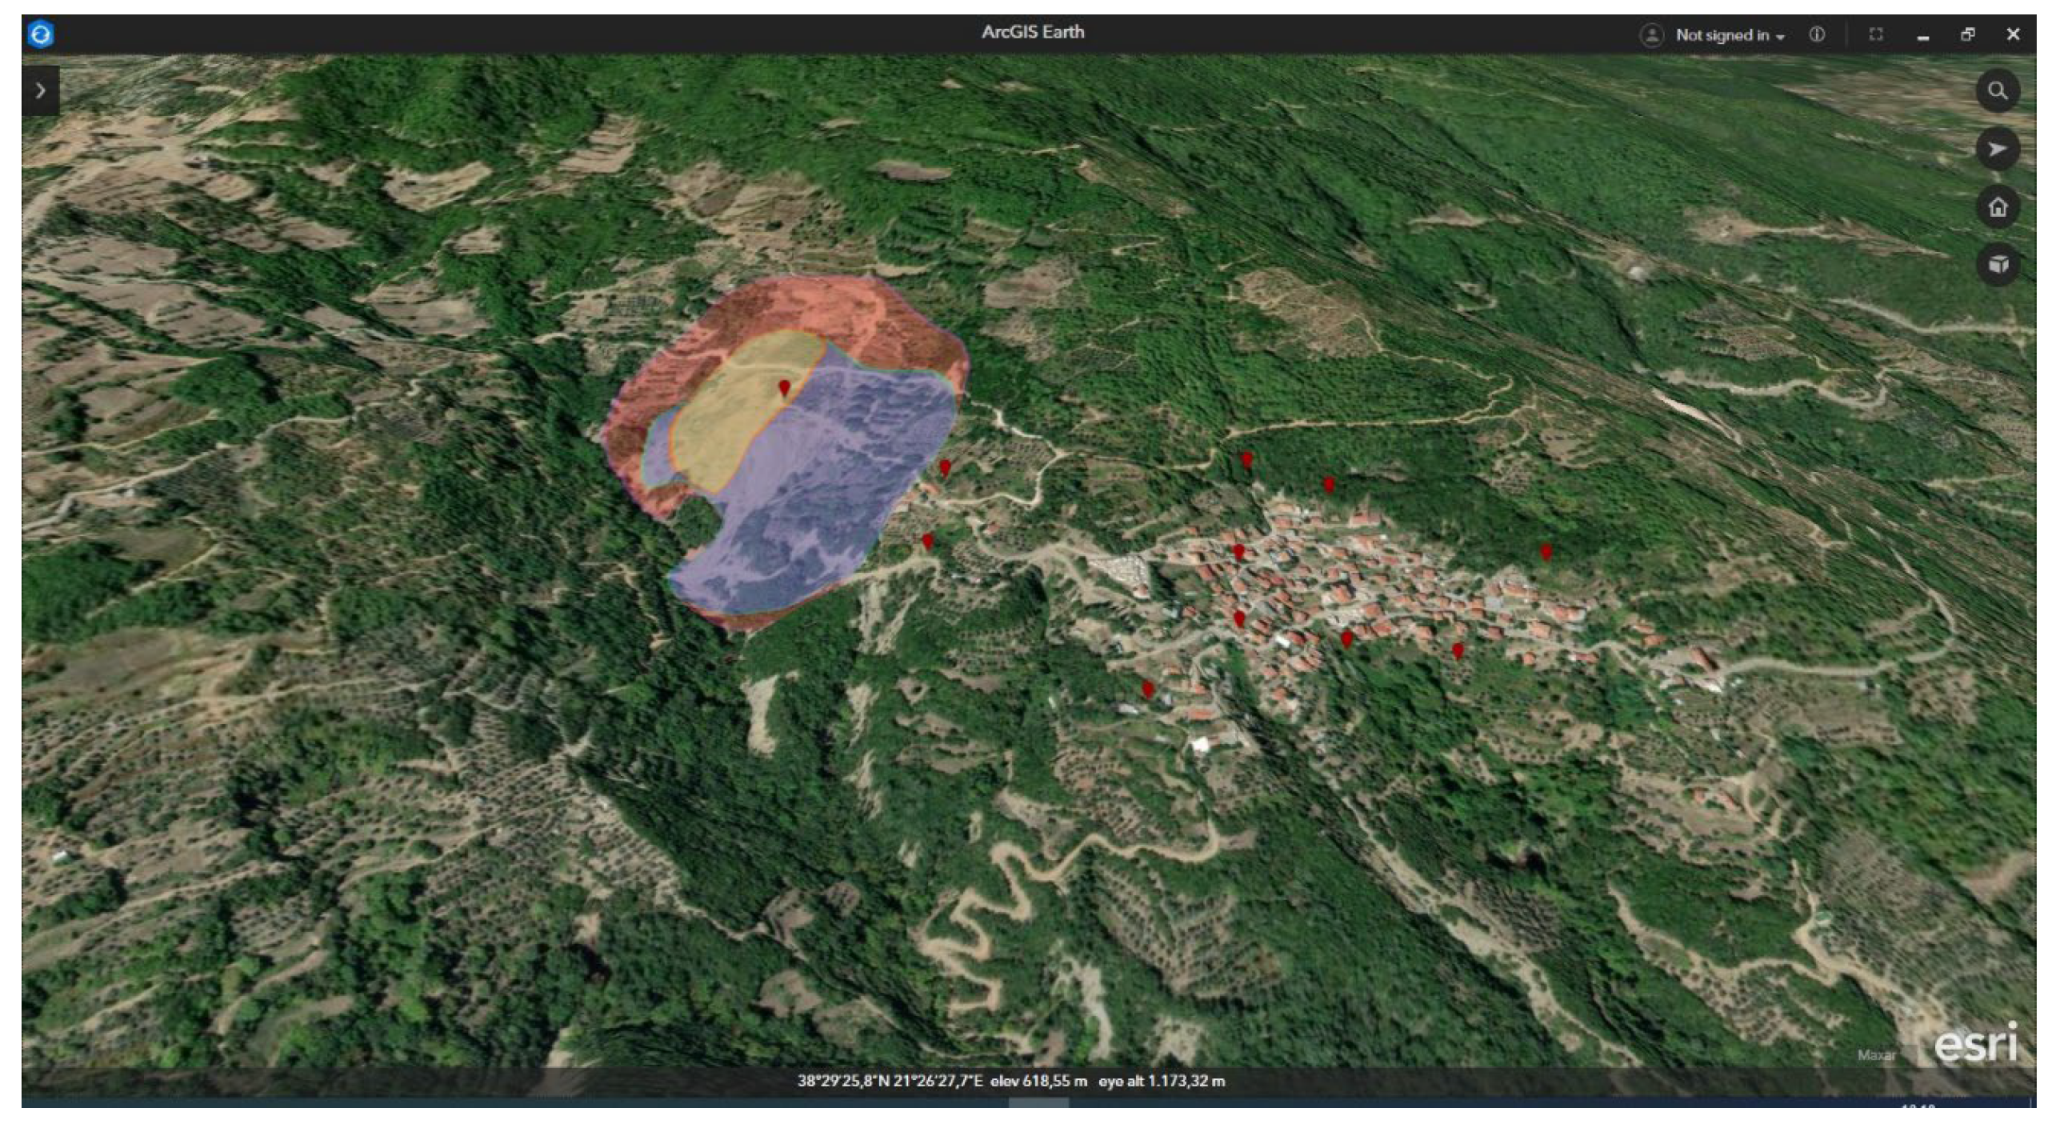
4.1. UAV Results
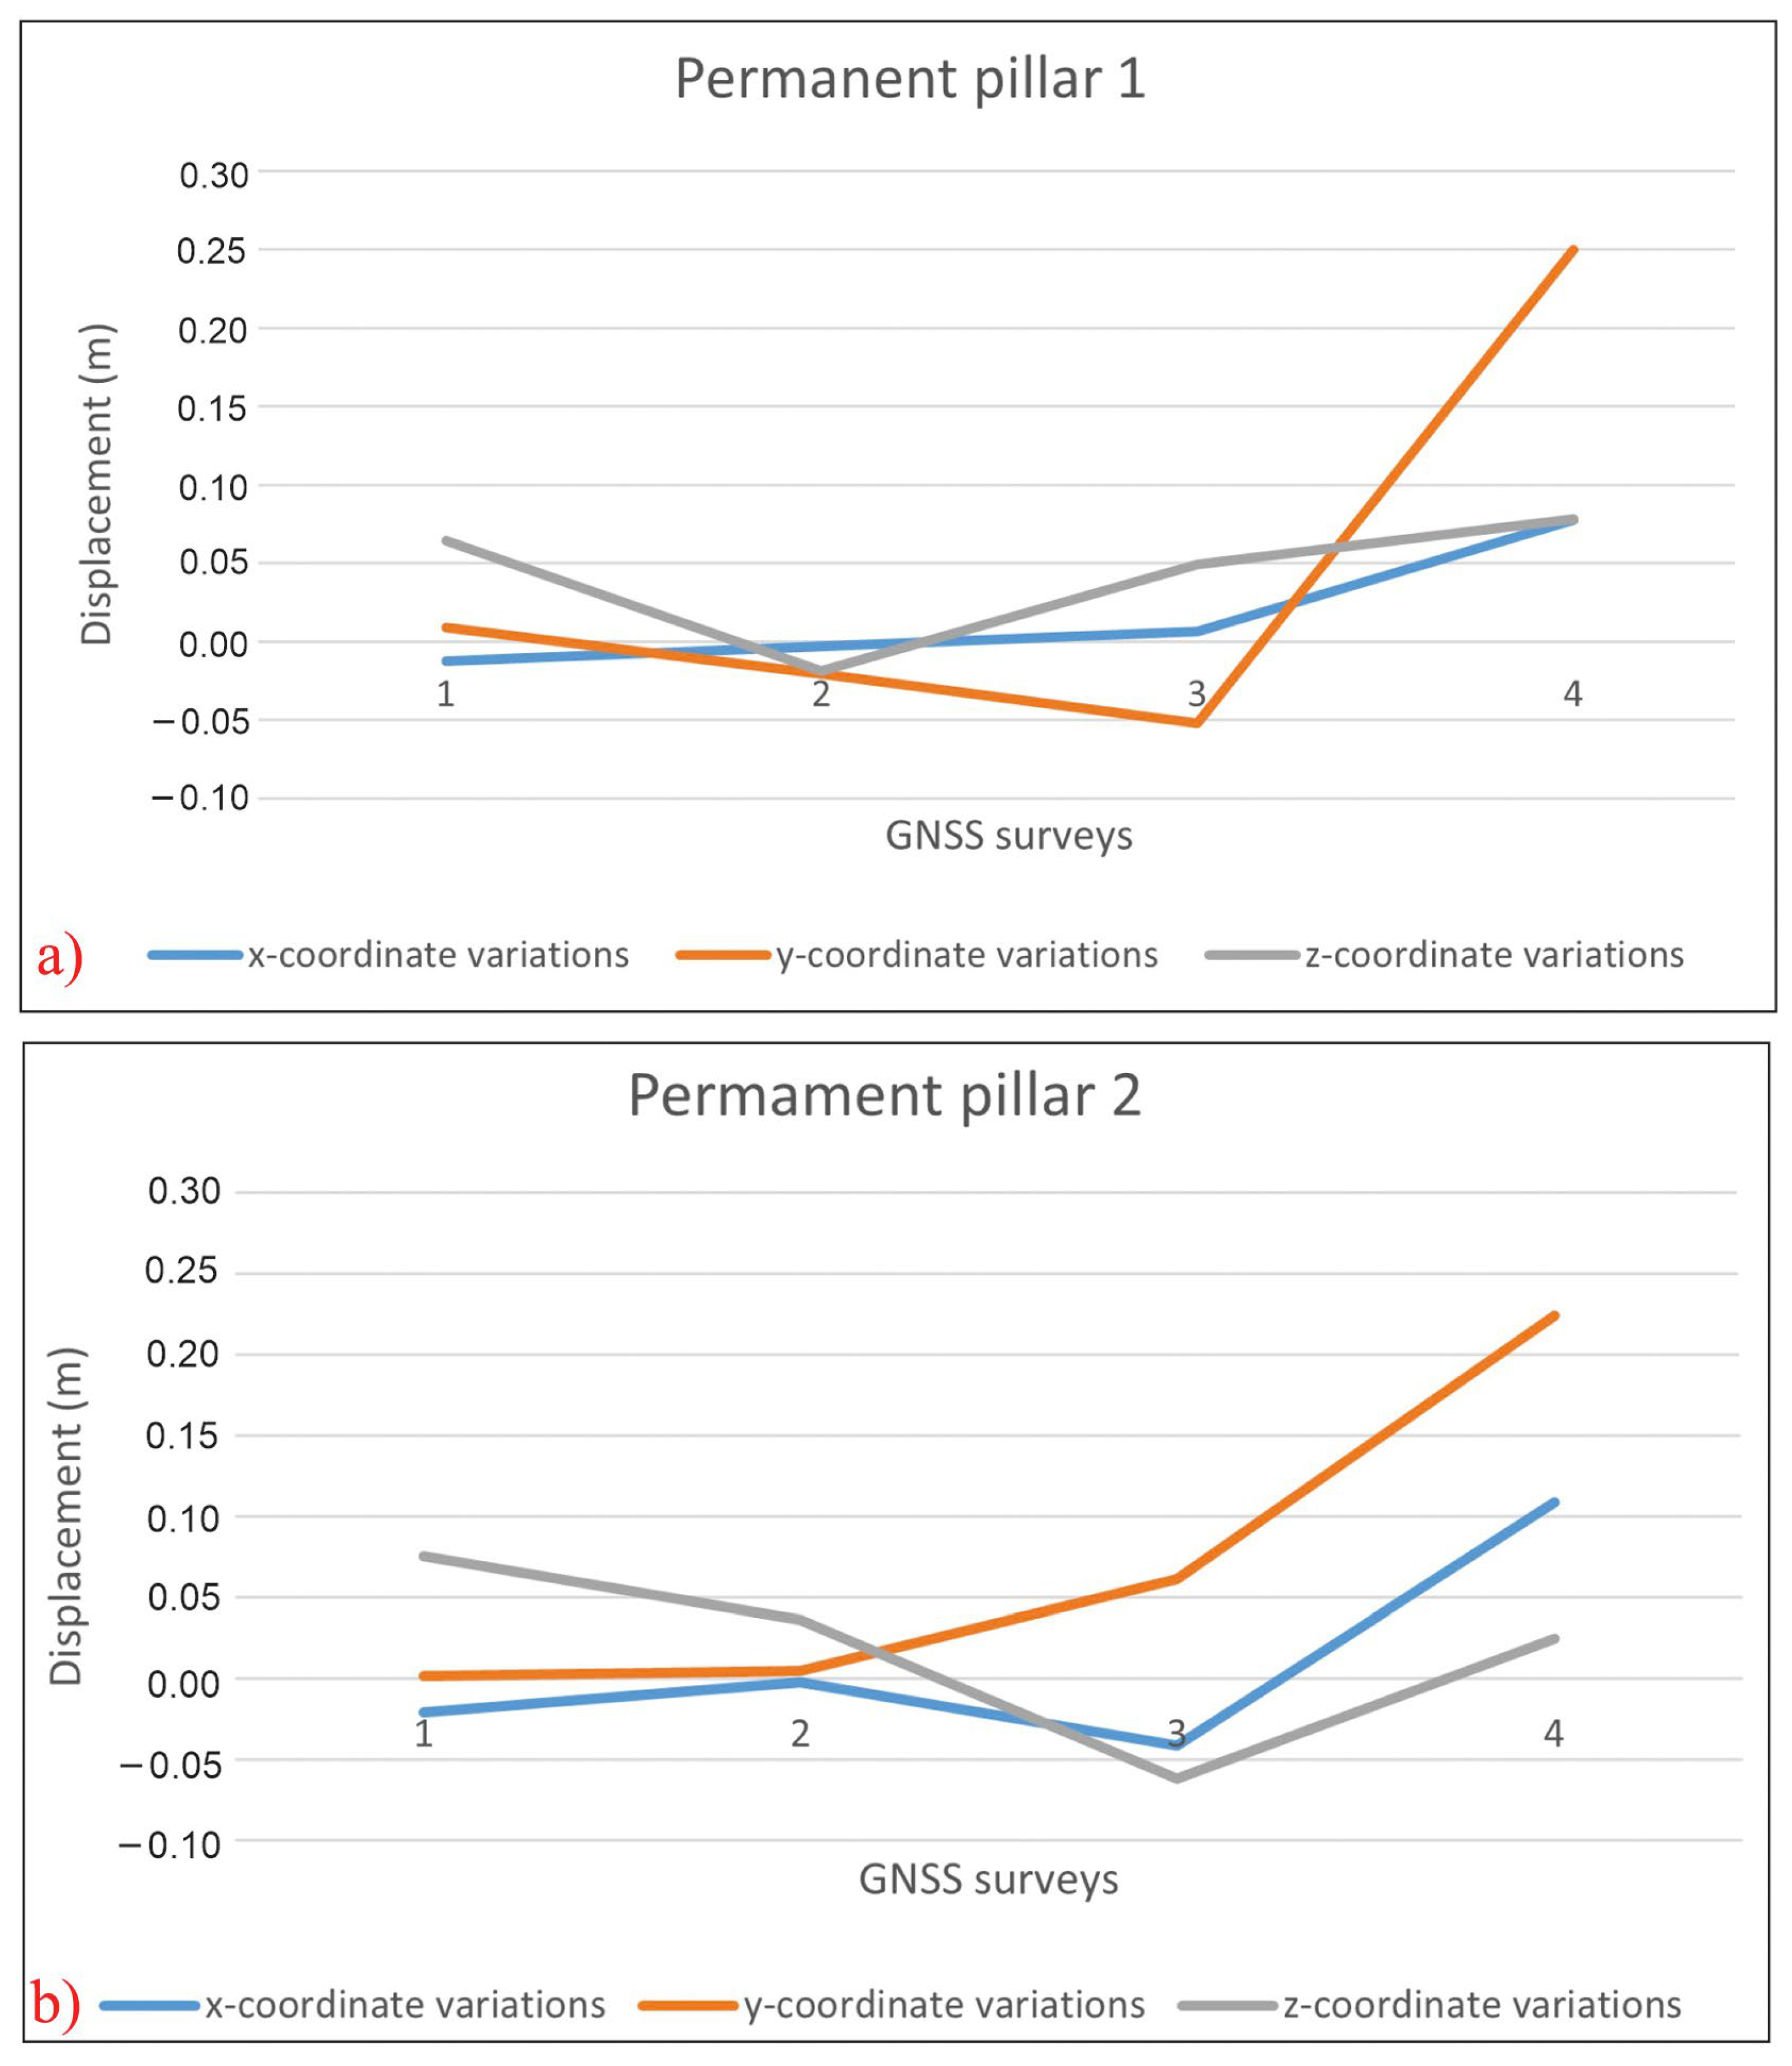
4.2. GNSS Results
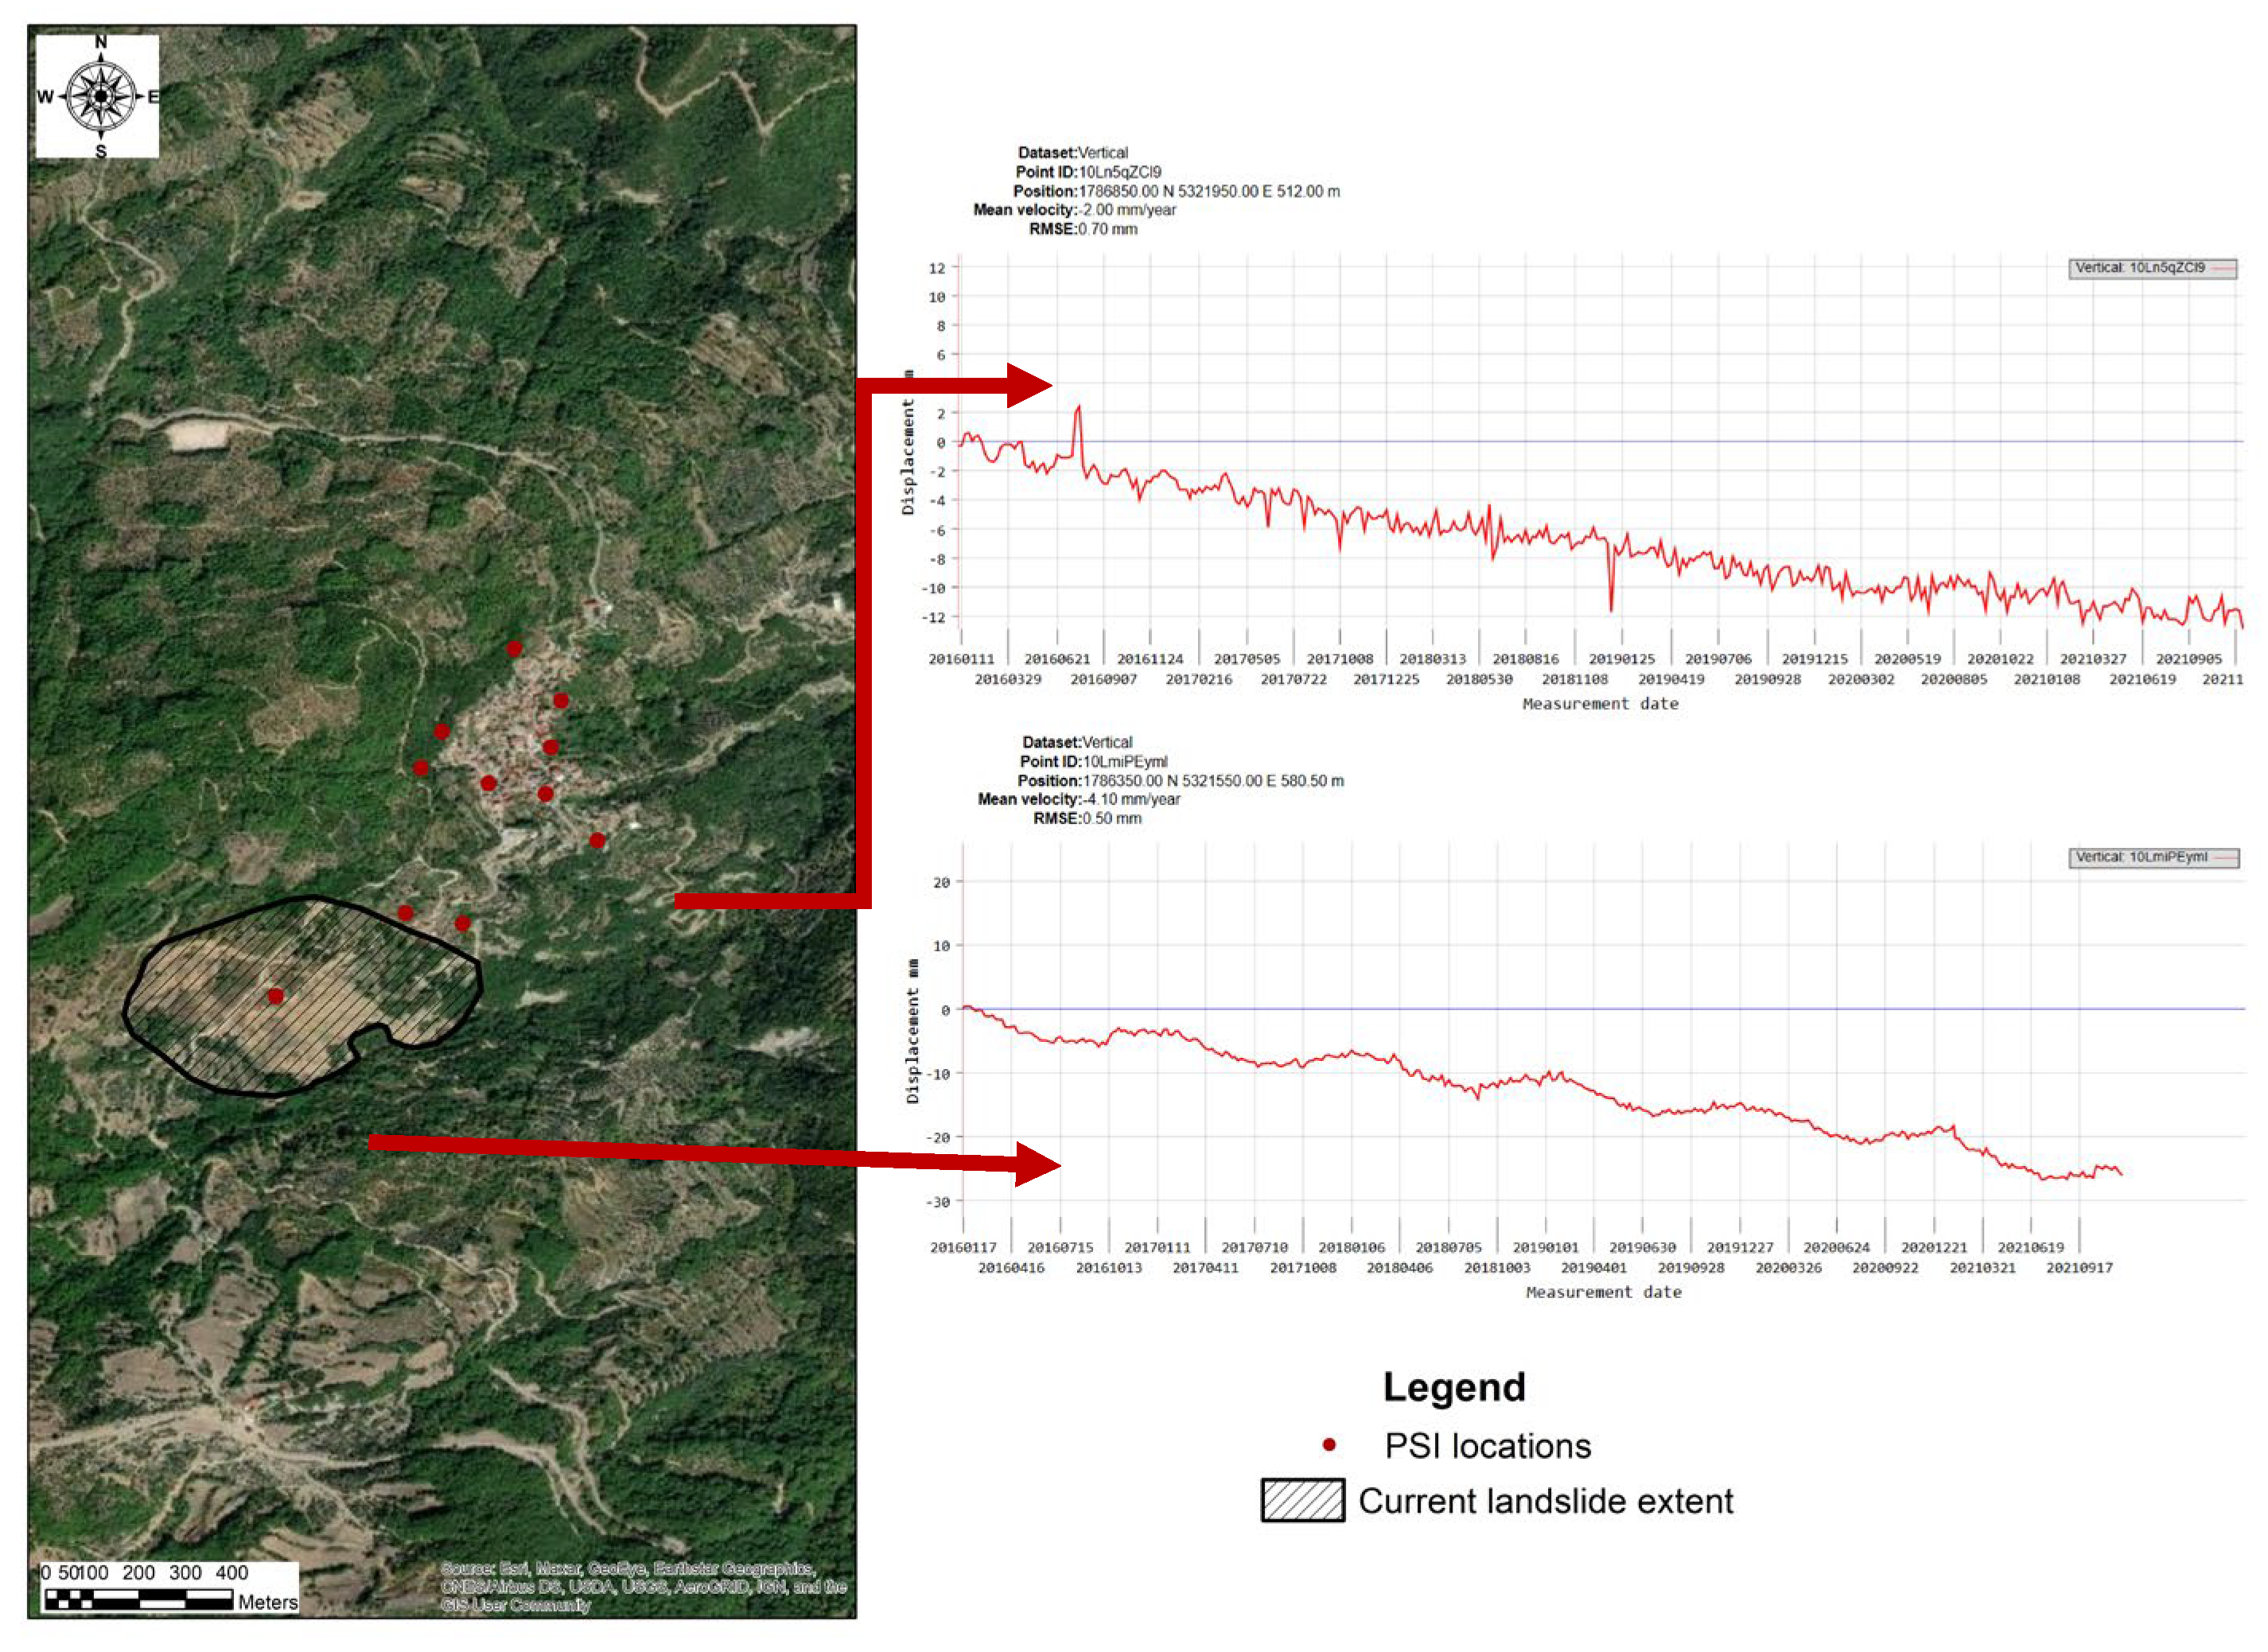
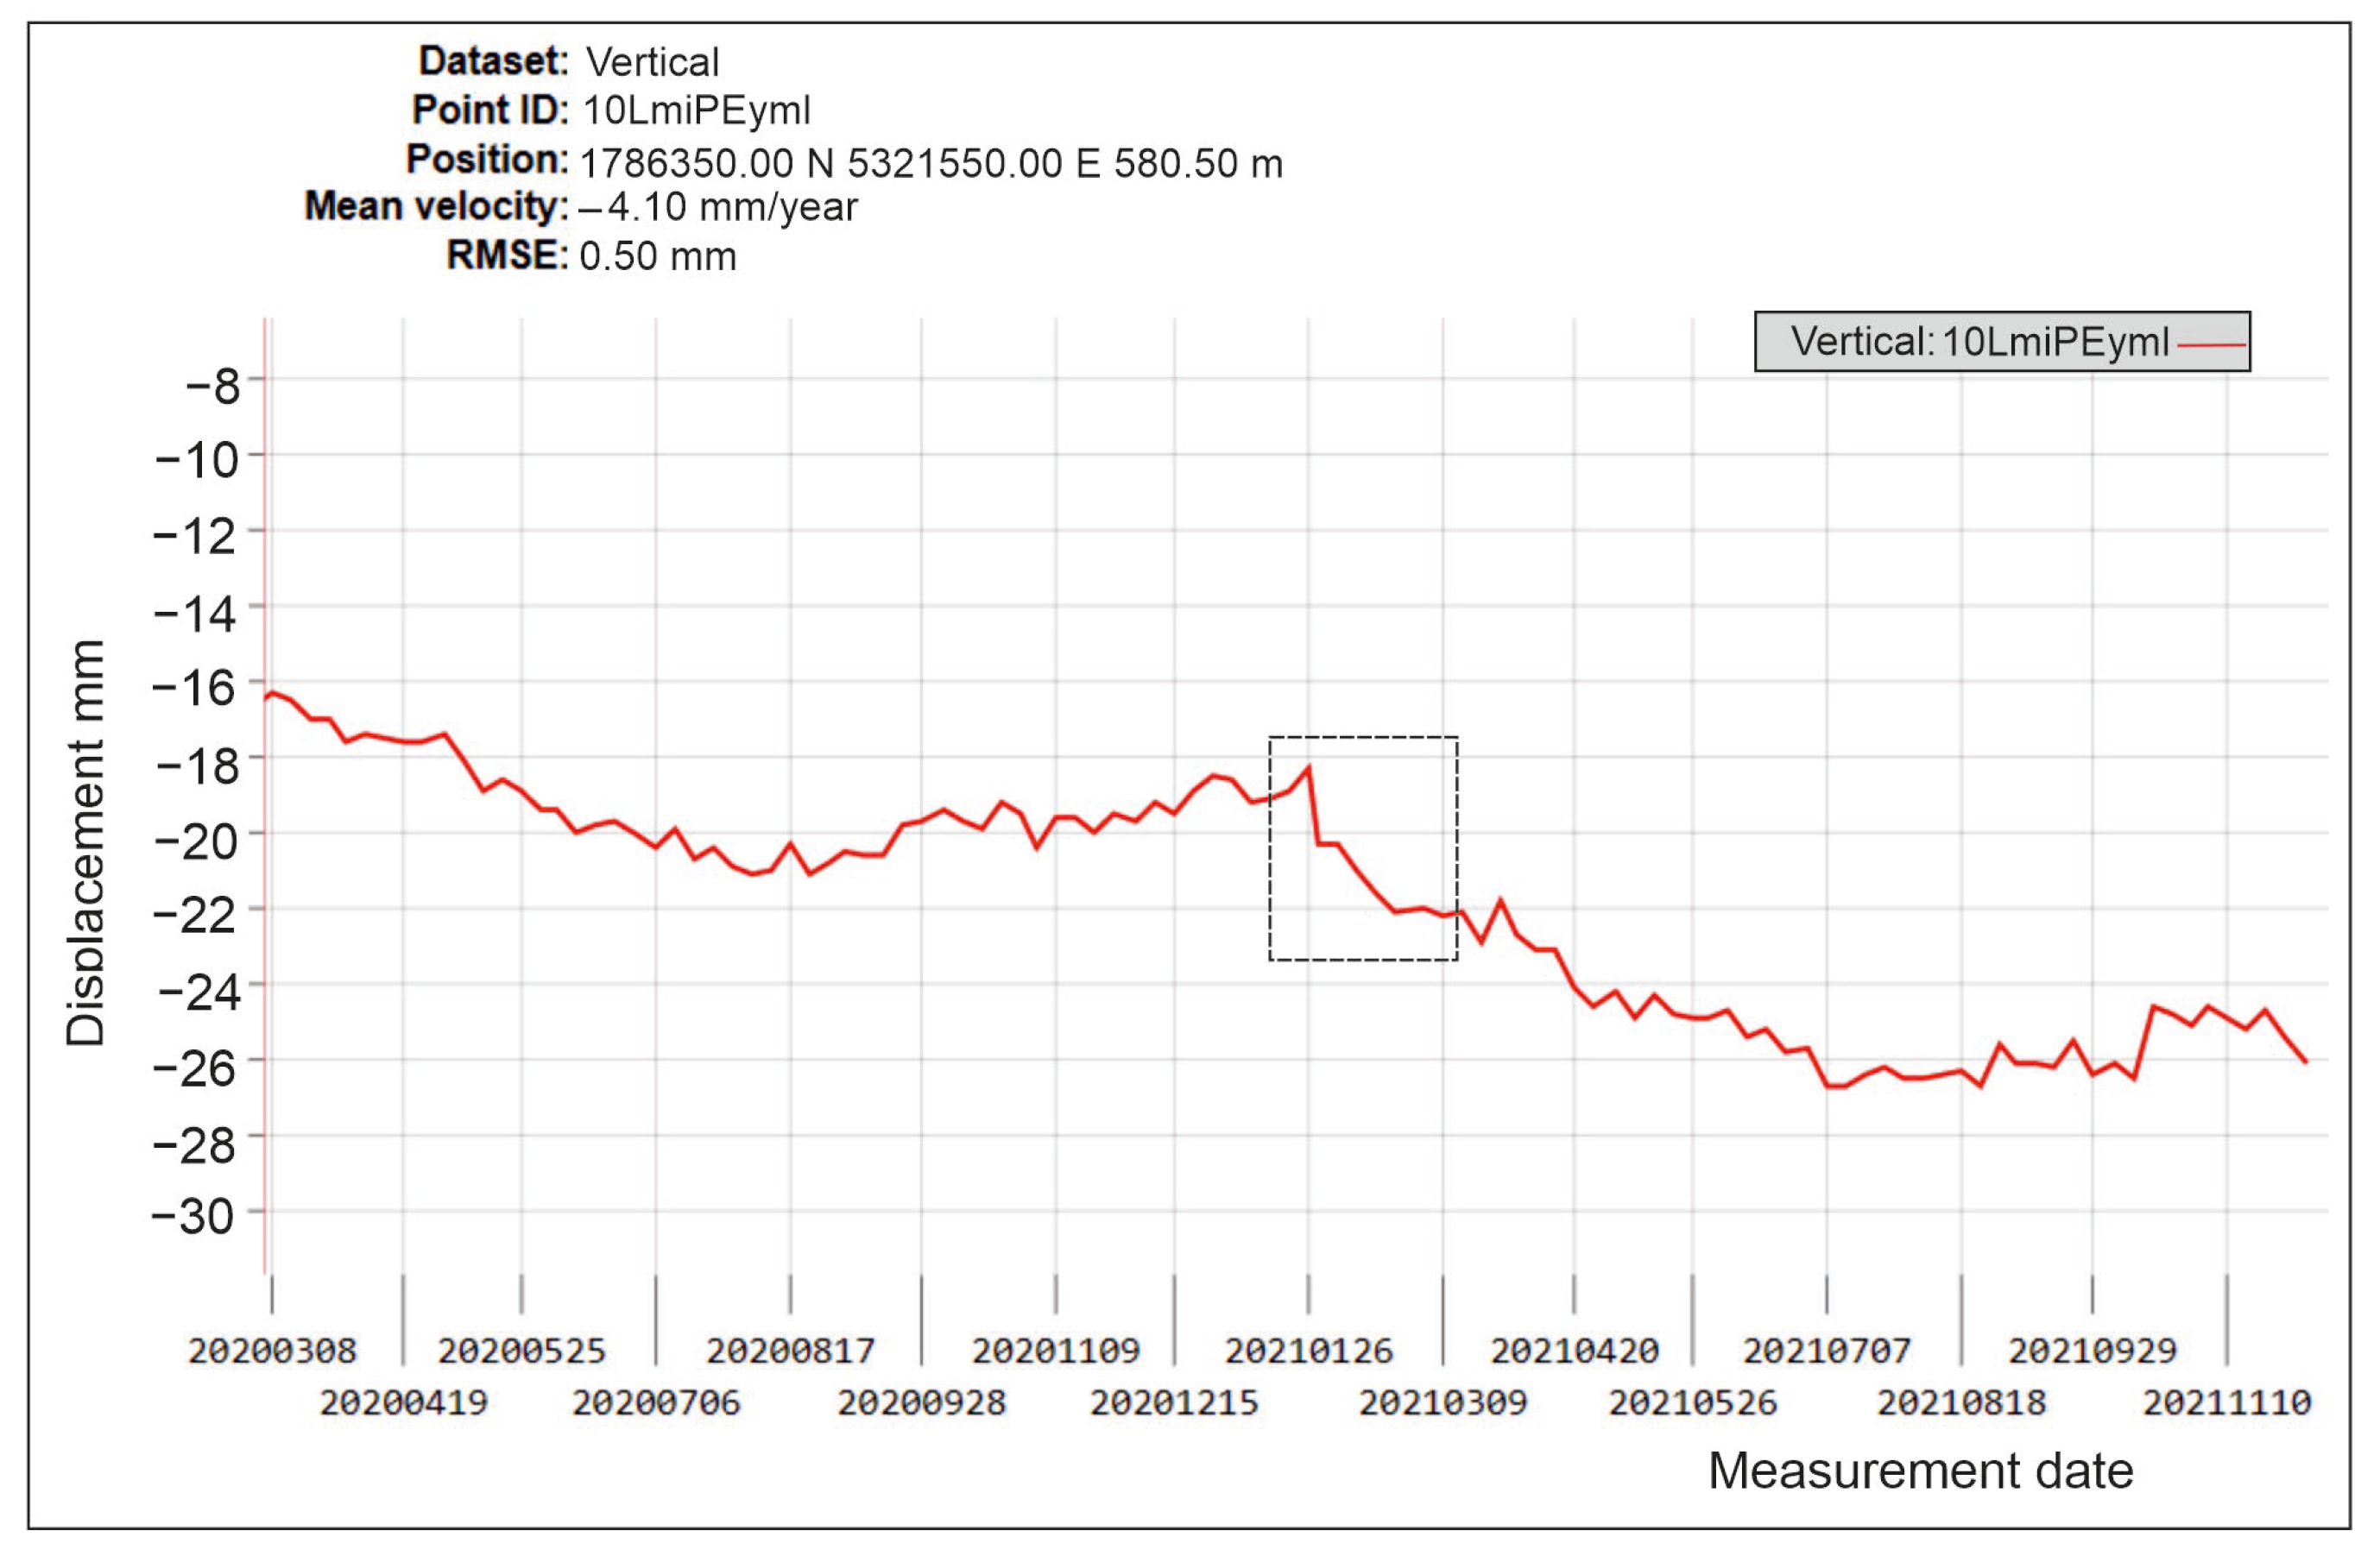
4.3. PSI Analysis
5. Discussion
6. Conclusions
- The occurrence of the landslide in January 2021 and its reactivation in December 2021 were both triggered by heavy rainfall.
- The landslide is still active and, in the current period, is in the vertical erosion phase.
- PSI measurements from 2015 to 2021 demonstrated high subsidence rates at many points inside and outside the landslide body.
- It is proven that archived PSI measurements can be used as an indicator of possible landslide initialization points.
- PSI measurements can be used for small-scale large area investigations, while UAV and GNSS data can precisely identify microscale deformations.
Author Contributions
Funding
Data Availability Statement
Acknowledgments
Conflicts of Interest
References
- Petley, D. Global patterns of loss of life from landslides. Geology 2012, 40, 927–930. [Google Scholar] [CrossRef]
- Vranken, L.; Van Turnhout, P.; Van Den Eeckhaut, M.; Vandekerckhove, L.; Poesen, J. Economic valuation of landslide damage in hilly regions: A case study from Flanders, Belgium. Sci. Total Environ. 2013, 447, 323–336. [Google Scholar] [CrossRef]
- Vranken, L.; Vantilt, G.; Van Den Eeckhaut, M.; Vandekerckhove, L.; Poesen, J. Landslide risk assessment in a densely populated hilly area. Landslides 2015, 12, 787–798. [Google Scholar] [CrossRef]
- Conforti, M.; Ietto, F. An integrated approach to investigate slope instability affecting infrastructures. Bull. Eng. Geol. Environ. 2019, 78, 2355–2375. [Google Scholar] [CrossRef]
- Wu, X.; Chen, X.; Zhan, F.B.; Hong, S. Global research trends in landslides during 1991–2014: A bibliometric analysis. Landslides 2015, 12, 1215–1226. [Google Scholar] [CrossRef]
- Galve, J.P.; Cevasco, A.; Brandolini, P.; Piacentini, D.; Azañón, J.M.; Notti, D.; Soldati, M. Cost-based analysis of mitigation measures for shallow-landslide risk reduction strategies. Eng. Geol. 2016, 213, 142–157. [Google Scholar] [CrossRef]
- Carrión-Mero, P.; Montalván-Burbano, N.; Morante-Carballo, F.; Quesada-Román, A.; Apolo-Masache, B. Worldwide research trends in landslide science. Int. J. Environ. Res. Public Health 2021, 18, 9445. [Google Scholar] [CrossRef] [PubMed]
- Senouci, R.; Taibi, N.-E.; Teodoro, A.C.; Duarte, L.; Mansour, H.; Yahia Meddah, R. GIS-Based Expert Knowledge for Landslide Susceptibility Mapping (LSM): Case of Mostaganem Coast District, West of Algeria. Sustainability 2021, 13, 630. [Google Scholar] [CrossRef]
- Conforti, M.; Ietto, F. Influence of Tectonics and Morphometric Features on the Landslide Distribution: A Case Study from the Mesima Basin (Calabria, South Italy). J. Earth Sci. 2020, 31, 393–409. [Google Scholar] [CrossRef]
- Quesada-Román, A.; Fallas-López, B.; Hernández-Espinoza, K.; Stoffel, M.; Ballesteros-Cánovas, J.A. Relationships between earthquakes, hurricanes, and landslides in Costa Rica. Landslides 2019, 16, 1539–1550. [Google Scholar] [CrossRef]
- Raspini, F.; Bianchini, S.; Ciampalini, A.; Del Soldato, M.; Montalti, R.; Solari, L.; Tofani, V.; Casagli, N. Persistent Scatterers continuous streaming for landslide monitoring and mapping: The case of the Tuscany region (Italy). Landslides 2019, 16, 2033–2044. [Google Scholar] [CrossRef]
- Casagli, N.; Cigna, F.; Bianchini, S.; Hölbling, D.; Füreder, P.; Righini, G.; del Conte, S.; Friedl, B.; Schneiderbauer, S.; Iasio, C.; et al. Landslide mapping and monitoring by using radar and optical remote sensing: Examples from the EC-FP7 project SAFER. Remote Sens. Appl. Soc. Environ. 2016, 4, 92–108. [Google Scholar] [CrossRef]
- Massonnet, D.; Feigl, K.L. Radar interferometry and its application to changes in the Earth’s surface. Rev. Geophys. 1998, 36, 441–500. [Google Scholar] [CrossRef]
- Herrera, G.; Notti, D.; García-Davalillo, J.C.; Mora, O.; Cooksley, G.; Sánchez, M.; Crosetto, M. Analysis with C-and X-band satellite SAR data of the Portalet landslide area. Landslides 2011, 8, 195–206. [Google Scholar] [CrossRef]
- Zhao, C.; Kang, Y.; Zhang, Q.; Lu, Z.; Li, B. Landslide identification and monitoring along the Jinsha River catchment (Wudongde reservoir area), China, using the InSAR method. Remote Sens. 2018, 10, 993. [Google Scholar] [CrossRef]
- Wasowski, J.; Bovenga, F. Investigating landslides and unstable slopes with satellite Multi Temporal Interferometry: Current issues and future perspectives. Eng. Geol. 2014, 174, 103–138. [Google Scholar] [CrossRef]
- Schlögel, R.; Doubre, C.; Malet, J.P.; Masson, F. Landslide deformation monitoring with ALOS/PALSAR imagery: A D-InSAR geomorphological interpretation method. Geomorphology 2015, 231, 314–330. [Google Scholar] [CrossRef]
- Ferretti, A.; Prati, C.; Rocca, F. Permanent Scatterers in SAR interferometry. IEEE Trans. Geosci. Remote Sens. 2001, 39, 8–20. [Google Scholar] [CrossRef]
- Crosetto, M.; Monserrat, O.; Cuevas-González, M.; Devanthéry, N.; Crippa, B. Persistent Scatterer Interferometry: A Review. ISPRS J. Photogramm. Remote Sens. 2016, 115, 78–89. [Google Scholar] [CrossRef]
- Tofani, V.; Raspini, F.; Catani, F.; Casagli, N. Persistent Scatterer Interferometry (PSI) technique for landslide characterization and monitoring. Remote Sens. 2013, 5, 1045–1065. [Google Scholar] [CrossRef]
- Lanari, R.; Mora, O.; Manunta, M.; Mallorquì, J.J.; Berardino, P.; Sansosti, E. A small baseline approach for investigating deformation on full resolution differential SAR interferograms. IEEE Trans. Geosci. Remote Sens. 2004, 42, 1377–1386. [Google Scholar] [CrossRef]
- Berardino, P.; Fornaro, G.; Lanari, R.; Sansosti, E. A new algorithm for surface deformation monitoring based on small baseline differential SAR interferograms. IEEE Trans. Geosci. Remote Sens. 2003, 40, 2375–2383. [Google Scholar] [CrossRef]
- Pasquali, P.; Cantone, A.; Riccardi, P.; Defilippi, M.; Ogushi, F.; Gagliano, S.; Tamura, M. Mapping of Ground Deformations with Interferometric Stacking Techniques. In Land Applications of Radar Remote Sensing; InTech: London, UK, 2014. [Google Scholar] [CrossRef]
- Crippa, C.; Agliardi, F. Practical Estimation of Landslide Kinematics Using PSI Data. Geosciences 2021, 11, 214. [Google Scholar] [CrossRef]
- Cigna, F.; Bianchini, S.; Casagli, N. How to assess landslide activity and intensity with Persistent Scatterer Interferometry (PSI): The PSI-based matrix approach. Landslides 2013, 10, 267–283. [Google Scholar] [CrossRef]
- Nefros, C.; Alatza, S.; Loupasakis, C.; Kontoes, C. Persistent Scatterer Interferometry (PSI) Technique for the Identification and Monitoring of Critical Landslide Areas in a Regional and Mountainous Road Network. Remote Sens. 2023, 15, 1550. [Google Scholar] [CrossRef]
- Aslan, G.; Foumelis, M.; Raucoules, D.; de Michele, M.; Bernardie, S.; Cakir, Z. Landslide mapping and monitoring using persistent scatterer interferometry (PSI) technique in the French alps. Remote Sens. 2020, 12, 1305. [Google Scholar] [CrossRef]
- Gili, J.A.; Corominas, J.; Rius, J. Using Global Positioning System Techniques in Landslide Monitoring. Eng. Geol. 2000, 55, 167–192. [Google Scholar] [CrossRef]
- Huang, G.; Du, S.; Wang, D. GNSS techniques for real-time monitoring of landslides: A review. Satell. Navig. 2023, 4, 5. [Google Scholar] [CrossRef]
- Wang, P.; Liu, H.; Nie, G.; Yang, Z.; Wu, J.; Qian, C.; Shu, B. Performance evaluation of a real-time high-precision landslide displacement detection algorithm based on GNSS virtual reference station technology. Meas. J. Int. Meas. Confed. 2022, 199, 111457. [Google Scholar] [CrossRef]
- Huang, G.; Wang, D.; Du, Y.; Zhang, Q.; Bai, Z.; Wang, C. Deformation Feature Extraction for GNSS Landslide Monitoring Series Based on Robust Adaptive Sliding-Window Algorithm. Front. Earth Sci. 2022, 10, 487. [Google Scholar] [CrossRef]
- Šegina, E.; Peternel, T.; Urbančič, T.; Realini, E.; Zupan, M.; Jež, J.; Caldera, S.; Gatti, A.; Tagliaferro, G.; Consoli, A.; et al. Monitoring surface displacement of a deep-seated landslide by a low-cost and near real-time GNSS system. Remote Sens. 2020, 12, 3375. [Google Scholar] [CrossRef]
- Cina, A.; Piras, M. Performance of low-cost GNSS receiver for landslides monitoring: Test and results. Geomatics. Nat. Hazards Risk 2015, 6, 497–514. [Google Scholar] [CrossRef]
- Lucieer, A.; Jong, S.M.D.; Turner, D. Mapping landslide displacements using Structure from Motion (SfM) and image correlation of multi-temporal UAV photography. Prog. Phys. Geogr. 2014, 38, 97–116. [Google Scholar] [CrossRef]
- Catani, F. Landslide detection by deep learning of non-nadiral and crowdsourced optical images. Landslides 2020, 18, 1025–1044. [Google Scholar] [CrossRef]
- Rau, J.; Jhan, J.; Lo, C.; Lin, Y. Landslide mapping using imagery acquired by a fixed-wing UAV. Int. Arch. Photogramm. Remote. Sens. Spat. Inf. Sci. 2011, 38, 195–200. [Google Scholar] [CrossRef]
- Shi, B.; Liu, C. UAV for landslide mapping and deformation analysis. In Proceedings of the International Conference on Intelligent Earth Observing and Applications, International Society for Optics and Photonics, Guilin, China, 23–24 October 2015; Volume 9808. [Google Scholar] [CrossRef]
- Peternel, T.; Kumelj, Š.; Oštir, K.; Komac, M. Monitoring the Potoška planina landslide (NW Slovenia) using UAV photogrammetry and tachymetric measurements. Landslides 2017, 14, 395–406. [Google Scholar] [CrossRef]
- Cignetti, M.; Godone, D.; Wrzesniak, A.; Giordan, D. Structure from motion multisource application for landslide characterization and monitoring: The champlas du col case study, sestriere, North-Western Italy. Sensors 2019, 19, 2364. [Google Scholar] [CrossRef] [PubMed]
- Antoine, R.; Lopez, T.; Tanguy, M.; Lissak, C.; Gailler, L.; Labazuy, P.; Fauchard, C. Geoscientists in the sky: Unmanned aerial vehicles responding to geohazards. Surv. Geophys 2020, 41, 1285–1321. [Google Scholar] [CrossRef]
- Kyriou, A.; Nikolakopoulos, K.G.; Koukouvelas, I.K. Timely and Low-Cost Remote Sensing Practices for the Assessment of Landslide Activity in the Service of Hazard Management. Remote Sens. 2022, 14, 4745. [Google Scholar] [CrossRef]
- Chen, Z.; Zhou, H.; Ye, F.; Liu, B.; Fu, W. The characteristics, induced factors, and formation mechanism of the 2018 Baige landslide in Jinsha River, Southwest China. Catena 2021, 203, 105337. [Google Scholar] [CrossRef]
- Yang, D.; Qiu, H.; Hu, S.; Pei, Y.; Wang, X.; Du, C.; Long, Y.; Cao, M. Influence of successive landslides on topographic changes revealed by multitemporal high-resolution UAS-based DEM. Catena 2021, 202, 105229. [Google Scholar] [CrossRef]
- Teodoro, A.; Santos, P.; Espinha Marques, J.; Ribeiro, J.; Mansilha, C.; Melo, A.; Duarte, L.; Rodrigues de Almeida, C.; Flores, D. An Integrated Multi-Approach to Environmental Monitoring of a Self-Burning Coal Waste Pile: The São Pedro da Cova Mine (Porto, Portugal) Study Case. Environments 2021, 8, 48. [Google Scholar] [CrossRef]
- Rossi, G.; Tanteri, L.; Tofani, V.; Vannocci, P.; Moretti, S.; Casagli, N. Multitemporal UAV surveys for landslide mapping and characterization. Landslides 2018, 15, 1045–1052. [Google Scholar] [CrossRef]
- Ilinca, V.; Șandric, I.; Chițu, Z.; Irimia, R.; Gheuca, I. UAV applications to assess short-term dynamics of slow-moving landslides under dense forest cover. Landslides 2022, 19, 1717–1734. [Google Scholar] [CrossRef]
- Kyriou, A.; Nikolakopoulos, K.; Koukouvelas, I.; Lampropoulou, P. Repeated UAV Campaigns, GNSS Measurements, GIS, and Petrographic Analyses for Landslide Mapping and Monitoring. Minerals 2021, 11, 300. [Google Scholar] [CrossRef]
- Al-Rawabdeh, A.; Moussa, A.; Foroutan, M.; El-Sheimy, N.; Habib, A. Time series UAV image-based point clouds for landslide progression evaluation applications. Sensors 2017, 17, 2378. [Google Scholar] [CrossRef]
- Nikolakopoulos, K.G.; Kyriou, A.; Koukouvelas, I.K. Developing a Guideline of Unmanned Aerial Vehicle’s Acquisition Geometry for Landslide Mapping and Monitoring. Appl. Sci. 2022, 12, 4598. [Google Scholar] [CrossRef]
- Kyriou, A.; Nikolakopoulos, K.; Koukouvelas, I. How Image Acquisition Geometry of UAV Campaigns Affects the Derived Products and Their Accuracy in Areas with Complex Geomorphology. ISPRS Int. J. Geo-Inf. 2021, 10, 408. [Google Scholar] [CrossRef]
- Rodriguez-Caballero, E.; Rodriguez-Lozano, B.; Segura-Tejada, R.; Blanco-Sacristán, J.; Cantón, Y. Landslides on dry badlands: UAV images to identify the drivers controlling their unexpected occurrence on vegetated hillslopes. J. Arid. Environ. 2021, 187, 104434. [Google Scholar] [CrossRef]
- Hastaoğlu, K.Ö.; Gül, Y.; Poyraz, F.; Kara, B.C. Monitoring 3D areal displacements by a new methodology and software using UAV photogrammetry. Int. J. Appl. Earth Obs. Geoinf. 2019, 83, 101916. [Google Scholar] [CrossRef]
- Teo, T.A.; Fu, Y.J.; Li, K.W.; Weng, M.C.; Yang, C.M. Comparison between image- and surface-derived displacement fields for landslide monitoring using an unmanned aerial vehicle. Int. J. Appl. Earth Obs. Geoinf 2023, 116, 103164. [Google Scholar] [CrossRef]
- Comert, R.; Avdan, U.; Gorum, T.; Nefeslioglu, H.A. Mapping of shallow landslides with object-based image analysis from unmanned aerial vehicle data. Eng. Geol. 2019, 260, 105264. [Google Scholar] [CrossRef]
- Cheng, Z.; Gong, W.; Tang, H.; Juang, C.H.; Deng, Q.; Chen, J.; Ye, X. UAV photogrammetry-based remote sensing and preliminary assessment of the behavior of a landslide in Guizhou, China. Eng. Geol. 2021, 289, 106172. [Google Scholar] [CrossRef]
- Mateos, R.M.; Azañón, J.M.; Roldán, F.J.; Notti, D.; Pérez-Peña, V.; Galve, J.P.; Pérez-García, J.L.; Colomo, C.M.; Gómez-López, J.M.; Montserrat, O.; et al. The combined use of PSInSAR and UAV photogrammetry techniques for the analysis of the kinematics of a coastal landslide affecting an urban area (SE Spain). Landslides 2017, 14, 743–754. [Google Scholar] [CrossRef]
- Eker, R.; Aydın, A. Long-term retrospective investigation of a large, deep-seated, and slow-moving landslide using InSAR time series, historical aerial photographs, and UAV data: The case of Devrek landslide (NW Turkey). Catena 2021, 196, 104895. [Google Scholar] [CrossRef]
- Themistocleous, K.; Danezis, C.; Gikas, V. Monitoring ground deformation of cultural heritage sites using SAR and geodetic techniques: The case study of Choirokoitia, Cyprus. Appl. Geomat. 2021, 13, 37–49. [Google Scholar] [CrossRef]
- Razi, P.; Sumantyo, J.T.S.; Perissin, D.; Kuze, H.; Chua, M.Y.; Panggabean, G.F. 3D land mapping and land deformation monitoring using persistent scatterer interferometry (PSI) ALOS PALSAR: Validated by Geodetic GPS and UAV. IEEE Access 2018, 6, 12395–12404. [Google Scholar] [CrossRef]
- Sestras, P.; Bilașco, Ș.; Roșca, S.; Veres, I.; Ilies, N.; Hysa, A.; Spalević, V.; Cîmpeanu, S.M. Multi-Instrumental Approach to Slope Failure Monitoring in a Landslide Susceptible Newly Built-Up Area: Topo-Geodetic Survey, UAV 3D Modelling and Ground-Penetrating Radar. Remote Sens. 2022, 14, 5822. [Google Scholar] [CrossRef]
- Underhill, J. Late Cenozoic deformation of the Hellenide foreland, Western Greece. Geol. Soc. Am. Bull. 1989, 101, 613–634. [Google Scholar] [CrossRef]
- Skourlis, K.; Doutsos, T. The Pindos Fold-and-thrust belt (Greece): Inversion kinematics of a passive continental margin. Int. J. Earth Sci. 2013, 92, 891–903. [Google Scholar] [CrossRef]
- Sotiropoulos, S.; Kamberis, E.; Triantaphyllou, M.V.; Doutsos, T. Thrust sequences in the central part of the External Hellenides. Geol. Mag. 2003, 140, 661–668. [Google Scholar] [CrossRef]
- Xypolias, P.; Koukouvelas, I.K. Paleostress magnitude in a Fold-Thrust Belt (External Hellenides, Greece): Evidence from twinning in calcareous rocks. Episodes 2005, 28, 245–251. [Google Scholar] [CrossRef]
- Sotiropoulos, S.; Triantaphyllou, M.V.; Kamberis, E.; Tsaila-Monopolis, S. Paleogene terrigenous (flysch) sequences in Etoloakarnania region (W. Greece). Plankton stratigraphy and paleoenvironmental implications. Geobios 2008, 41, 415–433. [Google Scholar] [CrossRef]
- EGMS. Available online: https://land.copernicus.eu/pan-european/european-ground-motion-service (accessed on 10 April 2023).


| Date of Field Campaign | Landslide Extent in Square Meters |
|---|---|
| 8 February 2021 | 31,906 |
| 14 December 2021 | 107,221 |
| 25 September 2022 | 171,747 |
| Date | Field Measurements | UAV Campaign | GNSS Surveys |
|---|---|---|---|
| 8 February 2021 | X | X | |
| 14 December 2021 | X | X | |
| 25 September 2022 | X | X | X |
| 20 December 2022 | X | X | X |
| 28 January 2023 | X | X | X |
| 11 April 2023 | X | X | X |
Disclaimer/Publisher’s Note: The statements, opinions and data contained in all publications are solely those of the individual author(s) and contributor(s) and not of MDPI and/or the editor(s). MDPI and/or the editor(s) disclaim responsibility for any injury to people or property resulting from any ideas, methods, instructions or products referred to in the content. |
© 2023 by the authors. Licensee MDPI, Basel, Switzerland. This article is an open access article distributed under the terms and conditions of the Creative Commons Attribution (CC BY) license (https://creativecommons.org/licenses/by/4.0/).
Share and Cite
Nikolakopoulos, K.G.; Kyriou, A.; Koukouvelas, I.K.; Tomaras, N.; Lyros, E. UAV, GNSS, and InSAR Data Analyses for Landslide Monitoring in a Mountainous Village in Western Greece. Remote Sens. 2023, 15, 2870. https://0-doi-org.brum.beds.ac.uk/10.3390/rs15112870
Nikolakopoulos KG, Kyriou A, Koukouvelas IK, Tomaras N, Lyros E. UAV, GNSS, and InSAR Data Analyses for Landslide Monitoring in a Mountainous Village in Western Greece. Remote Sensing. 2023; 15(11):2870. https://0-doi-org.brum.beds.ac.uk/10.3390/rs15112870
Chicago/Turabian StyleNikolakopoulos, Konstantinos G., Aggeliki Kyriou, Ioannis K. Koukouvelas, Nikolaos Tomaras, and Epameinondas Lyros. 2023. "UAV, GNSS, and InSAR Data Analyses for Landslide Monitoring in a Mountainous Village in Western Greece" Remote Sensing 15, no. 11: 2870. https://0-doi-org.brum.beds.ac.uk/10.3390/rs15112870