

Coseismic Faulting Model and Post-Seismic Surface Motion of the 2023 Turkey–Syria Earthquake Doublet Revealed by InSAR and GPS Measurements
Abstract
:
1. Introduction
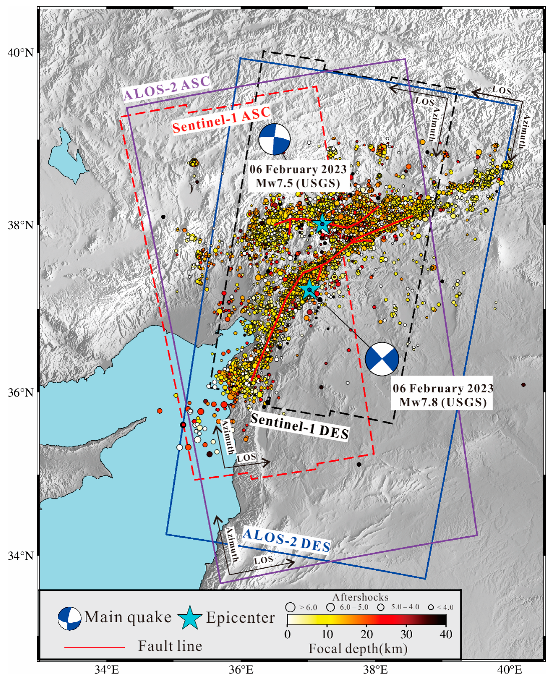
2. Datasets and Processing
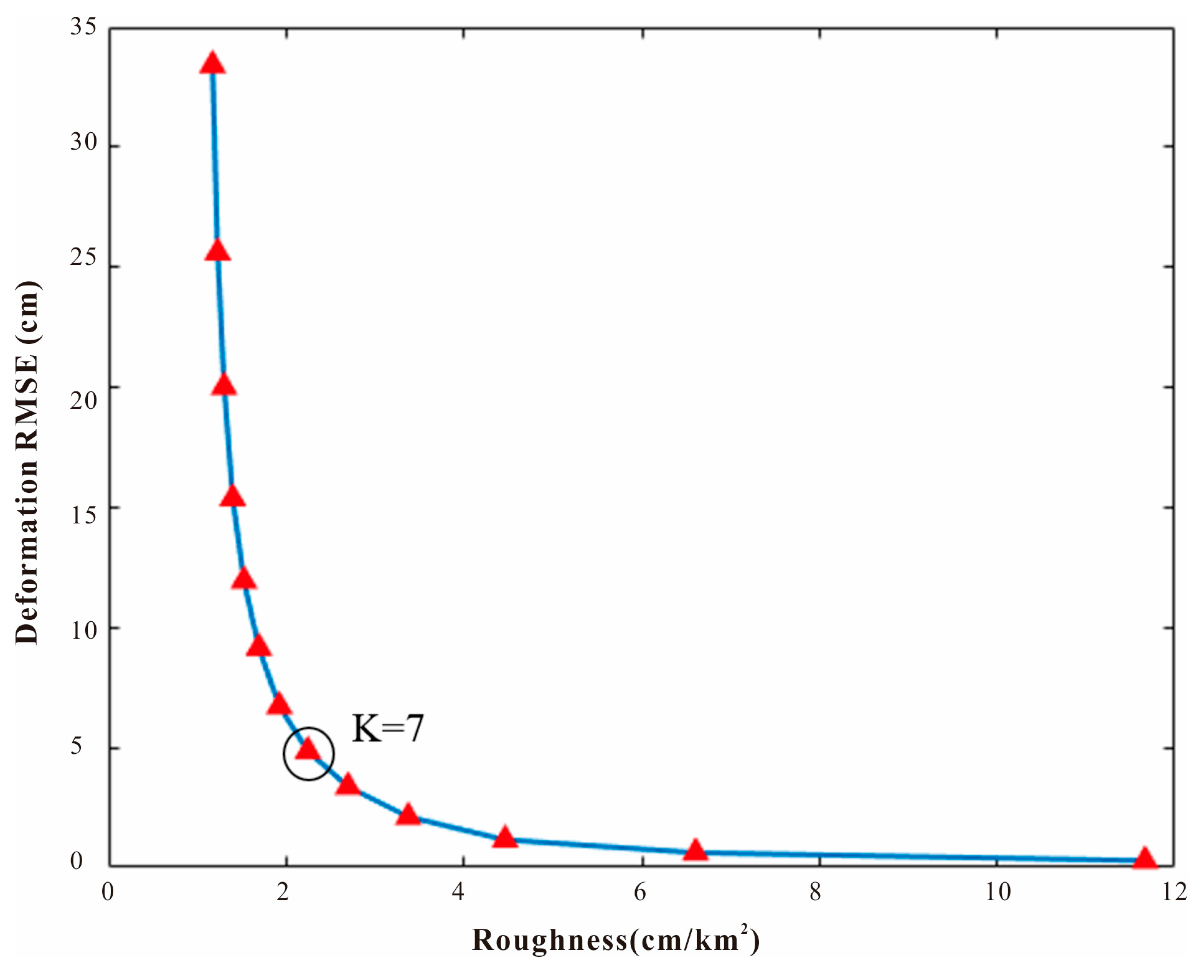
3. Inversion Configuration
4. Results
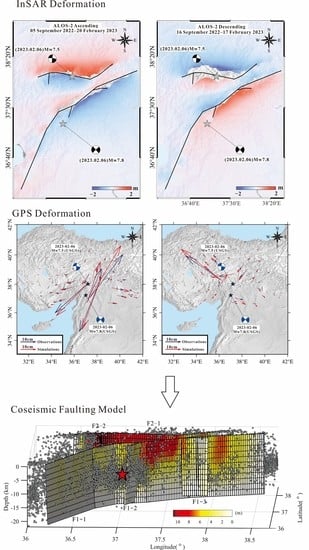
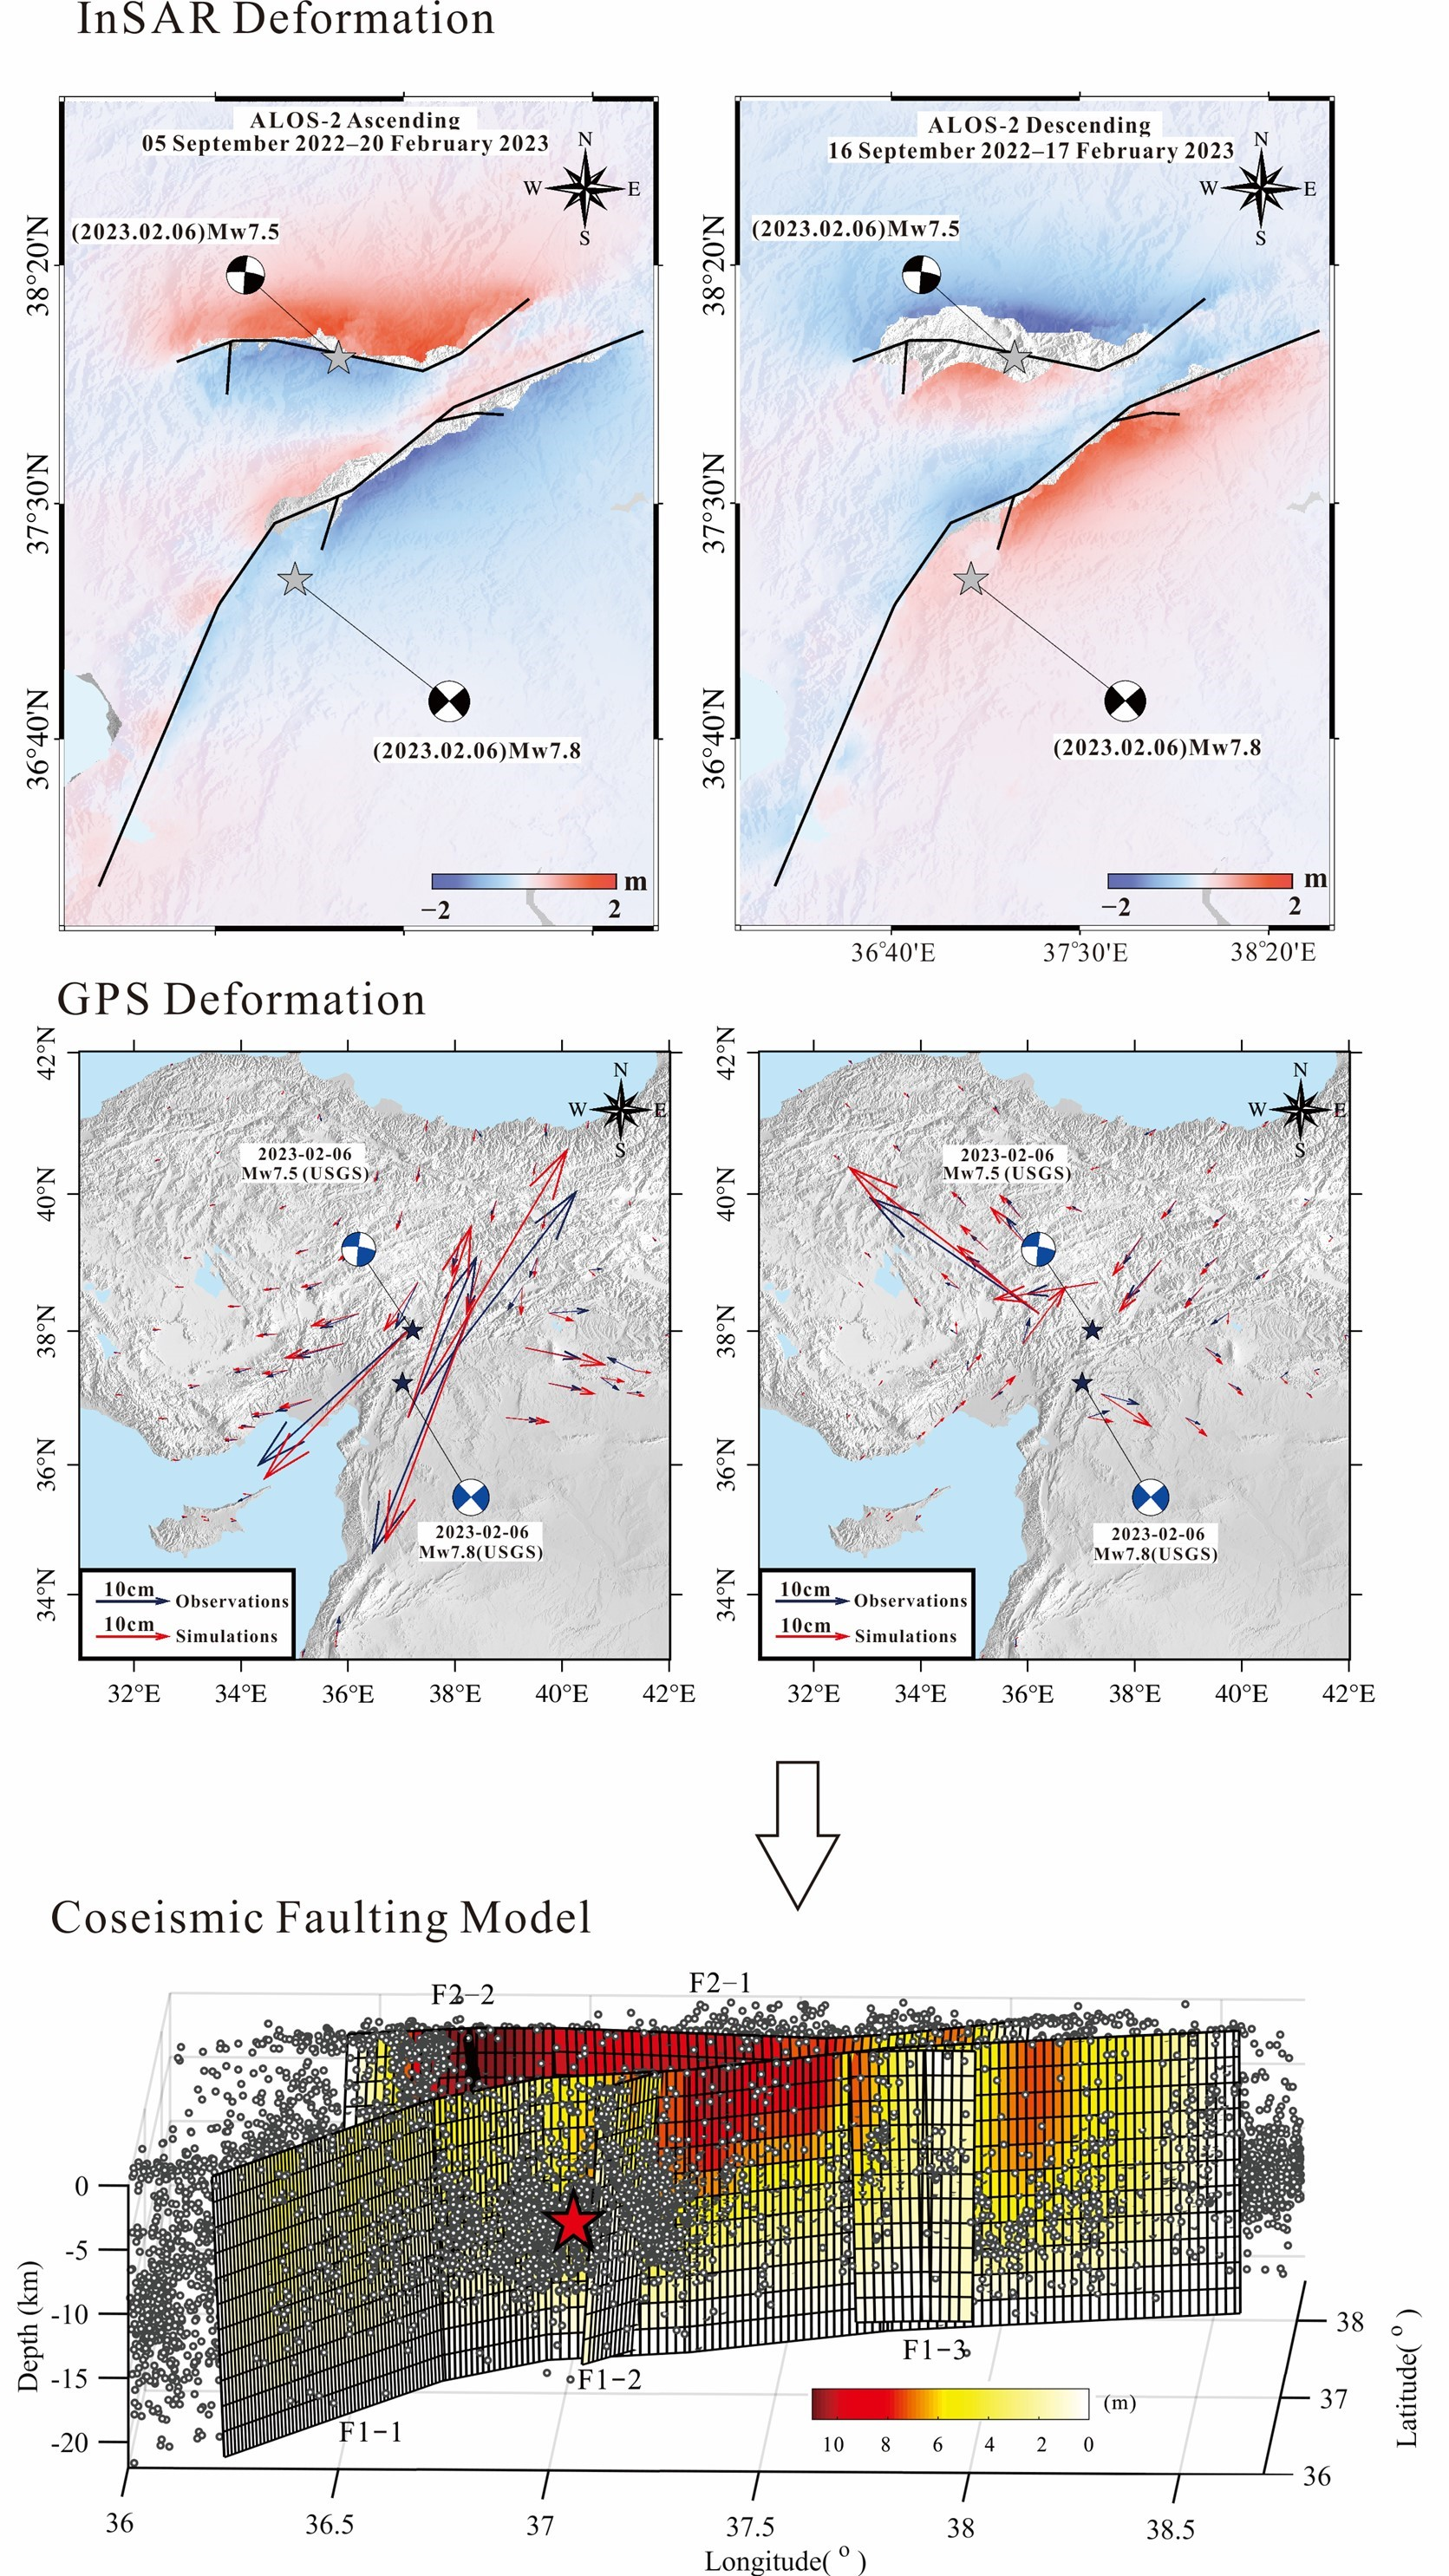
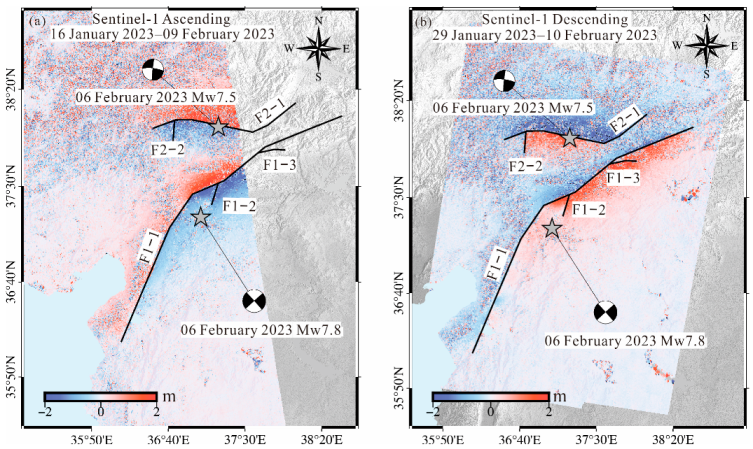
4.1. Coseismic Surface Deformation of the 2023 Turkey-Syria Earthquake Doublet
4.2. Estimated Coseismic Faulting Model
5. Discussion
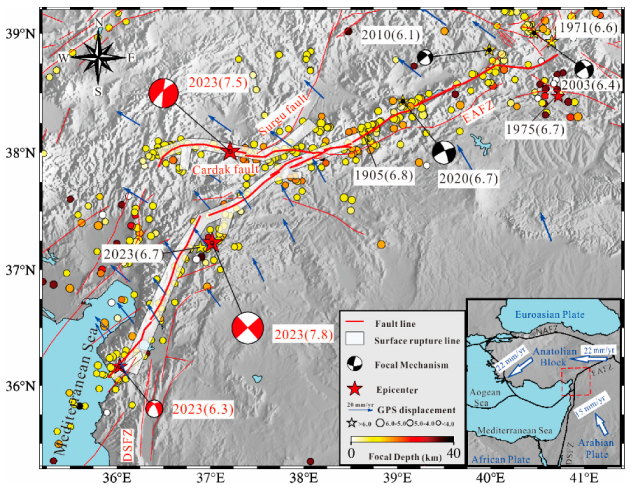
5.1. Effects of the 2023 Turkey-Syria Earthquake on Nearby Faults
5.2. A Special Post-Seismic Deformation Zone
6. Conclusions
- (1)
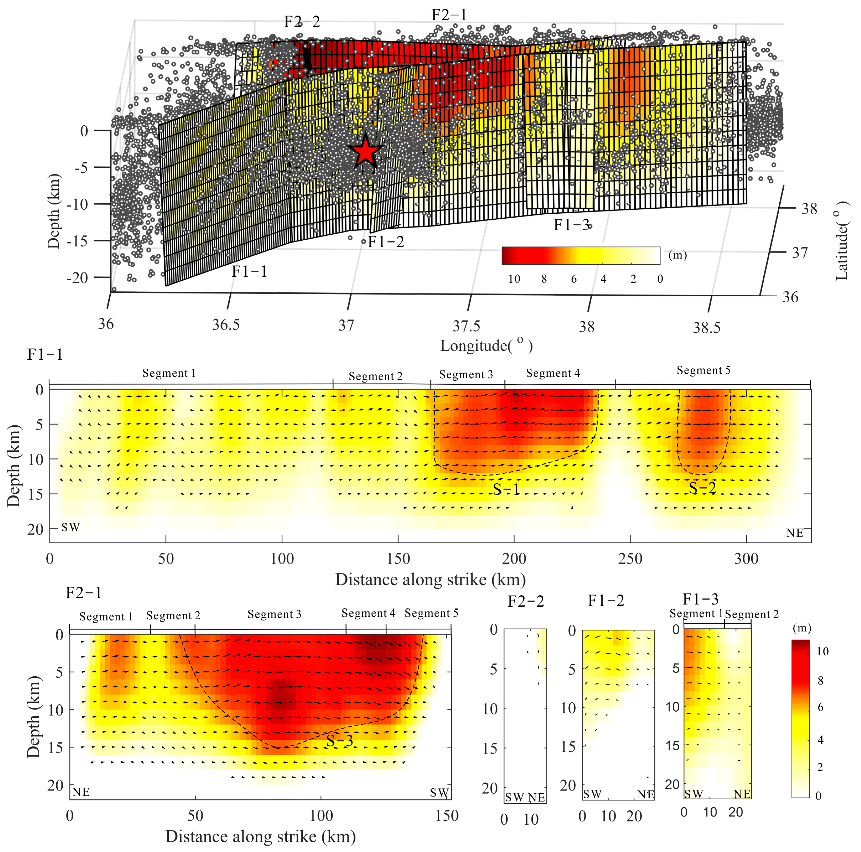
- The geometry of the fault that ruptured during the 2023 Turkey-Syria earthquake doublet is highly complex, with a surface rupture length exceeding 300 km. Both Mw 7.5+ earthquakes were dominated by the left-lateral strike-slip motion, with a slip peak of ~10.8 m located near the ground surface, three distinct asperities clearly discernible along the major fault, and a total released seismic moment of 10.15 × 10²⁰ Nm.
- (2)
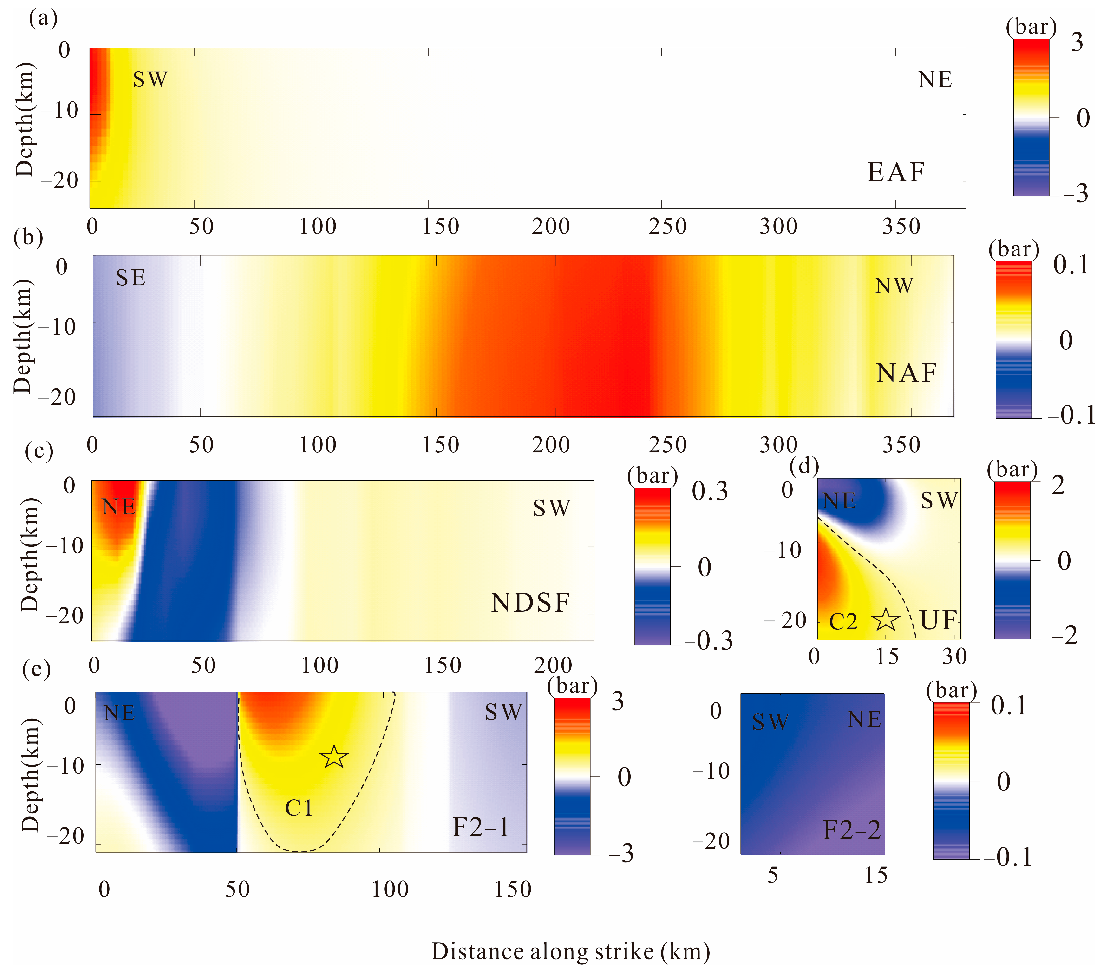
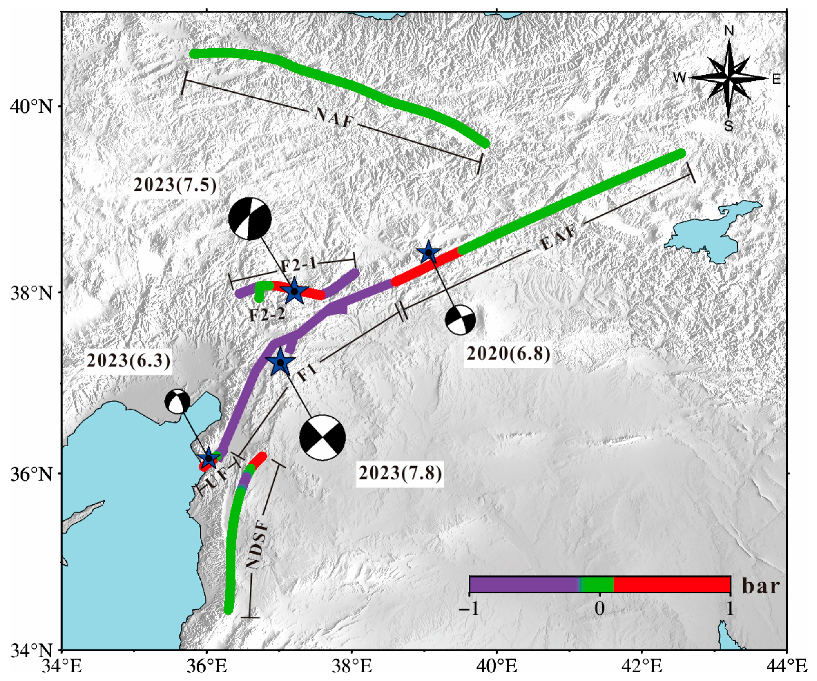
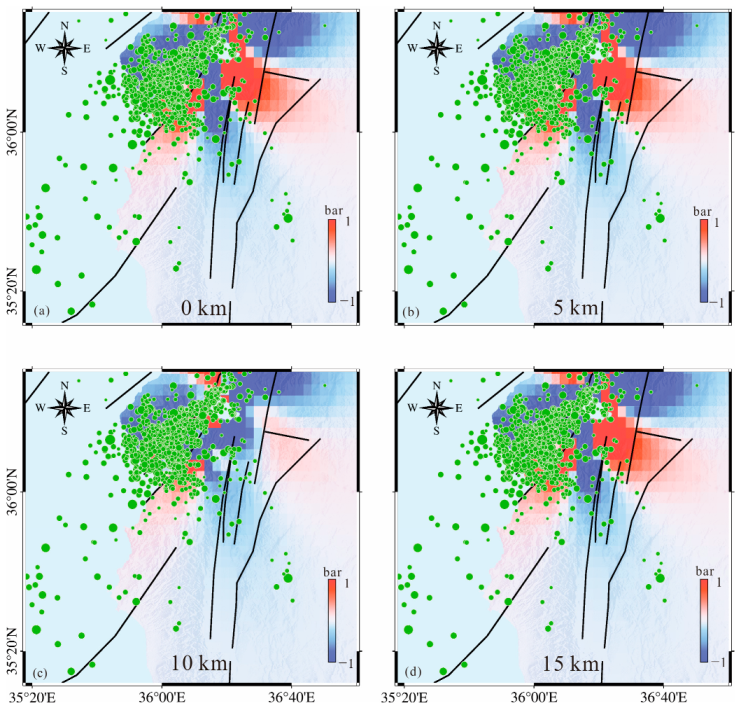
- The Mw 7.8 Pazarcik earthquake is believed to have triggered the subsequent Elbistan earthquake by increasing CFS (>1 bar) in the nucleation zone of the Elbistan earthquake. These two earthquakes collectively facilitated the occurrence of the Uzunba earthquake on 20 February through stress redistribution.
- (3)
- For the adjacent large faults, the 2023 Turkey-Syria earthquake promoted the rupture of the Puturge segment of the EAF fault and the northern segment of the Dead Sea Fault. Due to the minor CFS variations, this earthquake has a negligible impact on other neighboring major faults. Notably, the absence of large-magnitude earthquakes in the northern segment of the DSF for several centuries suggests an increasing risk of future seismic hazards.
- (4)
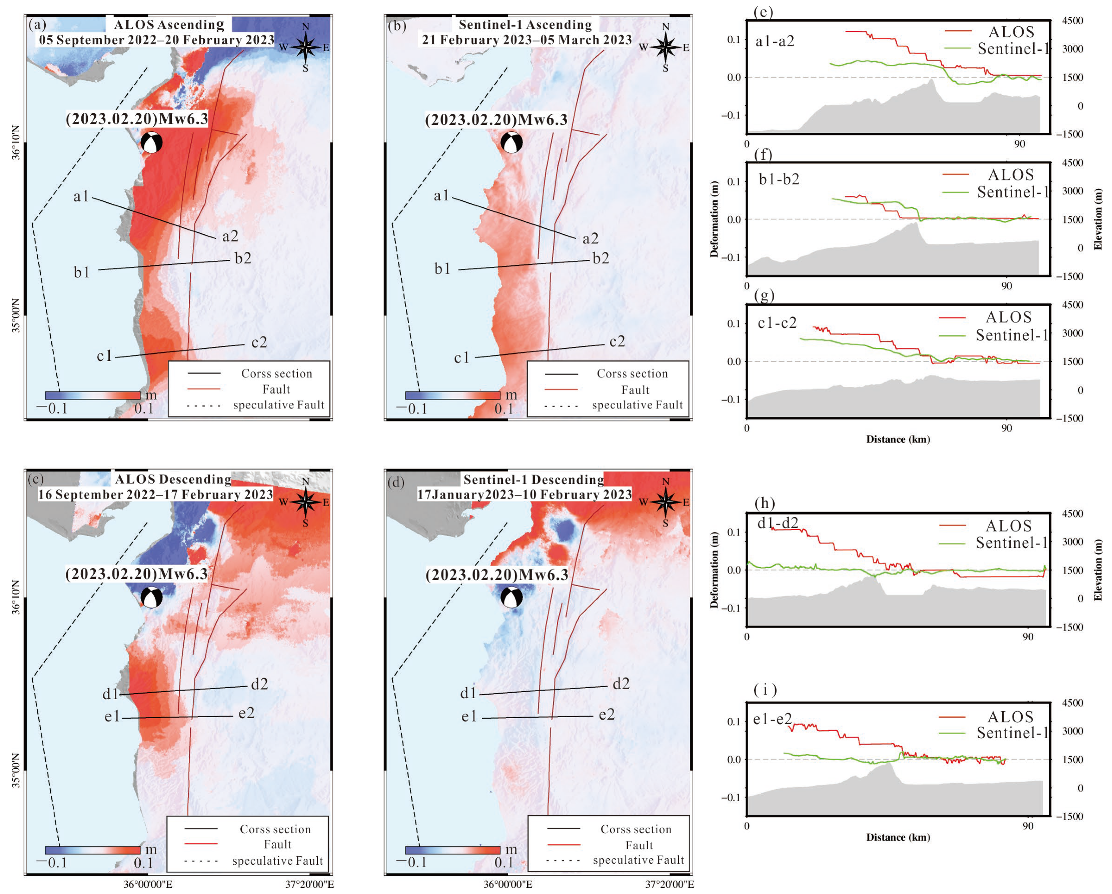
- A special deformation zone adjacent to the Dead Sea Fault was identified, characterized by an increase in deformation towards the western coastline. The extension of deformation is inhibited by the Dead Sea Fault, which may be attributed to the activity of a submarine fault.
Author Contributions
Funding
Data Availability Statement
Acknowledgments
Conflicts of Interest
References
- ISC. ISC-GEM Global Instrumental Earthquake Catalogue (1904–2018); International Seismological Centre: Thatcham, UK, 2022. [Google Scholar]
- Zilio, D.; Ampuero, J.-P. Earthquake doublet in Turkey and Syria. Commun. Earth Environ. 2023, 4, 71. [Google Scholar] [CrossRef]
- Güvercin, S.E.; Karabulut, H.; Konca, A.Ö.; Doğan, U.; Ergintav, S. Active seismotectonics of the East Anatolian Fault. Geophys. J. Int. 2022, 230, 50–69. [Google Scholar] [CrossRef]
- Reilinger, R.; McClusky, S.; Vernant, P.; Lawrence, S.; Ergintav, S.; Cakmak, R.; Ozener, H.; Kadirov, F.; Guliev, I.; Stepanyan, R.; et al. GPS constraints on continental deformation in the Africa-Arabia-Eurasia continental collision zone and implications for the dynamics of plate interactions. J. Geophys. Res. 2006, 111, B05411. [Google Scholar] [CrossRef]
- Viltres, R.; Jónsson, S.; Alothman, A.O.; Liu, S.; Leroy, S.; Masson, F.; Doubre, C.; Reilinger, R. Present-Day Motion of the Arabian Plate. Tectonics 2022, 41, e2021TC007013. [Google Scholar] [CrossRef]
- Legendre, C.P.; Zhao, L.; Tseng, T.-L. Large-scale variation in seismic anisotropy in the crust and upper mantle beneath Anatolia, Turkey. Commun. Earth Environ. 2021, 2, 73. [Google Scholar] [CrossRef]
- Allmendinger, R.W.; Reilinger, R.; Loveless, J. Strain and rotation rate from GPS in Tibet, Anatolia, and the Altiplano. Tectonics 2007, 26. [Google Scholar] [CrossRef] [Green Version]
- Emre, Ö.; Duman, T.Y.; Özalp, S.; Şaroğlu, F.; Olgun, Ş.; Elmacı, H.; Çan, T. Active fault database of Turkey. Bull. Earthq. Eng. 2018, 16, 3229–3275. [Google Scholar] [CrossRef]
- McClusky, S.; Balassanian, S.; Barka, A.; Demir, C.; Ergintav, S.; Georgiev, I.; Gurkan, O.; Hamburger, M.; Hurst, K.; Kahle, H.; et al. Global Positioning System constraints on plate kinematics and dynamics in the eastern Mediterranean and Caucasus. J. Geophys. Res. 2000, 105, 5695–5719. [Google Scholar] [CrossRef]
- Lyberis, N.; Yurur, T.; Chorowicz, J.; Kasapoglu, E.; Gundogdu, N. The East Anatolian Fault: An oblique collisional belt. Tectonophysics 1992, 204, 1–15. [Google Scholar] [CrossRef]
- McKenzie, D. Active Tectonics of the Mediterranean Region. Geophys. J. Int. 1972, 30, 109–185. [Google Scholar] [CrossRef] [Green Version]
- Lazos, I.; Sboras, S.; Pikridas, C.; Pavlides, S.; Chatzipetros, A. Geodetic analysis of the tectonic crustal deformation pattern in the North Aegean Sea, Greece. Mediterr. Geosci. Rev. 2021, 3, 79–94. [Google Scholar] [CrossRef]
- Müller, M.D.; Geiger, A.; Kahle, H.G.; Veis, G.; Billiris, H.; Paradissis, D.; Felekis, S. Velocity and deformation fields in the North Aegean domain, Greece, and implications for fault kinematics, derived from GPS data 1993–2009. Tectonophysics 2013, 597–598, 34–49. [Google Scholar] [CrossRef]
- Nyst, M.; Thatcher, W. New constraints on the active tectonic deformation of the Aegean. J. Geophys. Res. 2004, 109. [Google Scholar] [CrossRef]
- Doǧangün, A. Performance of reinforced concrete buildings during the May 1, 2003 Bingöl Earthquake in Turkey. Eng. Struct. 2004, 26, 841–856. [Google Scholar] [CrossRef]
- Calayır, Y.; Sayın, E.; Yön, B. Performance of structures in the rural area during the March 8, 2010 Elazığ-Kovancılar earthquake. Nat. Hazards 2012, 61, 703–717. [Google Scholar] [CrossRef]
- Isik, E.; Aydin, M.C.; Buyuksarac, A. 24 January 2020 Sivrice (Elazığ) earthquake damages and determination of earthquake parameters in the region. Earthq. Struct. 2020, 19, 145–156. [Google Scholar]
- Cerovečki, A.; Gharahjeh, S.; Harirchian, E.; Ilin, D.; Okhotnikova, K.; Kersten, J. Evaluation of Change Detection Techniques Using Very High Resolution Optical Satellite Imagery. Preface 2015, 2, 20. [Google Scholar]
- Jafari, M.; Aflaki, M.; Mousavi, Z.; Walpersdorf, A.; Motaghi, K. Coseismic and post-seismic characteristics of the 2021 Ganaveh earthquake along the Zagros foredeep fault based on InSAR data. Geophys. J. Int. 2023, 234, 1125–1142. [Google Scholar] [CrossRef]
- Werner, C.; Wegmuller, U.; Strozzi, T.; Wiesmann, A. Gamma SAR processor and interferometry software. In Proceedings of the 3rd ERS Symposium, Space Service Environment (Special Publication 414 ESA), Florence, Italy, 14–21 March 1997; Volume III, pp. 1687–1692. [Google Scholar]
- Yu, C.; Li, Z.; Penna, N.T.; Crippa, P. Generic Atmospheric Correction Model for Interferometric Synthetic Aperture Radar Observations. J. Geophys. Res. 2018, 123, 9202–9222. [Google Scholar] [CrossRef]
- Gomba, G.; Parizzi, A.; Zan, F.D.; Eineder, M.; Bamler, R. Toward Operational Compensation of Ionospheric Effects in SAR Interferograms: The Split-Spectrum Method. IEEE Trans. Geosci. Remote Sens. 2016, 54, 1446–1461. [Google Scholar] [CrossRef] [Green Version]
- Gomba, G.; González, F.R.; Zan, F.D. Ionospheric Phase Screen Compensation for the Sentinel-1 TOPS and ALOS-2 ScanSAR Modes. IEEE Trans. Geosci. Remote Sens. 2017, 55, 223–235. [Google Scholar] [CrossRef]
- Goldstein, R.M.; Werner, C.L. Radar interferogram filtering for geophysical applications. Geophys. Res. Lett. 1998, 25, 4035–4038. [Google Scholar] [CrossRef] [Green Version]
- Chen, C.W.; Zebker, H.A. Network approaches to two-dimensional phase unwrapping: Intractability and two new algorithms. J. Opt. Soc. Am. A 2000, 17, 401–414. [Google Scholar] [CrossRef] [PubMed]
- Hanssen, R.F. Radar Interferometry: Data Interpretation and Error Analysis; Springer Science & Business Media: Berlin/Heidelberg, Germany, 2001; Volume 2. [Google Scholar]
- Zou, W.; Li, Y.; Li, Z.; Ding, X. Improvement of the Accuracy of InSAR Image Co-Registration Based on Tie Points—A Review. Sensors 2009, 9, 1259–1281. [Google Scholar] [CrossRef] [Green Version]
- Sun, L.; Muller, J.-P. Evaluation of the Use of Sub-Pixel Offset Tracking Techniques to Monitor Landslides in Densely Vegetated Steeply Sloped Areas. Remote Sens. 2016, 8, 659. [Google Scholar] [CrossRef] [Green Version]
- Wessel, P.; Smith, W.H. New, improved version of Generic Mapping Tools released. Eos Trans. Am. Geophys. Union 1998, 79, 579. [Google Scholar] [CrossRef]
- Yang, Y.-H.; Tsai, M.-C.; Hu, J.-C.; Aurelio, M.A.; Hashimoto, M.; Escudero, J.A.P.; Su, Z.; Chen, Q. Coseismic Slip Deficit of the 2017 Mw 6.5 Ormoc Earthquake That Occurred Along a Creeping Segment and Geothermal Field of the Philippine Fault. Geophys. Res. Lett. 2018, 45, 2659–2668. [Google Scholar] [CrossRef]
- Okada, Y. Surface deformation due to shear and tensile faults in a half-space. Bull. Seismol. Soc. Am. 1985, 75, 1135–1154. [Google Scholar] [CrossRef]
- Lomax, A. Precise, NLL-SSST-Coherence Hypocenter Catalog for the 2023 Mw 7.8 and Mw 7.6 SE Turkey Earthquake Sequence. 2023. Available online: https://zenodo.org/record/7699882 (accessed on 10 April 2023).
- King, G.C.P.; Stein, R.S.; Lin, J. Static stress changes and the triggering of earthquakes. Bull. Seismol. Soc. Am. 1994, 84, 935–953. [Google Scholar]
- Harris, R.A.; Simpson, R.W.; Reasenberg, P.A. Influence of static stress changes on earthquake locations in southern California. Nature 1995, 375, 221–224. [Google Scholar] [CrossRef]
- Wan, Y.; Shen, Z.-K. Static Coulomb stress changes on faults caused by the 2008 Mw 7.9 Wenchuan, China earthquake. Tectonophysics 2010, 491, 105–118. [Google Scholar] [CrossRef]
- Kilb, D.; Gomberg, J.; Bodin, P. Aftershock triggering by complete Coulomb stress changes. J. Geophys. Res. 2002, 107, ESE 2-1–ESE 2-14. [Google Scholar] [CrossRef]
- Harris, R.A.; Simpson, R.W. Changes in static stress on southern California faults after the 1992 Landers earthquake. Nature 1992, 360, 251–254. [Google Scholar] [CrossRef]
- Hanks, T.C. Earthquake stress drops, ambient tectonic stresses and stresses that drive plate motions. Pure Appl. Geophys. 1977, 115, 441–458. [Google Scholar] [CrossRef]
- Gomberg, J.; Blanpied, M.L.; Beeler, N.M. Transient triggering of near and distant earthquakes. Bull. Seismol. Soc. Am. 1997, 87, 294–309. [Google Scholar] [CrossRef]
- Stein, R.S.; Barka, A.A.; Dieterich, J.H. Progressive failure on the North Anatolian fault since 1939 by earthquake stress triggering. Geophys. J. Int. 1997, 128, 594–604. [Google Scholar] [CrossRef] [Green Version]
- Heidbach, O.; Ben-Avraham, Z. Stress evolution and seismic hazard of the Dead Sea Fault System. Earth Planet. Sci. Lett. 2007, 257, 299–312. [Google Scholar] [CrossRef] [Green Version]
- Liu, X.; Chen, Q.; Yang, Y.; Xu, Q.; Zhao, J.; Xu, L.; Liu, R. The 2021 Mw 7.4 Maduo earthquake: Coseismic slip model, triggering effect of historical earthquakes and implications for adjacent fault rupture potential. J. Geodyn. 2022, 151, 101920. [Google Scholar] [CrossRef]
- Alkan, H.; Büyüksaraç, A.; Bektaş, Ö.; Işık, E. Coulomb stress change before and after 24.01.2020 Sivrice (Elazığ) Earthquake (Mw = 6.8) on the East Anatolian Fault Zone. Arab. J. Geosci. 2021, 14, 2648. [Google Scholar] [CrossRef]
- Meghraoui, M.; Gomez, F.; Sbeinati, R.; Van der Woerd, J.; Mouty, M.; Darkal, A.N.; Radwan, Y.; Layyous, I.; Al Najjar, H.; Darawcheh, R.; et al. Evidence for 830 years of seismic quiescence from palaeoseismology, archaeoseismology and historical seismicity along the Dead Sea fault in Syria. Earth Planet. Sci. Lett. 2003, 210, 35–52. [Google Scholar] [CrossRef]


| Sensor | Orbit Direction | Acquisition Time | Perp. Baseline (m) | Heading Angle (°) | Incidence Angle (°) | Imaging Mode | |
|---|---|---|---|---|---|---|---|
| The 2023 Turkey-Syria earthquake doublet | Sentinel-1 | Ascending | 16 January 2023– 9 February 2023 | 4.9 | −13.0 | 33.9 | TOPS |
| Sentinel-1 | Descending | 29 January 2023– 10 February 2023 | 106 | −166.6 | 33.8 | TOPS | |
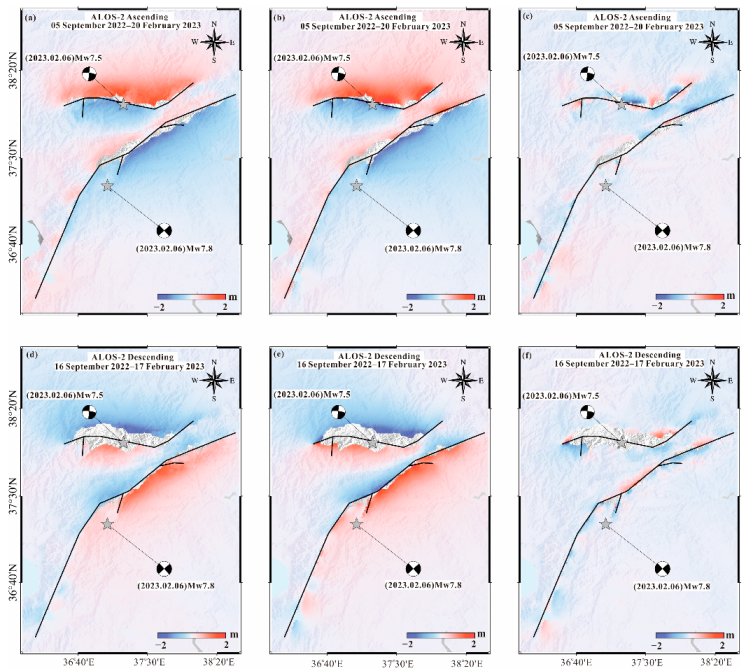
| ALOS-2 | Ascending | 5 September 2022– 20 February 2023 | −15.2 | −10.9 | 35.4 | ScanSAR | |
| ALOS-2 | Descending | 16 September 2022– 17 February 2023 | 48.6 | −169.1 | 35.2 | ScanSAR | |
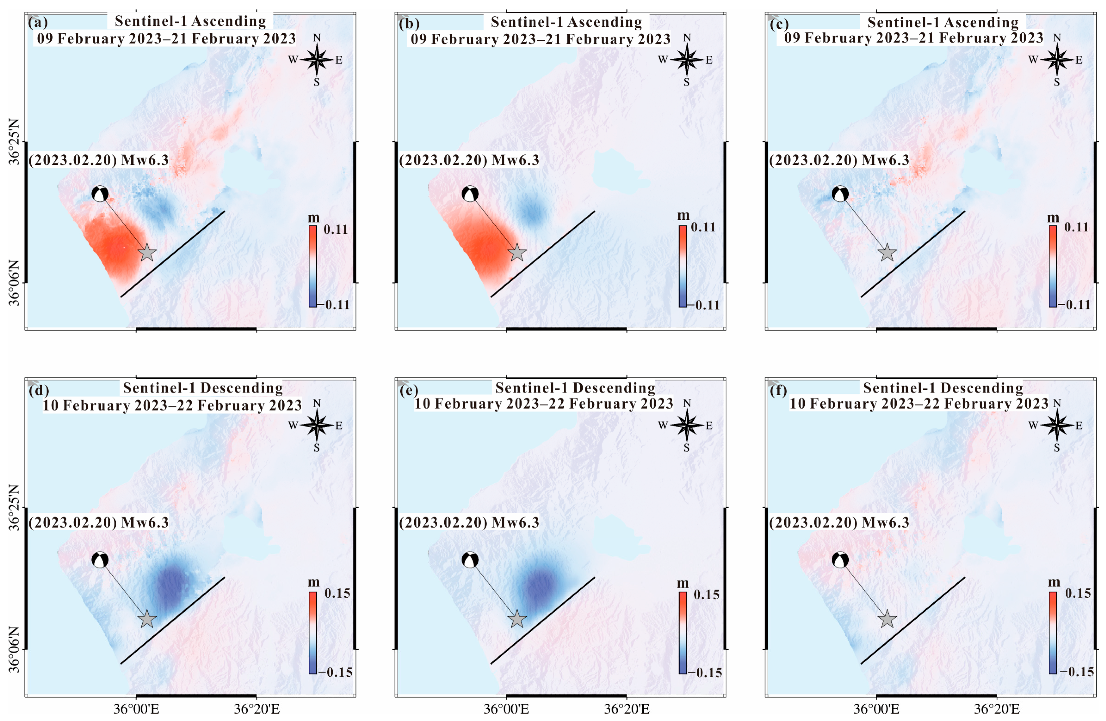
| The Mw 6.3 Uzunba earthquake | Sentinel-1 | Ascending | 9 February 2023– 21 February 2023 | 1.59 | −13.0 | 33.9 | TOPS |
| Sentinel-1 | Descending | 10 February 2023– 22 February 2023 | 66.9 | −166.9 | 33.9 | TOPS |
| Institution/Author | Fault | Strike Angle (°) | Dip Angle (°) | Rake Angle (°) | Mw |
|---|---|---|---|---|---|
| This study | F1 | ~43 | ~88 | ~0 | 7.8 |
| F2 | ~261 | 70 | −4 | 7.7 | |
| USGS | F1 | 228 | 89 | −1 | 7.75 |
| F2 | ~261 | 70 | 4 | 7.55 | |
| GCMT | F1 | 54 | 70 | 11 | 7.8 |
| F2 | 261 | 42 | −8 | 7.7 | |
| CENC | F1 | 235 | 88 | −6 | 7.7 |
| F2 | 266 | 42 | −14 | 7.6 |
Disclaimer/Publisher’s Note: The statements, opinions and data contained in all publications are solely those of the individual author(s) and contributor(s) and not of MDPI and/or the editor(s). MDPI and/or the editor(s) disclaim responsibility for any injury to people or property resulting from any ideas, methods, instructions or products referred to in the content. |
© 2023 by the authors. Licensee MDPI, Basel, Switzerland. This article is an open access article distributed under the terms and conditions of the Creative Commons Attribution (CC BY) license (https://creativecommons.org/licenses/by/4.0/).
Share and Cite
Zhao, J.-J.; Chen, Q.; Yang, Y.-H.; Xu, Q. Coseismic Faulting Model and Post-Seismic Surface Motion of the 2023 Turkey–Syria Earthquake Doublet Revealed by InSAR and GPS Measurements. Remote Sens. 2023, 15, 3327. https://0-doi-org.brum.beds.ac.uk/10.3390/rs15133327
Zhao J-J, Chen Q, Yang Y-H, Xu Q. Coseismic Faulting Model and Post-Seismic Surface Motion of the 2023 Turkey–Syria Earthquake Doublet Revealed by InSAR and GPS Measurements. Remote Sensing. 2023; 15(13):3327. https://0-doi-org.brum.beds.ac.uk/10.3390/rs15133327
Chicago/Turabian StyleZhao, Jing-Jing, Qiang Chen, Ying-Hui Yang, and Qian Xu. 2023. "Coseismic Faulting Model and Post-Seismic Surface Motion of the 2023 Turkey–Syria Earthquake Doublet Revealed by InSAR and GPS Measurements" Remote Sensing 15, no. 13: 3327. https://0-doi-org.brum.beds.ac.uk/10.3390/rs15133327