

Analysis of the Superposition Effect of Land Subsidence and Sea-Level Rise in the Tianjin Coastal Area and Its Emerging Risks
1
School of Public Administration, Shandong Technology and Business University, Shandong 264005, China
2
Beijing Laboratory of Water Resources Security, Capital Normal University, Beijing 100048, China
3
Key Laboratory of Resource Environment and GIS of Beijing, Capital Normal University, Beijing 100048, China
4
State Key Laboratory of Urban Environmental Process and Digital Modeling, Capital Normal University, Beijing 100048, China
5
Key Laboratory of 3D Information Acquisition and Application, MOE, Capital Normal University, Beijing 100048, China
6
Key Laboratory of Mechanism Prevention and Mitigation of Land Subsidence MOE, Capital Normal University, Beijing 100048, China
7
Observation and Research Station of Groundwater and Land Subsidence in Beijing-Tianjin-Hebei Plain, MNR, Beijing 100048, China
*
Author to whom correspondence should be addressed.
Remote Sens. 2023, 15(13), 3341; https://0-doi-org.brum.beds.ac.uk/10.3390/rs15133341
Submission received: 6 May 2023
/
Revised: 24 June 2023
/
Accepted: 27 June 2023
/
Published: 30 June 2023
(This article belongs to the Special Issue InSAR for Environmental Remote Sensing: Current Progress and Future Vision)
Abstract
:Tianjin is a coastal city of China. However, the continuous rise of the relative sea-level has brought huge hidden danger to Tianjin’s economic and social development. The land subsidence is the most important factor that influences relative sea-level rise. By analyzing the current situation of subsidence in Tianjin through PS-InSAR, it was found that the subsidence rate of the southern plain of Tianjin is slowing down as a whole. In addition, Wuqing and Jinghai sedimentary areas as well as other several subsidence centers have been formed. By establishing a regular grid of land subsidence and ground water to construct a geo-weighted regression model (GWR), it was found that Wuqing sedimentary area as a whole is positively correlated with TCA. According to the relative sea-level change, it can be predicted that the natural coastline of Tianjin will recede by about 87 km2 in 20 years. Based on the research results above, this paper, by using machine-learning method (XGBoost), has evaluated Tianjin’s urban safety and analyzed high-risk areas and main contributing factors. Potential risks to urban safety brought about by relative sea-level rise have been analyzed, which will improve the resilience of coastal areas to disasters.
1. Introduction
Currently, densely populated coastal areas across the world are confronted with the threat of the continuous the sea-level rise, which has received great attention from governments and researchers of the world. Moreover, global warming has accelerated the melting of glaciers and the expansion of sea water, which, in turn, leads to sea-level rise. In 2012, Meehl proposed that global sea-levels would continue to rise even if some measures to reduce emissions had been taken [1]. In addition, with sea-level rise compounded by land subsidence, the relative impact of sea-level rise will be more significant [2]. As is widely known, land subsidence caused by excessive exploitation of ground water is the major factor of many factors affecting the relative sea-level rise. A study of the Mekong Delta in Vietnam, for instance, has demonstrated that the ground there will be anticipated to sink by 0.88 m by 2050 due to over-pumping. In the future, it is possible that the combination of sea-level rise and land subsidence will have the greatest impact on sea-level rise [3,4].
Land subsidence increases the relative sea-level rise of the region which, at the same time, threatens the survival of coastal cities. Jakarta, the major area where most studies have been conducted for coastal relative sea-level rise (i.e., land subsidence combined with sea-level rise), is sinking at the fastest rate in the world owing to the dual effects of land subsidence and sea-level rise. According to monitored data, Jakarta might well disappear in 30 years. Moreover, there are also studies on the relative sea-level rise which focus on the Rhin–Meuse Delta in The Netherlands [5], Turkey [6], the east coast of England [7], southern New Jersey in the United States [8,9], and the Fraser River Delta in Vancouver, Canada [10,11]. It is generally manifested in the studies that the subsidence rate of coastal areas is related to human activities. As land subsidence and sea-level rise might lead to potentially large land losses in coastal areas, the combination of them will accelerate the coastal flood frequency and the erosion rate of the coastal plain, affect the evolution of the coastal environment and the development and utilization of natural resources, and not benefit various water-conservancy projects such as urban water supply and drainage systems, port and wharf designs, seawalls, and the like. This will seriously threaten the security of the cities located in coastal areas.
A great many environmental problems, in coastal areas, have been brought about by the unreasonable exploitation of coastal resources and the construction of coastal projects. By now, land subsidence has taken place in 36 coastal cities in China [12]. According to long-term monitored data, the areas with accumulated settlement over 3000 mm in China’s coastal areas are mainly located in Tianjin, where the maximum accumulated settlement is 3450 mm, and in recent years the trend has worsened further [12].
The research objective of this paper is confined to the south plain area of Tianjin. According to existing research results, the relative sea-level of Tianjin might well rise by 231 cm between 1900 and 2100 [13]. If the sea-level rose by 30 cm without protection, the natural coastline of the Tianjin area would retreat by 50 km, reaching the urban area of Tianjin and submerging land of about 10,000 km2. If the sea-level rose by 100 cm, the coastline would recede by 70 km, potentially affecting a total area of 16,000 km2 [13]. With the passage of time, the extent and amount of land subsidence in coastal areas will increase year by year, with uneven spatial distribution gradually worsening. Although land subsidence in the coastal area of Tianjin is lower than that in its urban area, the sea-level rise, together with the superposition of the land subsidence, makes very prominent the problems of urban security in its coastal areas, especially under the premise of the extremely high requirements of trace subsidence and urban security.
At present, there are few research methods and models which can shed light on the risk of urban security caused by the relative sea-level rise, except for the case of Jakarta which has made a definite assessment of the inundation risk caused by the relative sea-level rise on land [14,15,16]. Through the observation of 15 years on Jakarta, it has been found that the combined effect of land subsidence and sea-level rise in the coastal areas of Jakarta gave rise to tidal flooding. Besides this, the seawater submergence simulation of a conservative scenario and a pessimistic scenario were also carried out. This is a relatively complete model of the relative sea-level risk that has existed. In Tianjin, the area chosen in this paper, there are no relevant models. There exist studies, the major tasks of which were only to describe the coastal vulnerability caused by the sea-level rise by virtue of sea-level changes, tidal characteristics, ground elevation status, population, the economy, and other indicators. Furthermore, in these studies, Tianjin was regarded as an area of high vulnerability and high risk [17]. Of course, there are other studies which have just analyzed and predicted the current situation of land subsidence and sea-level rise [13,18]. This paper attempts to utilize the XGBoost machine-learning method to evaluate the urban safety risk in Tianjin. The XGBoost model is one of the most popular machine-learning algorithms nowadays. Compared with the traditional machine-learning model, its calculation speed is faster and its generalization ability stronger. Compared with the deep-learning model, it focuses more on the interpretability of the model and is more suitable for tabular data with fewer data and fewer features. According to the latest research results, the XGBoost model will be gradually applied to the field of geological hazards, such as the risk prediction of landslide, land subsidence [19], and road collapse [20].
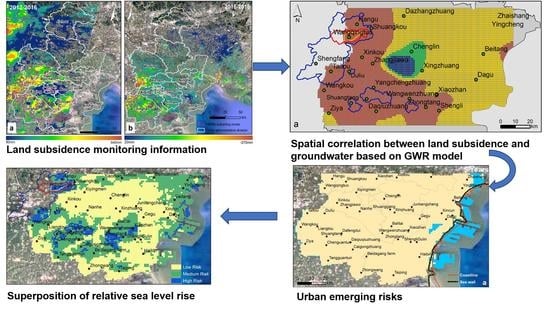
In this paper, land-subsidence monitoring information in Tianjin has been obtained by using InSAR technology, and the GWR model constructed by combining the subsidence information and layered groundwater data to analyze the spatial difference of groundwater effects on land subsidence. Meanwhile, this paper has analyzed the risks of rising seas and city security that may be caused by the superposition of sea-level rise and coastal plain land subsidence from the perspective of earth system science by combining existing observational data of sea-level rise, monitored data of coastal plain land subsidence, the data of stratified ground water, as well as land classification status. Besides this, in this paper, a land–sea coordinated XGBoost monitoring and evaluation system has been established to assess the impact of the relative sea-level rise and improve the ability to resist disasters in coastal areas.
2. Materials and Methods
2.1. Overview of Tianjin and Data Source
2.1.1. The Overview of Tianjin
Tianjin is a modern coastal city which is located in the North China Plain and where the construction of many major projects has been conducted by relying on the special geographical advantages of the coastal zone, and there are a large number of economic construction planned parks and major national engineering construction projects.
The plain area of Tianjin is about 10,664 km2. The study area of this paper is centered at (119°21′E, 39°13′N) and basically covers the southern plain of Tianjin. The basin of Tianjin is divided into the Beisanhe mountainous area, the Beisihe downstream plain, and the Daqinghe Diandong plain.
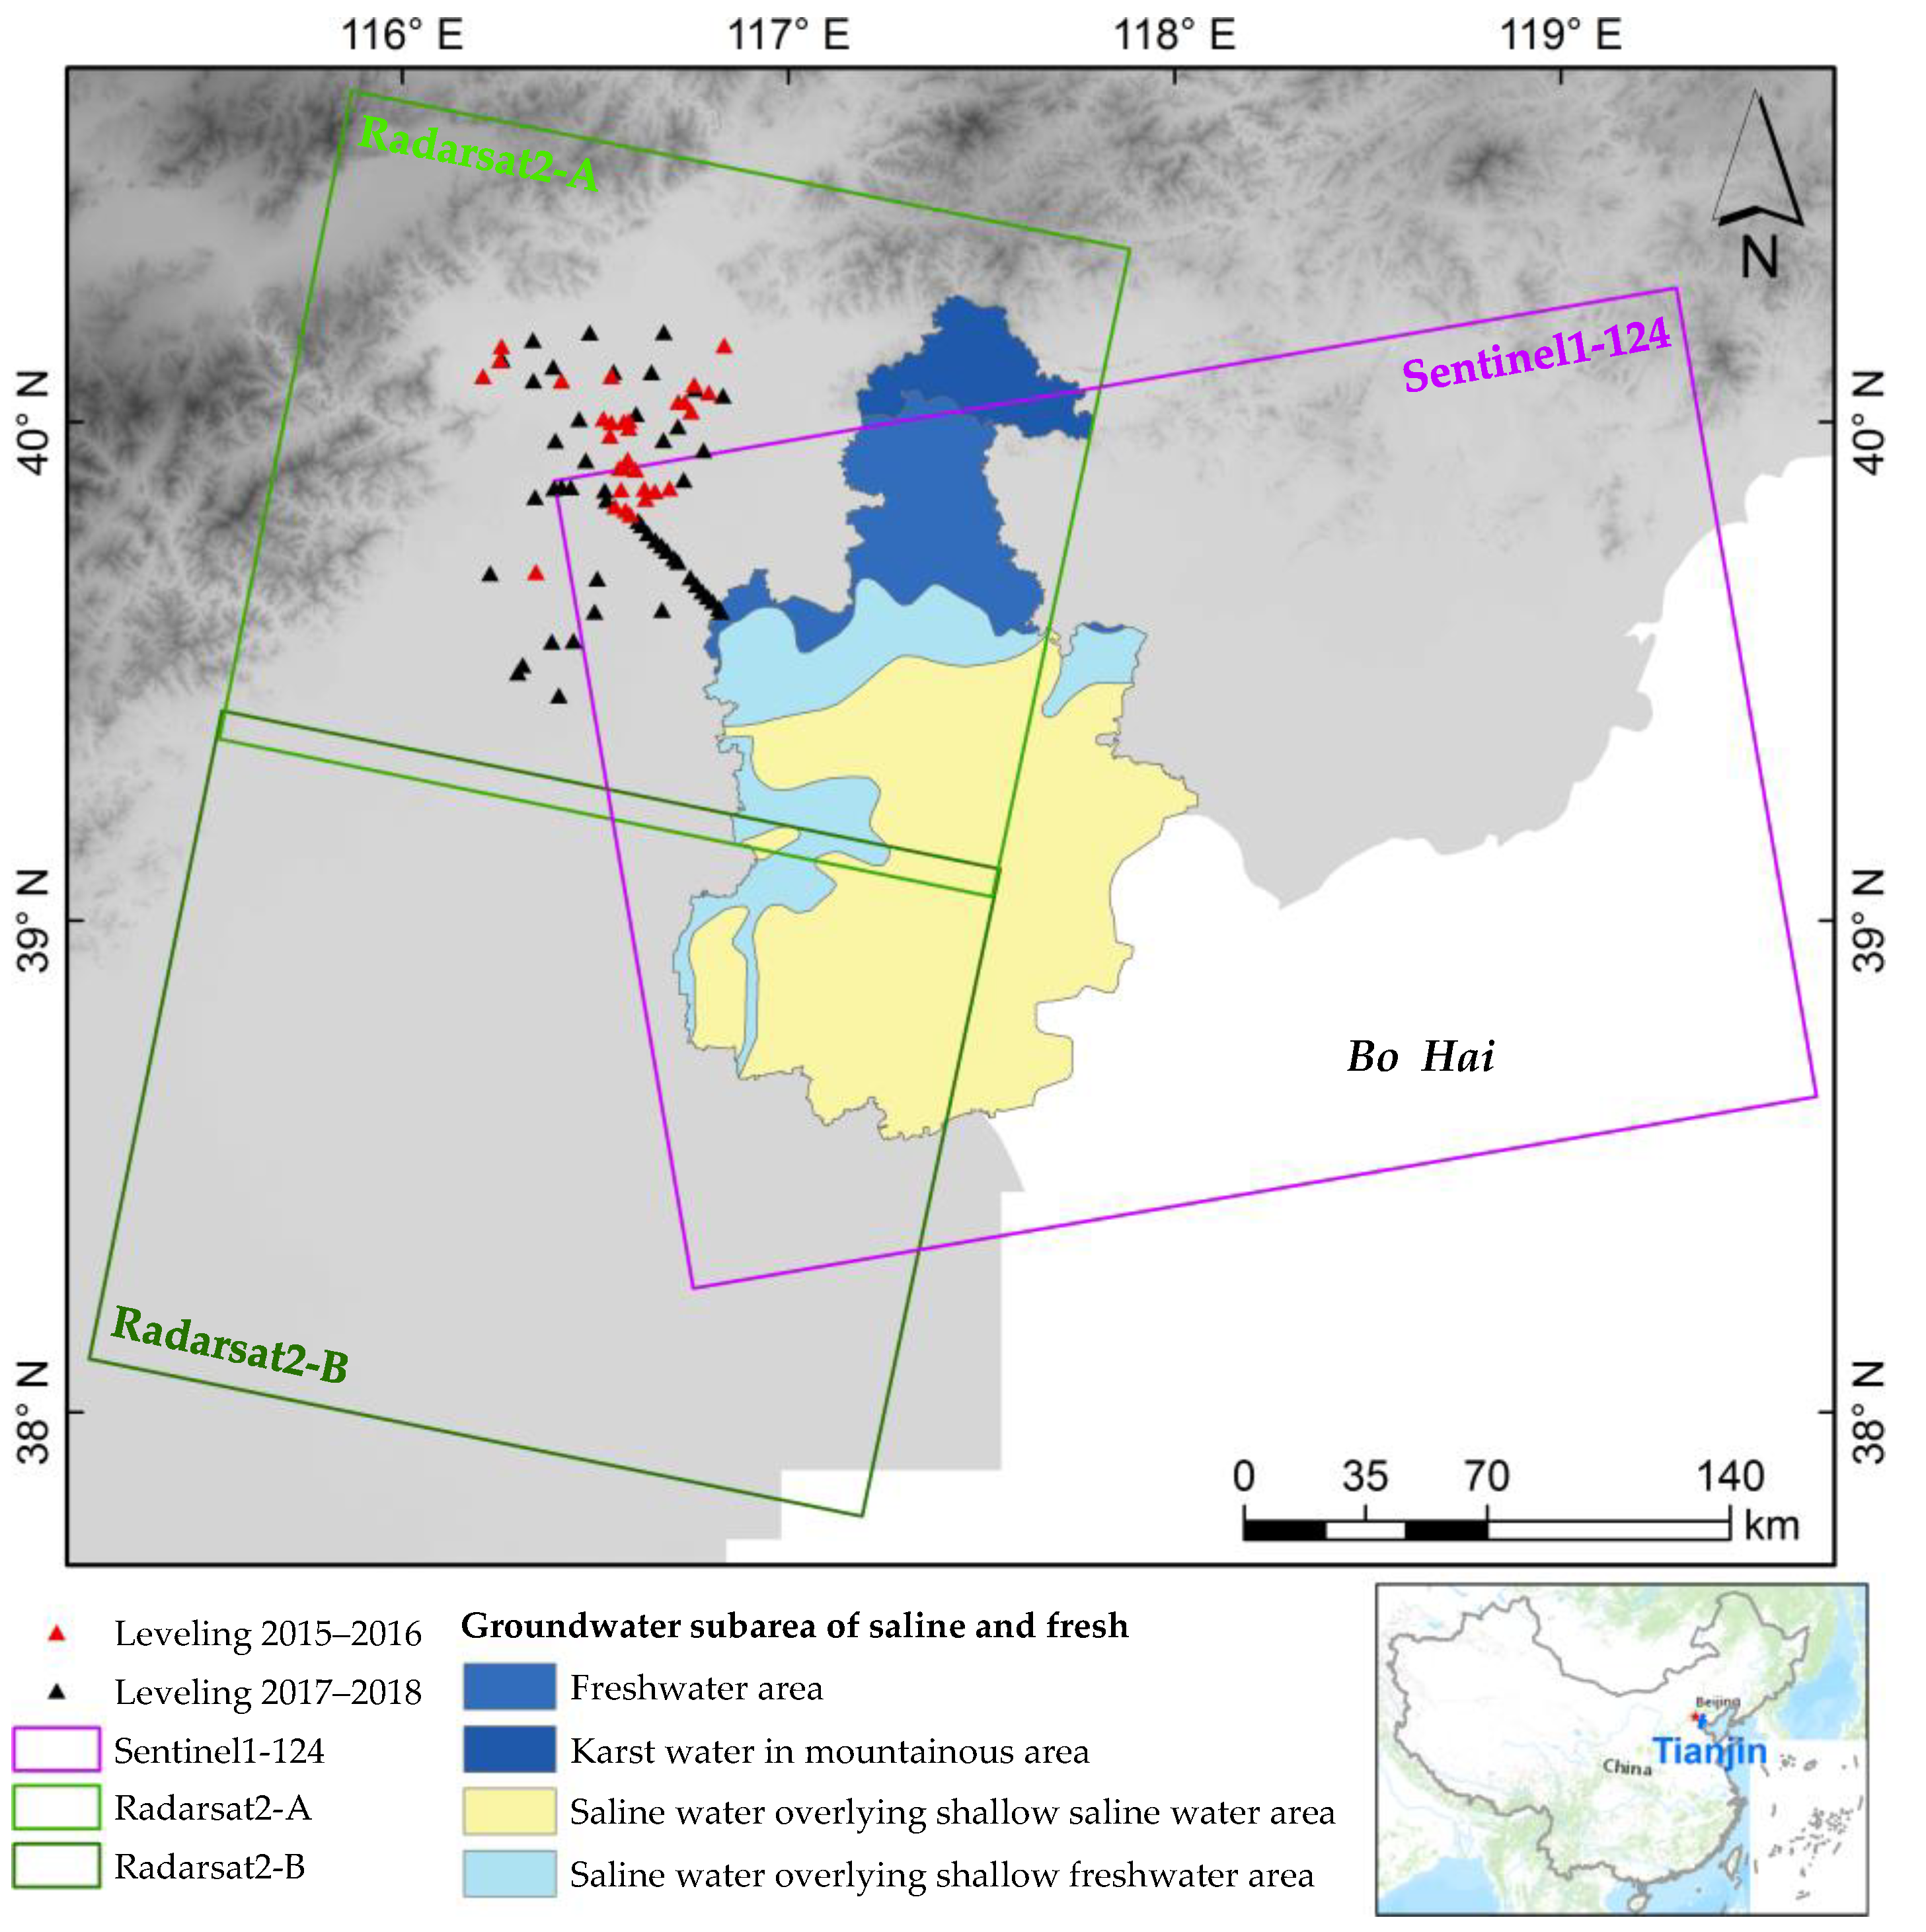
The northern part of Tianjin is the ground water of the Quaternary aquifer group in the freshwater area, while the southern part is the ground water of the Quaternary aquifer group in the upper part of the saltwater body. The entire freshwater area covers the whole territory of Jizhou District, the north of Wuqing District, the middle and north of Baodi District, as well as the north of Ninghe district. The distribution of shallow ground water in the upper part of the saltwater body covers Baodi District, Wuqing District, Ninghe District, Beichen District, Xiqing District, six urban districts in the city, and some areas in Jinghai district. The geographical location of Tianjin and the division of salt water and freshwater are shown in Figure 1.
2.1.2. Data
According to research needs, the Radarsat-2 and Sentinel-1 data are used to obtain the land-subsidence information of Tianjin, the water-resources bulletin data to obtain the change of stratified groundwater level, the AVISO+ data center and the China Sea Level Bulletin to obtain the sea-level rise rate, and the Landsat-8 land satellite to obtain the land-use status of Tianjin.
- Radarsat-2
Radarsat-2 data is C-band data, with the polarization method being VV polarization. Radarsat-2 data working mode is Wide Mode, with the spatial resolution being 30 m, and with the single-scene image-coverage area being 150 km × 150 km. The data of 88 images of two bands from 28 December 2012 to 21 October 2016 are selected, and the data sheet coverage is shown in Figure 1. Leveling results provided by Beijing Geological and Hydrological Team Engineering Team are used to verify the settlement monitoring results.
- 2.
- Sentinel-1
The temporal and spatial evolution of land subsidence in Tianjin plain has been studied by using 72 Sentinel-1 (Track 69, frame 143) images from January 2016 to December 2018. The Sentinel-1 launched by the European Commission (EC) and the European Space Agency (ESA) in April, 2014, possesses the system of all-weather and all-weather radar imaging.
Sentinel-1 data is free SAR data available with a width of 250 km, which is based on the C-band imaging system with dual polarization, a short revisit period (six days), and rapid-product production capabilities, and which is very suitable for InSAR surface deformation monitoring.
- 3.
- Groundwater level
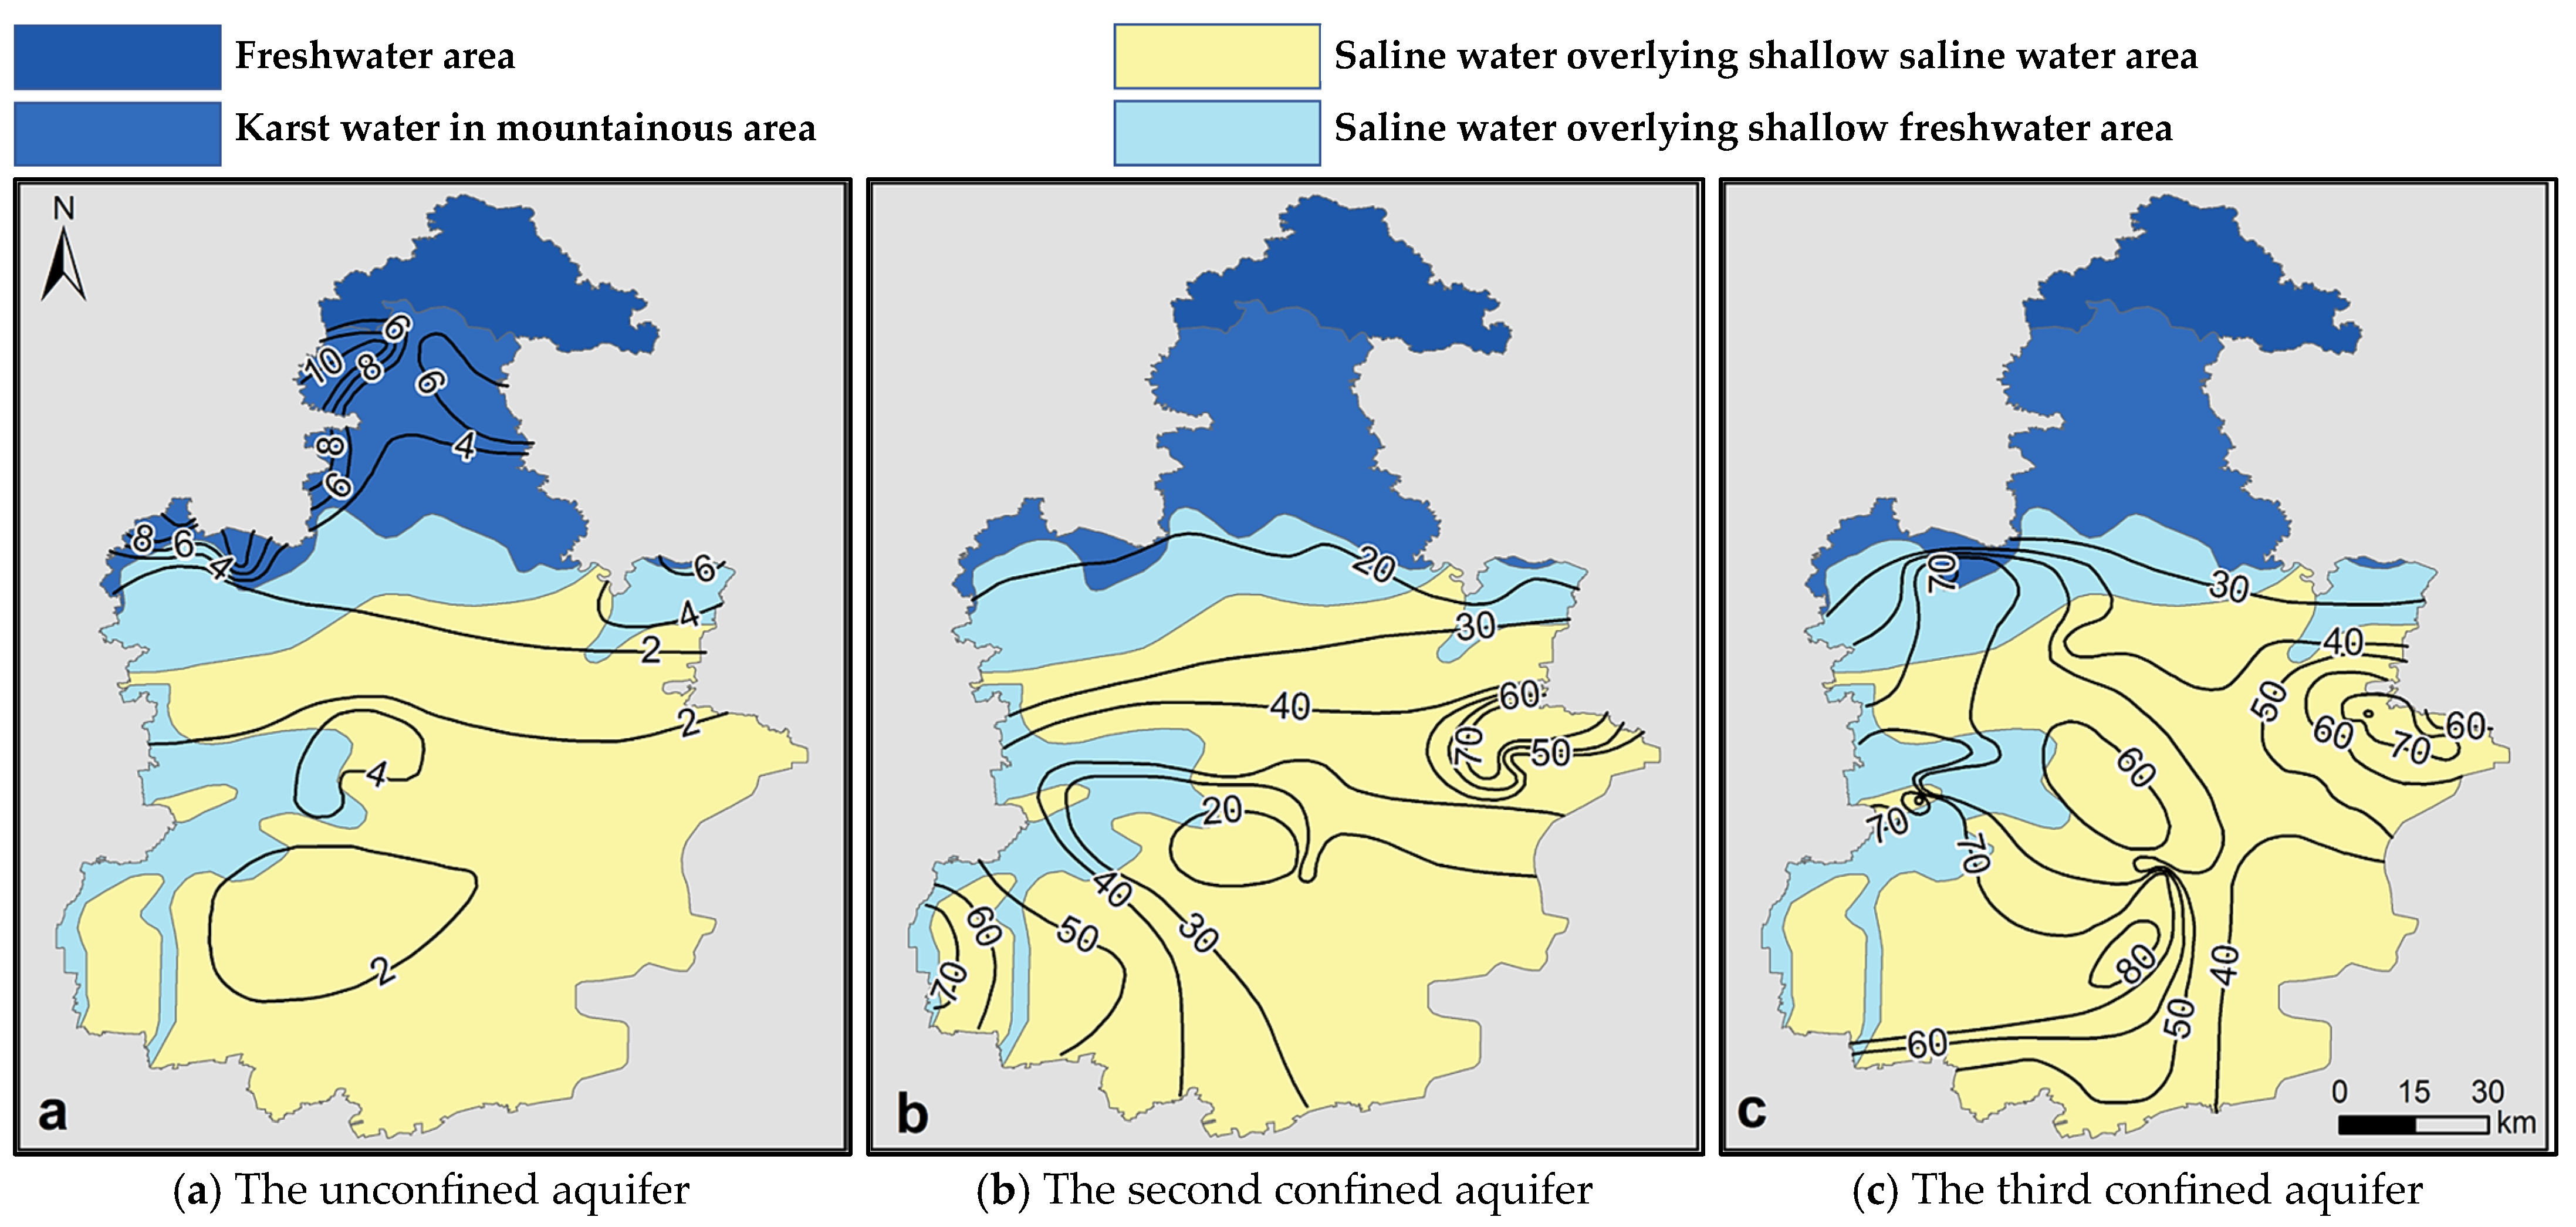
The shallow ground water in the plain area of Tianjin receives precipitation replenishment and evaporative discharge. Deep ground water generally refers to the deep freshwater below the salty water body in the saltwater zone, which mainly receives lateral recharge and overflow recharge from the upper shallow water. The ground water belonging to the Quaternary rock formations can be divided from top to bottom in the vertical direction into the unconfined aquifer (UA), saltwater aquifer, the second confined aquifer (SCA), the third confined aquifer (TCA), and the fourth confined aquifer, as shown in Figure 2. The fourth aquifer group is deeply buried and short of the data source, and the saline aquifer does not participate in mining and is scarce of data source. Therefore, both of them are not studied. The specific buried depth and lithology of the aquifer group used in the study are shown in Table 1.
The groundwater data comes from the statistics of the Tianjin Water Resources Bulletin from 2012 to 2018. By vectorizing the UA, SCA, and TCA isolines from 2012 to 2018, by extracting the accumulative water-level change isolines from 2012 to 2018, and by superimposing it with the accumulative settlement from 2012 to 2018, the correlation between the groundwater level and the accumulative land subsidence in each layer has been analyzed.
- 4.
- AVISO+
The sea-level height is derived from the monthly average sea-level height product provided by the French National Space Center (CNES) AVISO data center, which integrates multiple satellite altimeters. The product integrates the altimetry data of Topex/Poseidon, ERS, Envisat, Jasion, HY, and other satellites from 1993 to now, and calculates the sea-level height value based on a 20-year average, and averages it monthly. The spatial resolution of the product is (1/4)° × (1/4)°, with the time interval being one month. The calculated data result is compared and corrected with the interannual sea-level change given in the China Sea Level Bulletin.
- 5.
- Landsat-8
Landsat-8, which was launched on 11 February 2013, carries an OLI land imager and a thermal infrared sensor (TIRS) with a spatial resolution of 15 m–30 m, and completes global coverage every 16 days. The OLI land imager includes nine bands with a spatial resolution of 30 m, one of which is a 15 m panchromatic band with an imaging width of 185 × 185 km. The OLI contains all the bands of the ETM+ sensor, and the newly added blue band (band1: 0.433–0.453 μm) is mainly used for coastal observation. This paper has classified the land-use status of Tianjin by selecting the 2018 Landsat-8 OLI remote sensing image.
2.2. Methods and Technical Flow Chart
2.2.1. Methods
In this paper, the PS-InSAR method is used for land-subsidence monitoring, and the geographically weighted regression model method is adopted to study the correlation between subsidence and ground water. Besides this, maximum-likelihood classification is used for land-use classification, and the XGBoost method for sea-level rise risk prediction.
- PS-InSAR
PS-InSAR is the great development of InSAR technology, the core idea of which is to analyze the time series of the interference phase of permanent scatterers. According to the temporal and spatial characteristics of each phase component, the atmospheric fluctuation, DEM error and noise are separated from the differential interferometric phase one by one. Finally, the linear and non-linear deformation rate, atmospheric phase screen, and DEM error of each of the PS points are obtained. The accuracy of the annual deformation rate obtained by PS-InSAR can reach millimeter level. These coherent point targets with stable scattering characteristics constitute a discrete-point observation network, and, by analyzing the phase change of PS point targets, the surface deformation can be obtained, which can greatly reduce the influence of spatial baseline on coherence, and will play a greater role in monitoring urban land subsidence and even major infrastructure.
where is the phase of the differential interference; the deformation phase, including linear deformation and nonlinear deformation phase ; the phase of the terrain; the atmospheric phase; the orbital phase; and the noise phase. Because nonlinear deformation can be simulated by the linear deformation model, some nonlinear deformation can also be obtained by linear deformation measurement. One is to adopt the nonlinear deformation model, and the other is to decompose the long time interval into several short time periods, and to simulate the shape variables in each time period by using the function model, and then to solve the nonlinear quantity.
- 2.
- Geographically weighted regression model (GWR)
The GWR model is an extension of traditional regression methods. Geographic weighting is the same as other regression analysis. First of all, a research area should be defined. Usually, this area can include all the areas of the whole research data, and it can also be calculated by using the spatial relationship. For a specific study area, the regression coefficients may not be consistent in different spatial units. When the parameters of each observation object are estimated in space, the estimated values of the parameters are no longer the assumed constants obtained by using the global information, but the estimated values obtained by using the observed adjacent data. The regression coefficient of the study area is a coefficient of variation with the change of spatial position. This coefficient can reflect the spatial dependence of groundwater and land-subsidence variables. The weight is the distance function between the geospatial position of the observation value and the geospatial position of the regression point.
where and , are dependent variable (accumulated ground subsidence) and interpretation variable (cumulative variation of ground water in each layer) in position measured values, is the regression parameters of spatial position , is the independent normal distribution error term with the mean value of 0. is actually a function of position. A continuous function can be obtained by using the different spatial position of each element to calculate the attenuation function. If this attenuation function is obtained, the spatial position and the value of each element can be brought into this function. Then, a weight value can be attained, and it can be brought into the regression equation. By means of this attenuation function, different weights can be obtained. The theoretical basis of this attenuation function is the so-called “Tobler’s first law of geography”: the closer the data is, the greater the impact will be on the results. This effect is mathematically reduced to weight.
- 3.
- The maximum-likelihood method
The maximum-likelihood method is also called the Bayesian (Bayes) supervised classification. Assuming that the distribution of classification categories in the spectral space obeys a normal distribution, the conditional probability of the feature vector belonging to a certain class set is used as the discriminant function, which is called the probability discriminant function. When the probability discriminant function is used for classification, the criterion of “the smallest misclassification loss” is used to establish the required discriminant rules, which is the Bayes criterion. The discriminant function of the maximum-likelihood method, which is easy to establish, comprehensively uses the mean value, variance of each band, and the covariance between multiple bands for each category. Therefore, it has good statistical characteristics. In the study, the basic steps of using the maximum-likelihood method for classification are as follows:
Establish a template (training sample); roughly classify samples class; training samples are mainly defined by visual interpretation;
Create 5 interesting areas which contain construction land, cultivated land, vegetation, water area, and saltern; select areas with obvious features as various training samples, the number of which is about 200;
Calculate that the given pixel should be classified into the category with the highest probability. Based on the normal distribution of the data, the maximum-likelihood meth od, respectively, calculates the similarity between different given pixels and the training sample, and, finally, merges them into the sample with the largest similarity so as to achieve the purpose of separating images. The classification formula is as follows:
In the equation, respectively, represent the weighted distance, the measure ment vector of a certain feature type, and pixel, and , , the sample mean, co variance matrix, and the probability that the pixel to be divided belongs to category .
- 4.
- XGBoost
The XGBoost ensemble algorithm is used to train the data, and the influence of each sub tree on the final result is determined by adjusting the model parameters. The specific model parameters include learning_rate, n_estimators, max_depth, colsample_bytree, and min_child_weight. Finally, the training model is applied to the urban safety evaluation to achieve an objective analysis of the evaluation results. The XGBoost model, proposed by Chen and Guestrin in 2016 [21], is a new type of gradient-boosting decision-tree (GBDT) algorithm.
The XGBoost model uses Taylor second-order expansion to optimize the loss function, supports CPU multithreading parallel operation, and adds regularization term to the loss function, which greatly improves its operation efficiency and generalization ability com pared with other machine-learning algorithms. XGBoost is integrated by many CART regression trees, and the sample output form of the regression tree is numeric. Assuming that the model has decision trees, the model can be expressed as:
In the equation, corresponds to the set of all decision trees; is the -th decision tree produced by the -th iteration, which is a function in the function space .
The objective function is as follows:
where is the loss function, which indicates how well the model fits the data, and is the sum of all regularization terms.
Taylor expansion of the loss function is used to achieve Equation (6), and the final objective function is as follows.
By means of a greedy algorithm, XGBoost finds the optimal feature splitting, which requires traversal of all features. Based on the objective function, the minimum value before and after splitting is compared. When it reaches a certain depth or can no longer split, it stops. The point with the maximum gain is the best one, with the corresponding feature being the optimal feature [22].
2.2.2. Technical Flow Chart
The general technical process of the study is as follows: firstly, obtain the land-subsidence monitoring information of Tianjin from 2012 to 2018 by using the PS-InSAR method to process multi-scene Radarsat-2 and Sentinel-1 data and analyze the overall characteristics of land subsidence in Tianjin coastal areas; secondly, construct a GWR model by combining the cumulated settlement and the cumulative change of underground water level in each layer (UA, SCA, and FCA), and analyze the spatial difference of the influence of groundwater level variation on land subsidence; thirdly, with the AVISO, obtain the interannual variation of relative sea-level by combing the sea-level products and land subsidence, and, by comparing it with elevation, predict the area of natural coastline retreating in Tianjin in the next 20 years; finally, based on machine learning, establish the XGBoost monitoring and evaluation system by comprehensively considering the status quo of land-use classification, land subsidence, groundwater level, distance from the sea, and other influencing factors, and assess the risk of urban security. This technical flowchart is shown in Figure 3.
3. Results
3.1. Land Subsidence in Tianjin Plain
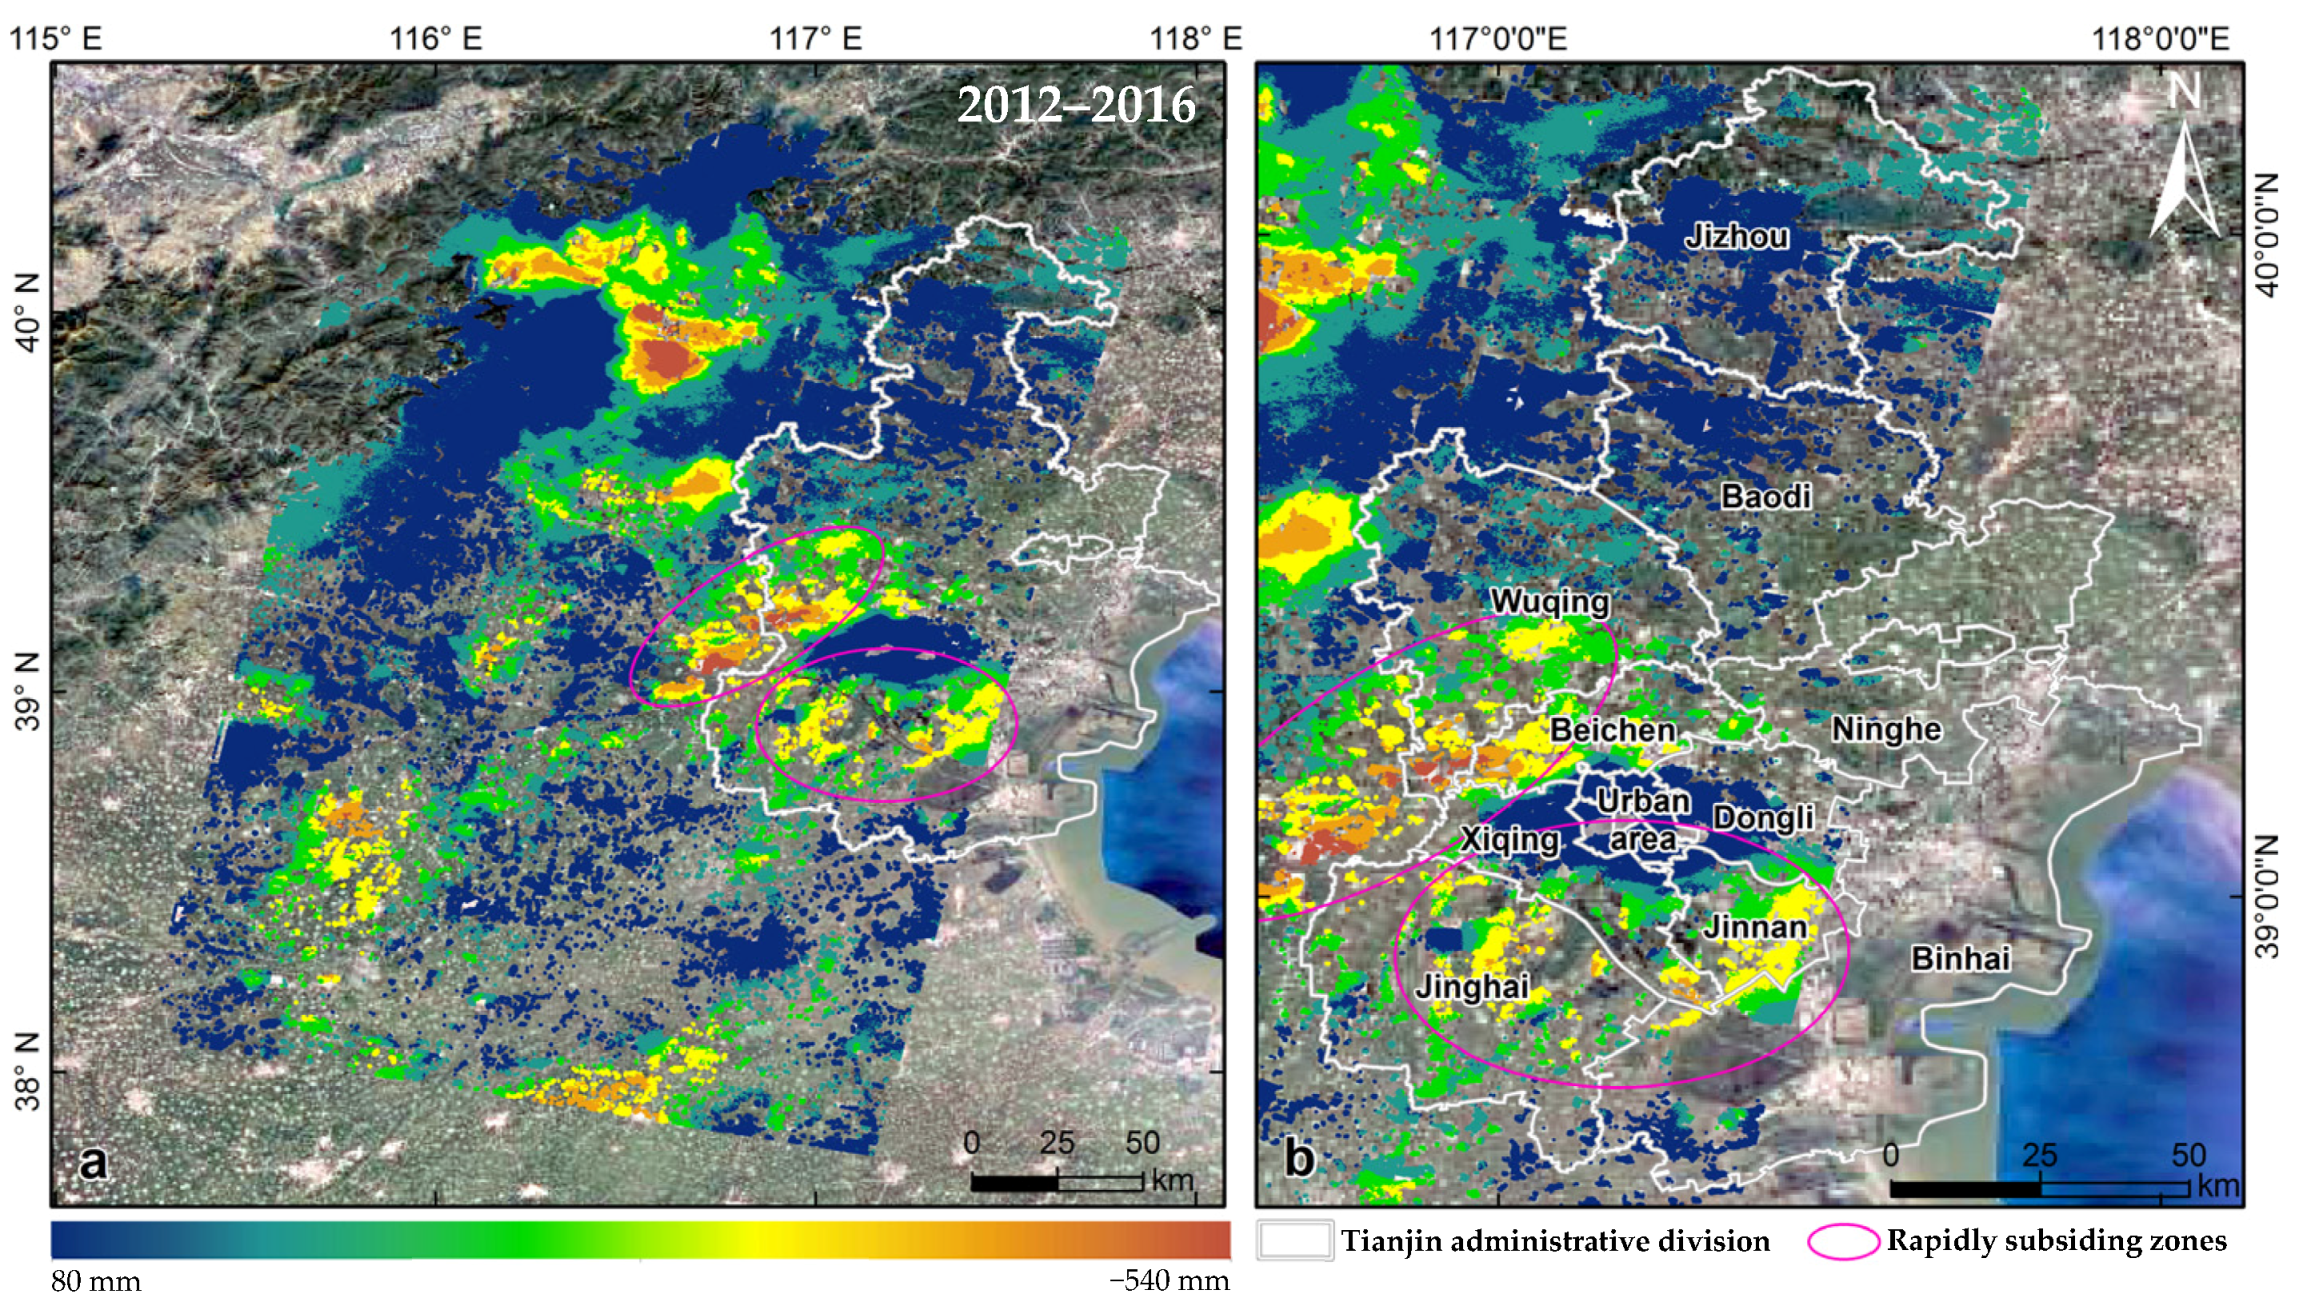
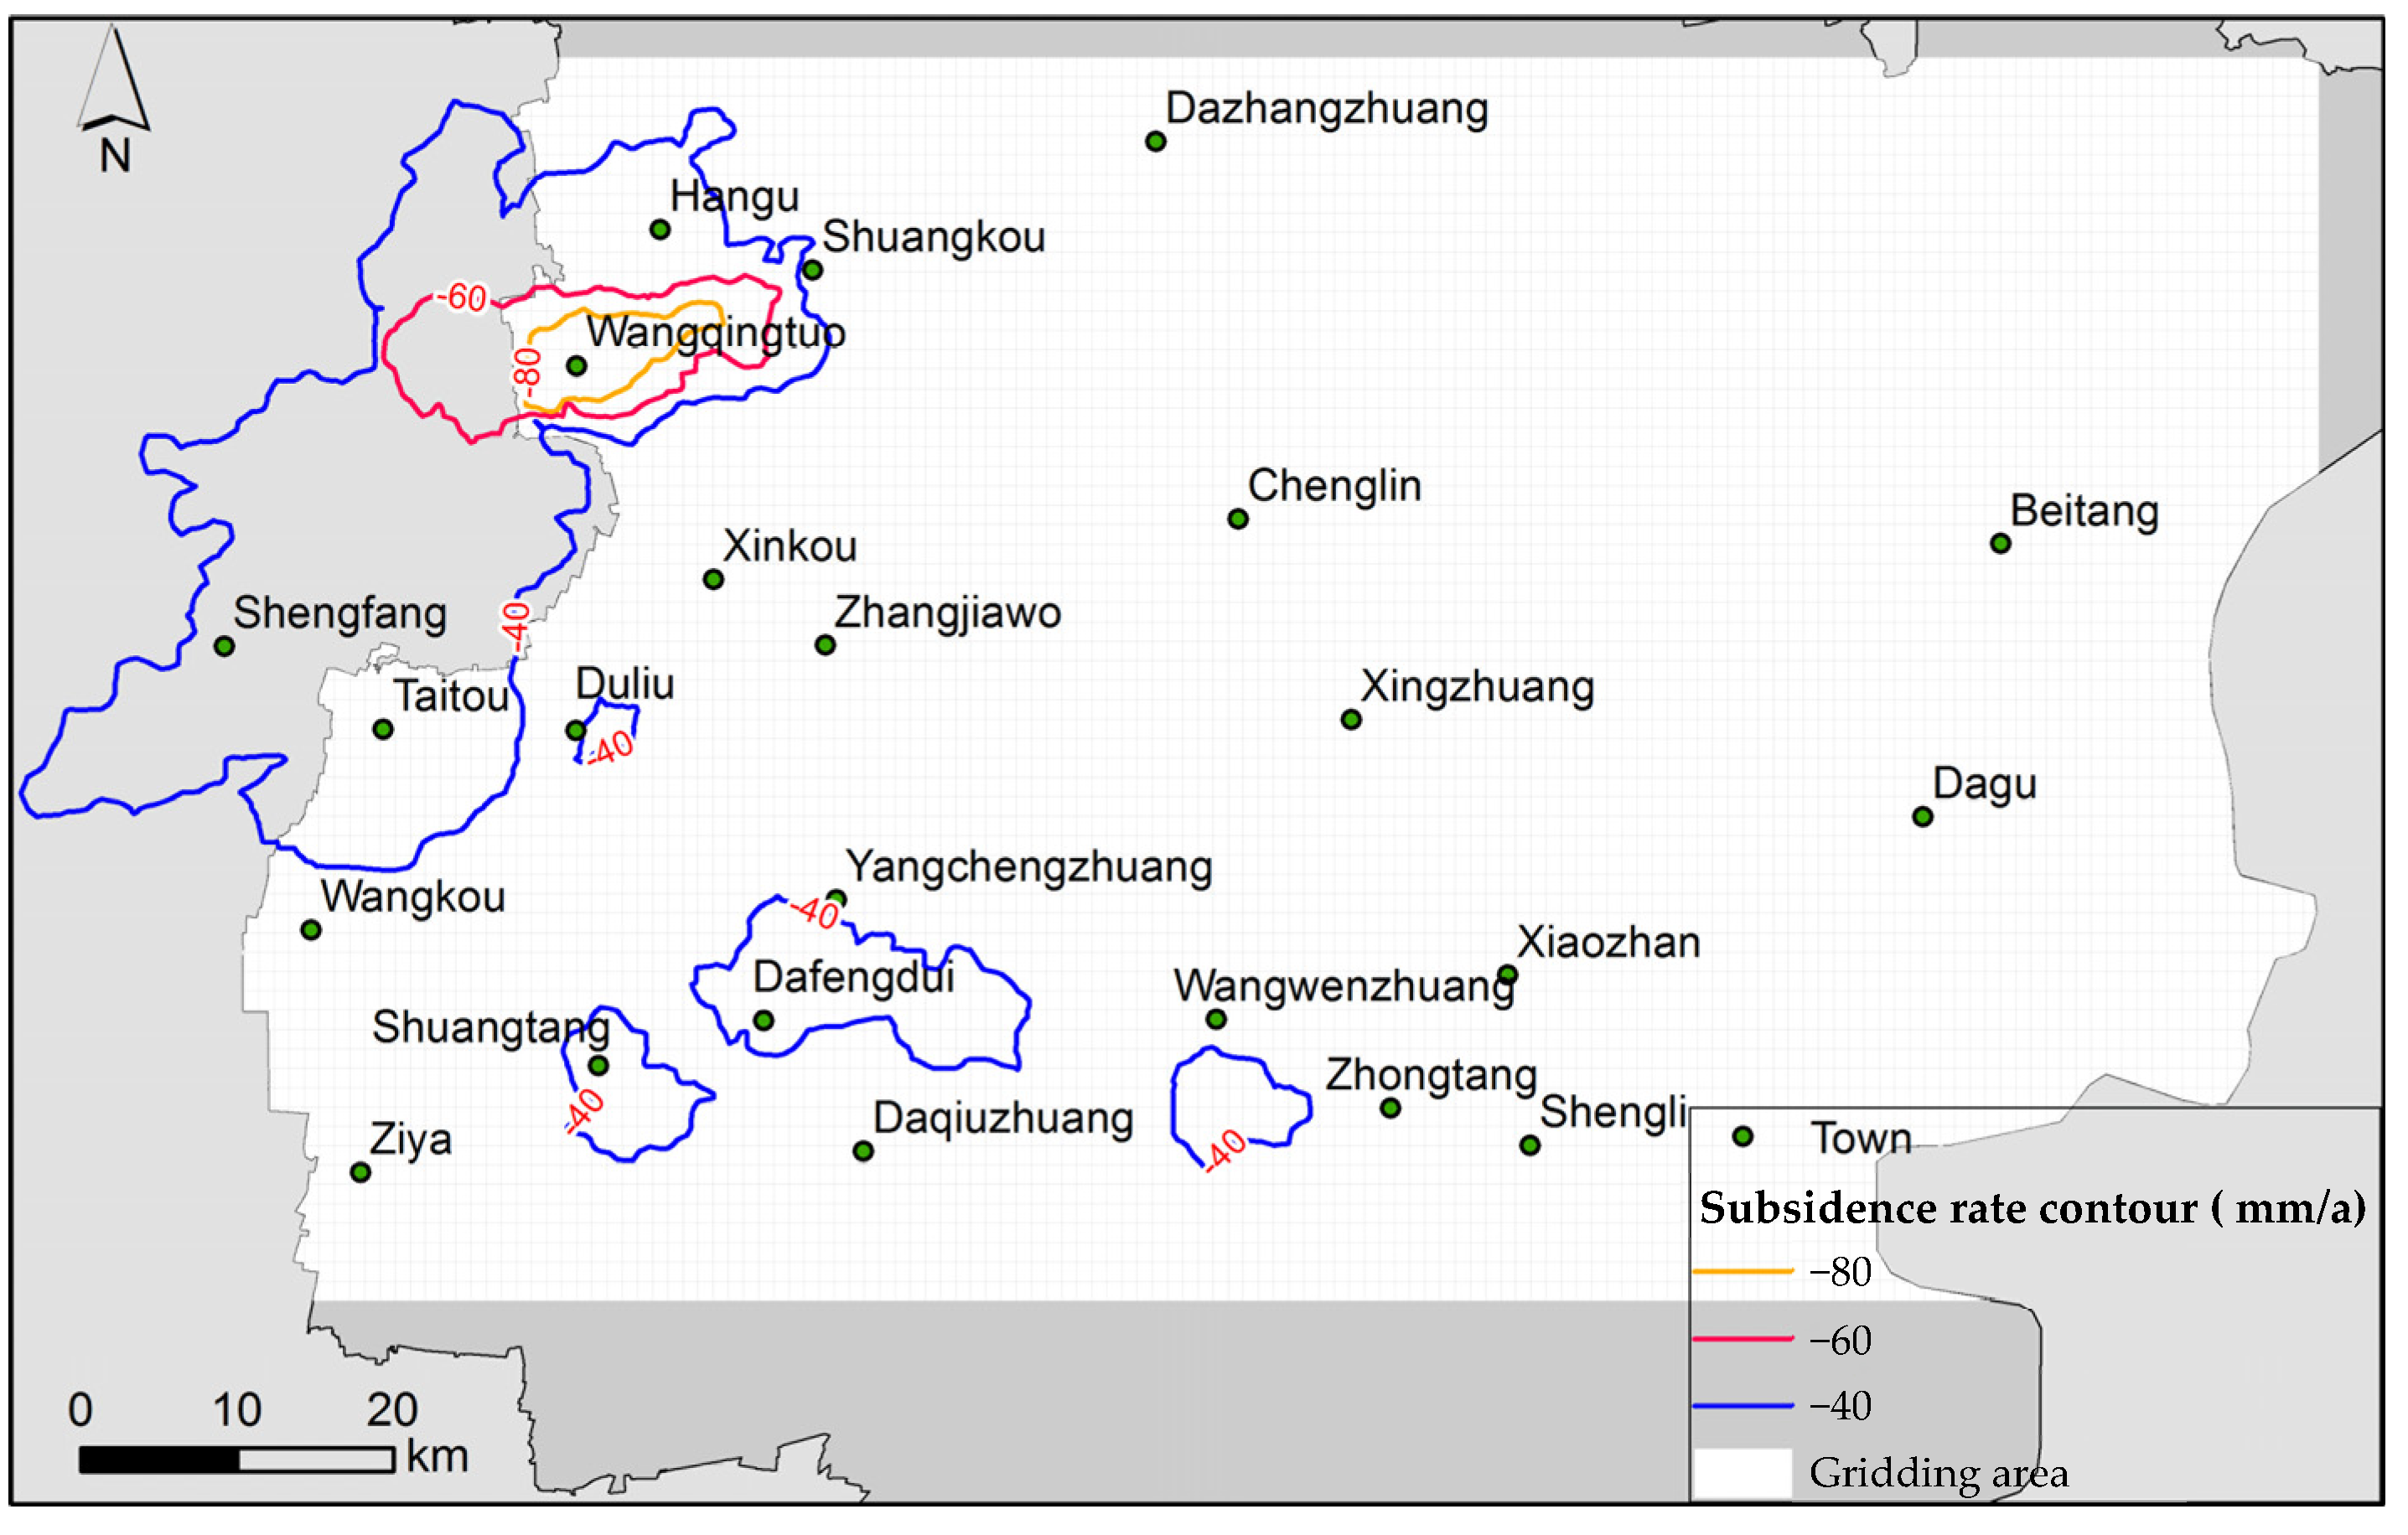
Aiming at the problem of land-subsidence information acquisition in Tianjin, Radarsat-2 (2012–2016) and Sentinel-1 (2016–2018) are selected to obtain the land-subsidence monitoring information by using PS-InSAR technology. The solution value of InSAR observation is the radar line-of-sight shape variable. Under the condition of independent observation in multiple directions, the least-squares method can be used to invert the shape variables in vertical, east–west, and even north–south directions. Actually, it is not possible to estimate the 3D displacement vector since we cannot generate 3D observations for the same area. According to the Wang Yan et al. experimental study of vertical and horizontal displacement retrieval by joint analysis of PS-InSAR data, the results show that the deformation of PS-InSAR is, mainly, caused by settlement, and the horizontal movement is very small [23]. Therefore, at the base of ignoring the calculation of horizontal deformation, the line-of-sight deformation rate obtained from PS-InSAR monitoring can be divided by the line of sight (LOS) deformation divided by cos θ to obtain the deformation rate in the vertical direction. The incident angle (θ) is determined by the parameters of the satellite’s main image. Radarsat-2 has an incidence angle of 36° and Sentinel-1 has an incidence angle of 32°. The deformation benchmarks are uniformly selected with a cumulative settlement and an annual settlement of 0, located in Zhangjiawo Town, Xiqing District, Tianjin City. Figure 4 shows the accumulated land subsidence and the settlement center area from 2012 to 2016 monitored by Tianjin Radarsat-2, and Figure 5 shows the accumulated land subsidence and the settlement center area from 2016 to 2018 monitored by Tianjin Sentinel-1. From 2012 to 2016, the maximum accumulated ground subsidence in Tianjin was 540 mm, and the annual average change rate of land subsidence was 135 mm/a. It can be seen from the figure that there are two major subsidence areas in Tianjin, namely, Wuqing subsidence area centered on Wangqingtuo and Jinghai subsidence area centered on Dafengdui. During this period, the land-subsidence problem in the area covered by Sentinel-1 data was still serious, with a maximum subsidence rate higher than 100 mm/a. The largest settlement center in Tianjin was still located in Wangqingtuo Town, Wuqing District. Compared with the previous period, the maximum subsidence rate decreased to 102 mm/a, with the cumulative subsidence being 306 mm.
Although the Wuqing subsidence area and the Langfang subsidence area belong to the same subsidence area, this study does not involve the subsidence area in Hebei Province due to the limitations of groundwater coverage and the study area. The areas with land-subsidence rates greater than 80 mm/a, 60 mm/a, and 40 mm/a are taken as the subsidence center areas, as shown in Figure 6. Specifically, they are composed of Wang Qingtuo Settlement Center, Taitou Settlement Center, Duliu Settlement Center, Wangwenzhuang Settlement Center, Shuangtang Settlement Center, and Zhongtang Settlement Center. By comparing the research results of 2012–2016 and 2016–2018, it has been found that, although the sedimentation rate of 2016–2018 slowed down, the subsidence rate of the Wangqingtuo settlement area exceeded 100 mm/a, and the subsidence rate of other centers exceeded 40 mm/a.
From January 2012 to December 2018, there was obvious land subsidence occurring in Tianjin plain which was characteristic of evident spatial heterogeneity. Two subsidence areas (Wuqing and Jinghai) contained multiple subsidence centers. The northern part of the subsidence zone reached the Han Valley of Wuqing, the southern part the Shuangtang area, and the eastern part the Wangwenzhuang and Zhongtang areas. Therefore, it is suggested that relevant departments and researchers should pay attention to this issue as the subsidence range and the subsidence center tend to expand to the east coast.
3.2. Validation
3.2.1. Leveling Surveying
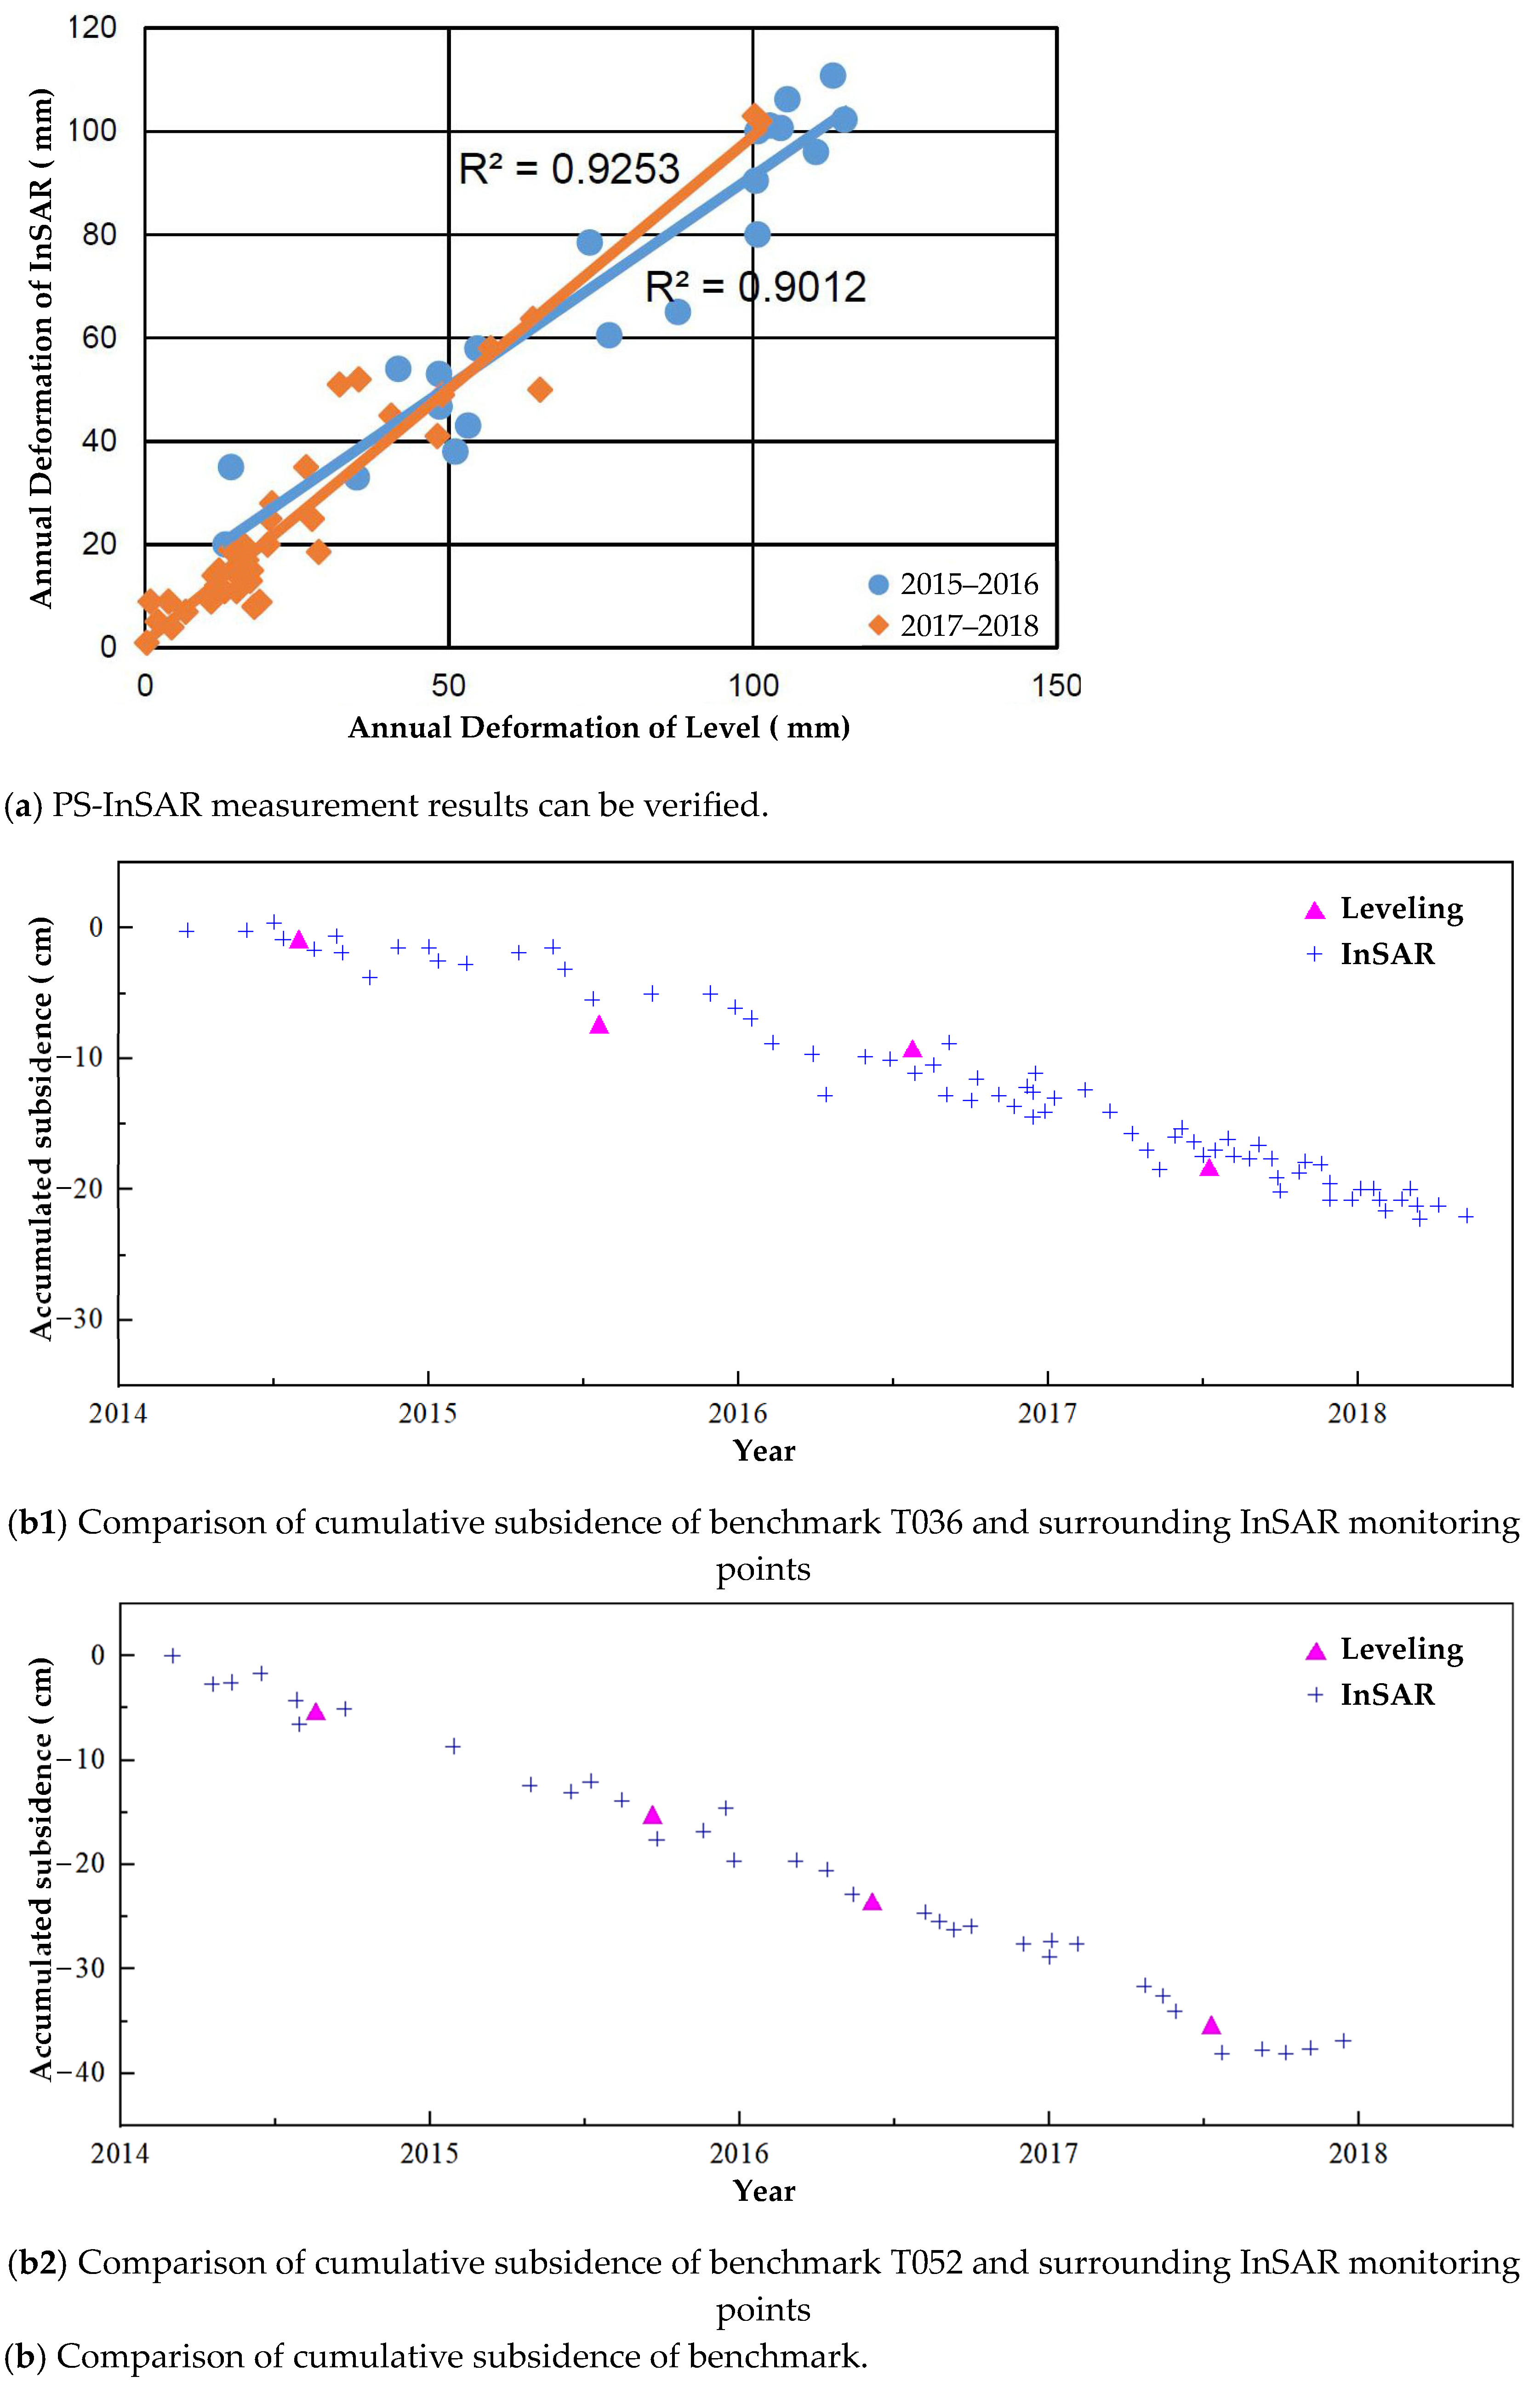
The leveling monitoring data from 2015 to 2016 was used to verify the accuracy of Radarsat2-A results, and it was found that the density of leveling points was lower than that of PS points. Of the 30 leveling points in the subsidence study area, 21 were selected to match with the corresponding PS points. By comparing the accumulated settlement extracted by PS-InSAR measurement with the one produced by leveling measurement, it can be found that their trends were, basically, the same. The settlement center and distribution trend of PS-InSAR was well matched to the leveling measurement of R2 = 0.9012, as shown in Figure 7.
39 were selected from 50 benchmarks in 2017–2018 to verify the accuracy of Sentinel-1 results. The accumulated settlement of Sentinel-1 in 2017–2018 is compared with the level monitoring value, and the error is shown in Figure 7. The R2 is 0.9253, which shows that the PS-InSAR monitoring results are in good agreement with the leveling values.
Figure 7 shows that PS InSAR can obtain high-precision regional surface deformation information. In order to verify the non-typicality of precision inspection, the benchmark is taken as the reference standard, the mean value of subsidence observation results of all interference coherent points within 100 m from the benchmark is selected as the subsidence estimation value of the point, and the leveling observation value is taken as the true value. InSAR estimation results near the benchmark.
The time series deformation estimated by InSAR is characteristic of obvious disturbance, but due to the low sampling frequency of leveling observation verification data, this phenomenon cannot be observed. It also indirectly proves that InSAR technology can obtain surface deformation information with higher spatiotemporal resolution compared to traditional leveling observation methods.
3.2.2. Cross Validation
Due to the existence of partial overlap between Radarsat2-A and Radarsat2-B products, 5565 points in the overlapping area were selected to compare the accumulated settlement. The relationship between the two measurements is proved to be positive by R2 = 0.8832 in Figure 8.
3.3. Gridding
According to the study by Yu and his colleagues in 2020, we chose a grid of 1 km × 1 km to resample PS points and groundwater data from 2012–2018. There are three reasons why an excessively large area should avoid being selected. Firstly, it is good for the better expression of the spatial heterogeneity of groundwater on land subsidence. Secondly, the central area of the land subsidence in Tianjin is quite focused. Thirdly, the requirements of GWR model for data volume is strict. Therefore, although the built grid scope is 1 km × 1 km from the grid of risk prediction, the scope is different (Figure 6 and Figure 9).
3.4. GWR Result and Test
The priority-degree of the GWR model has been analyzed from AICc, bandwidth, and adjusted R-squared. The deviation of the large regression parameter is too large, and the bandwidth is too small, which will cause the variance of the regression parameter estimation to be too large. The AICc of the model is 54,239.2326, R-squared 0.8651, and the adjusted R-squared 0.8621. The optimal bandwidth is 141.2533 based on Gauss function and AICC minimum principle. According to the principle that the smaller the bandwidth, and the closer to 1 is the adjusted R-squared, the more reliable is the result, the GWR model can express 86.21% of the spatial heterogeneity of ground water and land subsidence. Each grid has a specific regression coefficient in the calculation results of the GWR model. The spatial heterogeneity of each explanatory variable on the settlement has been analyzed.
3.5. Coastal Land Use in Tianjin
Based on 2018 Landsat-8 data, the land-use information in the study area has been extracted by using the maximum-likelihood classification method (Figure 10). The land features are divided into five categories: cultivated land, vegetation, construction land, water body, and salt field. The samples are classified at the basis of a large number of random sample selections. The samples are divided into two kinds, one is the training sample and the other is the test sample. Training samples are used for feature extraction, and test samples are used for accuracy verification. The overall accuracy of classification reaches 93.55%. In the coastal areas of Tianjin, cultivated land accounts for 60.24%, construction land for 29.45%, area for salt drying for 1.3%, water area for 6.86%, and vegetation area for 2.15%.
4. Discussion
4.1. Spatial Heterogeneity Characteristics of Subsidence Caused by Different Aquifer Level Changes
The GWR model of water-level change and land subsidence in Tianjin from 2012 to 2018 has been established. The results of the model are to achieve a set of grids with different coefficient attributes. By analyzing the positive and negative values of each grid coefficient, the spatial heterogeneity of the influence of different aquifers on the ground settlement can be judged. After the standardization of statistical data, the upper quartile and lower quartile of the correlation coefficient are divided into four segments from 0–1: −1–0.3 is negative (−−) correlation, −0.3–0 is sub negative (−) correlation, 0–0.3 is sub positive (+), and 0.3–1 is positive (++). The focus of the relevance investigation is in the central area of subsidence and coastal areas (Table 2).
As can be seen from Figure 11a, the coefficient of UA was only distributed in a small part of clusters with positive high value in the middle, while other regions were all negative. Compared with the settlement center area, UA in all settlement center areas can be found negative. The results above show that there is no positive correlation between the change of UA and the settlement of Tianjin settlement center.
For the SCA (Figure 11b), the positive high value area was distributed in the west of the central part of the study area, and the negative value area in the small part of the center and the north–south edge of the study area. The subsidence in Wuqing had a sub positive correlation with SCA. The land subsidence in Duliu was highly positively correlated with SCA water-level changes. The land subsidence of Yangchengzhuang in Jinghai subsidence area was highly positively correlated with SCA, the land subsidence of Zhongtang town was sub negatively correlated with the change of SCA, and the land subsidence of Wang wenzhuang and Shuangtang was highly negatively correlated with SCA. This shows that the drop in the water-level of SCA increased the settlement of Wuqing subsidence area, Duliu, and Yangchengzhuang, but had no negative impact on the settlement of Zhongtang, Wangwenzhuang, and Shuangtang. By virtue of the statistics of positive correlation (positive correlation + sub positive) coefficient proportion, the SCA positive impact on the settlement area accounted for 78.53%. It is worth noting that there was a sub positive correlation between the subsidence of the Tianjin coastal area and the change of the second confined aquifer. Therefore, the decline of the second confined aquifer had a certain impact on the aggravation of coastal land subsidence.
For the TCA (Figure 11c), there was a positive correlation between land subsidence and TCA in the whole Wuqing subsidence area. The land subsidence of Shuangkou and Hangu was positively correlated with TCA, the land subsidence of Wangqingtuo and Taitou was sub positively correlated with TCA, and the land subsidence of Duliu was sub negatively correlated with TCA. In Jinghai subsidence area, the land subsidence in Yangchengzhuang was highly positively correlated with TCA, the land subsidence in most areas of Wangwenzhuang and Zhongtang was sub positively correlated with TCA, and the land subsidence in Shuangtang and a small part of Wangwenzhuang was sub negatively correlated with TCA. This shows that the water-level drop of TCA could aggravate the settlement of Wuqing District (except Duliu), Yangchengzhuang, Wangwenzhuang, and Zhongtang, but had no negative effect on the settlement of Duliu and Shuangtang. According to area statistics, TCA was the main contributor to settlement. The positive effect (positive correlation + sub positive) of TCA on settlement area accounted for 91.99%. It is noteworthy that there was a positive correlation between land subsidence in coastal areas and the third confined aquifer, and there was a highly positive correlation between Zhaishang and Yingcheng. This indicates that the decline of the third confined aquifer was the biggest factor affecting land subsidence in coastal areas.
In general, the drop in the UA water-level had no significant impact on land subsidence in each settlement area. The land subsidence in Wuqing subsidence area was positively correlated with SCA and TCA, and TCA was highly positively correlated. For Jinghai subsidence area, the land subsidence of Wangqingtuo and Taitou was mainly affected by the second confined aquifer and the third confined aquifer, and the land subsidence of Duliu was highly positively correlated with SCA. The land subsidence of Shuangtang settlement center was negatively correlated with the change of groundwater level.
4.2. Sea-Level Rise (Natural Coastline Receding)
According to the estimate of the Intergovernmental Panel on Climate Change (IPCC), together with the regional reality, the sea-level rise rate of the Bohai Sea is, theoretically, predicted to be about 4.5 mm/a by 2030. However, in terms of the 2017 China Sea Level Bulletin, the overall sea-level of Chinese coastal areas in the past 40 years has been rising, with an average rise rate of 3.3 mm/a. The sea-level height data (Sea Surface Height Products) of the Bohai Sea, obtained by AVISO+, is 3.2 mm/a, which is consistent with the data from the China Sea Level Bulletin. By superimposing the interannual sea-level change data obtained by AVISO+ with the annual land subsidence, the interannual sea-level change has been obtained. According to the research results of Sentinel-1 from 2016 to 2018, the average land subsidence in the Tianjin coastal area is 16 mm. Therefore, the relative sea-level rise in the Tianjin area is about 19.2 mm/a. Based on the relative sea-level rise rate and the elevation data, the regressive area of natural coastline of Tianjin is estimated for 5 to 20 years, and the results are shown in the figure. It is estimated from Figure 12 that five years later, coastal land in Zhaishang Street, Yingcheng Street, Beitang Street, Binhai New District, etc. will be confronted with risks of coastline retreat and inundation. The retreat area is about 445 km2. 20 years later, the retreat of Dagu Street and Yingcheng Street will deteriorate, and the retreat area will be about 509 km2. Through calculation, it can be concluded that the inundated area of Tianjin will be quite amazing in the coming 5 to 20 years due to the superposition of land subsidence and sea-level rise.
By carefully comparing the Landsat images of 2003 and 2018, it can be found that most of the submerged areas were natural sea areas in 2003. In the stack estimation, the data used are natural elevation, and the factors of reclaiming land from the sea are not con sidered, so the result of inundation area is amazing (Figure 13). As of 2018, the total reclamation area was 278.5 km2, and the existing natural coastline length in Tianjin was only 7.75 km, accounting for 5.06% of the total coastline length. In the future, Tianjin will prohibit the development and construction of the existing natural shoreline that may change the nature of the natural shoreline, increase the ecological protection and restoration of coastal beaches, conduct pilot ecological restoration of the artificial shoreline, and promote the construction of the coastal shelterbelt. In addition, Tianjin is located along the coast of Bohai Sea, with a coastline of 155 km. The seawall is a kind of dike engineering built to prevent the damage of storm surge, flood, and wave to the protection area. According to information we found, Tianjin seawall includes Hangu section, Tanggu section, and Dagang section, with lengths of 30.614 km, 80.749 km, and 28.257 km, respectively. The total length of the seawall is 139.62 km. It is the first line of damp-proof barrier of the Tianjin coastline. The seawall protects in the direction of the sea and in the direction of the back sea, and the top of the seawall. In fact, it is estimated that there will be inundation risk at Zhaishang Street, Yingcheng Street, Beitang Street and other areas in five years. The inundation area is about 28 km2, and will increase to 87 km2 in 20 years.
By superimposing the status quo of the land classification, it can be found that the inundated areas are mostly concentrated in coastal construction facilities and water areas. It can be inferred that the direct risk of the relative sea-level rise to urban security in Tianjin in the next 5–20 years is the loss of coastal freshwater and the destruction, or even submergence, of construction facilities. It is worth mentioning that the coastal construction of seawall and other important facilities in Tianjin directly reduces the risk of the sea-level rise.
4.3. Urban Safety Risk Assessment Using XGBoost
4.3.1. Establishment of the XGBoost Model
This study, by means of XGBoost, has comprehensively analyzed multiple influencing factors after pretreatment, selected the optimal combination of influencing factors, and determined the weight of each influencing factor. In machine-learning algorithms, different features of eigenvectors usually have different dimensionality and dimensionality units. Therefore, the data need to be cleaned, which has a significant impact on the results of data analysis. In order to solve the influence of different dimensions on the model, some features need to be standardized, or normalized, so that different features can be compared. After standardization, each feature has the same magnitude, which is conducive to the training and comprehensive evaluation of the model.
Feature selection steps of XGBoost are as follows:
- Z-score is used to standardize the original data, which is aimed at making the data more standardized and facilitating the convergence of training;
- The data set is divided randomly, of which 70% are training set and 30% are test set;
- The XGBoost integration algorithm is used to train the data, and the parameters are defined as base_score = 0.5, colsample_bytree = 1, learning_rate = 0.300000012, max_delta_step = 0, max_depth = 6, min_child_weight = 1, random_state = 0, reg_alpha = 0, validate_parameters = 1, and verbosity = None;
- By adopting the method of random segmentation, test the data of the test machine, compare the curve of the predicted value with the actual curve, and calculate the average relative error of the test set to evaluate the accuracy of the model, so that the training model can achieve a high accuracy in the predicted results of the test set. It can be seen from Figure 14 that the predicted results are basically consistent with the reality, with a fitting degree of 0.85, MSE = 10.1791, and MAE = 2.2116. The verification results are consistent with the research results using similar algorithms;
- Obtain the importance of features according to the information in the process of model generation, and sort them in descending order according to FScore, as the contribution degree of feature values. Therefore, according to the experimental training, the contribution degree of each characteristic variable to the model has been obtained, and the order of importance of characteristic factors is shown in Figure 14.
4.3.2. Urban Safety Evaluation
After obtaining the land-subsidence information of Tianjin coastal areas, this paper takes into consideration the existing urban terrain classification standard and the relative sea-level rise background. By collecting and sorting out the geological background data of the study area, a comprehensive analysis is carried out by using the evaluation factors such as land subsidence, groundwater level change of each layer, land classification status, distance from the sea and elevation, etc. By combining with the XGBoost model, the urban safety and risk area of Tianjin is reasonably divided. The upper quartile and the lower quartile are used to divide the risk into three equal parts, and the study area is divided into the high-risk part, the medium-risk part, and the low-risk part, in descending order. It can be seen in Figure 15 that the area of high-risk areas for urban safety is relatively small, accounting for 19.93% of the study area.
The high-risk urban areas are the coastal areas which include Wangqingtuo, Duliu, Taitou, Dafengdui, Wangwenzhuang, Shuangtang, Chengguantun, Zhongtang, Yingcheng and Dagu streets. The medium-risk areas include Tangguantun, Liangtou, Beidagang Farm, and most coastal areas of Tianjin, and the remaining areas are low-risk areas.
By superimposing the urban safety results on the ground subsidence and the groundwater funnel area, it can be found that the high-risk areas of urban safety are highly consistent with the central areas of ground subsidence. The risk areas are inconsistent with the distribution of the second-layer confined water funnel, and the distribution of the third confined water funnel is consistent with medium-risk and high-risk areas, such as Zhaishang and Wangwenzhuang. According to the FScore importance ranking in Figure 16, land subsidence, the third layer of confined water-level changes, and the distance from the sea rank the top three. It can be seen that land subsidence is the most important factor among all influencing factors. Secondly, changes in groundwater level also have a certain impact on the urban safety. For example, there are underground water funnels in the region, the expansion of whose area and the deepening of whose depth will all adversely affect urban development. Furthermore, the excessive exploitation of ground water and a sharp drop in groundwater level can not only lead to land subsidence, but also disrupt the balance of brackish and freshwater, and even cause seawater intrusion. Finally, it is the distance between Tianjin and the coastline that determines whether there will be coastal disasters, such as storm surge, low-lying floods, and seawater intrusion. Because the relative sea-level rise can induce tidal flat wetlands and lowlands to be flooded, this will also weaken the wave elimination and erosion resistance of the beach surface. Furthermore, various water-conservancy projects, such as ports, seawalls, and culvert gates, will be affected, causing huge losses.
With the rapid development of economic construction in the coastal area of Tianjin, it is predicted that the problem of land subsidence in the coastal area will continue to exist in the future because a large amount of ground water will still be exploited in future urban construction. Especially, the overall risk of Tianjin coastal zone is high due to local fragile geological conditions and human activities. Therefore, it is suggested that the prevention and the control of land subsidence should be transformed from passive defense to active prevention and control, and reasonable prevention and control policies in line with the local land-subsidence development status and socio-economic development trend should be formulated to strengthen the anti-risk ability of Tianjin coastal areas.
5. Conclusions
Based on the data of Radarsat-2 from 2012 to 2016 and Sentinel-1 from 2016 to 2018, this paper by means of PS-InSAR has studied the variation characteristics of land subsidence in Tianjin, and quantitatively analyzed the influencing factors of ground water and its spatial non-stability. Moreover, the effects of the relative sea-level rise have been analyzed from the perspective of earth system science through the superimposition of coastal land subsidence monitoring data and sea-level rise observation data. Finally, with the XGBoost machine-learning method, the urban security risks in Tianjin have been assessed through the selection of land-use status, groundwater level change, land subsidence, and other features.
It is found in this paper that GWR plays a good role in the spatial correlation analysis of multi-factors. In future research, conditions should be considered such as increasing dynamic and static loads as well as the thickness of compressible layers. It is beneficial to comprehensively study the factors affecting land subsidence and explore the driving effect of compressible layers on land subsidence. Meanwhile, this can also contribute to a more in-depth and detailed analysis on the cause mechanism of land subsidence. Based on the fact that in the XGBoost evaluation model, the impact factors are not comprehensive enough because of data sources and standardization problems, in the future, the surface runoff and some topographic factors should be considered to be added (slope and aspect).
Land subsidence is a delayed geological phenomenon. In view of the continuous progress of land subsidence in the coastal area of Tianjin, it is suggested that a land-subsidence monitoring network in the coastal area should be established, and improved, as soon as possible. The network should be composed of GPS, stratification standards, a groundwater dynamic monitoring network as well as a land-subsidence monitoring center to keep track of the progress of land subsidence. In the future, the impact of relative sea-level rise should be taken as an important indicator and incorporated into disaster-prevention and -control plans, and land-use plans in coastal areas. Besides this, a land–sea integrated monitoring and evaluation system should also be established.
Author Contributions
Conceptualization, H.G.; methodology, B.C.; software, H.Y.; validation, H.Y.; resources, H.Y.; data curation, H.Y.; writing—original draft preparation, H.Y.; writing—review and editing, H.Y.; visualization, H.Y.; funding acquisition, H.G. All authors have read and agreed to the published version of the manuscript.
Funding
This research was funded by the National Natural Science Foundation of China, grant number 41930109, in part by the National Natural Science Foundation of China, grant number 41771455, in part by Beijing Outstanding Talent Training Foundation, grant number BJJWZYJH01201910028032, in part by Beijing Municipal Natural Science Foundation, grant number 8182013.
Data Availability Statement
Not applicable.
Acknowledgments
The authors would like to thank the anonymous referees for their suggestions and comments.
Conflicts of Interest
The authors declare no conflict of interest.
References
- Meehl, G.A.; Hu, A.; Tebaldi, C.; Arblaster, J.M.; Washington, W.M.; Teng, H.; Sanderson, B.M.; Ault, T.; Strand, W.G.; White, J.B. Relative outcomes of climate change mitigation related to global temperature versus sea-level rise. Nat. Clim. Chang. 2012, 2, 576–580. [Google Scholar] [CrossRef]
- Vousdoukas, M.I.; Mentaschi, L.; Voukouvalas, E.; Verlaan, M.; Jevrejeva, S.; Jackson, L.P.; Feyen, L. Global probabilistic projections of extreme sea levels show intensification of coastal flood hazard. Nat. Commun. 2018, 9, 2360. [Google Scholar] [CrossRef] [PubMed] [Green Version]
- Dang, T.D.; Cochrane, T.A.; Arias, M.E.; Tri, V.P.D. Future hydrological alterations in the Mekong Delta under the impact of water resources development, land subsidence and sea level rise. J. Hydrol. Reg. Stud. 2018, 15, 119–133. [Google Scholar] [CrossRef]
- Schmitt, R.J.P.; Rubin, Z.; Kondolf, G.M. Losing ground—Scenarios of land loss as consequence of shifting sediment budgets in the Mekong Delta. Geomorphology 2017, 294, 58–69. [Google Scholar] [CrossRef]
- Van Asselen, S.; Erkens, G.; Stouthamer, E.; Woolderink, H.A.G.; Geeraert, R.E.E.; Hefting, M.M. The relative contribution of peat compaction and oxidation to subsidence in built-up areas in the Rhine-Meuse delta, The Netherlands. Sci. Total Environ. 2018, 636, 177–191. [Google Scholar] [CrossRef]
- Erten, E.; Rossi, C. The worsening impacts of land reclamation assessed with Sentinel-1: The Rize (Turkey) test case. Int. J. Appl. Earth Obs. Geoinf. 2019, 74, 57–64. [Google Scholar] [CrossRef]
- Cole, G.; Gray, D.A. The East Coast and London tidal flood warning systems. Philos. Trans. R. Soc. 1972, 272, 173–178. [Google Scholar]
- Miller, K.; Sugarman, P.; Browning, J.; Horton, B.; Stanley, A.; Kahn, A.; Uptegrove, J.; Aucott, M. Sea-level rise in New Jersey over the past 5000 years: Implications to anthropogenic changes. Glob. Planet. Chang. 2009, 66, 10–18. [Google Scholar] [CrossRef]
- Sun, H.; Grandstaff, D.; Shagam, R. Land subsidence due to groundwater withdrawal: Potential damage of subsidence and sea level rise in southern New Jersey, USA. Environ. Geol. 1999, 37, 290–296. [Google Scholar] [CrossRef]
- Mazzotti, S.; Lambert, A.; Kooij, M.V.D.; Mainville, A.J.G. Impact of anthropogenic subsidence on relative sea-level rise in the Fraser River delta. Geology 2009, 37, 771–774. [Google Scholar] [CrossRef]
- Mazzotti, S.; Lambert, T.; Kooij, M.; Mainville, A. Coastal subsidence and relative sea-level rise in the Fraser River delta, Greater Vancouver, BC, from a combined CTM-InSAR, GPS, leveling, and tide gauge analysis. In Proceedings of the AGU Fall Meeting, San Francisco, CA, USA, 12–16 December 2006; p. 1263. [Google Scholar]
- Sun, L.; Wei, L.; Li, C. Impacts of Superposition of Sea Level Rise and Land Subsidence on Coastal Region in Zhejiang Province. J. Geol. Hazards Environ. Preserv. 2010, 21, 69–72. [Google Scholar]
- Hu, J.; Meng, A. Relative Sea Level Rise and Land Subsidence in Tianjin. Ocean Inf. 2005, 2, 17–19. [Google Scholar]
- Abidin, H.Z.; Andreas, H.; Gamal, M.; Gumilar, I.; Napitupulu, M.; Fukuda, Y.; Deguchi, T.; Maruyama, Y.; Riawan, E. Land subsidence characteristics of the Jakarta basin (Indonesia) and its relation with groundwater extraction and sea level rise. Groundw. Response Chang. Clim. 2010, 16, 113–130. [Google Scholar]
- Abidin, H.Z.; Andreas, H.; Gumilar, I.; Fukuda, Y.; Pohan, Y.; Deguchi, T. Land subsidence of Jakarta (Indonesia) and its relation with urban development. Nat. Hazard 2011, 59, 1753–1771. [Google Scholar] [CrossRef]
- Abidin, H.Z.; Andreas, H.; Gumilar, I.; Wibowo, I.R.R. On correlation between urban development, land subsidence and flooding phenomena in Jakarta. IAHS-AISH Proc. Rep. 2015, 370, 15–20. [Google Scholar] [CrossRef] [Green Version]
- Li, X.; Duan, X.; Zhang, Z.; Wang, H.; Liu, K. The Vulnerability Zoning Research on the Sea Level Rise of Chinese Coastal. J. Catastrophol. 2016, 31, 103–109. [Google Scholar]
- Xie, C.; Xu, S.; Hu, B.; Wang, J. Assessment of Land Subsidence Influence on Storm Surge Risk in Tianjin Binhai Area. World Reg. Stud. 2009, 18, 126–133. [Google Scholar]
- Gong, S.; Kong, X.; Liu, D.; Qiu, F.; Chang, J. An approach for predicting shield construction ground surface settlement of complex stratum using dynamical strata identification. Chin. J. Sci. Instrum. 2019, 40, 228–236. [Google Scholar]
- Lin, B.; Liu, X.; Yang, C.; Yin, H. Avalanche Susceptibility Assessment of Highway Based on XGBoost Machine Learning Model and GIS Method. Highway 2020, 65, 20–26. [Google Scholar]
- Chen, T.; Guestrin, C. XGBoost: A Scalable Tree Boosting System. In Proceedings of the 22nd ACM SIGKDD International Conference on Knowledge Discovery and Data Mining, San Francisco, CA, USA, 13–17 August 2016; pp. 785–794. [Google Scholar]
- Zhao, T.; Zheng, S.; Li, W.; Liu, K. A Study of the Credit Risk Analysis Based on XGBoost. Softw. Eng. 2018, 21, 29–32. [Google Scholar]
- Wang, Y.; Zhang, L.; Ge, D.; Zhang, X.; Li, M. Experimental study of vertical and horizontal displacement retrieval by joint analysis of ascending and descending PSInSAR data. Remote Sens. Land Resour. 2014, 26, 97–102. [Google Scholar]
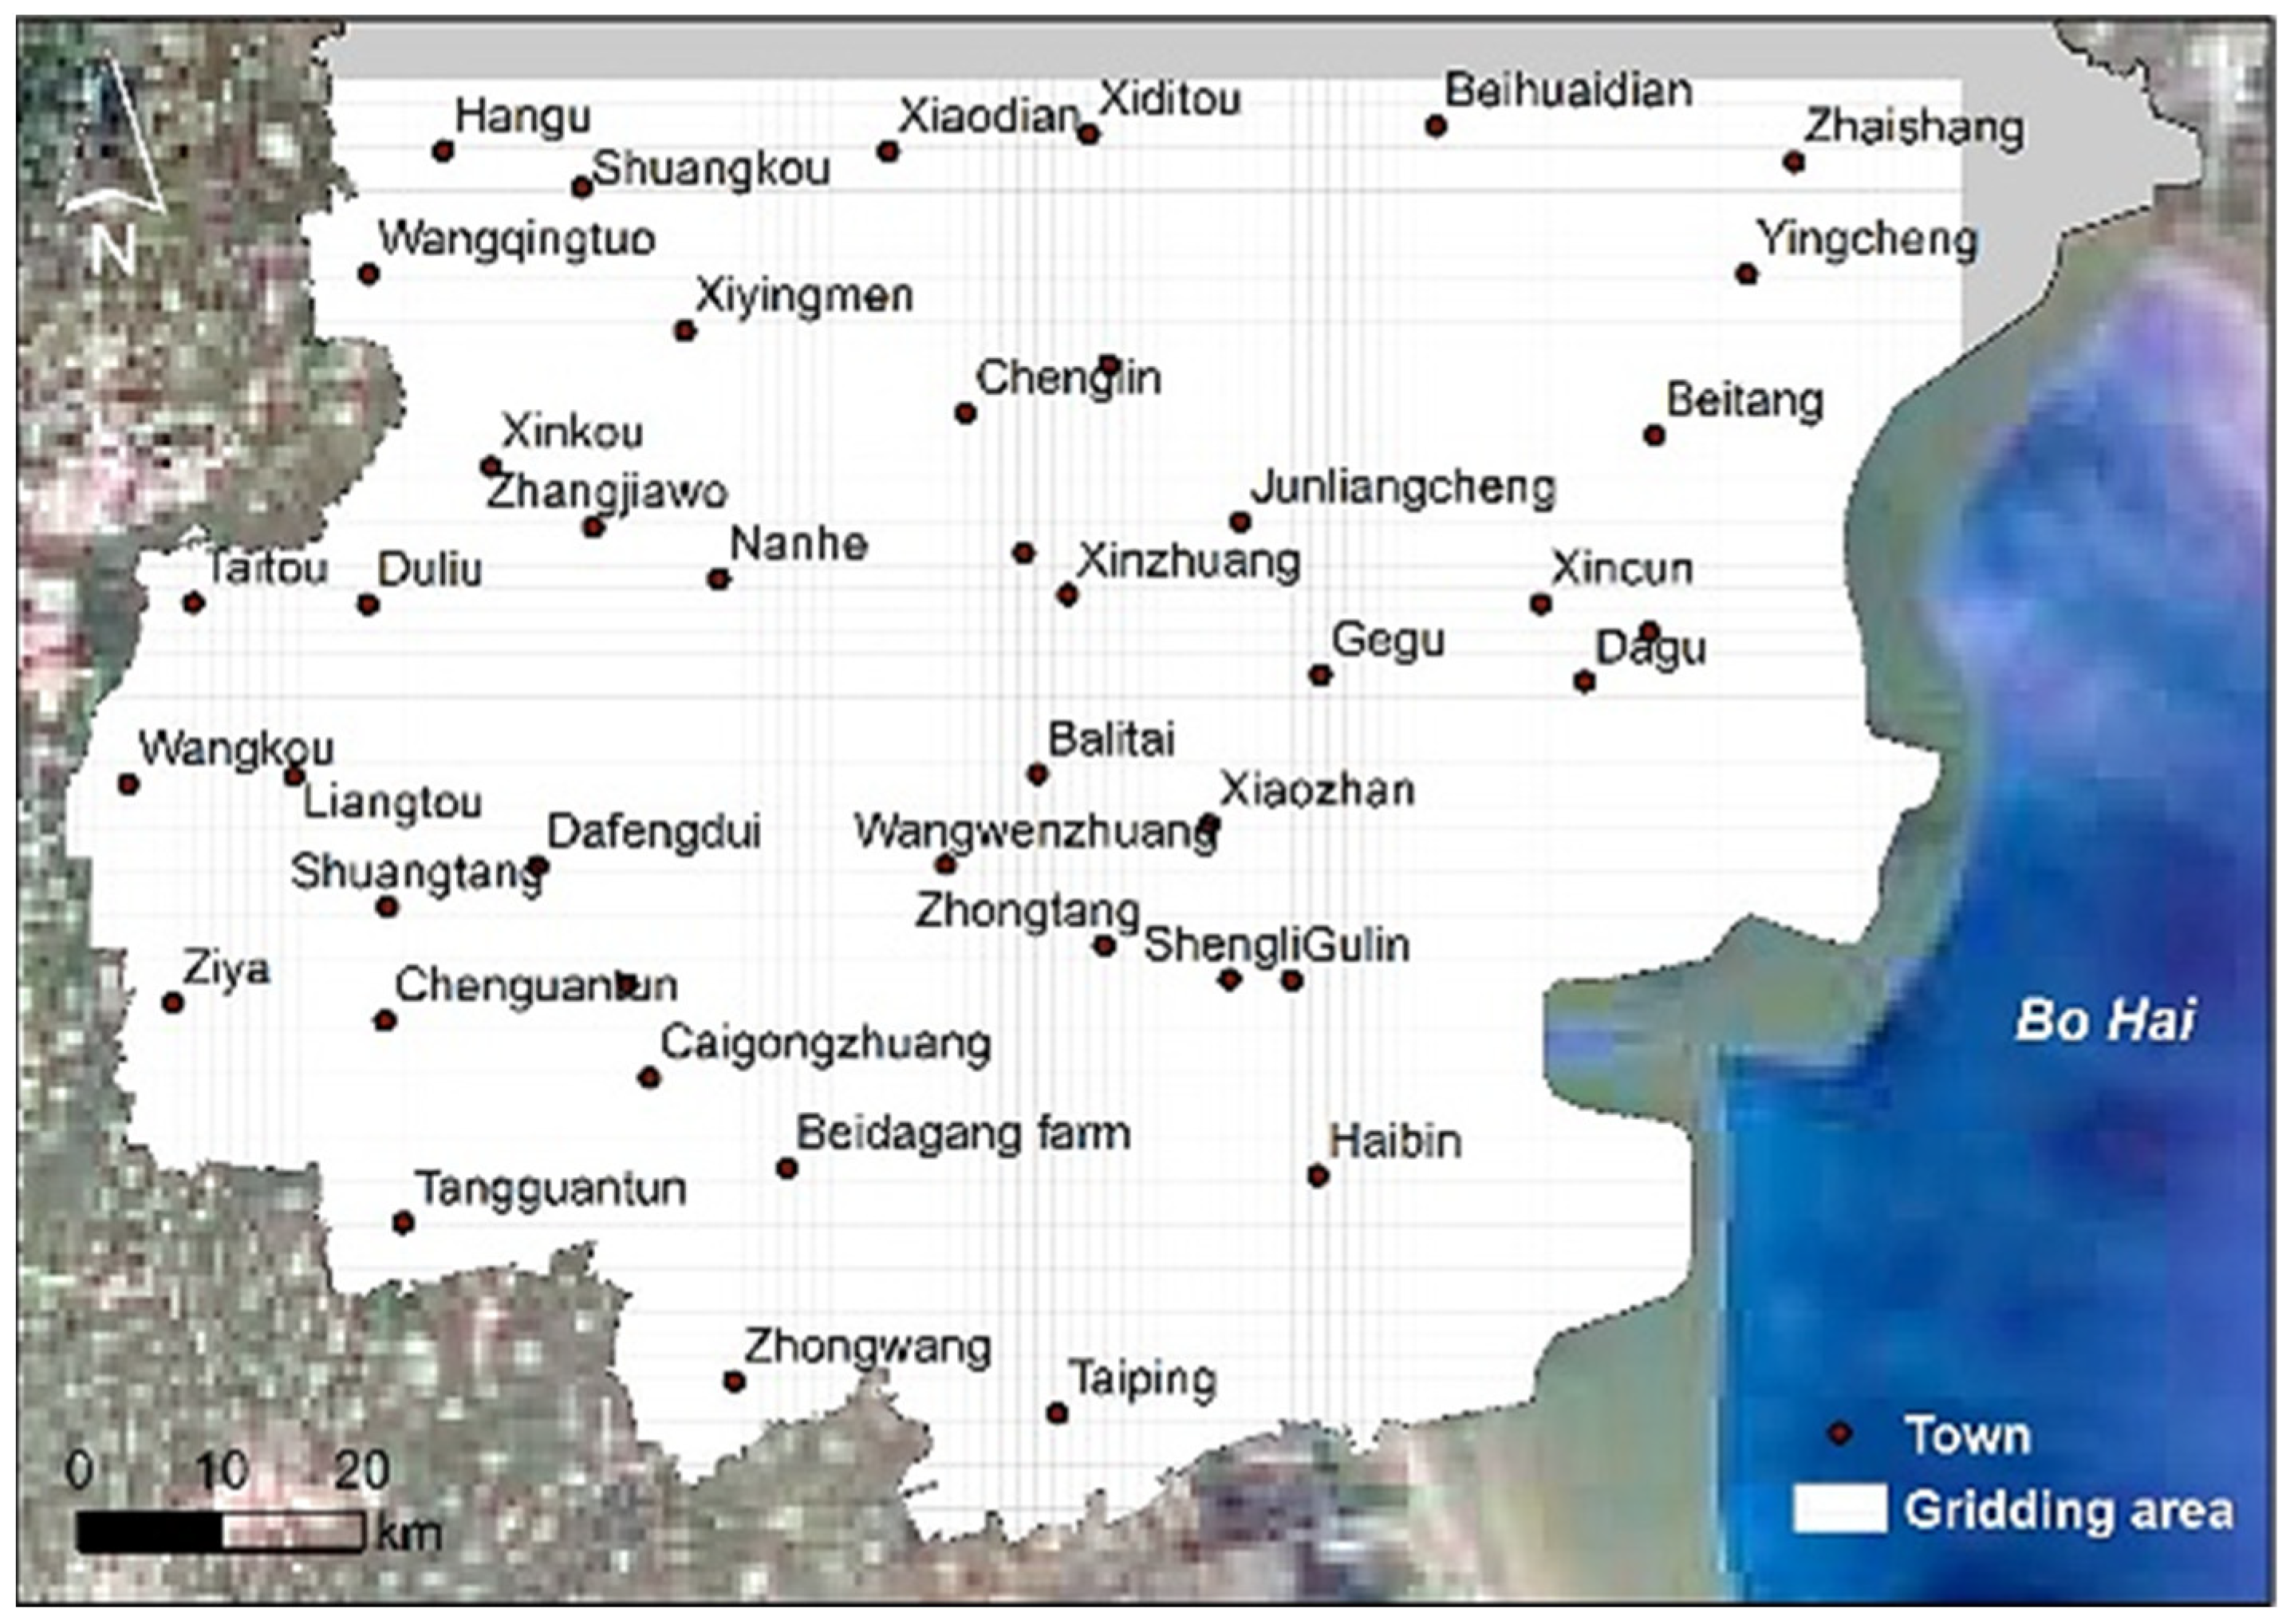
Figure 1.
The location of typical Tianjin and the coverage of synthetic aperture radar (SAR) images. The background is the boundary of the salt and freshwater areas in Tianjin.
Figure 1.
The location of typical Tianjin and the coverage of synthetic aperture radar (SAR) images. The background is the boundary of the salt and freshwater areas in Tianjin.

Figure 2.
The contours of cumulative water-level change of ground water in each layer from 2012 to 2018. The background is the salt- and freshwater divisions of Tianjin.
Figure 2.
The contours of cumulative water-level change of ground water in each layer from 2012 to 2018. The background is the salt- and freshwater divisions of Tianjin.

Figure 3.
Analysis flow chart of the land subsidence and the sea-level rise in Tianjin coastal areas.
Figure 3.
Analysis flow chart of the land subsidence and the sea-level rise in Tianjin coastal areas.

Figure 4.
Distribution of accumulated settlement in Tianjin from 2012 to 2016 (the red circles were the centers of two subsidence areas).
Figure 4.
Distribution of accumulated settlement in Tianjin from 2012 to 2016 (the red circles were the centers of two subsidence areas).

Figure 5.
Distribution of accumulated settlement in Tianjin from 2016 to 2018 (the red circles were the center of two subsidence areas).
Figure 5.
Distribution of accumulated settlement in Tianjin from 2016 to 2018 (the red circles were the center of two subsidence areas).

Figure 6.
Gridding of 1 km × 1 km for GWR.

Figure 7.
Comparison of the leveling deformation and the annual deformation of InSAR. (a) PS-InSAR measurement results can be verified. (b) Comparison of cumulative subsidence of benchmark. The red triangle is the leveling observation, and the blue cross is the InSAR observation.
Figure 7.
Comparison of the leveling deformation and the annual deformation of InSAR. (a) PS-InSAR measurement results can be verified. (b) Comparison of cumulative subsidence of benchmark. The red triangle is the leveling observation, and the blue cross is the InSAR observation.

Figure 8.
Comparison of the annual deformation derived from Radarsat2-A and Radarsat2-B.

Figure 9.
Gridding of 1 km × 1 km in order to analyze the superposition of the land subsidence and the sea-level rise.
Figure 9.
Gridding of 1 km × 1 km in order to analyze the superposition of the land subsidence and the sea-level rise.

Figure 10.
Current situation of the land use in the plains area of Tianjin.

Figure 11.
Spatial heterogeneity of the correlation between ground water and land subsidence. (a–c) Spatial distribution of UA\SCA\TCA regression coefficients.
Figure 11.
Spatial heterogeneity of the correlation between ground water and land subsidence. (a–c) Spatial distribution of UA\SCA\TCA regression coefficients.

Figure 12.
Under the superimposed action, the inundated area of the Tianjin coastal area.

Figure 13.
Comparison of Tianjin Coastal satellite images in 2003 and 2018.

Figure 14.
XGBoost Regression curve.

Figure 15.
Superimposing the urban safety results on land subsidence, on the underground funnel (SCA), and on the groundwater funnel (TCA).
Figure 15.
Superimposing the urban safety results on land subsidence, on the underground funnel (SCA), and on the groundwater funnel (TCA).

Figure 16.
Importance ranking of factors affecting urban safety.


Table 1.
Groundwater-monitoring layers.
| North Freshwater Area | Southern Saltwater Area | |||
|---|---|---|---|---|
| Groundwater-monitoring layers | Buried depth of groundwater level | Lithology | Buried depth of groundwater level | Lithology |
| UA | 6–20 m | Alluvial proluvial medium coarse sand, medium fine sand, and fine sand | 15–30 m | Fine sand, silty sand |
| SCA | 30 m | Sand gravel, medium coarse sand | 180–230 m | Medium fine sand, silty sand |
| TCA | - | - | 260–340 m | Medium fine sand, silty sand |
Table 2.
Correlation between ground water and land subsidence.
| UA | SCA | TCA | ||
|---|---|---|---|---|
| Wangqingtuo | −− | + | +/++ | |
| Taitou | −− | + | + | |
| Wangwenzhuang | −− | ++ | +/− | |
| Duliu | −− | ++ | − | |
| Shuangtang | −− | −− | − | |
| Zhongtang | −− | − | + | |
Disclaimer/Publisher’s Note: The statements, opinions and data contained in all publications are solely those of the individual author(s) and contributor(s) and not of MDPI and/or the editor(s). MDPI and/or the editor(s) disclaim responsibility for any injury to people or property resulting from any ideas, methods, instructions or products referred to in the content. |
© 2023 by the authors. Licensee MDPI, Basel, Switzerland. This article is an open access article distributed under the terms and conditions of the Creative Commons Attribution (CC BY) license (https://creativecommons.org/licenses/by/4.0/).
Share and Cite
MDPI and ACS Style
Yu, H.; Gong, H.; Chen, B. Analysis of the Superposition Effect of Land Subsidence and Sea-Level Rise in the Tianjin Coastal Area and Its Emerging Risks. Remote Sens. 2023, 15, 3341. https://0-doi-org.brum.beds.ac.uk/10.3390/rs15133341
AMA Style
Yu H, Gong H, Chen B. Analysis of the Superposition Effect of Land Subsidence and Sea-Level Rise in the Tianjin Coastal Area and Its Emerging Risks. Remote Sensing. 2023; 15(13):3341. https://0-doi-org.brum.beds.ac.uk/10.3390/rs15133341
Chicago/Turabian StyleYu, Hairuo, Huili Gong, and Beibei Chen. 2023. "Analysis of the Superposition Effect of Land Subsidence and Sea-Level Rise in the Tianjin Coastal Area and Its Emerging Risks" Remote Sensing 15, no. 13: 3341. https://0-doi-org.brum.beds.ac.uk/10.3390/rs15133341
Note that from the first issue of 2016, this journal uses article numbers instead of page numbers. See further details here.