
UAV-Based Quantification of Dynamic Lahar Channel Morphology at Volcán de Fuego, Guatemala

1
Department of Geosciences, Boise State University, Boise, ID 83725, USA
2
Independent Researcher, Guatemala City 01013, Guatemala
3
Department of Geological and Mining Engineering and Science, Michigan Technological University, Houghton, MI 49931, USA
4
Instituto Nacional de Sismología, Vulcanologia, Meteorologia e Hidrología (INSIVUMEH), Guatemala City 01013, Guatemala
*
Author to whom correspondence should be addressed.
Remote Sens. 2023, 15(15), 3713; https://0-doi-org.brum.beds.ac.uk/10.3390/rs15153713
Submission received: 27 May 2023
/
Revised: 6 July 2023
/
Accepted: 17 July 2023
/
Published: 25 July 2023
(This article belongs to the Section Remote Sensing in Geology, Geomorphology and Hydrology)
Abstract
:This study quantified erosional and depositional processes for secondary lahars in Las Lajas drainage at Volcán de Fuego, Guatemala, during the rainy season from May to October 2021. Abundant pyroclastic material from ongoing eruptive activity is remobilized seasonally during heavy precipitation, which can impact infrastructure and populations living near Fuego. Our region of focus was in an agricultural zone 6 to 10 km from the summit, surveyed with an unoccupied aerial vehicle (UAV) quadcopter at monthly intervals. Imagery was processed into overlapping time-lapse structure from motion digital elevation models (DEMs). DEMs were differenced to find volumetric changes as a function of the channel flow path distance (quantified in 500 m sections) to track channel morphology changes over time. The largest measured volume changes were a 490 m3/day loss in the upper section (~6 km from summit) and a 440 m3/day gain in the lower sections (~10 km from summit). We discussed how the natural channel’s constriction and widening of Las Lajas in more distal sections control the behavior and stability of the stream evolution. Above the constriction, the channel is primarily downcutting and meandering within an old flood plain, which had been filled in by pyroclastic materials deposited by the June 2018 paroxysm.
1. Introduction
Volcán de Fuego (14.473°N, 90.88°W) is a 3800 m open vent stratovolcano with 3000 m of local relief located in central Guatemala. Fuego actively produces pyroclastic material during small Strombolian eruptions with varying frequency up to tens of times per hour [1] depositing material ranging from ash-sized to bombs and blocks on the upper slopes. The current style of activity, including occasional larger paroxysms producing pyroclastic currents (PCs) has been continuous since May of 1999, but Fuego has been intermittently erupting for centuries. Fuego’s usual mode of Strombolian activity is punctuated with larger paroxysmal events including 50 eruptions with a Volcanic Explosivity Index (VEI) ≥ 2 since 1524 [2]. These larger events produce PCs [3], which fill drainages radiating from the volcano with hot debris easily mobilized during the rainy season. Our study site, Las Lajas drainage, was filled in during a series of PCs in June of 2018 including one flow, which jumped the bank of the channel and devastated the village of San Miguel Los Lotes, killing many and burying the structures in hot rock [3]. The estimated volume deposited in this series of PCs was 15.1 ± 4.2 × 10⁶ m3 [4]. The majority of the material originated from the bulking and subsequent erosion of pyroclastic material at the top of Las Lajas near the vent. This led to increased mobility, allowing the PC to travel much farther than earlier events in the series, reaching 12 km from the summit [4].
Lahars are slurries of mud and debris common at Fuego and other volcanoes. They are analogous to debris flows except that they occur on the flanks of volcanoes and transport primarily volcanic material. Lahars account for about 25% of the volcano-related deaths since 1500 AD, second only to pyroclastic currents (PCs) [5]. Most infamously, a primary lahar, induced by an eruption in 1985 at Nevado del Ruiz, Colombia, resulted in 28,000 deaths in the City of Armero [6]. Smaller secondary lahars, induced by rainfall rather than eruption, are a much more common and persistent hazard at many volcanoes. Lahars are particularly dangerous because they do not require an eruption trigger. Many years after eruptive activity has ended, secondary lahars still present hazards controlled by the local weather. In October of 1998, for instance, Casita volcano in Nicaragua, which has no historic record of eruptions, was hit by a hurricane that caused an avalanche and lahars which killed an estimated 1600 people [7].
Secondary lahars are generally characterized by a bouldery snout followed by a watery tail [5,8]. These events may be very common due to erosional activity caused by rainfall remobilizing pyroclastic materials [9,10]. Lahars at Volcán de Fuego, featured in this study, commonly incise deep channels that can be over 100 m deep in places with steep and unstable walls. Lahars can quickly erode such walls and bulk up creating hazards that are extremely dangerous and destructive near to a drainage as well as in fluvial fans far from the volcano [10]. They can be an especially significant threat to populated communities, local infrastructure, and property situated adjacent to these channels. Lahars are capable of forcing boulders and logs against bridges or dams with impact forces of 10 to 1000 tons per square meter [7]. Channel paths are often meandering and dynamic and can erode into farmland and create steep cliffs. Flooding is another concern when lahars pass beyond their confining channels. Structures may be inundated and destroyed due to a shifting or reactivated channel. Road destruction and temporary closures are a common occurrence at Fuego when the activity is high because most vehicular transport crosses channels without bridges. Even small lahars are highly erosive and can undercut banks and bridges. Lahars can also be harmful to infrastructure through deposition. They “freeze” when the flow energy is dissipated enough that the head cannot be pushed forward anymore and the water seeps away, leaving a deposit of condensed sediment and boulders [5]. If that deposit is on or around infrastructure or agricultural lands, removal can be costly. Lahar deposition may divert streams, widen flood plains, and shift meanders forcing land use adaptation [3,11].
Unoccupied aerial vehicles (UAVs) are growing in popularity for use in natural hazard disaster management due to their ever-increasing accessibility and ease of use [12]. Although they are limited in areal coverage and surveys may be impacted by weather conditions, they are versatile, low-cost tools for collecting high-resolution data with short notice [13]. Trends in research concerning rapid onset natural hazards utilizing UAVs under 25 kg have been on the rise since 2014, when the number of journal articles went from 9 or less per year to over 180 by 2020 [12]. UAV use in the geosciences is expanding outside of natural disaster research as well. Many areas of research that have classically involved heavy field mapping with boots on the ground can be streamlined with these tools [12,13,14,15,16,17,18,19,20,21].
Given the rapid morphological changes present in active lahar channels UAV-acquired structure from motion (SfM) repeat 3D mapping of the terrain is a useful and practical tool for the study of both lahar erosion and deposition. SfM has been used to map geomorphic change over time in many studies ranging from volcanic craters to river morphology [14,15,16,19,21]. UAV-acquired data enhanced utility over satellite data for a focused study area because the cost of operation for producing high-resolution maps (spatially and temporally) is relatively low. Such focused mapping can complement higher spatial coverage and lower-resolution satellite-derived topography. Inexpensive, consumer-grade UAVs have been proven to produce quality SfM products at sub-meter resolution [14,15,16,19,20,21]. This permits high accuracy DEM of Difference (DoDs) models. Our study showed the capabilities of SfM DoDs for quantifying the erosional and depositional regimes of a lahar channel over the course of a rainy season.
2. Materials and Methods
2.1. Study Area
This study focused on a particularly active lahar drainage at the active Volcán de Fuego in Guatemala. The region-of-interest (ROI) was a ~3.5 km long zone, with a total surveyed area of approximately 1.6 km2, of the Las Lajas lahar channel on the southeastern flanks of the volcano (Figure 1). This portion of the channel was chosen because it is relatively accessible for repeat field surveys and it regularly experiences lahars that can be monitored by time-lapse cameras and other ground-based geophysical sensors. The ROI was also part of the path impacted by a series of PCs in June of 2018, which lasted 16 h and filled the lahar channel with tens of meters thick deposits. The main phase of the eruption lasted 5 h and destroyed the village of San Miguel Los Lotes and a section of La Reunion Golf Resort [3,10]. Monitoring instrumentation belonging to the Instituto Nacional de Sismología, Vulcanologia, Meteorología e Hidrología (INSIVUMEH) was situated at various locations along the ROI and this permitted timely public notices to be published when a secondary lahar was in progress. Erosion deeply cut the sediments in the drainage and provided a dynamic environment for study. Our four-month study coincided with the Guatemalan rainy season (May through October) when secondary lahar activity was common, occurring, on average, about once per week in Las Lajas.
2.2. Data Collection
SfM made use of a series of overlapping photographs taken in each survey zone of the ROI to build high-resolution DEMs and orthomosaics. Our surveys were made in four zones (labeled A–D; Figure 1) and repeated at semi-regular monthly intervals (36–48 days apart) throughout the 2021 rainy season. Table 1 summarizes the 14 flights; surveys 2D and 4A were not successful and were not used in the analysis. Preprogrammed flight paths were flown with a consumer-grade UAV, the DJI Air 2, which has a ½ inch Complementary Metal Oxide Semiconductor (CMOS) RGB sensor with a 24 mm equivalent focal length capable of an effective 48 MP photo [22]. The flight planning software, Dronelink version 2.41, used a fixed altitude set at a constant 100 m height above the take-off point. This software did not allow for terrain tracking, and so, surveyed regions with a range of topography resulted in maps with variable resolution. The flight pattern was set to the normal ‘lawnmower’ style of acquisition, with an average of 260 photos taken per survey zone and a forward and side photo overlap of 80% at 100 m above the takeoff point (Figure 2, Table 1). The typical aerial extent of each survey zone was 0.5 km2. The area covered by each survey was primarily controlled by balancing the battery limitations of the UAV against acquiring the best data possible for reconstruction in the available work time before the afternoon rain began.
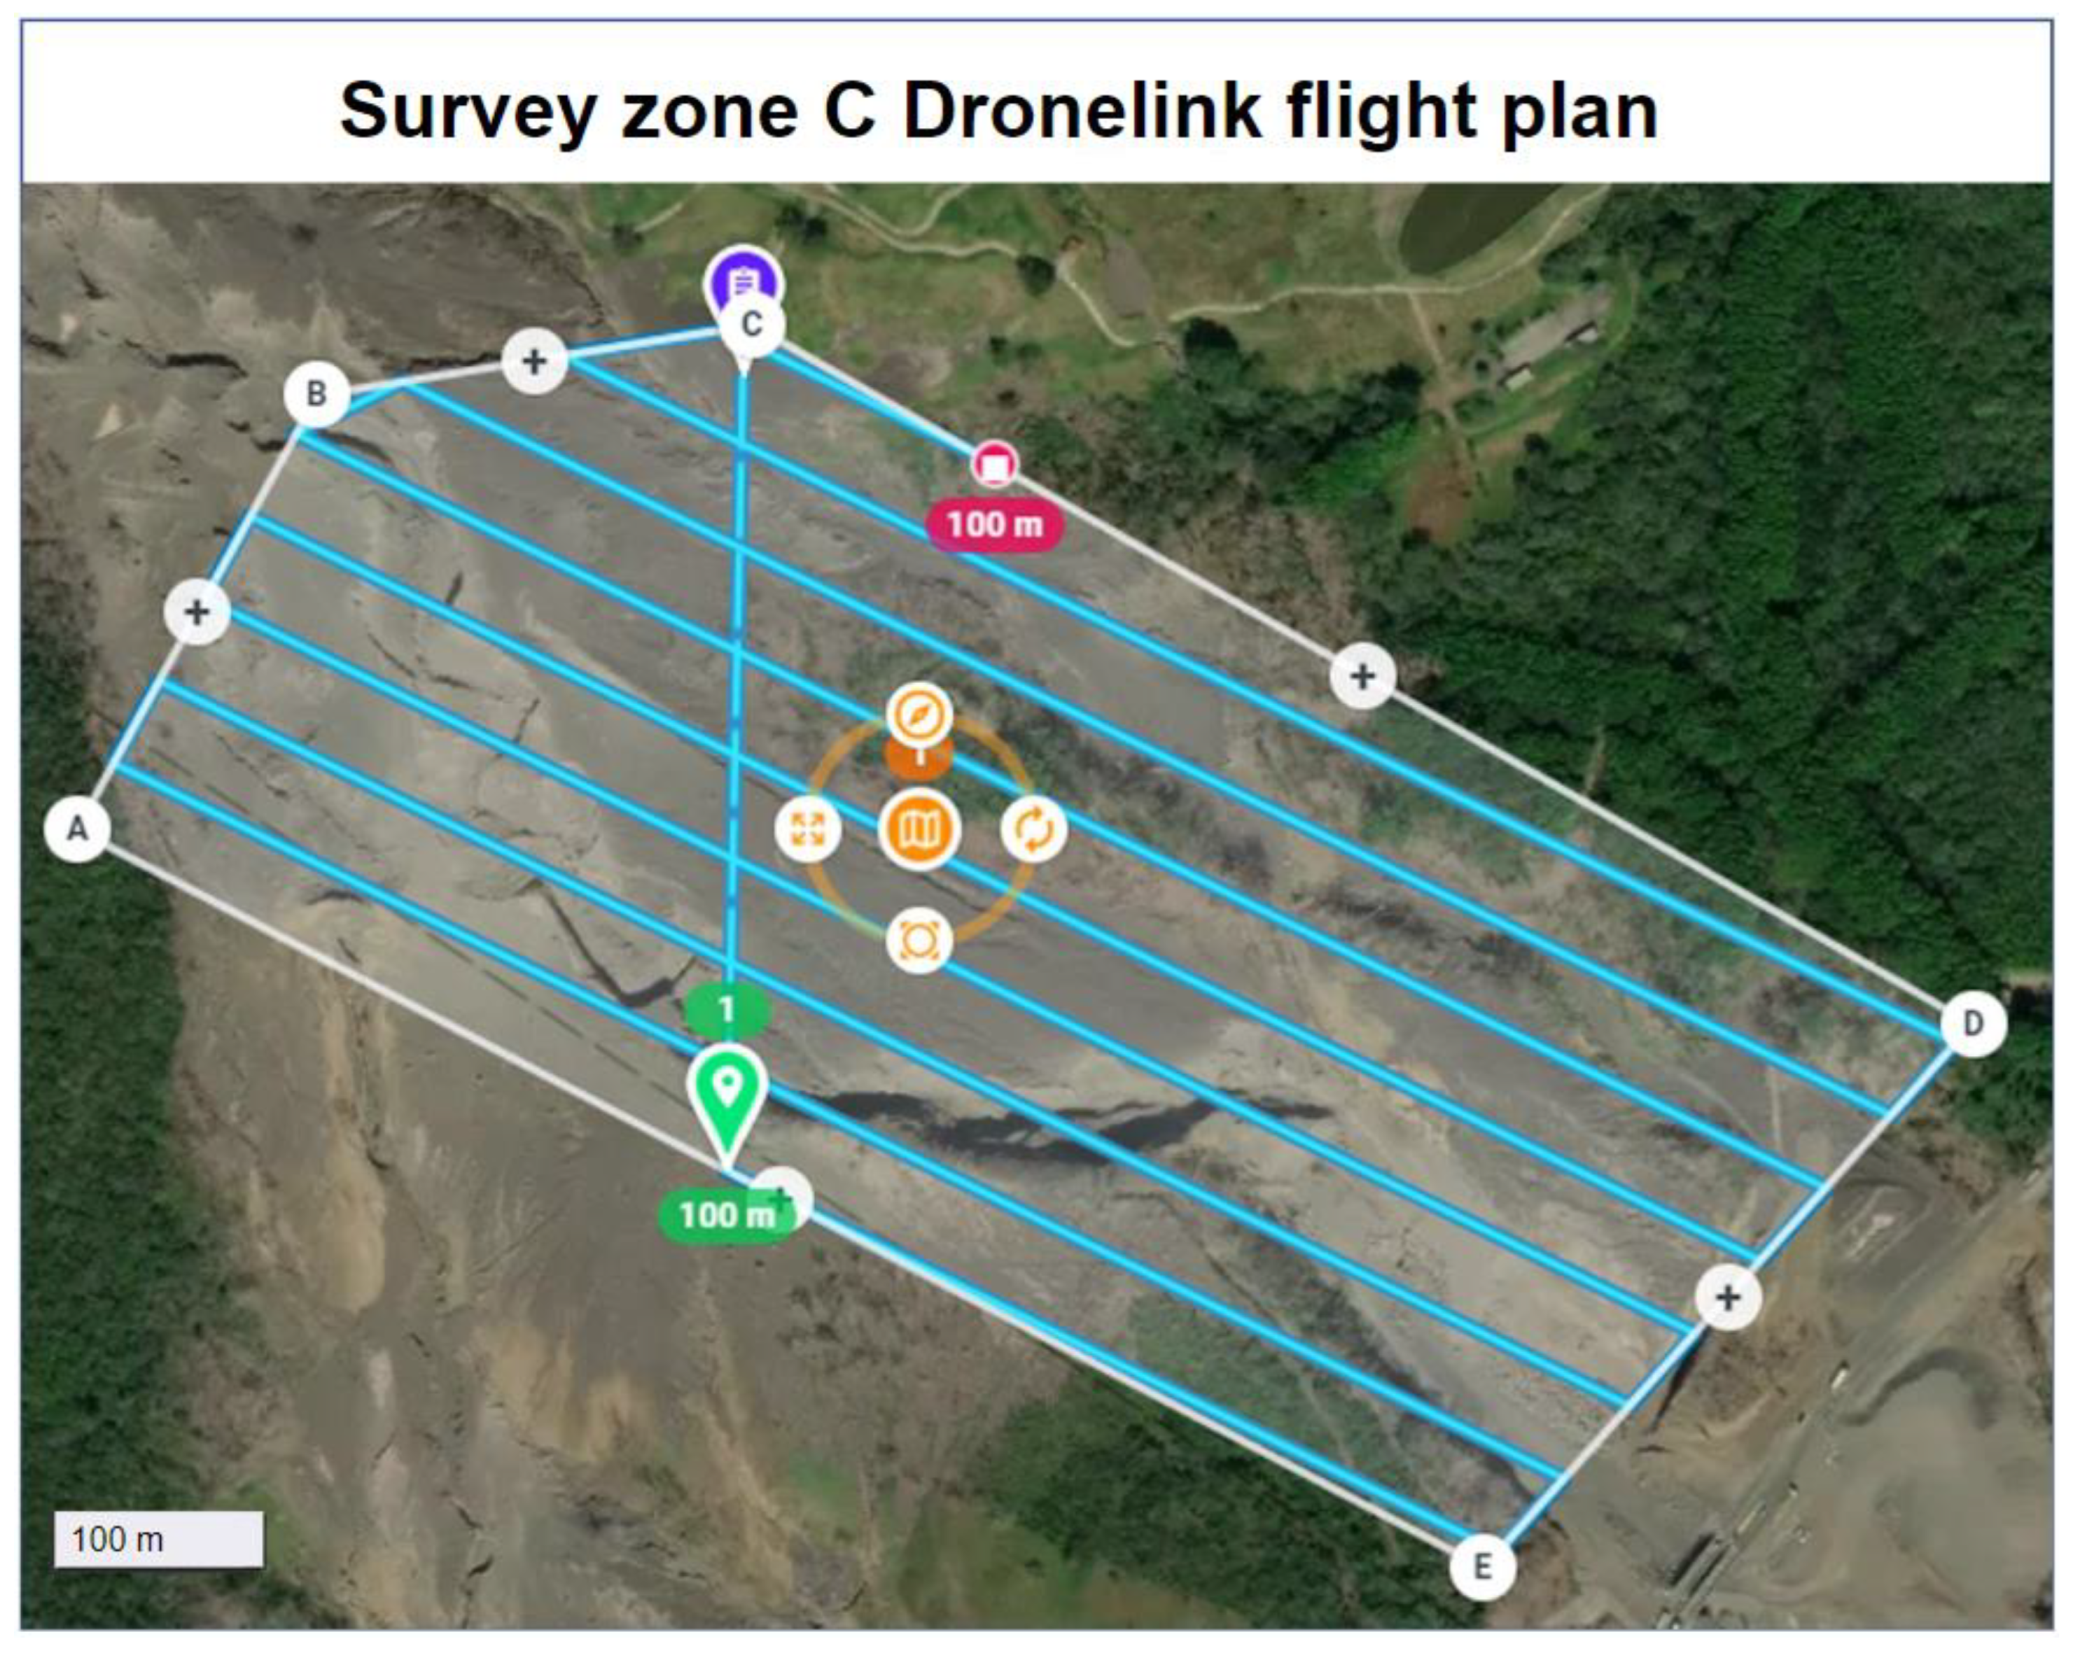
The blue lines show the planned path for the UAV. The white lettered points A-E are used to adjust the size and shape of the polygon in the app and the white + signs are to add more points to the polygon. The green marker is the start point at 100 m above the takeoff point and the red marker is the end of the planned flight.
2.3. Data Processing
2.3.1. Agisoft Metashape Pro
Initial data processing was carried out with Agisoft Metashape Pro version 1.7.3 on the highest resolution settings to produce the DEMs and orthomosaics at a sub-decimeter resolution with an average ground sample interval of 5.22 cm/pix. The workflow used in Metashape was adapted from the USGS guidelines (Figure A1) in Over et al. [20]. Parallel processing was carried out across 5 Alienware computers with Intel(R) Core (TM) i9-9900K processors and NVIDIA GeForce GTX 1660 Ti graphics cards. Iterative gradual selection and camera optimization were used to improve the quality of the tie points before the dense point cloud was populated [20]. Definition of a local coordinate system was accomplished using synthetic ground control points (SGCPs) chosen by picking stationary features that exist in all the surveys. Real ground control points (GCPs) were not possible for this study due to access and equipment limitations; however, SGCPs allow registration of the DEMs to each other spatially and can correct any warp present from inaccuracies in the GPS elevation metadata collected by the UAV. The first and last surveys’ orthomosaics were processed for direct comparison to establish static features. Ten to fifteen SGCPs dispersed through each zone were chosen to guarantee good coverage as recommended by Agisoft [23]. We recognized that while SGCPs are not ideal for absolute georegistration, they are appropriate for intra-image registration and DEM differencing. They rely upon one set of coordinates held as a control from the non-georegistered survey, which is determined by the onboard UAV GPS. The Mavic Air 2 accuracy is claimed to be ±0.5 m horizontally and ±1.5 m vertically [22]. In Agisoft, the camera accuracy was set to the default 10 m, and the SGCP accuracy was set to the default 0.005 m. Our primary goal was to identify changes in channel morphology over time and this does not require absolute georegistration relative to a global coordinate system but rather a local coordinate system. Toward this objective, DEMs and orthomosaics were exported in the TIFF file format with 10 cm/pixel resolution and fixed, consistent geographic bounds permitting efficient comparison and differencing. In total, 28 products (14 DEMs and 14 orthophotos) were produced and are provided in a linked database.
2.3.2. QGIS-Based Processing
Co-registration of images is impacted by the growth of the plants in the study area and required consideration during processing. To address this influence, the orthomosaics for the final survey, when the foliage would presumably be at its largest, were imported into QGIS 3.22.11, and the semi-automatic classification plugin (SCP) was used to mask the foliage. The program was trained by selecting polygons containing the target classifications, namely, rock versus foliage. The resultant classified regions were then sieved to reduce the miscategorized rock shadows posing as plants. Edges were still visible on the plant classification, so they were dilated by 2 pixels to add a buffer around the plants. These products were then exported as a TIFF file to create a foliage mask for the DEMs.
2.3.3. CloudCompare Co-Registration
The DEMs in several survey zones possessed long-period slope artifacts that also required correction during co-registration. The point clouds from Metashape were, thus, imported into CloudCompare version 2.13. alpha and aligned in all directions using manual alignment and the Align tool with an average root mean squared error (RMSE) of 1.64 cm. Each point cloud was then exported as a raster TIFF file with a 10 cm pixel resolution. These DEMs were then imported into MATLAB version 9.6 R2019a to match the pixel dimensions of the other DEMs of the same zone to permit vertical feature alignment for static points.
2.3.4. MATLAB DEM Calculations
The DEMs were imported to MATLAB and processing was performed on areas outside of the vegetation mask made in QGIS. The individual surveys of a zone were then subtracted from one another to find the DEM of Difference (DoD)(Equation (1)) [15].
ΔZ21 = Z(x,y)t2 − Z(x,y)t1,
Z(x,y)t2 in Equation (1) indicates the vertical relief in each x and y coordinate in time 2 (t2). From the DoD, we could then calculate volume change (ΔVt21) in Equation (2) as the integrated elevation difference ΔZ multiplied by 0.01 m2 to convert from pixels to decimeters. Since the DEMs were exported with 10 cm/pix resolution, the conversion from pixels to meters is a simple unit conversion.
Since the Mavic Air 2 logs distance above the take-off point (rather than absolute elevation), the z direction was unconstrained. To limit the z offset error, the zones were adjusted to a local coordinate system by manually zeroing out known static areas between DEMs, such as roads and roofs. The DoDs in the static areas then showed a zero value which persisted everywhere there was no change detected. The DEM and differenced DEMs were used to create profiles showing erosion (or aggradation) over time in each zone. Each DoD was cropped to only include the drainage and a small portion of the surrounding banks in order to quantify the volume of material moved in each interval.
Volume calculation errors are interpolated across the bridge, which obscures visibility to the ground in survey zones B and C. To rectify this, in the preprocessing, the tie points for the bridge structure have been removed, effectively cropping the structure [21]. Any remaining artifacts were masked in a later step, leaving a void that will be filled with NaNs in MATLAB for DoD drainage volume calculations.
The survey zones were purposefully flown with large areas of overlapping terrain that needed to be accounted for in the volume sum. These overlaps were merged by averaging DEM values. The full mosaic of 4 zones (Figure 1) was split into 500 m longitudinal sections according to the stream path distance within the channel (Figure 3). Segment breaks were oriented approximately perpendicular to the channel flow direction and statistics from each section were calculated separately for the DoD. Missing surveys in Zones A and D resulted in some of the segment comparisons being absent (Table 1).
2.3.5. Channel Morphology Calculations
SfM-derived DoDs are used to calculate changing geomorphology and quantify the sinuosity index (SI) for each section and survey interval. The sinuosity index is a measure of the streamflow path divided by the straight line length of the stream [24] and is important as a key metric used in the Rosgen natural river classification method. The streamflow path was calculated using a lowest-neighbor approach from a starting point selected inside the channel.
SI = (Streamflow path length) / (straight line path).
SI values are used to categorize a stream channel as straight (<1.1), sinuous (1.1–1.5), or meandering (>1.5) [21]. SI variations over time may be used to quantify the geomorphic dynamism of a rapidly changing fluvial system. The amount of change occurring in the sinuosity index in each section was calculated using a relative percent range (Equation (4)).
ΔSI (relative percent range)i = ((SIi − SImin)/SImean) × 100.
We proposed a novel metric, the morphological activity factor (MAF) (Equation (5)). We used MAF to show the overall changes in the channel when both erosion and deposition are taking place in the same section, often directly adjacent to one another, because of the relationship between the point bar and cutback in fluvial systems. In order to quantify the dynamism of the morphological changes in volume, we computed the absolute volume transfer as a MAF,
MAF = Gain + abs (loss).
The overall methodology for this study is outlined in the flowchart in Figure A2.
3. Results
The average ground sampling interval of the initial photogrammetric modeling prior to export from Agisoft was 5.22 cm/pix. The average RMSE for SGCPs in the xy direction was 3.44 cm and the average check point RMSE in the xy direction was 12.66 cm. The estimates for the z direction through Agisoft Metashape Pro were not included in the error estimation because the z was manually adjusted to a tolerance of less than 1 cm. The ground sample interval during export from Agisoft was adjusted to 10 cm/pix to reduce the computational work and make a uniform format for DEM merging and DoD calculation.
SfM reconstructions were used to generate accurate DEMs and orthomosaics for four different time steps to use in spatial and temporal analysis of landform change (Table 1). These reconstructions span approximately 3.5 km of the Las Lajas drainage with a total surveyed area of 1.6 km2. Volume change approximations can be made by subtracting these high-resolution DEMs at different time steps. The sample DoD in Figure 4, for instance, shows the aggradation and erosion occurring for the entire season between June and October (Figure 4). DoDs are also calculated for time steps spanning 36 to 48 days each, during which as much as 10 m of vertical erosion was evident in some areas. The observed erosion followed normal river meander patterns, though it was remarkably rapid given the energetics of the lahars [24].
The DEM differences allowed high-resolution profile changes to be extracted in key areas throughout the channel reach. For example, the cross-section A–A’ in Figure 5 shows a deep cut in the apex of a meander with 7 m of vertical erosion and 12 m of lateral erosion over the course of the entire rainy season. The steep and unstable walls were often undercut and slough off in this area. In cross-section B–B’, lateral migration and vertical erosion were evident without the extensive volume loss from collapsing channel walls compared to cross-section A--A’. Cross-section B–B’ still represented a strong erosional regime, but with less of an impact due to the relatively minor lateral erosion into the outer bank. Cross section C–C’ showed a 10 m wide constriction formed from an old, indurated deposit. Further downstream, cross-section D–D’ showed greatly reduced erosional features and some aggradation as the stream path freely meandered in the wider unconfined channel.
The volume change in each zone fluctuated throughout the season (Figure 6) and was evident primarily as either losses or gains, whose entire volume tended to cancel out when summed across the ROI (Figure 6a,b,d). In order to quantify the dynamism of the morphological change we computed the absolute volume transfer as the MAF (Equation (5)), which is shown in Figure 6c.
Fuego’s common secondary lahars were triggered by precipitation remobilizing material on the flanks of the volcano. Correlation between rainfall totals from May through October and lahar events was evident, but the amount of rainfall, measured at the FGLJ rain gauge, did not necessarily correspond to the qualitative intensity of a lahar (Figure 7). Since FGLJ was a point location, it might not represent the total rainfall distribution over an area, which fed channels in a variety of watersheds. The relative lahar intensity was a qualitative intensity of the lahar assessed by INSIVUMEH scientists based largely on seismic amplitudes. Values ranged from 1 to 3 on the graph, with 3 being the strongest lahar typically seen in this area. Every lahar event had a corresponding rainfall event, but the converse was not true. Out of the 24 precipitation events with an intensity greater than 2 mm/h, 19 resulted in lahars.
The sinuosity of each 500 m section was calculated separately and suggests that the upper sections (a–e) possessed much more variability in SI than the lower sections (f–i) (Figure 8). The average sinuosity of the entire channel was between 1.4 and 1.5, which, according to Rosgen [24], is at the boundary between sinuous and meandering. Meandering was common in sections a–f, as opposed to the strongly sinuous classification below the indurated deposit knickpoint in section f at km 2.6. The tortuosity of the channel was evident when the stream path was mapped onto the DEM (Figure 9a). The SIs for each section and each period compiled into one figure showed significant variability over time (Figure 9b–d).
SI variation over time is another useful metric to quantify the geomorphic dynamism of a rapidly changing fluvial system. The amount of change occurring in the sinuosity index in each section was calculated using a relative percent range (Equation (4)). The data showed a large shift in sinuosity (ΔSI) from section e to f. Although all ΔSI values were positive, the greatest relative percent range was in section d with 20% and the smallest changes in SI were in sections f and g (Figure 10).
The slope of the channel was measured and compared for each of the 500 m channel sections using the vertical drop from DEMs and horizontal distance from the tortuous flow path. Slopes changed very little over time (less than 1 degree), and this was largely attributable to increasing flow distance due to increasing sinuosity. Slope values for the ROI ranged between −4.6 and 9.0%, as measured in the June survey (Figure 11)
4. Discussion
Quantified erosional and depositional volume rates in the Las Lajas ROI provide insights into processes that occur over both spatial and temporal domains. During the three intra-survey measurements, we note that both the amount of rainfall and number of lahars were relatively constant (Figure 7). Assuming geomorphic change is principally related to the lahar activity, we expected similar volumetric transport when averaged over approximately one-month intervals in the rainy season.
Notably, ΔVt21 and ΔVt32 showed opposite behaviors in terms of the net volume change (Figure 6a; sections a–f). We considered the possibility that a single significant event, such as a large wall collapse, might be considerably impactful and could have dammed up the channel following the July survey (t2), resulting in sections b, c, and d showing exceptional deposition. (Figure 6b,d). Section d showed a high MAF with a substantial gain and an even greater loss (for a slight net loss). The DoD illuminated that the loss was from a large portion of the channel wall collapsing and a gain from the subsequent damming and upstream and capture of sediments. Another plausible explanation is inconsistency in sample intervals; data below section e was collected prior to a September 1 small lahar, which preceded the surveys in Zones A and B. That small lahar might, thus, have caused the geomorphic change that was only recorded below Zone B (section e and below) (Figure 6a). It is reasonable that a small lahar with shorter runout may have deposited more material in upper sections of the ROI (Figure 12). The net volume changes calculated for DoD 3 showed a steady increase with increasing flow distance out through section i, suggesting that during this time interval (July through August), some lahars retained enough energy to carry and drop large quantities of material at the lowest extent of the ROI (Figure 6a).
Although the meanders in the stream path appeared relatively dynamic throughout the 2021 rainy season, it is notable that the meandering flow was confined to the gross channel topography that existed prior to 2018. Google Earth time-lapse imagery from 2006 (prior to the construction of the La Reunión golf course), 2018 (prior to the PC), and 2021 each showed features associated with a terraced floodplain and in-filling with potential PC and lahar flow deposits. Las Lajas drainage was relatively stable within the wider channel for some time prior to 1969 according to Google Earth and these early images showed no evidence of recent migration in the form of scoured vegetation and slide scarps (Figure 13A). The floodplain was effectively unimpacted until the catastrophic 3 June 2018 PC event, which overtopped the Las Lajas channel and flowed towards San Miguel Los Lotes [3]. The addition of material into the system filled and dammed the channel temporarily, which diverted the flow (Figure 13C).
Analysis of imagery since 2018 showed that loose PC material within Las Lajas was downcut quickly, resulting in the development of a meandering path over time without any influence from the surrounding or buried topography apart from the outer banks of the old channel. The sinuosity indices of sections a through e were higher and more widely varying over time compared to those from sections f to i (Figure 8 and Figure 10) and we suggest this was because tall unstable walls are easily undercut and collapse more frequently, which diverts the flow within the channel and adds to the material available for bulking.
Observations of how the meanders were confined to the pre-2018 terrace suggest an opportunity to evaluate risk when developing infrastructure and planning land use. The golf course was built partially within the previous channel infill and it is unsurprising that these deposits were impacted by subsequent lahars. In the case of San Miguel Los Lotes, the PC did jump the channel and devastated the community, which was located outside of the Las Lajas drainage proper (Figure 1).
While the upper sections of our study area appeared particularly dynamic, the lower sections were more static. We observed a transition from the upper sections to the lower in section f at a natural constriction, which then became wider before going over a waterfall in section g. This waterfall, just below the bridge, was at an old, indurated deposit with resistant rock serving as a knickpoint. The local base level at the knickpoint accounted for some of the stability of the channel from the constriction above it. The slope of the channel between sections e and f decreased with distances downstream from −7.6% to −5.9%. The channel width, on the other hand, increased from ~10 m at the constriction to between 40 and 60 m before the waterfall. We assumed that much of the energy carrying the type 2 lahar material was lost here. The stability of the geomorphology was reflected in low sinuosity and the cross section (Figure 5D) indicated an evenly mixed regime of deposition and erosion. This was also evident when comparing the high MAF to the low net volume difference. The findings in this study may inform identification of higher risk zones at a course scale in areas with high erosion and lateral channel movement. The placement of the bridge, for example, appeared to be in a low-risk zone for typical type 2 lahars. The location was advantageous, given the combination of the constriction upstream and the indurated layer as a local base level. This was the most stable section of the channel to have major infrastructure.
There were several limitations to this work, motivating future study and improvements. UAV surveys such as the featured examples were limited by weather, battery life, and altitude restrictions. Only a relatively small areal area can be effectively surveyed for analysis and it could be desirable to increase the ROI area for broader volume calculations. The lack of ground control points makes accurate geo-registration impossible. The temporal resolution, at approximate monthly intervals, allows for the generalized impact of many lahar events, but does not allow for study of individual lahar depositional and erosional statistics.
Overall, the Las Lajas channel quickly eroded the PC material at the top of the study area and deposited much of the material at the bottom or beyond. The MAF indicates where major erosion and deposition were simultaneously happening with a net volume change relatively close to zero. The relative percent range of the sinuosity index decreased dramatically where the channel was restricted and changes from erosion-dominated to deposition-dominated behavior. Future work could focus on collecting DoDs with higher temporal resolution in a channel that does not have a constriction. This could be used to investigate if the MAF and sinuosity index can robustly indicate where the change from erosion to deposition occurs.
5. Conclusions
Secondary lahars at Volcán de Fuego are frequent and capable of moving large volumes of material over the course of a rainy season. The constant addition of new material near the vent through volcanic activity, including PCs every few years, combined with heavy precipitation makes Volcán de Fuego a natural laboratory to study the impacts of lahars on the geomorphology of the channels they occupy. Analyses of DoDs in 500 m channel flow sections elucidate the movement of material in both erosional and deposition sense. Using UAV SfM, we quantified volume changes of 490 m3/day loss in the upper sections (~6 km from summit) and a 440 m3/day gain in the lower sections (~10 km from summit).
Erosion and deposition along a lahar path are not solely dependent on the slope of the channel. This was evident using time-lapse volume estimates from four distinct aerial surveys. ΔVt21, corresponding to volume changes between June and July, showed deposition in several sections that only had erosion in the other periods. The slope in these sections changed negligibly during that span and the number of lahars and amount of rainfall differed very little from the other two periods.
We propose that the MAF is a useful measure of the dynamism of a channel as a function of erosion and aggradation. The net volume change, gross erosion, and gross deposition do not tell a clear enough story of the total activity occurring in the channel. The MAF allows for a quantitative measure of the total activity occurring within the channel. The area where the regime switches from erosional to depositional is the area where the MAF has the highest value due to the shifting channel eroding and depositing at near-equal rates.
The shape of the channel and some underlying indurated deposits significantly influenced the behavior of the channel in sections e through i. In section e, there was a constriction 12 m wide made of an indurated deposit, directly after a bend in the channel, which slowed the flow and presumably shed some of the energy. The constriction opened into a 60 m wide channel that flowed over a knickpoint formed from another indurated deposit, creating a local base level and stabilizing the stream behavior concerning sinuosity index and downcutting. Below the knickpoint, lahars ran out into a wide channel and gradually deposited material as they lost momentum.
The sinuosity index showed a distinct change in character from the upper sections, which were tortuous up high and less so further down Las Lajas, starting at section f. An increase in sinuosity over time was observed in the upper sections and can be a useful geomorphological statistic because it shows how lahars are actively changing flow paths.
Author Contributions
Conceptualization, J.C.M., J.B.J. and A.P.; methodology, J.C.M., J.B.J. and G.B.; formal analysis, J.C.M. and J.B.J.; investigation, J.C.M. and J.B.J.; resources, J.C.M., A.R., G.B. and A.P.; writing—review and editing, J.C.M., J.B.J., A.R. and G.B.; supervision, J.B.J.; project administration, J.B.J.; funding acquisition, J.B.J. All authors have read and agreed to the published version of the manuscript.
Funding
Funding for this work was made possible by the National Science Foundation EAR grants 1914491 and 1914526 awarded to Boise State University and Michigan Technological University as a collaborative project.
Data Availability Statement
The study data are available through Boise State University ScholarWorks at https://0-doi-org.brum.beds.ac.uk/10.18122/geo_data.7.boisestate, access on 5 June 2023.
Acknowledgments
This work was made possible with support from many of the staff at INSIVUMEH in Guatemala (https://insivumeh.gob.gt/, access on 26 May 2023). Their logistical and safety support and understanding of the volcano were critical to the success of this study.
Conflicts of Interest
The authors declare no conflict of interest.
Appendix A
Figure A1.
Workflow diagram loosely constructed after USGS guidelines.

Figure A2.
Methodology flowchart for this study.

References
- Lyons, J.J.; Waite, G.P.; Rose, W.I.; Chigna, G. Patterns in Open Vent, Strombolian Behavior at Fuego Volcano, Guatemala, 2005–2007. Bull. Volcanol. 2010, 72, 1–15. [Google Scholar] [CrossRef]
- Naismith, A.K.; Matthew Watson, I.; Escobar-Wolf, R.; Chigna, G.; Thomas, H.; Coppola, D.; Chun, C. Eruption Frequency Patterns through Time for the Current (1999–2018) Activity Cycle at Volcán de Fuego Derived from Remote Sensing Data: Evidence for an Accelerating Cycle of Explosive Paroxysms and Potential Implications of Eruptive Activity. J. Volcanol. Geotherm. Res. 2019, 371, 206–219. [Google Scholar] [CrossRef] [Green Version]
- Ferrés, D.; Escobar Wolf, R. Informe Técnico: Volcán de Fuego; Accion Contra el Hambre: New York, NY, USA, 2018; pp. 1–170. [Google Scholar]
- Albino, F.; Biggs, J.; Escobar-Wolf, R.; Naismith, A.; Watson, M.; Phillips, J.C.; Chigna Marroquin, G.A. Using TanDEM-X to Measure Pyroclastic Flow Source Location, Thickness and Volume: Application to the 3rd June 2018 Eruption of Fuego Volcano, Guatemala. J. Volcanol. Geotherm. Res. 2020, 406, 107063. [Google Scholar] [CrossRef]
- Thouret, J.C.; Antoine, S.; Magill, C.; Ollier, C. Lahars and Debris Flows: Characteristics and Impacts. Earth-Sci. Rev. 2020, 201, 103003. [Google Scholar] [CrossRef]
- Naranjo, J.L.; Sigurdsson, H.; Carey, S.N.; Fritz, W. Eruption of the Nevado Del Ruiz Volcano, Colombia, on 13 November 1985: Tephra Fall and Lahars. Science 1986, 233, 961–963. [Google Scholar] [CrossRef] [PubMed]
- Gudmundsson, M.T. Hazards from Lahars and Jökulhlaups. In The Encyclopedia of Volcanoes; Elsevier: Amsterdam, The Netherlands, 2015; pp. 971–984. [Google Scholar]
- Bosa, A.R.; Johnson, J.B.; De Angelis, S.; Lyons, J.J.; Roca, A.; Anderson, J.F.; Pineda, A. Tracking Secondary Lahar Flow Paths and Characterizing Pulses and Surges Using Infrasound Array Networks at Volcán de Fuego, Guatemala. Volcanica 2021, 4, 239–256. [Google Scholar] [CrossRef]
- Vázquez, R.; Capra, L.; Coviello, V. Factors Controlling Erosion/Deposition Phenomena Related to Lahars at Volcán de Colima, Mexico. Nat. Hazards Earth Syst. Sci. 2016, 16, 1881–1895. [Google Scholar] [CrossRef] [Green Version]
- Cando-Jácome, M.; Martínez-Graña, A. Determination of Primary and Secondary Lahar Flow Paths of the Fuego Volcano (Guatemala) Using Morphometric Parameters. Remote Sens. 2019, 11, 727. [Google Scholar] [CrossRef] [Green Version]
- Paredes, E. Decreased Lahars Worry Residents of Siquinalá Communities. Available online: https://www.prensalibre.com/ciudades/escuintla/descenso-de-lahares-preocupa-a-vecinos-de-comunidades-de-siquinala/ (accessed on 17 May 2023).
- Kucharczyk, M.; Hugenholtz, C.H. Remote Sensing of Natural Hazard-Related Disasters with Small Drones: Global Trends, Biases, and Research Opportunities. Remote Sens. Environ. 2021, 264, 112577. [Google Scholar] [CrossRef]
- Mishra, V.; Avtar, R.; Prathiba, A.P.; Mishra, P.K.; Tiwari, A.; Sharma, S.K.; Singh, C.H.; Chandra Yadav, B.; Jain, K. Uncrewed Aerial Systems in Water Resource Management and Monitoring: A Review of Sensors, Applications, Software, and Issues. Adv. Civ. Eng. 2023, 2023, 1–28. [Google Scholar] [CrossRef]
- Akay, S.S.; Özcan, O.; Sanli, F.B.; Görüm, T.; Sen, Ö.L.; Bayram, B. UAV-Based Evaluation of Morphological Changes Induced by Extreme Rainfall Events in Meandering Rivers. PLoS ONE 2020, 15, e0241293. [Google Scholar] [CrossRef] [PubMed]
- Civico, R.; Ricci, T.; Scarlato, P.; Andronico, D.; Cantarero, M.; Carr, B.B.; De Beni, E.; Del Bello, E.; Johnson, J.B.; Kueppers, U.; et al. Unoccupied Aircraft Systems (Uass) Reveal the Morphological Changes at Stromboli Volcano (Italy) before, between, and after the 3 July and 28 August 2019 Paroxysmal Eruptions. Remote Sens. 2021, 13, 2870. [Google Scholar] [CrossRef]
- Cook, K.L. An Evaluation of the Effectiveness of Low-Cost UAVs and Structure from Motion for Geomorphic Change Detection. Geomorphology 2017, 278, 195–208. [Google Scholar] [CrossRef]
- Dering, G.M.; Micklethwaite, S.; Thiele, S.T.; Vollgger, S.A.; Cruden, A.R. Review of Drones, Photogrammetry and Emerging Sensor Technology for the Study of Dykes: Best Practises and Future Potential. J. Volcanol. Geotherm. Res. 2019, 373, 148–166. [Google Scholar] [CrossRef]
- Ellett, N.G.; Pierce, J.L.; Glenn, N.F. Partitioned by Process: Measuring Post-Fire Debris-Flow and Rill Erosion with Structure from Motion Photogrammetry. Earth Surf. Process. Landf. 2019, 44, 3128–3146. [Google Scholar] [CrossRef]
- Li, H.; Chen, L.; Wang, Z.; Yu, Z. Mapping of River Terraces with Low-Cost UAS Based Structure-from-Motion Photogrammetry in a Complex Terrain Setting. Remote Sens. 2019, 11, 464. [Google Scholar] [CrossRef] [Green Version]
- Over, J.-S.R.; Ritchie, A.C.; Kranenburg, C.J.; Brown, J.A.; Buscombe, D.; Noble, T.; Sherwood, C.R.; Warrick, J.A.; Wernette, P.A. Processing Coastal Imagery with Agisoft Metashape Professional Edition, Version 1.6-Structure from Motion Workflow Documentation; U.S. Department of the Interior, U.S. Geological Survey: Reston, VA, USA, 2021.
- Özcan, O.; Özcan, O. Multi-Temporal UAV Based Repeat Monitoring of Rivers Sensitive to Flood. J. Maps 2021, 17, 163–170. [Google Scholar] [CrossRef]
- DJI Mavic Air 2 User Manual. 2021. Available online: https://dl.djicdn.com/downloads/Mavic_Air_2/Mavic_Air_2_User_Manual_v1.6_enIII.pdf (accessed on 26 May 2023).
- Agisoft Metashape User Manual Professional Edition; Version 1.8; Agisoft: St. Petersburg, Russia, 2022.
- Rosgen, D.L. A Classification of Natural Rivers. CATENA 1994, 22, 169–199. [Google Scholar] [CrossRef] [Green Version]
Figure 1.
Locator map (inset) and study area orthophoto created in ArcGIS featuring Volcán de Fuego and survey zones highlighted in green. The FGLJ rain gauge is labeled with a red triangle. Nearly parallel barrancas Las Lajas and El Jute are labeled as well as the former village site of San Miguel Los Lotes.

Figure 2.
Dronelink flight planning example route for survey zone C. The blue lines show the planned path for the UAV. The white lettered points A-E are used to adjust the size and shape of the polygon in the app and the white + signs are to add more points to the polygon. The green marker is the start point at 100 m above the takeoff point and the red marker is the end of the planned flight.

Figure 3.
The entire transect of the study area is shown with 10 m contours. Each 500 m section is labeled alphabetically from upstream to downstream, “a” through “i”.
Figure 3.
The entire transect of the study area is shown with 10 m contours. Each 500 m section is labeled alphabetically from upstream to downstream, “a” through “i”.

Figure 4.
(a) An example orthomosaic of zone 4 of the ROI with 4 cross-sections indicated. (b) DoD of zone 4 represents the entire rainy season from June to October. The warmer colors from yellow to red indicate downcutting, gray indicates less than 0.5 m DoD, and blue indicates deposition or plant growth areas.

Figure 5.
Cross-sectional profiles with positions indicated in Figure 4 and spanning the duration of the rainy season. Profiles (A,B,D) were chosen to demonstrate the difference in character of the lahar channel from the upper sections to the lower sections. Profile (C) was chosen to show the indurated rock that changes very little throughout the season.


Figure 6.
Volume changes by section shown as (a) total volume transfer, (b) sum of all volume gains, (c) morphological activity factor (MAF), and (d) sum of all volume loss. Different colored bars denote the different DoD time intervals.
Figure 6.
Volume changes by section shown as (a) total volume transfer, (b) sum of all volume gains, (c) morphological activity factor (MAF), and (d) sum of all volume loss. Different colored bars denote the different DoD time intervals.

Figure 7.
Time series summarizing lahar activity, rainfall activity, and UAV SfM survey dates. The blue lines show the mm of rainfall recorded per 15 min at the FGLJ monitoring station. The black stars correspond to lahar intensity estimates provided by INSIVUMEH through publicly issued bulletins. The red points were recorded on time-lapse cameras. The text shows rainfall totals and lahar totals for each of the three survey periods.

Figure 8.
Sinuosity evolution with time for each section and each survey date.

Figure 9.
The sinuosity of each 500 m portion of the channel calculated independently. (a) The DEM in panel A shows the streamflow path derived from the corresponding topography. (b) All 4 survey stream path plotted atop each other for the entire ROI. (c,d) Detail of the upper and lower sections with relatively high and low sinuosity, respectively.

Figure 10.
The relative change in sinuosity (ΔSI) of the stream as a function of section over the course of the entire season June through October.
Figure 10.
The relative change in sinuosity (ΔSI) of the stream as a function of section over the course of the entire season June through October.

Figure 11.
Slope (in percent) for each of the 500 m sections in survey 1. The upper portion of the channel has steep walls over 30 m high in some areas. Section f opens up to a broader channel before dropping off a waterfall in section g. The channel returns to being unconfined and wide below the falls.

Figure 12.
DoD 2 from July to August showing significant deposition in the center of the channel.

Figure 13.
Google Earth imagery over time featuring the ROI from above section a to midway through section f. The green lines in (A) show the edges of the terraces that form the floodplain which contains Las Lajas barranca circa February 2006 and are also shown in (B,C). The white line represents the streamflow path from April 2021, digitized from image (C). Image (B) shows the extent of La Reunion Golf Resort which partially obscures the natural terrace.


Table 1.
Details of the flights made during the 2021 rainy season from May to October. Each survey is roughly separated by a month. Each flight record contains a 6-digit date, YYMMDD, and the number of photos taken during the flight. Red cells indicate no data.
Table 1.
Details of the flights made during the 2021 rainy season from May to October. Each survey is roughly separated by a month. Each flight record contains a 6-digit date, YYMMDD, and the number of photos taken during the flight. Red cells indicate no data.
| Survey 1 | Survey 2 | Survey 3 | Survey 4 | |
|---|---|---|---|---|
| Zone A | 210607 590 | 210720 258 | 210902 258 | 211008 |
| Zone B | 210602 279 | 210720 265 | 210902 265 | 211008 270 |
| Zone C | 210602 286 | 210720 283 | 210831 282 | 211008 283 |
| Zone D | 210603 382 | 210720 | 210901 213 | 211012 279 |
Disclaimer/Publisher’s Note: The statements, opinions and data contained in all publications are solely those of the individual author(s) and contributor(s) and not of MDPI and/or the editor(s). MDPI and/or the editor(s) disclaim responsibility for any injury to people or property resulting from any ideas, methods, instructions or products referred to in the content. |
© 2023 by the authors. Licensee MDPI, Basel, Switzerland. This article is an open access article distributed under the terms and conditions of the Creative Commons Attribution (CC BY) license (https://creativecommons.org/licenses/by/4.0/).
Share and Cite
MDPI and ACS Style
Mock, J.C.; Johnson, J.B.; Pineda, A.; Bejar, G.; Roca, A. UAV-Based Quantification of Dynamic Lahar Channel Morphology at Volcán de Fuego, Guatemala. Remote Sens. 2023, 15, 3713. https://0-doi-org.brum.beds.ac.uk/10.3390/rs15153713
AMA Style
Mock JC, Johnson JB, Pineda A, Bejar G, Roca A. UAV-Based Quantification of Dynamic Lahar Channel Morphology at Volcán de Fuego, Guatemala. Remote Sensing. 2023; 15(15):3713. https://0-doi-org.brum.beds.ac.uk/10.3390/rs15153713
Chicago/Turabian StyleMock, Jerry C., Jeffrey B. Johnson, Armando Pineda, Gustavo Bejar, and Amilcar Roca. 2023. "UAV-Based Quantification of Dynamic Lahar Channel Morphology at Volcán de Fuego, Guatemala" Remote Sensing 15, no. 15: 3713. https://0-doi-org.brum.beds.ac.uk/10.3390/rs15153713
Note that from the first issue of 2016, this journal uses article numbers instead of page numbers. See further details here.