Article

Effect of Water Vapor Transport on a Typical Rainstorm Process in the Arid Region of Southern Xinjiang: Observations and Numerical Simulations

1
College of Geography and Remote Sensing Sciences, Xinjiang University, Urumqi 830002, China
2
Institute of Desert Meteorology, China Meteorological Administration, Urumqi 830002, China
3
Jinzhou Meteorological Bureau, Jinzhou 121000, China
4
Taklimakan Desert Meteorology Field Experiment Station of China Meteorological Administration, Urumqi 830002, China
5
Xinjiang Key Laboratory of Desert Meteorology and Sandstorm, Urumqi 830002, China
6
Collaborative Innovation Center on Forecast and Evaluation of Meteorological Disasters, Key Laboratory for Aerosol-Cloud Precipitation of China Meteorological Administration, Nanjing University of Information Science and Technology, Nanjing 210044, China
*
Author to whom correspondence should be addressed.
Remote Sens. 2023, 15(16), 4082; https://0-doi-org.brum.beds.ac.uk/10.3390/rs15164082
Submission received: 24 July 2023 / Revised: 15 August 2023 / Accepted: 17 August 2023 / Published: 19 August 2023

Abstract

:
There are frequent and intensive periods of heavy rain in the arid areas of southern Xinjiang. This study uses a typical rainstorm process in the South Xinjiang Basin to investigate the weather, physical mechanisms, mesoscale characteristics, and income and expenditure characteristics of water vapor sources, analyzing them using the observation data from southern Xinjiang regional automatic stations, ERA5 reanalysis data, multi-source satellite data, and WRF numerical simulation results. The study results show that torrential rain processes occur in the double-body distribution of the South Asian High in the upper troposphere, which is “high in the east and low in the west,” with “two ridges and one trough” in the middle layer. The development and movement of the low vortex, the configuration of low-level convergence and high-level divergence, and vertical upward movement provide favorable dynamic conditions for heavy rain. Additionally, the Black Sea, the Caspian Sea, the Aral Sea, the Arabian Sea, and the Bay of Bengal are important water vapor sources for this rainstorm. The water vapor reaches the South Xinjiang Basin along westward, southwest, and eastward paths. It is mainly imported into the South Xinjiang Basin from 500 to 300 hPa on the southern border and 700–500 hPa on the west, north, and east borders, and exported from 500 to 300 hPa on the eastern border. The simulation results show that the change in water vapor content significantly influences the precipitation intensity and range. The water vapor transport at the southern boundary contributes the most precipitation during the rainstorm. As the water vapor in the rainstorm area increases (decreases), the ascending motion is strengthened (weakened), the low-level convergence and high-level divergence are strengthened (weakened), the water vapor transport to the middle and high levels increases (decreases), and the precipitation increases (decreases).

Graphical Abstract

1. Introduction

Located in the hinterland of Eurasia, southern Xinjiang is surrounded by mountains on three sides (the south, west, and north sides are surrounded by the Kunlun Mountains, Pamirs, and Tianshan Mountains, respectively), and the center is the Tarim Basin. Due to the influence of the system path and the special atmospheric circulation and water vapor conditions in southern Xinjiang, the precipitation there is unique. Although the annual average precipitation is only 59.1 mm, sudden torrential rains often occur in such arid areas [1,2,3]. Studies have shown that in recent years, rainstorms in southern Xinjiang have shown a significantly increasing trend [4,5,6]. The increasing trend of local rainstorm frequency is more noticeable [7,8,9,10,11]. In many cases, the magnitude of an extreme precipitation event can exceed the local average annual precipitation [12,13], and once such an incident occurs, it often leads to urban waterlogging, landslides, mudslides, and other disasters, affecting the local industrial and agricultural production and endangering life and property safety, with a serious impact on society and the economy [14,15].
Water vapor is a necessary condition for the formation of precipitation, and its transport status is of great significance to the study of the causes and mechanisms of rainstorms [16,17,18]. At present, there are two main aspects of research on the water vapor transport characteristics of heavy rain: one is where the water vapor that causes the heavy rain comes from, and the other is the contribution of water vapor in each path during heavy rain. Under the climate average state, the atmospheric circulation system of rainstorm-water vapor transport in southern Xinjiang is mainly the westerly wind and the South Asian monsoon [19,20,21]. Water vapor mainly comes from the Mediterranean Sea, Caspian Sea, Black Sea, Atlantic Ocean, and Arctic Ocean in the middle and high latitudes to the west, and the water vapor during the rainstorm is mainly transported by the westerly, southerly, and easterly winds [22]. However, the water vapor transport processes affecting different regions in southern Xinjiang are different. Analysis of a large number of cases of heavy rain indicates that there are three main water vapor transport paths [23,24,25,26,27,28]. One is the westerly water vapor transported by the westerly airflow and the impact system itself, and the other is transported by the southerly water vapor carried by the southwest airflow in front of the Central Asian trough or the low vortex southward extension trough. Most of the water vapor on this path comes from the Qinghai-Tibet Plateau. In some extreme cases, under the appropriate circulation configuration, the Arabian Sea vapor transports water vapor to the southwestern region of Xinjiang using relay transport. In addition to using the Euler method to study the water vapor flux of the southern Xinjiang rainstorm, many scholars have begun to use the Lagrangian backward trajectory model to identify the water vapor transport path and source of the southern Xinjiang rainstorm [29,30,31]. The Euler and the Lagrangian methods are, at present, mainly used to study the transportation path of storm-water vapor. However, the Euler method focuses on the movement of space fluids and can only obtain a simple water vapor transportation path. Due to the uncertainty of the Lagrangian backward trajectory model itself, it is inevitable that there will be errors in the real situation.
Changes in water vapor greatly influence the system structure of precipitation, with the initial water vapor condition being one of the important factors affecting the occurrence and development of heavy rain [32,33,34,35,36]. Alterations in the water vapor content of the initial field will lead to changes in water vapor transport and divergence of the water vapor flux, thereby affecting precipitation [37,38]. The initial water vapor conditions not only determine the intensity of the rainstorm but also have a significant impact on the time of the maximum precipitation, thus determining the simulation effect of the model on the diurnal variation of precipitation [39]. Song et al. [40], via numerical experiments, pointed out that water vapor plays a key role in maintaining low vortices and the evolution of structural features [41]. Changing the water vapor content in different areas at the initial moment proved that the degree of water vapor accumulation before the rainstorm process, and whether the water vapor transport mechanism is maintained during the rainstorm process are the key factors to judge the amount of rainfall in a rainstorm process. Based on research on water vapor sensitivity in the lower layer environment, it found that when the water vapor in the lower layer increases (decreases), the water vapor transported to the middle layer increases (decreases), the release of latent heat of condensation in the middle layer increases (decreases), and the vertical movement of the layer increases (decreases) [42,43]. In addition, experiments have shown that the increase in the water vapor content in the low-altitude atmosphere will change the temperature and humidity structure of the boundary layer, and the liquid water content, coverage area, and thickness of the fog will change dramatically according to this [44]. Although there are many simulation studies on water vapor, research on the influence of water vapor changes on rainstorms in the arid area of southern Xinjiang is currently lacking.
Based on the above literature, there are still many issues in this field that need urgent solutions. For example, the circulation background of the rainstorm in southern Xinjiang, the characteristics of the physical mechanism, the question over the source of the water vapor for heavy rain if there is a lack of water vapor in southern Xinjiang, and how water vapor is transported. What is the influence and mechanism of action of water vapor with respect to the rainstorm process? Focusing on these issues, a typical extreme precipitation process that occurred in the South Xinjiang Basin on 14–17 June 2021 was selected, and multi-source data was used for diagnostic analysis to explore the synoptic causes of this rainstorm process. We also investigated the abnormal water vapor that maintains the rainstorm source and transportation characteristics, using the WRF mesoscale numerical model to discover the water vapor mechanisms in the rainstorm processes in southern Xinjiang. This is significant in improving the ability of rainstorm forecasting in the arid areas of Xinjiang.

2. Materials and Methods

2.1. Data Introduction

2.1.1. Study Area

Our study area was the southern Xinjiang region (Figure 1). The terrain data was collected using the global terrain model developed by the National Geophysical Data Center (NGDC) under the National Oceanic and Atmospheric Administration (NOAA), including the topography of the global land and ocean at a resolution of 2 min.

2.1.2. Ground Observation Data

The hourly precipitation and temperature data of 479 encrypted automatic observation stations in southern Xinjiang from 14 to 17 June 2021, provided by the Xinjiang Meteorological Information Center were used for the analysis of the actual situation, and the temperature, pressure, humidity, and other meteorological data measured by the radiosonde at Hotan Station at 20:00 on 15 June were used for the analysis of the unstable conditions. The data were quality-controlled by climatic threshold tests and spatial consistency checks [45].

2.1.3. Reanalysis Data

The hourly reanalysis data of ERA5 with a spatial resolution of 0.25 × 0.25° were used to analyze the circulation situation field and estimate the water vapor transport flux. The variables used included geopotential height, meridional and zonal winds, vertical velocity, divergence, surface pressure, and specific humidity.
The National Centre for Environmental Prediction provided Final Operational Global Analysis (FNL) data with a time resolution of 6 h, and a horizontal spatial resolution of 0.25 × 0.25°, divided into 26 layers in the vertical direction. FNL data are widely used in the diagnostic analysis and research of weather and climate events. This study mainly uses FNL data to provide initial conditions and boundary conditions for the numerical simulation area.

2.1.4. Satellite Data

The hourly mean cloud top brightness temperature (TBB) data of FY-2G with a horizontal resolution of 0.1 × 0.1° provided by the National Satellite Meteorological Center [46] were used to analyze the evolution characteristics of mesoscale systems. The hourly stratified water vapor data of FY-4A with a horizontal resolution of 4 km [47] were used to analyze water vapor transport characteristics.
The global 30 min, 8 km resolution CMORPH satellite retrieval precipitation products developed by the US Climate Prediction Center [48] were used to evaluate the precipitation results simulated by the control experiment.

2.2. Model and Methods

2.2.1. Water Vapor Flux

The vertical whole-layer water vapor flux (Q) is calculated as follows [49]:
Q = 1 g P s P t q v d p ,
where g is the acceleration of gravity, pt is set as 300 hPa, ps is the surface air pressure, q is the specific humidity, v is the wind field, and p is the pressure.
The water vapor budget at the four boundaries in the east (QE), west (QW), south (QS), and north (QN) is calculated as follows [50,51]:
Q E = φ S φ N Q λ E α d φ ,
Q W = φ s φ N Q λ W α d φ ,
Q S = λ W λ E Q φ S α cos φ S d λ ,
Q N = λ W λ E Q φ N α cos φ N d λ ,
where λE (λW) is the longitude of the east (west) boundary, φS(φN) is the latitude of the south (north) boundary, and α is the radius of the Earth.

2.2.2. WRF Model

WRF4.2 version was used to simulate the rainstorm process. This model adopts single-layer nesting, has a horizontal resolution of 9 km (Figure 2), the number of grid points is 195 × 115, the vertical direction is 34 layers, and the air pressure at the top of the model is 50 hPa. The parameterization scheme settings are shown in Table 1. The simulation time was from 00:00 14 June 2021 to 00:00 18 June 2021 for a total of 96 h, with a spin-up time of 12 h and an output time interval of 1 h. The background field and boundary conditions were provided by the FNL reanalysis data at a time interval of 0.25 × 0.25° for 6 h. In addition to the control test, 8 groups of water vapor sensitivity tests were designed, with the test names and schemes shown in Table 2.

3. Results

3.1. Precipitation Overview

From 14 to 17 June 2021, there was an obvious heavy precipitation process in southern Xinjiang, and the heavy precipitation period was mainly concentrated from 12:00 on 14 June to 00:00 on 17 June (UTC, same below), Figure 3 shows the spatial distribution of cumulative precipitation at each station. The heavy precipitation center was in Luopu County, Hotan Prefecture. The characteristics of this heavy precipitation were: (1) The heavy precipitation area is concentrated, the precipitation lasts for a long time, and the accumulated rainfall was large (Figure 3). A total of 174 stations reached the level of heavy rainfall, with the largest rainfall center at Luopu Station in Hotan, with a cumulative rainfall of 121.6 mm and a maximum daily rainfall of 106.6 mm; (2) The intensity of the precipitation was high (Figure 4). A total of 54 stations experienced short-term heavy rainfall (≥10 mm·h−1), with the maximum hourly rainfall intensity being 28.8 mm, and the maximum 3 h rainfall intensity reaching 64.9 mm; and (3) Luopu County (74.1 mm), Moyu County (59.6 mm), and Hotan City (56.0 mm) in the Hotan area of the National Station broke the historical extreme value of daily precipitation and exceeded its annual average precipitation, the precipitation in Luopu County on 15 June was 1.7 times the annual average precipitation of the station, and the daily precipitation in Luopu, Moyu, and Hotan all reached extreme precipitation events once in a century. The heavy rainfall triggered significant flash floods, which caused serious damage to crops and infrastructure, and brought great losses to production and life.

3.2. Large-Scale Circulation Background

At 100 hPa, the high pressure in South Asia was banded before 12 June and split into two high centers on the Iranian Plateau and the eastern part of the Tibetan Plateau at 00:00 on 12 June (figure omitted). From 00:00 on 13 June, the “east center” continued to develop and expand; at 00:00 on 14 June, it showed a double-body distribution of “east high and west low” (Figure 5a); at 12:00 on 15 June, during the strong phase of the rainstorm, the two high centers reached over 1650 dagpm (Figure 5b) and remained stable until June 16. The rainstorm area is located at the front of the subtropical trough. This form of configuration has better thermal and dynamic conditions for rainstorms. At 200 hPa, the southwestern jet was located over the South Xinjiang basin (Figure 5c), and at 12:00 on 15 June, the western part of South Xinjiang was on the right side of the entrance area of the high-altitude rapids. There was a clear cyclonic shear, with the latitudinal winds enhanced, the rapids axis extended southward, and the central wind speed reached 56 m/s, with the heavy rainfall located in the wind speed convergence and dispersion area (Figure 5d). At 500 hPa, the Ural ridge and the Iranian ridge superimposed on the development of Lake Balkhash as a transverse trough, and the periphery of the low pressure was controlled by westerly winds (Figure 5e). During the stage of heavy rainfall, the Ural ridge collapsed to the south, the Iranian ridge first went up to the north and then receded to the west, and the great West Siberian trough combined with the transverse trough of Lake Balkhash to extend southward; there was a formation of a low vortex over the southern Xinjiang region, and the north–south wind shear appeared (Figure 5f). At 700 hPa, the low vortex kept developing in conjunction with the stable easterly flow, with southwesterly and easterly wind shear in the Hotan area, and the storm area was in the vicinity of the east–west wind field shear (Figure 5g,h).

3.3. Physical Mechanism Analysis

The occurrence of heavy rain requires certain dynamic conditions. From the vertical velocity and divergence vertical profiles along the rainstorm center Luopu Station (37°N), at 06:00 on 15 June, there was a weak upward movement on the west side of the rainstorm center (Figure 6a), corresponding to precipitation in the Pishan area. At 12:00 on 15 June, the ascending movement gradually strengthened and extended upwards, developing to 400 hPa, and 600–850 hPa was the ascending center (Figure 6b); as the center moved eastward with the system, the precipitation moved eastward to the Luopu area. The sounding temperature–humidity stratification curve can be used to analyze the change in atmospheric temperature and humidity conditions before and after the rainstorm and can also determine the stability of atmospheric stratification. It can be seen from the T-lnP diagram (Figure 7) of the Hotan sounding station at 12:00 on 15 June that the whole layer of the rainstorm area is wet, and the thickness of the wet layer is from 800 hPa to 500 hPa, and the pseudo-equivalent potential temperature from the ground to 600 hPa decreases with height. The knot shows an unstable state, the unstable energy (CAPE: Convective Available Potential Energy) value reaches 413 J/kg, the height of the zero-degree layer is about 4 km, the warm cloud layer is thick, the vertical wind shear is large at 850–500 hPa, there is warm advection at 850–700 hPa, and cold advection at 700–500 hPa, and the stratification is unstable; these conditions are conducive to the occurrence of heavy rain in the Hotan area. The ground convergence line is also the main system affecting the rainstorm in southern Xinjiang. It can be seen from the ground wind field and temperature field obtained by the encrypted automatic station in southern Xinjiang that at 04:00 on 15 June, the ground air mass near Pishan was northwesterly, with an obvious convergence line, and the intersection of cold and warm air masses was not obvious. At 12:00 on 15 June, the easterly wind prevailed in the Bazhou area, with the cold and warm air converging in a large area, and the northwest wind had convergence shear in the Hotan area. Unstable energy release is triggered, and heavy rain occurs (Figure 8b).

3.4. Mesoscale Features

Satellite cloud images can intuitively show the generation, development, and moving path of rainstorm clouds. At 06:00 on 15 June, there were developing convective clouds in the Indian Peninsula, and a northeast–southwest convective cloud system appeared in the Kashgar area, and the cloud system on the south side of the plateau showed a tendency to develop and strengthen (Figure 9a). At 10:00 on 15 June, it was in the Indian Peninsula, the cloud system in the Kashgar area strengthened and extended southward, and the cloud system on the south side of the plateau strengthened and moved northeastward (Figure 9b). At 12:00 on 15 June, the cloud system on the south side of the plateau entered the central part of Hotan and combined with the Kashi cloud system, the thickness of the cumulonimbus cloud increased, the upward movement was strengthened, and heavy precipitation was formed (Figure 9c). Following this, the cumulonimbus cloud system remained stable, and the precipitation continued (Figure 9d). The eastward movement weakened, and the accompanying heavy precipitation process also tended to end.

3.5. Analysis of Water Vapor Characteristics

Water vapor is a necessary condition for the formation of heavy rain. From the water vapor flux from the ground to 300 hPa during this heavy rain (Figure 10), the water vapor mainly comes from the Black Sea, Caspian Sea, Aral Sea, Arabian Sea, Bay of Bengal, and Central Asia. There are 3 main water vapor channels: the westward westerly belt water vapor transport channel, the southerly Indian monsoon water vapor transport channel, and the easterly low-altitude jet stream water vapor transport channel. Prior to the beginning of the rainstorm, water vapor transport from the west wind belt and water vapor transport from Central Asia over the Tianshan Mountains dominated (Figure 10a); in the initial stage of the rainstorm, the Caspian Sea and the Aral Sea water vapor flux area of large value stretched eastward, the water vapor transport from the west wind was strengthened, and the water vapor from the Arabian Sea and the Bay of Bengal was continuously transported to the plateau, but at this time, it did not enter the South Xinjiang Basin (Figure 10b). During the developmental stage of the storm, the water vapor transport in the Arabian Sea and the Bay of Bengal intensified, with large values of water vapor flux in the whole layer exceeding 1000 kg·(m·s)−1, and a steady stream of water vapor was transported to the Southland Basin (Figure 10c). During the stable maintenance phase of the storm, the steady transport of moisture from the south is blocked by the basin ridges, which partially bypass the flow to the east, and the easterly rapids in the lower levels transport the moisture to the storm area (Figure 10d). To verify the water vapor transport characteristics summarized from the reanalysis data, we used the total precipitative water data from the FY-4A satellite to analyze the anomalous distribution of water vapor during the rainstorm. Before the onset of the storm and during the initial phase, it is also evident that westerly water vapor transport is mainly dominant (Figure 11a,b), which shifts to southerly water vapor transport during the development phase of the storm (Figure 11c), after which the southerly water vapor is steadily transported, and some of the water vapor is blocked and shifted to an easterly transport (Figure 11d).
To understand the anomalous characteristics of water vapor transport in the vertical direction of the rainstorm process, we calculated the water vapor flux and water vapor flux dispersion of the precipitation process along the Lopu storm site. It can be seen from the time-height vertical profile that there is a convergence of water vapor in the middle and lower layers before the beginning of the storm, and the convergence reaches a maximum during the onset of the rainstorm, and there is a better channel for the transport of water vapor in the 850–500 hPa range (Figure 12).
To quantify water vapor transport in the storm area, we calculated the average water vapor receipts and expenditures at the four boundaries of the southern border region (South: 35°N, North: 43°N, West: 74°E, and East: 92°E) from 00:00 14 June to 12:00 16 June (Figure 13), and the northern, western, and southern borders showed a net inflow with inflows of 1.04 × 10⁷ kg·s−1, 0.62 × 10⁷ kg·s−1, 9.19 × 10⁷ kg·s−1, and the eastern boundary shows a net outflow of 4.59 × 10⁷ kg·s−1, which shows that the water vapor input from the southern boundary plays an important role. In addition, the water vapor input is much larger than the output, indicating that most of the water vapor is irradiated in the storm area, which is consistent with the water vapor transport characteristics analyzed in the previous section. By analyzing the vertical profiles of water vapor flux time-height on the four boundaries, we have a better understanding of the vertical transport of water vapor over the four boundaries of this rainstorm process. The inflow of low-level 700–500 hPa water vapor on the western and northern boundaries occurs at the initial stage of the rainstorm (Figure 14b,d), and the strong inflow area of water vapor on the southern boundary is in the range of 500–300 hPa (Figure 14c), and on the eastern boundary, the 500–300 hPa is an outflow throughout the entire period, and 700–500 hPa is an inflow area in the stage of the occurrence of the rainstorm (Figure 14a).

3.6. Numerical Simulation

3.6.1. WRF Simulation Result Verification

From the comparison of the CMORPH satellite precipitation data (Figure 15a) and the 12 h cumulative precipitation simulated via WRF (Figure 15b), the model results reproduce the center of the rainstorm focused on in this study, near Lopu County (i.e., the center of the rainstorm in the red box). The location of the center of the heaviest precipitation within the simulated heavy precipitation study area is close to the actual situation, with a slight shift to the southeast, and the simulated intensity of the precipitation is also close to the actual situation. To further verify the simulation performance of the model, we present the 500 hPa height field and wind field simulated via the WRF at 12:00 h on 15 June (Figure 16), which shows that there is wind shear and a low-pressure trough in the rainstorm area, which is very similar to the real situation. Overall, the results of the WRF model simulation of this rainstorm are relatively satisfactory.

3.6.2. Water Vapor Influence and Mechanism Analysis

Atmospheric precipitable water is considered an important indicator of atmospheric water vapor conditions and the occurrence of heavy rainfall [52]. We first analyzed the changes in atmospheric precipitable water after modifying the water vapor conditions. From the spatial distribution of atmospheric precipitable water from the control experiment (Figure 17a), an area of large values of more than 220 mm in the South Xinjiang Basin is visible, corresponding to the precipitation area of the process. For the Sense_E test, the change in atmospheric precipitable water in the precipitation area is insignificant (Figure 17b). For the Sense_W and Sense_S tests, the intensity and extent of atmospheric precipitable water in the precipitation area are significantly reduced, but when comparing the two, the reduction in the former is mainly in the Kashgar precipitation area (Figure 17c), whereas the area of the latter’s reduction corresponds to the Hotan rainstorm area (Figure 17d). For the Sense_N test, the atmospheric precipitable water is only slightly reduced in the Kashgar precipitation area (Figure 17e). For the Sense_0.5Q test, the whole layer of atmospheric precipitable water significantly decreases (Figure 17g), and for the Sense_0.25Q test, the corresponding decrease in atmospheric precipitable water is more obvious due to the greater decrease in water vapor (Figure 17f). On the contrary, the corresponding increase in atmospheric precipitable water is observed for the Sense_1.5Q and Sense_2Q tests (Figure 17h,i). This shows that our modifications to the boundary conditions work.
We further analyzed the effect of water vapor transport on precipitation, and compared to the control (Figure 15b), the Sense_E and Sense_N experiments showed insignificant reductions in the intensity and extent of precipitation (Figure 18a,d), while the Sense_W and Sense_S experiments showed significant reductions in the extent of precipitation, and the intensity of the center of the storms was significantly weakened (Figure 18b,c). In the Sense_0.5Q test, the extent of the rain band is significantly reduced, the intensity of the center of heavy precipitation is weakened, and the precipitation is uniform (Figure 18f). The Sense_0.25Q test continues to reduce the water vapor, and the extent and intensity of precipitation becomes smaller (Figure 18e). According to the Sense_1.5Q test, the precipitation’s extent and intensity significantly increase (Figure 18g). When the Sense_2Q test continues to increase in water vapor, the extent of precipitation is even larger, but the intensity is not further enhanced (Figure 18h), which may be because the water vapor has not yet been fully converted into precipitation with a certain lag. To illustrate more clearly the effect of water vapor changes on this extreme precipitation, we give the cumulative 12 h regional average precipitation of nine groups of tests (Figure 19). Relative to the control, the average precipitation of the four groups of tests, Sense_E, Sense_W, Sense_S, and Sense_N, was reduced by 15%, 27%, 34%, and 4%, respectively, which is strong proof of the fact that the southern boundary of the rainstorm process contributes the most to water vapor transport. Sense_0.25Q and Sense_0.5Q test precipitation decreased by 53% and 48%, respectively, and Sense_1.5Q and Sense_2Q test precipitation increased by 26% and 9%, respectively, which shows that the change in the water vapor content of the whole layer has a strong influence on the intensity of the precipitation.
To further clarify the mechanism of water vapor transport on the impact of this rainstorm, we analyzed the difference field of the vertical velocity and dispersion vertical profiles along 37°N between the sensitive test and the control test at 14:00 on 15 June. From the vertical velocity difference field, it is observable that for the Sense_0.5Q test, the vertical velocity decreases, and the upward motion is weakened at the location of 80°E in the center of the storm (Figure 20b). For the Sense_0.25Q test, the vertical velocity decreases even more significantly due to the greater reduction in the water vapor (Figure 20a). For the Sense_1.5Q test, the vertical velocity in the center of the storm is significantly increased, the center of the large value is located at 700 hPa, and the upward motion is significantly enhanced (Figure 20c). For the Sense_2Q test, the change in vertical velocity of the storm area is not obvious (Figure 20d). The enhancement of the uplift motion will strengthen the pumping effect of the convective zone, which will lead to strong convergence in the precipitation zone and aid in the gathering of water vapor. Low-altitude convergence and high-altitude divergence are necessary conditions for constituting upward motion, and the difference field of dispersion can provide a clearer understanding of the changes in the convergence and divergence of the high- and low-altitude air streams after the change in water vapor. For the Sense_0.5Q test, the low-level convergence and high-level divergence in the storm area weakened significantly when water vapor was reduced (Figure 21b), and for the Sense_0.25Q test, the weakening of convergence-divergence was more pronounced when water vapor was reduced further (Figure 21a). For the Sense_1.5Q test, a large-value region of convergence existed over the storm area from 850 to700 hPa when water vapor was increased, a large-value region of convergence-divergence existed from 700 to500 hPa, and the intensity of convergence-divergence was significantly increased (Figure 21c). For the Sense_2Q test, the change in irradiation was not obvious (Figure 21d). In summary, changes in water vapor affect the vertical motion and convergence and divergence of the storm area, resulting in changes in the precipitation intensity.

4. Conclusions and Discussion

In this study, using the ERA5 hour-by-hour, FNL hour-by-six-hour reanalysis data, and hour-by-hour observation data from the South Xinjiang regional automatic station, as well as the FY-2G blackbody bright temperature data, FY-4A water vapor content data, and the CMORPH satellite precipitation data, we firstly address the weather situation of the rainstorm process that occurred on 14–17 June 2021, in the extremely arid South Xinjiang Basin. Physical mechanisms, mesoscale characteristics, and water vapor sources and expenditures are initially discussed. Subsequently, a water vapor sensitivity analysis of the rainstorm process is carried out via the WRF numerical model to explore the impacts and mechanisms of water vapor on the rainstorm, and the following conclusions are mainly drawn:
(1)
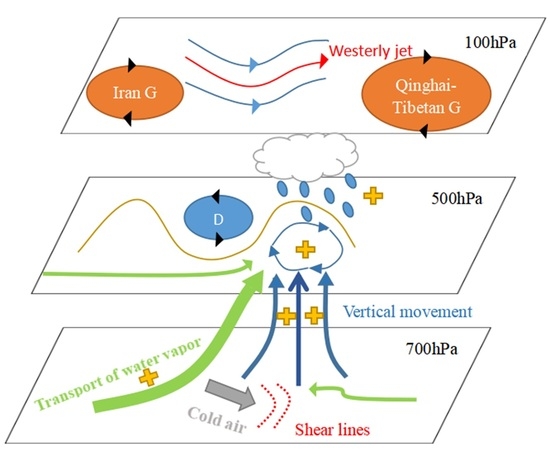
The rainstorm weather in southern Xinjiang occurred in 100 hPa South Asian high pressure was “east high west low” double distribution with a large-scale circulation background, 200 hPa high altitude southwest jet, 500 hPa Upper the Lake Balkhash vortex, the Iranian and the Ural Mountains have a ridge of high pressure, at 700 hPa there are troughs and wind shear, and the ground convergence led to the rainstorm. The configuration of low-level convergence and high-level divergence and the vertical upward motion provide favorable dynamic conditions for the rainstorm. The high temperature and high humidity at low levels are favorable for the establishment and maintenance of convectively unstable layer junctions over the rainstorm area. The TBB low value corresponds well with the rainfall fallout area.
(2)
The water vapor from heavy rainfall came primarily from the Black Sea, the Caspian Sea, the Aral Sea, the Arabian Sea, the Bay of Bengal, and Central Asia; the moisture arrived in the Southland Basin with a westerly, southwesterly, and easterly path. The northern, western, and southern boundaries show a net inflow, and the eastern boundary is a net outflow. Water vapor is mainly imported into the southern basin from 500 to 300 hPa at the southern boundary and 700–500 hPa at the western, northern, and eastern boundaries, and exported from 500 to 300 hPa at the eastern boundary.
(3)
Changes in water vapor content have a strong influence on the intensity and extent of precipitation, with the southern boundary water vapor transport contributing the most to precipitation during this storm. When water vapor increases (decreases) in the storm area, upward motion is enhanced (weakened), low-level convergence upper-level dispersion is enhanced (weakened), water vapor transport to the middle and upper levels increases (decreases), and precipitation increases (decreases).
Unlike previous studies, this study elucidates the contribution of Indian Ocean water vapor transport through the southern boundary to heavy rainfall in southern Xinjiang. Although only one individual case was selected for analysis, it was found that it was not limited to this through observational statistics. The conclusions will be verified via synthetic analysis in the future to see if they are applicable to heavy rainfall in the southern border region. We initially revealed the mechanism of water vapor influence on heavy rainfall in southern Xinjiang via numerical simulation experiments; however, there are still some problems, such as the insufficiently high resolution of the model and incomplete analysis of the dynamical effects affecting the precipitation. In the future, we will carry out a higher-resolution simulation and further in-depth discussion. This rainstorm process occurred in the transition zone between the Tibetan Plateau and the desert area. The plateau and desert terrain and geomorphology are complex, and the role of special topography and underlying surface for precipitation in the arid area has not been studied enough; these will also need to be further discussed in the future.

Author Contributions

Conceptualization, C.J. and Q.H. (Qing He); methodology, C.J. and Q.H. (Qian Huang); software, Q.H. (Qian Huang); validation, C.J.; formal analysis, C.J. and Q.H. (Qing He); resources, Q.H. (Qian Huang); data curation, Q.H. (Qian Huang); writing—original draft preparation, C.J.; writing—review and editing, C.J.; visualization, C.J.; project administration, Q.H. (Qing He). All authors have read and agreed to the published version of the manuscript.

Funding

This research was funded by the National Natural Science Foundation of China, grant number 42030612; the Third Xinjiang Scientific Expedition and Research program, grant number 2021xjkk030501; and the Second Tibetan Plateau Scientific Expedition and Research (STEP) program, grant number 2019QZKK010206. The APC was funded by Qing He.

Data Availability Statement

Some observation data in this paper were obtained from the Xinjiang Meteorological Information Center. These data are limited and can be available from the author with permission. The ERA5 reanalysis data are available at https://cds.clima-te.copernicus.eu/cdsapp#!/dataset/reanalysis-era5-pressure-levels (accessed on 19 July 2023). The FNL reanalysis data are available at https://rda.ucar.edu/datasets/ds083.3/ (accessed on 19 July 2023). The FY-2G and FY-4A satellite data are available at http://satellite.nsmc.org.cn/Po-rtalSite/Data/DataView.aspx (accessed on 19 July 2023). The CMORPH satellite data are available at https://www.ncei.noaa.gov/data/cmorph-high-resolution-global-precipitation-estimates/ac-cess/30min/8km/ (accessed on 19 July 2023). The terrain data can be obtained from https://www.ngdc.noaa.gov/mgg/global/relief/ETOPO2/ETOPO2v2-2006/ETOPO2v2c/netCDF/ (accessed on 19 July 2023).

Acknowledgments

We would like to express heartfelt thanks to the Urumqi Desert Meteorological Institute of China Meteorological Administration for their support. We would like to thank Suxiang Yao, School of Atmospheric Science, Nanjing University of Information Science and Technology, for her support in revising the manuscript.

Conflicts of Interest

The authors declare no conflict of interest.

References

  1. Yang, L.M.; Li, X.; Zhang, G.X. Some advances and problems in the study of heavy rain in Xinjiang. Clim. Environ. Res. 2011, 16, 188–198. [Google Scholar]
  2. Zhang, J.L.; Yang, X.; Shi, J.J. Analysis of the Influence of the Qinghai-Xizang Plateau Weather System on a Rare Rainstorm Process on the Northern Slope of Kunlun Mountain. Plateau Meteorol. 2021, 40, 1002–1011. [Google Scholar]
  3. Wang, S.; Zhang, M.; Sun, M.; Wang, B.; Li, X. Changes in precipitation extremes in alpine areas of the Chinese Tianshan Mountains, central Asia, 1961–2011. Quat. Int. 2013, 311, 97–107. [Google Scholar] [CrossRef]
  4. Zeng, J.; Guo, F.; Zhao, C.; Sun, Z.Y.; Zhao, Y.J. Climate change of small oases in the southern margin of Taklimakan Desert in recent 50 years. Arid Zone Geogr. 2014, 37, 948–957. [Google Scholar]
  5. Han, Y.H.; Ma, Z.G.; Yang, Q.; Pan, Z.H. Changing characteristics of daytime and nighttime precipitation in Xinjiang under global warming. Clim. Environ. Res. 2014, 19, 763–772. [Google Scholar]
  6. Wang, S.P.; Jiang, F.Q.; Wu, X.B.; Hu, R.J. Temporal and spatial variability of the extreme precipitation indices overthe arid regions in Northwest China from 1961 to 2010. J. Glaciol. Geocryol. 2014, 36, 318–326. [Google Scholar]
  7. Jin, C.; He, Q.; Huang, Q. A review on rainstorm research in southern Xinjiang. Trans Atmos Sci 2023, 46, 82–96. [Google Scholar]
  8. Chen, Y.; Ma, Y. Spatial and temporal characteristics of flood and rainstorm disaster in Xinjiang. Arid Land Geogr. 2021, 44, 1515–1524. [Google Scholar]
  9. Duan, W.; He, B.; Takara, K.; Luo, P.; Hu, M.; Alias, N.E.; Nover, D. Changes of precipitation amounts and extremes over Japan between 1901 and 2012 and their connection to climate indices. Clim. Dyn. 2015, 45, 2273–2292. [Google Scholar] [CrossRef]
  10. Jiang, J.; Zhou, T.; Chen, X.; Zhang, L. Future changes in precipitation over Central Asia based on CMIP6 projections. Environ. Res. Lett. 2020, 15, 054009. [Google Scholar] [CrossRef]
  11. Jin, C.; He, Q.; Huang, Q. Extreme Summer Precipitation Characteristics and Associated Water Vapor Transport in Southern Xinjiang. Water 2023, 15, 2361. [Google Scholar] [CrossRef]
  12. Zhang, J.L.; Li, N.; Qin, H.; Li, J.G.; Liu, J.; Liu, W.; Mikribanu·eziz. The observational analysis and water vapor characteristics of a rainstorm in Xinjiang. Torrential Rain Disasters 2016, 35, 537–545. [Google Scholar]
  13. Mo, S.Q.; Li, Y.H. Analysis of the water vapor characteristics and trigger mechanism for a typical heavy rainstorm in the extreme arid region of the southern Xinjiang. Plateau Meteorol. 2023, 42, 82–97. [Google Scholar]
  14. Lv, X.S.; Zhou, Y.M.; Yu, X.J.; Yu, B.X.; Wang, X. Temporal and spatial variation characteristics of rainstorm flood disaster loss in Xinjiang during 1961-2019. Desert Oasis Meteorol. 2021, 15, 42–49. [Google Scholar]
  15. Wang, X.Q.; Wang, X. Spatial distribution and temporal variation characteristics of rainstorm flood disasters with different intensities in southern Xinjiang from 1980 to 2019. J. Glaciol. Geocryol. 2021, 43, 1818–1828. [Google Scholar]
  16. Ding, Y.H.; Hu, G.Q. A study on water vapor budgetover China during the 1998 severe flood periods. Acta Meteor. Sin. 2003, 61, 129–145. [Google Scholar]
  17. Li, J.L.; Li, Z.R.; Yang, J.C.; Shi, Y.Z.; Fu, J. Analyses on spatial distribution and temporal variation of atmosphere water vapor over Northwest China in summer of later 10 years. Plateau Meteorol. 2012, 31, 1574–1581. [Google Scholar]
  18. Xu, X.; Shi, X.; Wang, Y.; Peng, S.; Shi, X. Data analysis and numerical simulation of moisture source and transport associated with summer precipitation in the Yangtze River Valley over China. Meteorol. Atmos. Phys. 2008, 100, 217–231. [Google Scholar] [CrossRef]
  19. Wang, K.L.; Jiang, H.; Zhao, H.Y. Atmospheric water vapor transport from westerly and monsoon over the Northwest China. Adv. Water Sci. 2005, 16, 432–438. [Google Scholar]
  20. Wei, N.; Gong, Y.F.; Sun, X.; Fang, J.G. Variation of precipitation and water vapor transport over the Northwest China from 1959 to 2005. J. Desert Res. 2010, 30, 1450–1457. [Google Scholar]
  21. Huang, W.; Chang, S.-Q.; Xie, C.-L.; Zhang, Z.-P. Moisture sources of extreme summer precipitation events in North Xinjiang and their relationship with atmospheric circulation. Adv. Clim. Change Res. 2017, 8, 12–17. [Google Scholar] [CrossRef]
  22. Yang, L.M.; Liu, J. Some advances of water vapor research in Xinjiang. J. Nat. Hazards 2018, 27, 1–13. [Google Scholar]
  23. Yang, L.M. Research on a case of heavy rain in Xinjiang from South Asia High abnormity. Meteor Mon 2003, 29, 21–25. [Google Scholar]
  24. Zhang, Y.H.; Wang, Y. Analysis of heavy rainfall in southern Hami, Xinjiang. Meteor Mon 2004, 30, 41–43. [Google Scholar]
  25. Yang, L.M.; Zhang, Y.H.; Tang, H. Analyses on water vapor characteristics in three heavy rainstorm processes of Xinjiang in July 2007. Plateau Meteorol. 2012, 31, 963–973. [Google Scholar]
  26. Zhang, Y.H.; Chen, C.Y.; Yang, L.M.; Jia, L.H.; Yang, X. Cause analysis on rare rainstorm in west of southern Xinjiang. Plateau Meteorol. 2013, 32, 191–200. [Google Scholar]
  27. Zhang, Y.H.; Li, H.Y.; Liao, X.L.; Abulimiti; Yu, B.X. Analysis of continuous rainstorm circulation background and the dynamic process of synoptic scale in west of southern Xinjiang. Meteor Mon 2015, 41, 816–824. [Google Scholar]
  28. Zhang, J.L.; Wei, R.Q.; Yang, L. Comparative analysis of two rare heavy rainfall area and intensityover the southern Xinjiang in 2013. Desert Oasis Meteorol. 2014, 8, 1–9. [Google Scholar]
  29. Liu, G.Q.; Tong, X.Y.; Deng, J.; Zhou, X.Y.; Zhou, C.L.; Liu, C.Y. Analysis of water vapor transport characteristics in Xinjiang based on the lagrangian and euler method. Desert Oasis Meteorol. 2019, 13, 22–31. [Google Scholar]
  30. Zeng, Y.; Yang, L.M.; Zhang, Y.X. Simulation of water vapor transport trajectories of a heavy rain in west of Xinjiang. Desert Oasis Meteorol. 2017, 11, 47–57. [Google Scholar]
  31. Mou, H.; Zhao, L.; Wang, X.; An, D.W. Water vapor source analysis of a severe torrential rain in the west of southern Xinjiang based on the Lagrangian Method. J. Glaciol. Geocryol. 2021, 43, 1157–1165. [Google Scholar]
  32. Bei, N.F.; Sun, J.H. Effect of initial data and physical processes on the heavy rainfall prediction in July 1998. Clim. Environ. Res. 2002, 7, 386–396. [Google Scholar]
  33. Xu, G.Q.; Zhang, Y.X. The Heavy Rain′s Vapor Sources and Vapor Sensitivity Simulation in August 1996. Meteor. Mon. 1999, 25, 12–16. [Google Scholar]
  34. Li, M.; Zhang, F.; Zhang, Q.; Harrington, J.Y.; Kumjian, M.R. Nonlinear response of hail precipitation rate to environmental moisture content: A real case modeling study of an episodic midlatitude severe convective event. J. Geophys. Res. Atmos. 2017, 122, 6729–6747. [Google Scholar] [CrossRef]
  35. Sun, J.H.; Zheng, L.L.; Zhao, S.X. Impact of moisture on the organizational mode and intensity of squall lines determined through numerical experiments. Chin. J. Atmos. Sci. 2014, 38, 742–755. [Google Scholar]
  36. Zheng, L.L.; Sun, J.H. Characteristics of synoptic and surface circulation of mesoscale convective Systems in dry and moist environmental conditions. Chin. J. Atmos. Sci. 2013, 37, 891–904. [Google Scholar]
  37. Wang, Y.H.; Xu, G.Q.; Jia, L.H.; Zhao, Y. Numerical simulation analysis on impact of Taihang Mountain and vapor sensitivity on the 21 July 2012 extremely severe rainstorm in Beijing. Meteor. Mon. 2015, 41, 389–400. [Google Scholar]
  38. Yuan, Y.L.; Zuo, H.C.; Dong, L.X.; Zhu, Y.; Wang, S.X.; Yuan, Y. Numerical simulation of the effect of elevation and water vapor on “7.13” rainstorm in Shanxi Province. J. Arid Meteorol. 2015, 33, 291–302. [Google Scholar]
  39. Lu, P.; Yu, R.C.; Zhou, T.J. Numerical simulation on the sensitivity of heavy rainfall over the western Sichuan Basin to initial water vapor condition. Chin. J. Atmos. Sci. 2009, 33, 241–250. [Google Scholar]
  40. Song, W.W.; Li, G.P.; Tang, Q.K. Numerical simulation of the effect of heating and water vapor on two cases of plateau vortex. Chin. J. Atmos. Sci. 2012, 36, 117–129. [Google Scholar]
  41. Kang, L.; Shen, T.L.; Cai, X.L.; Pu, J.G. Numerical simulation experiment about a typical heavy rain process on the east side of Qinghai-Xizang Plateau. Plateau Meteorol. 2004, 23, 37–45. [Google Scholar]
  42. Guo, X.H.; Li, Y.W.; Cai, L. Simulation study of convections in low layer embedding into upper layer stratiform cloud systems. Chin. J. Atmos. Sci. 2015, 39, 677–691. [Google Scholar]
  43. Zhang, J.J.; Wang, Y.Q.; Zhong, W. Impact of vertical wind shear and moisture on the organization of squall lines. Chin. J. Atmos. Sci. 2016, 40, 689–702. [Google Scholar]
  44. Tian, M.; Wu, B.; Huang, H.; Zhang, H.; Zhang, W.; Wang, Z. Impact of water vapor transfer on a Circum-Bohai-Sea heavy fog: Observation and numerical simulation. Atmos. Res. 2019, 229, 1–22. [Google Scholar] [CrossRef]
  45. Ren, Z.H.; Zhao, P.; Zhang, Q.; Zhang, Z.F.; Cao, L.J.; Yang, Y.R.; Zou, F.L.; Zhao, Y.F.; Zhao, H.M.; Chen, Z. Quality Control Procedures for Hourly Precipitation Data from Automatic Weather Stations in China. Meteor Mon 2010, 36, 123–132. [Google Scholar]
  46. Xu, X.H.; Yu, X.; Zhu, Y.N.; Liu, G.H.; Dai, J. Cloud microphysical properties of a tornado revealed by FY-2G geostationary satellite. Plateau Meteorol. 2018, 37, 1737–1748. [Google Scholar]
  47. Song, Y.F.; Yan, W.B.; Peng, J. Evaluation and analysis of total precipitable water derived from FY-4A satellite data over Sichuan Province. Plateau Mt. Meteorol. Res. 2022, 42, 41–47. [Google Scholar]
  48. Liu, S.N.; Wang, J.; Wang, H.J. Analysis of the monitoring ability of high-resolution satellites for the "21·7" heavy rain in Henan. Acta Meteorol. Sin. 2022, 80, 765–776. [Google Scholar]
  49. Trenberth, K.E. Climate diagnostics from global analyses: Conservation of mass in ECMWF analyses. J. Clim. 1991, 4, 707–722. [Google Scholar] [CrossRef]
  50. Xu, D.; Kong, Y.; Wang, C.H. Changes of water vapor budget in arid area of Northwest China and its relationship with precipitation. J. Arid Meteorol. 2016, 34, 431–439. [Google Scholar]
  51. Xu, K.; Zhong, L.; Ma, Y.; Zou, M.; Huang, Z. A study on the water vapor transport trend and water vapor source of the Tibetan Plateau. Theor. Appl. Climatol. 2020, 140, 1031–1042. [Google Scholar] [CrossRef]
  52. Yang, Y.; Ke, L.P.; Nie, X.; Zhang, C.G.; Zhang, Z.D.; Shi, Q.W. Study on the Relationship between Atmospheric Precipitable Amount and Heavy Rain in Bijie Area. Mid Low Latit. Mt. Meteorol. 2022, 46, 63–68. [Google Scholar]
Figure 1. Topography of the study area (enclosed by a solid black line) and surrounding areas (unit: m).
Remotesensing 15 04082 g001
Figure 2. Model simulation area; colored contour lines represent terrain elevation (unit: m).
Remotesensing 15 04082 g002
Figure 3. Cumulative rainfall at stations in southern Xinjiang from 12:00 on 14 June to 0:00 on 17 June 2021 (unit: mm).
Remotesensing 15 04082 g003
Figure 4. Hourly precipitation at 3 storm centers from 12:00 on 14 June to 00:00 on 17 June 2021 (unit: mm).
Remotesensing 15 04082 g004
Figure 5. 00:00 on 14 June 2021 (a,c,e,g) and 12:00 on 15 June, 2021 (b,d,f,h); 100 hPa (a,b), 500 hPa (e,f), 700 hPa (g,h) geopotential height fields (shadow, unit: dagpm), superimposed wind field (wind barbs, unit: m·s−1); 200 hPa (c,d) wind field (arrow, unit: m·s−1), westerly jet (blue contour, unit: m·s−1), and zonal wind (shadow, unit: m·s−1).
Remotesensing 15 04082 g005aRemotesensing 15 04082 g005b
Figure 6. Vertical velocity (shading, unit: Pa/s) and divergence (contour line, unit: 10–5 s−1) along 37°N at 06:00 on 15 June 2021 (a) and at 12:00 on 15 June 2021; (b) vertical section. The black triangle mark represents the location of Luopu station, and the pink shadow is the topography.
Remotesensing 15 04082 g006
Figure 7. T-lnP diagram of Hetian Sounding Station at 12:00 on 15 June 2021 (the solid red line is the temperature curve, the solid green line is the dew point curve, the solid black line is the status curve,the red dotted lines are dry adiabatic curve, the blue dotted lines are wet adiabatic curve, the green dotted lines are isosaturated specific humidity curve, and the wind barbs indicates wind direction and wind speed).
Remotesensing 15 04082 g007
Figure 8. 04:00 on 15 June 2021 (a), 12:00 on 15 June 2021; (b) ground wind field (streamline) and temperature field (scattered points, unit: °C) in southern Xinjiang. The red triangle indicates three rainstorm locations (from left to right are Pishan, Luopu, and Yutian). The solid red lines indicate geographic boundaries.
Remotesensing 15 04082 g008
Figure 9. Evolution of FY-2G satellite TBB (unit: K) at 06:00 (a), 10:00 (b), 12:00 (c) and 21:00 (d) on 15 June 2021.(The solid blue lines indicate geographic boundaries).
Remotesensing 15 04082 g009
Figure 10. Ground–300 hPa water vapor fluxes (filled colors, arrows, unit: kg/(m·s)) for 14 June 2021 at 00:00 (a), 14 June at 18:00 (b), 15 June at 6:00 (c), and 16 June at 00:00 (d).
Remotesensing 15 04082 g010
Figure 11. Total precipitative water (shadow, unit: g/kg) and 500 hPa wind field (arrows, unit: m·s−1) at 0:00 on 14 June (a), 18:00 on 14 June (b), 6:00 on 15 June (c), and 0:00 on 16 June 2021 (d).
Remotesensing 15 04082 g011
Figure 12. Time-height vertical profiles of water vapor flux (filled colors, unit: g·cm−1·hPa−1·s−1), water vapor flux dispersion (contours, unit: 10−8·g·cm−2·hPa−1·s−1), and wind field (wind barbs, unit: m·s−1) along (36.99°N, 80.09°E) on 14–16 June 2021.
Remotesensing 15 04082 g012
Figure 13. Mean water vapor transport (unit: ×107 kg·s−1) at the four boundaries from 0:00 14 June to 12:00 16 June 2021 (The red rectangles represent the four boundaries, and the yellow arrows indicate inflows and outflows).
Remotesensing 15 04082 g013
Figure 14. Time-height vertical profiles of water vapor flux (filled colors, unit: g·cm−1·hPa−1·s−1) and wind field (unit: m·s−1) at the four boundaries of east (a), west (b), south (c), and north (d), with topographic shielding in grey shading, 14–16 June 2021.
Remotesensing 15 04082 g014
Figure 15. Distribution of cumulative precipitation (unit: mm) at CMORPH (a) and Control (b) from 12:00 15 June 2021 to 23:00 15 June 2021.
Remotesensing 15 04082 g015
Figure 16. 500 hPa geopotential height field (contours, unit: gpm) and wind field (unit: m·s−1) for the control test at 12:00 on 15 June 2021, with the blue line showing the geographic boundary.
Remotesensing 15 04082 g016
Figure 17. Control (a), Sense_E (b), Sense_W (c), Sense_S (d), Sense_N (e), Sense_0.25Q (f), Sense_0.5Q (g), Sense_1.5Q (h), and Sense_2Q (i) atmospheric precipitable precipitation (shaded, unit: mm) spatial distribution.
Remotesensing 15 04082 g017
Figure 18. Cumulative 12 h precipitation (unit: mm) for 15 June 2021, 12:00–23:00 Sense_E (a), Sense_W (b), Sense_S (c), Sense_N (d), Sense_0.25Q (e), Sense_0.5Q (f), Sense_1.5Q (g), and Sense_2Q (h).
Remotesensing 15 04082 g018aRemotesensing 15 04082 g018b
Figure 19. Cumulative 12 h regional average precipitation (unit: mm) for the control and sensitivity tests, with the regional extent of the red box in Figure 18a.
Remotesensing 15 04082 g019
Figure 20. Sense_0.25Q (a), Sense_0.5Q (b), Sense_1.5Q (c), and Sense_2Q (d) versus control trials at 14:00 on 15 June 2021 along the 37°N vertical velocity difference field.
Remotesensing 15 04082 g020
Figure 21. Sense_0.25Q (a), Sense_0.5Q (b), Sense_1.5Q (c), and Sense_2Q (d) versus control trials at 14:00 on 15 June 2021 along the 37°N divergence difference field.
Remotesensing 15 04082 g021
Table 1. Physical parameters and variables used in WRF.
Physical ParameterNamelist VariableModel/Scheme
Microphysicsmp_physicsWRF Single-Moment 6-class scheme
Longwave radiationra_lw_physicsRRTMG scheme
Shortwave radiationra_sw_physicsRRTMG scheme
Surface Layersf_sfclay_physicsMM5 similarity
Land surfacesf_surface_physicsNoah Land Surface Model
Planetary Boundary layerbl_pbl_physicsYonsei University scheme
Cumulus Parameterizationcu_physicsKain–Fritsch scheme
Table 2. Water vapor test names and schemes.
Test NameTest Scheme
ControlControl test
Sense_EShut down the water vapor transport at the eastern boundary
Sense_WShut down the water vapor transport at the western boundary
Sense_SShut down the water vapor transport at the southern boundary
Sense_NShut down the water vapor transport at the northern boundary
Sense_0.25QThe entire layer of water vapor in the entire area is reduced to 25% of the original
Sense_0.5QThe entire layer of water vapor in the entire area is reduced to 50% of the original
Sense_1.5QThe entire layer of water vapor in the entire area is increased to 150% of the original
Sense_2QThe entire layer of water vapor in the entire area is increased to 200% of the original
Disclaimer/Publisher’s Note: The statements, opinions and data contained in all publications are solely those of the individual author(s) and contributor(s) and not of MDPI and/or the editor(s). MDPI and/or the editor(s) disclaim responsibility for any injury to people or property resulting from any ideas, methods, instructions or products referred to in the content.

