

Long-Tailed Object Detection for Multimodal Remote Sensing Images

Laboratory for Big Data and Decision, National University of Defense Technology, Changsha 410073, China
*
Author to whom correspondence should be addressed.
†
These authors contributed equally to this work.
Remote Sens. 2023, 15(18), 4539; https://0-doi-org.brum.beds.ac.uk/10.3390/rs15184539
Submission received: 12 August 2023
/
Revised: 7 September 2023
/
Accepted: 12 September 2023
/
Published: 15 September 2023
(This article belongs to the Special Issue Artificial Intelligence-Driven Methods for Remote Sensing Target and Object Detection)
Abstract
:With the rapid development of remote sensing technology, the application of convolutional neural networks in remote sensing object detection has become very widespread, and some multimodal feature fusion networks have also been proposed in recent years. However, these methods generally do not consider the long-tailed problem that is widely present in remote sensing images, which limits the further improvement of model detection performance. To solve this problem, we propose a novel long-tailed object detection method for multimodal remote sensing images, which can effectively fuse the complementary information of visible light and infrared images and adapt to the imbalance between positive and negative samples of different categories. Firstly, the dynamic feature fusion module (DFF) based on image entropy can dynamically adjust the fusion coefficient according to the information content of different source images, retaining more key feature information for subsequent object detection. Secondly, the instance-balanced mosaic (IBM) data augmentation method balances instance sampling during data augmentation, providing more sample features for the model and alleviating the negative impact of data distribution imbalance. Finally, class-balanced BCE loss (CBB) can not only consider the learning difficulty of specific instances but also balances the learning difficulty between categories, thereby improving the model’s detection accuracy for tail instances. Experimental results on three public benchmark datasets show that our proposed method achieves state-of-the-art performance; in particular, the optimization of the long-tailed problem enables the model to meet various application scenarios of remote sensing image detection.
1. Introduction
Remote sensing [1] is a technology that obtains information about the earth by using sensors mounted on aircraft or spacecraft to receive electromagnetic signals from the earth. Among them, remote sensing images are an important product of remote sensing technology, which can provide rich geographic information and help people better understand and manage the earth. In recent years, with the rapid development of aerospace technology, remote sensing technology has also reached a new stage [2]. It is mainly manifested in two aspects: One is that the use scenarios are more extensive, such as meteorology, agriculture, environment, disasters, etc. The second is that the data obtained are more abundant, such as multi-time and multi-band images. Faced with these massive data, how to analyze and extract semantic information from them has become an important research topic, which includes how to perform efficient and accurate object detection. Object detection is an important task in the field of computer vision, which aims to locate and identify the category of objects in an image. At present, a large number of studies [3,4,5,6,7] have been proposed. Object detection has a wide range of applications in remote sensing images, such as military reconnaissance [8], urban planning [9], traffic monitoring [10], etc. However, object detection in remote sensing images also faces some challenges.
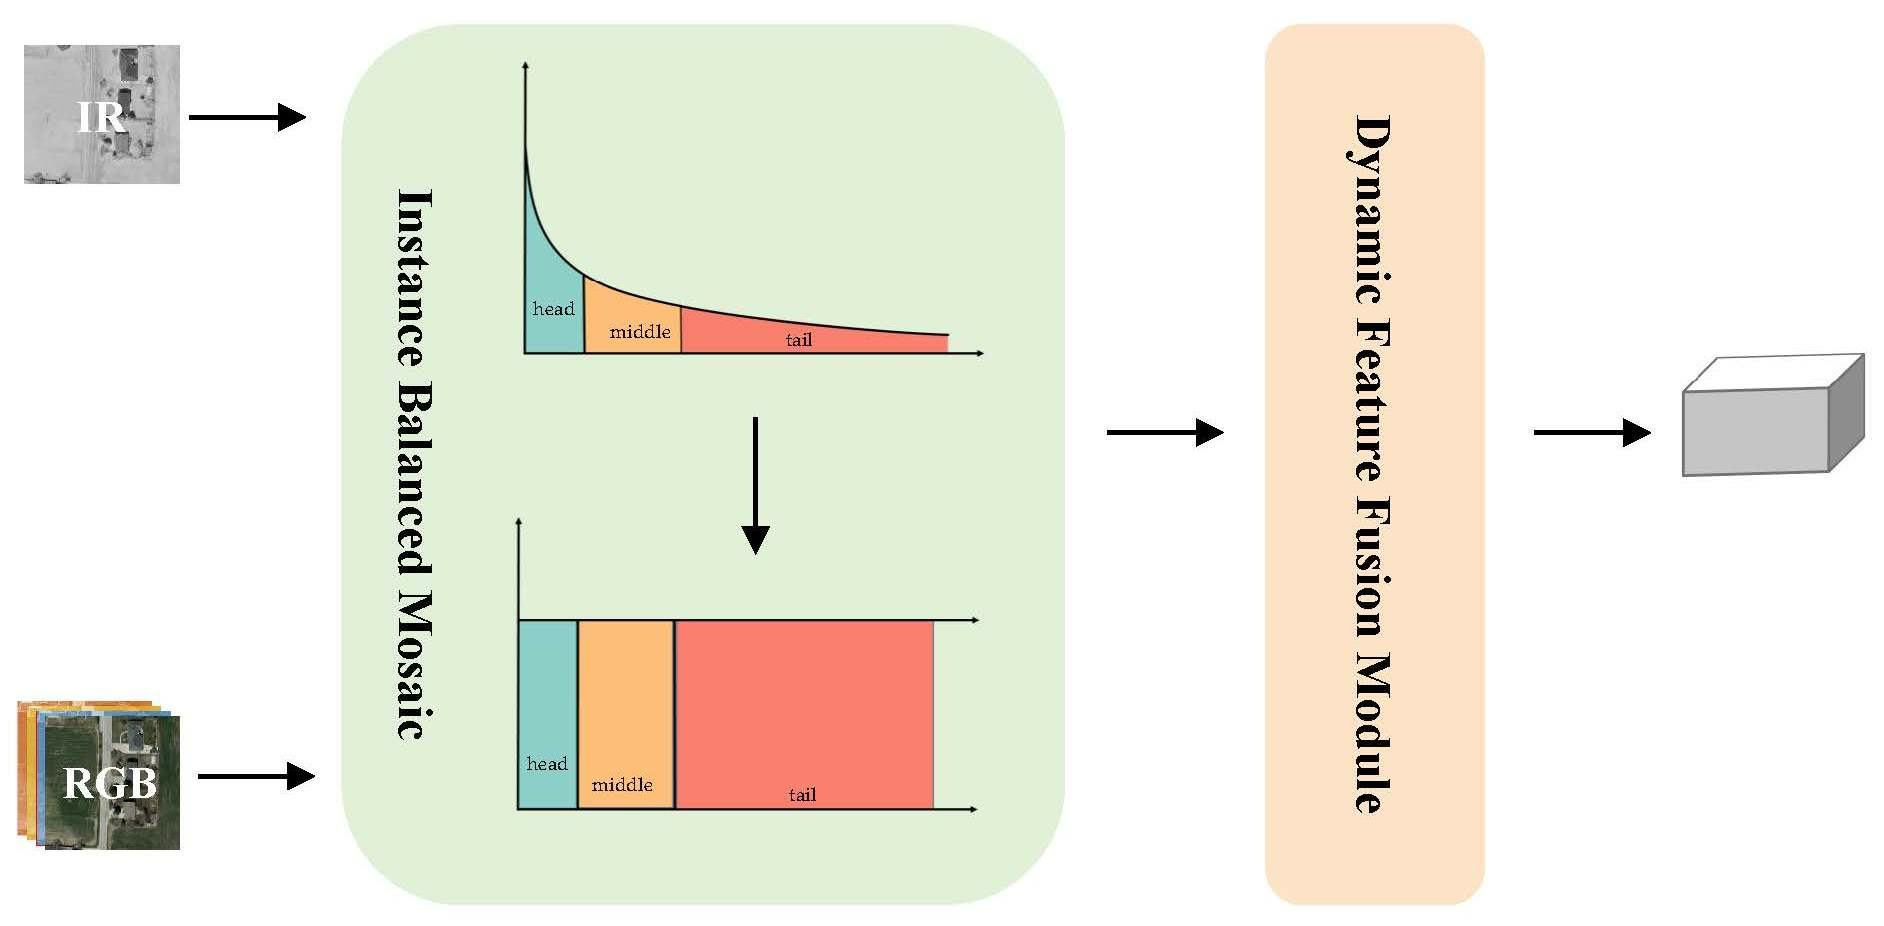
The first challenge is how to efficiently fuse multimodal information. Remote sensing images acquired from a long distance are affected by multiple factors such as clouds, fog and lighting conditions. Using only a single band of sensor data will result in low detection accuracy, which will greatly limit the use scenarios of object detection algorithms. Most of the current [3,4,5] object detection techniques are mainly oriented to single modalities, such as visible light images or infrared images. If multiple wavelengths of remote sensing images can be fused, the detection accuracy can be greatly improved by complementing the advantages of each modality. As shown in Figure 1, in good lighting conditions during the day, visible light images can provide more color and texture information, while infrared images can show clearer object contours at night. Unfortunately, image data obtained from different sensors have problems such as different resolutions, different amounts of information carried and image misalignment [11], so simply combining remote sensing images cannot improve detection performance.
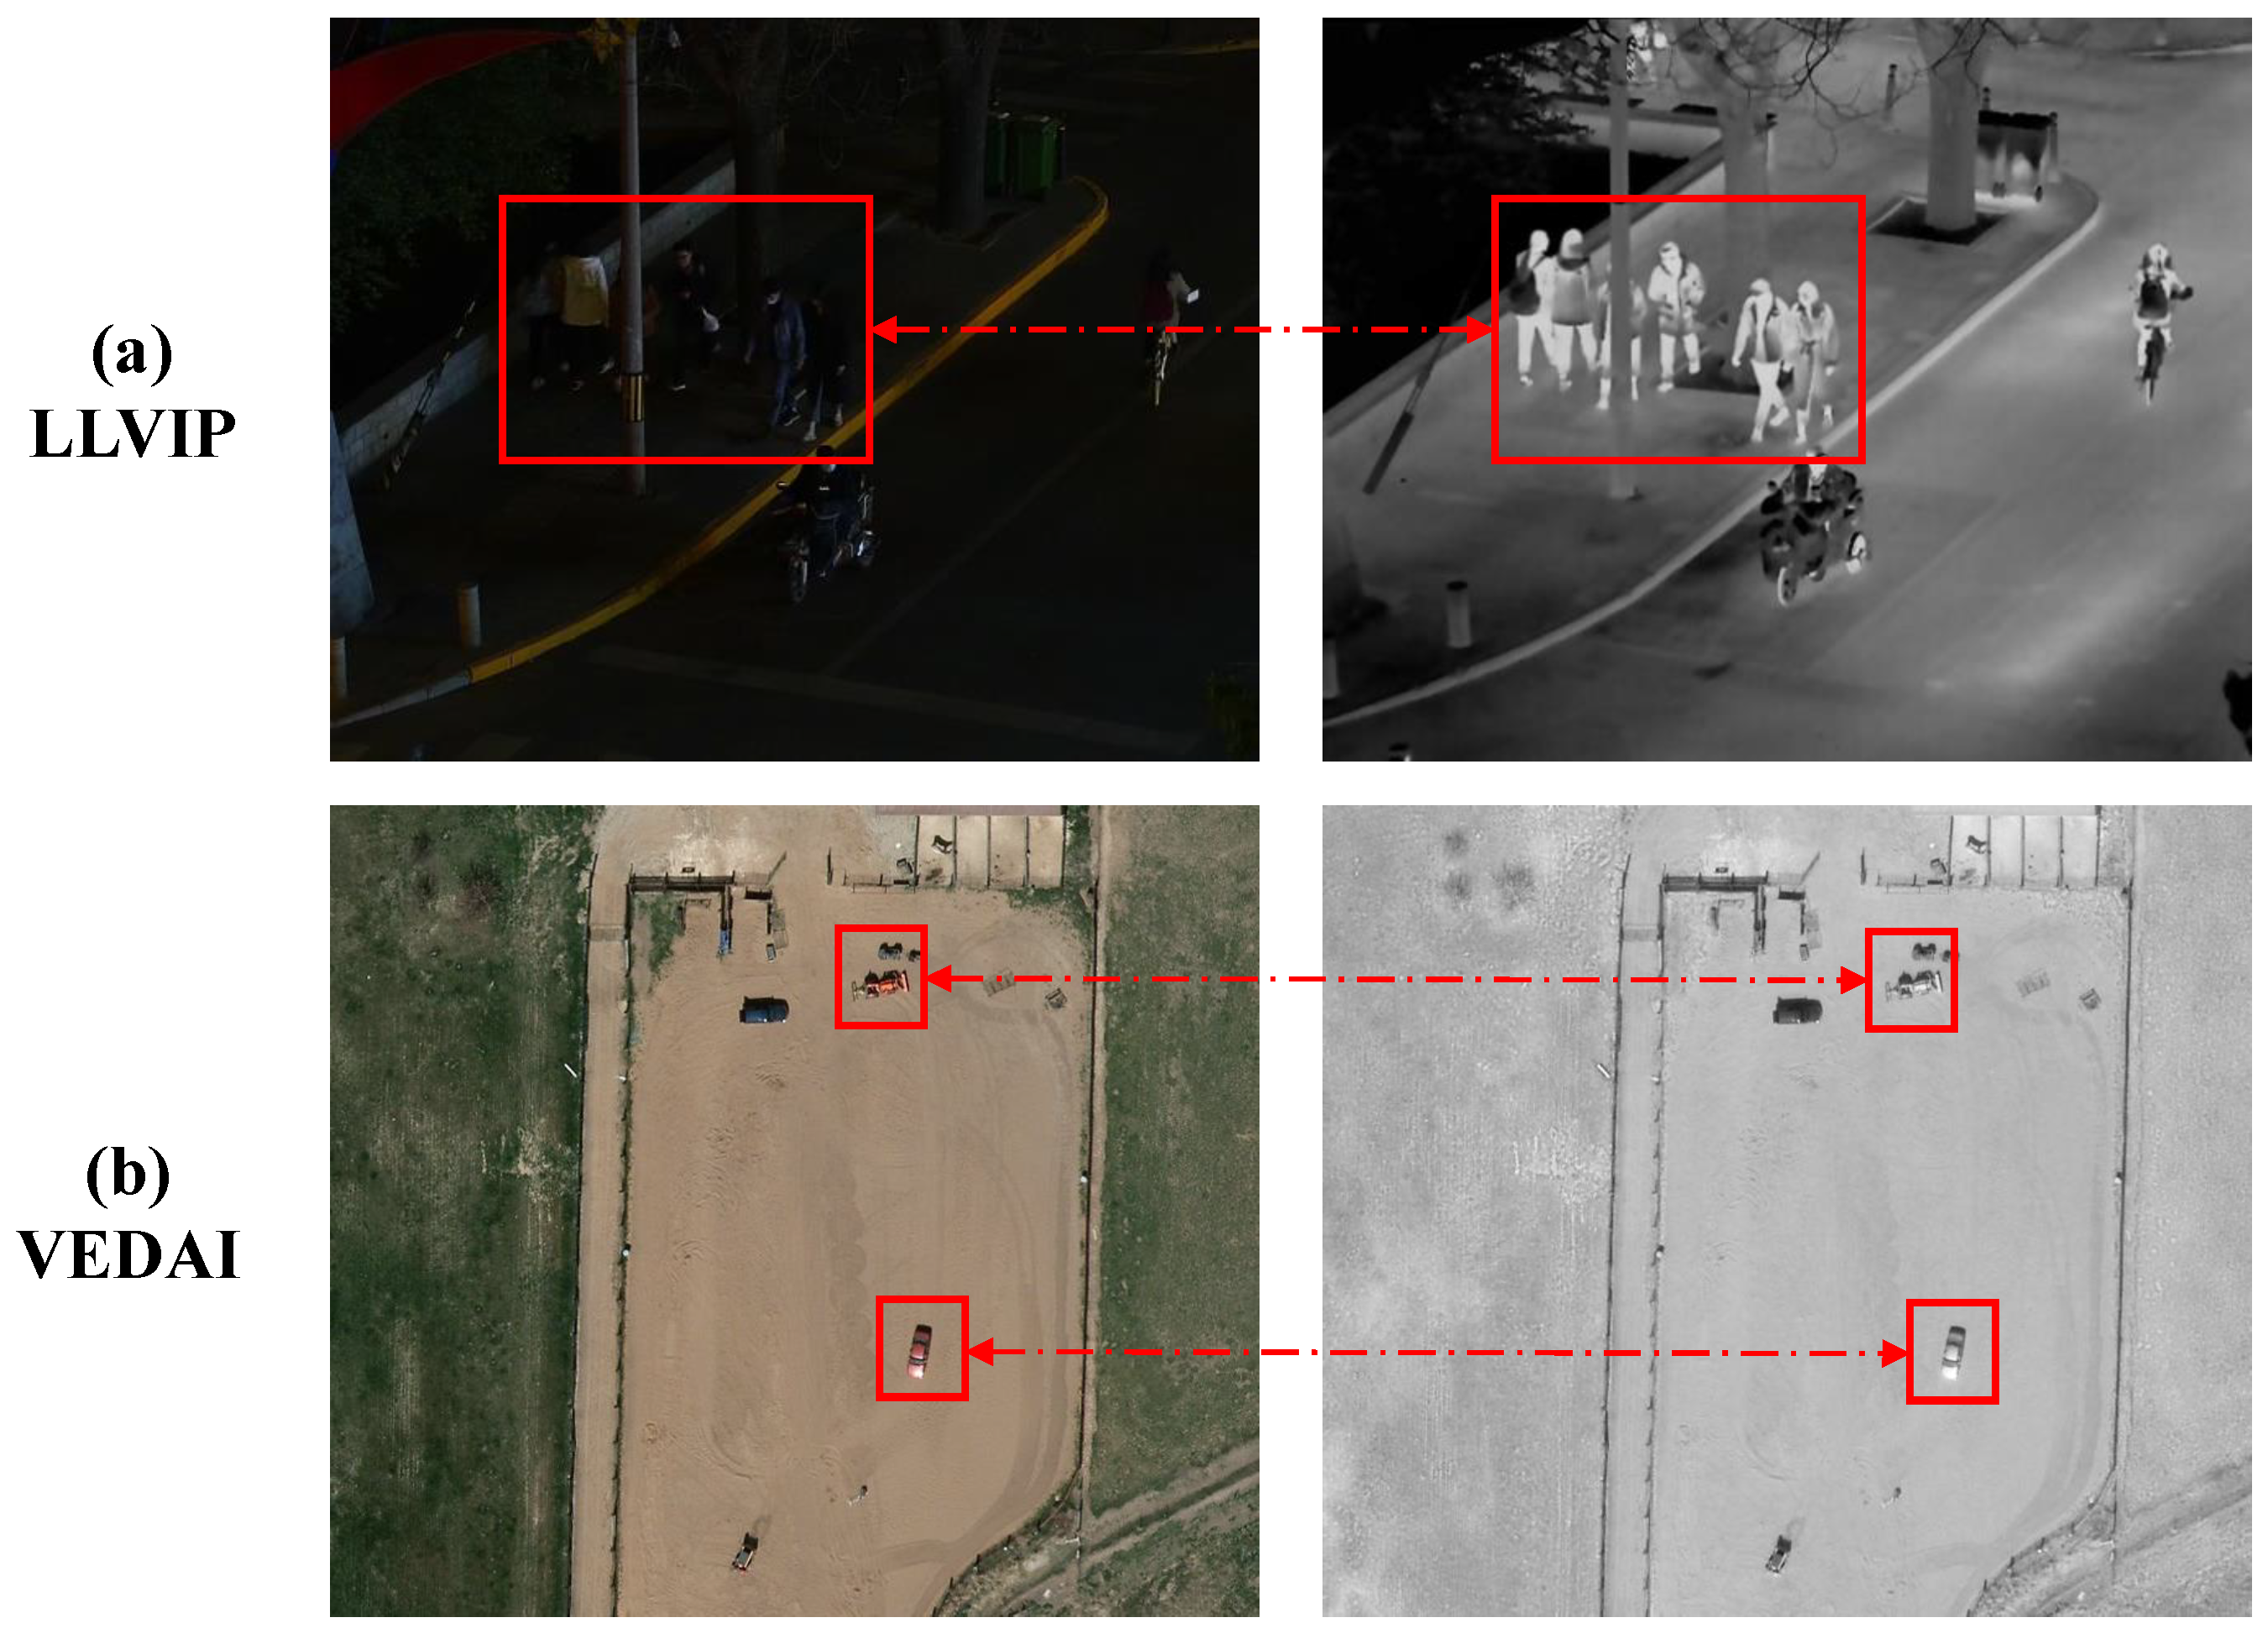
The second challenge is how to deal with long-tailed data with natural state distribution. Real-world data often show an open long-tailed distribution [12], as shown in Figure 2, where a small number of categories in the dataset have far more instances than other categories, resulting in a serious imbalance in data distribution. As more data are acquired, new category instances will appear, further exacerbating the long-tailed characteristics of the dataset. Although existing deep learning-based network models have begun to pay attention to the long-tailed problem [13,14,15], most of the long-tailed research in the remote sensing field focuses on long-tailed recognition [16,17], and there is less research on the more complex long-tailed object detection task. We can see that the red line representing detection accuracy in Figure 2 is positively correlated with instance number, which shows that the key to improving model detection accuracy is to improve the detection ability for tail classes.
The third challenge is how to reduce algorithm complexity for real-time detection. In scenarios such as disaster relief where timely detection and emergency handling are required, real-time performance will be a very important consideration factor. However, due to space limitations, detection models deployed on satellites or aircraft cannot increase performance by increasing complexity. Therefore, model complexity needs to be strictly controlled when fusing multimodal information and dealing with long-tailed problems.
In order to solve these challenges, based on the above analysis, we propose a multi-source fusion object detection method for natural long-tailed datasets, which uses infrared and visible light images to improve the detection accuracy of the model on natural long-tailed datasets. Considering that multimodal image fusion needs to be based on image sample features, we propose a dynamic feature fusion module based on image information entropy [18]. By calculating the amount of information in the image, the model can dynamically allocate fusion coefficients during the training and inference stages, which enables the network to retain more key feature information and provide more accurate image features for subsequent object detection. In order to ensure that the model can meet the requirements of real-time detection and lightweight, we choose the small-sized YOLOv8s [19] as our baseline model. Considering the characteristics of natural data long-tailed distribution, we propose an instance-balanced mosaic method by improving Mosaic [20] to achieve balanced sampling, which provides more sample features for the model and alleviates the negative impact of data distribution imbalance. At the same time, in order to balance the gradient information during the training stage and reduce the impact of long-tailed distribution, we propose class-balanced BCE loss for object detection. This loss can dynamically adjust the loss weight according to the number of samples of different categories, thereby reducing the model’s overfitting on head categories and underfitting on tail categories.
Finally, in order to verify the performance of our proposed method, we conducted experimental verification on three public benchmark datasets and conducted ablation analysis. The experimental results proved that our proposed method achieves state-of-the-art performance; in particular, the optimization of the long-tailed problem enables the model to meet various application scenarios of remote sensing image detection.
In summary, our contributions can be summarized as follows:
- We propose a dynamic feature fusion module based on image information entropy, which dynamically adjusts the fusion coefficient according to the different information entropy of images, enabling the model to capture more features. Compared with other similar methods, this module helps the model significantly improve detection accuracy without significantly increasing computational complexity, and this method is simple and can be easily inserted into other object detection networks to achieve feature fusion for remote sensing images.
- We propose an instance-balanced mosaic data augmentation method based on instance number, which solves the long-tailed problem by providing rich tail-class features for the model through resampling during data augmentation.
- We propose class-balanced BCE loss for long-tailed object detection. This loss provides more balanced loss information for the model according to sample number, improving the detection accuracy of tail instances.
- Based on three public benchmark datasets, we constructed a large number of experiments to verify the performance of our method. Compared with baseline methods, our method can greatly improve the performance of baseline models. The experimental results and ablation analysis prove the effectiveness of our proposed method.
The rest of this paper is organized as follows: Section 2 reviews related work. Section 3 introduces the details of our proposed method. In Section 4, we conduct experiments to verify the effectiveness of our method. Section 5 deploys ablation experiments and gives corresponding performance analysis. In the final Section 6, we summarize this paper and give possible future work.
2. Related Work
We first summarize the latest research achievements in the fields of remote sensing image object detection and deep long-tailed object detection, and analyze the shortcomings of the state-of-the-art methods in the corresponding fields. Based on this, we also point out the importance of long-tailed object detection for remote sensing image object detection.
2.1. Long-Tailed Object Detection
Long-tailed object detection is an important and challenging problem in the field of object detection, which refers to the uneven distribution of sample numbers of different categories in the training data, resulting in much lower detection performance of minority categories (tail categories) than majority categories (head categories). In order to solve this problem, many long-tailed object detection studies have emerged in recent years, which can be divided into three categories: based on sample resampling, based on loss reweighting and based on knowledge transfer [21]. Methods based on sample resampling balance the training data by changing the sampling probability of different category samples, such as instance-aware repeat factor sampling [22], class-balanced grouping and sampling [23], etc.; methods based on loss reweighting balance the training data by adjusting the loss weight of different category samples, such as focal loss [24], equalization loss [25], etc.; methods based on knowledge transfer enhance the representation of tail categories by using the knowledge of head categories, such as semi-supervised and long-tailed object detection with CascadeMatch [14], etc. However, most of these methods are designed for long-tailed object detection in natural images. In remote sensing images, there are other challenges besides the long-tailed problem. First, remote sensing images are generally multimodal images obtained by different sensors, such as visible light, infrared, radar, etc., which contain different physical characteristics and complementary information. If only one modality of information is used, a lot of useful information will be lost, resulting in a decline in model performance; secondly, the objects in remote sensing images generally have small size and low resolution, which makes object detection more difficult. For this purpose, we propose a long-tailed object detection method for multimodal remote sensing images, which can effectively fuse multimodal information and adapt to the imbalance problem between positive and negative samples of different categories.
2.2. Multimodal Feature Fusion
With the rapid development of remote sensing technology, multimodal feature fusion has become an important means to improve the performance of remote sensing image object detection. Multimodal feature fusion refers to using different types of images obtained by different sensors, such as visible light, infrared, radar, etc., to obtain more rich and robust object representation through feature extraction and fusion. In the past, there have been some studies on feature fusion. For example, Liu et al. [26] proposed a deep learning-based feature fusion method that uses convolutional neural networks (CNN) and bilinear interpolation (Bilinear Interpolation) to achieve feature extraction and fusion for visible light and infrared images; the authors of [27] proposed SuperYOLO, an accurate and fast small-object detection method for remote sensing images, which uses auxiliary super-resolution learning to fuse multimodal data and perform high-resolution (HR) object detection for multi-scale objects. In recent years, some researchers have also tried to use attention mechanism (Attention Mechanism) or multi-scale feature alignment (Multi-scale Feature Alignment) to improve the effect of multimodal feature fusion, such as [28,29,30,31], etc. However, these methods often require multiple stages, cannot detect in real time or do not consider the long-tailed problem, resulting in low detection accuracy for tail instances. We found through research that combining long-tailed object detection with multi-source object detection can significantly improve the detection ability of remote sensing images. For this purpose, we propose a long-tailed object detection method for multimodal remote sensing images, which achieves the efficient detection of multimodal remote sensing images.
3. Methodology
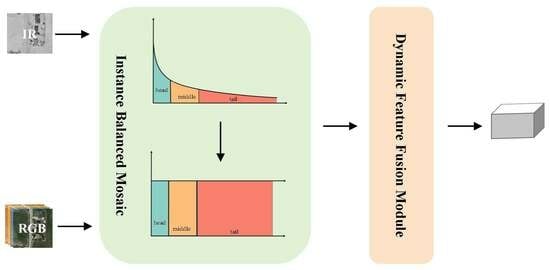
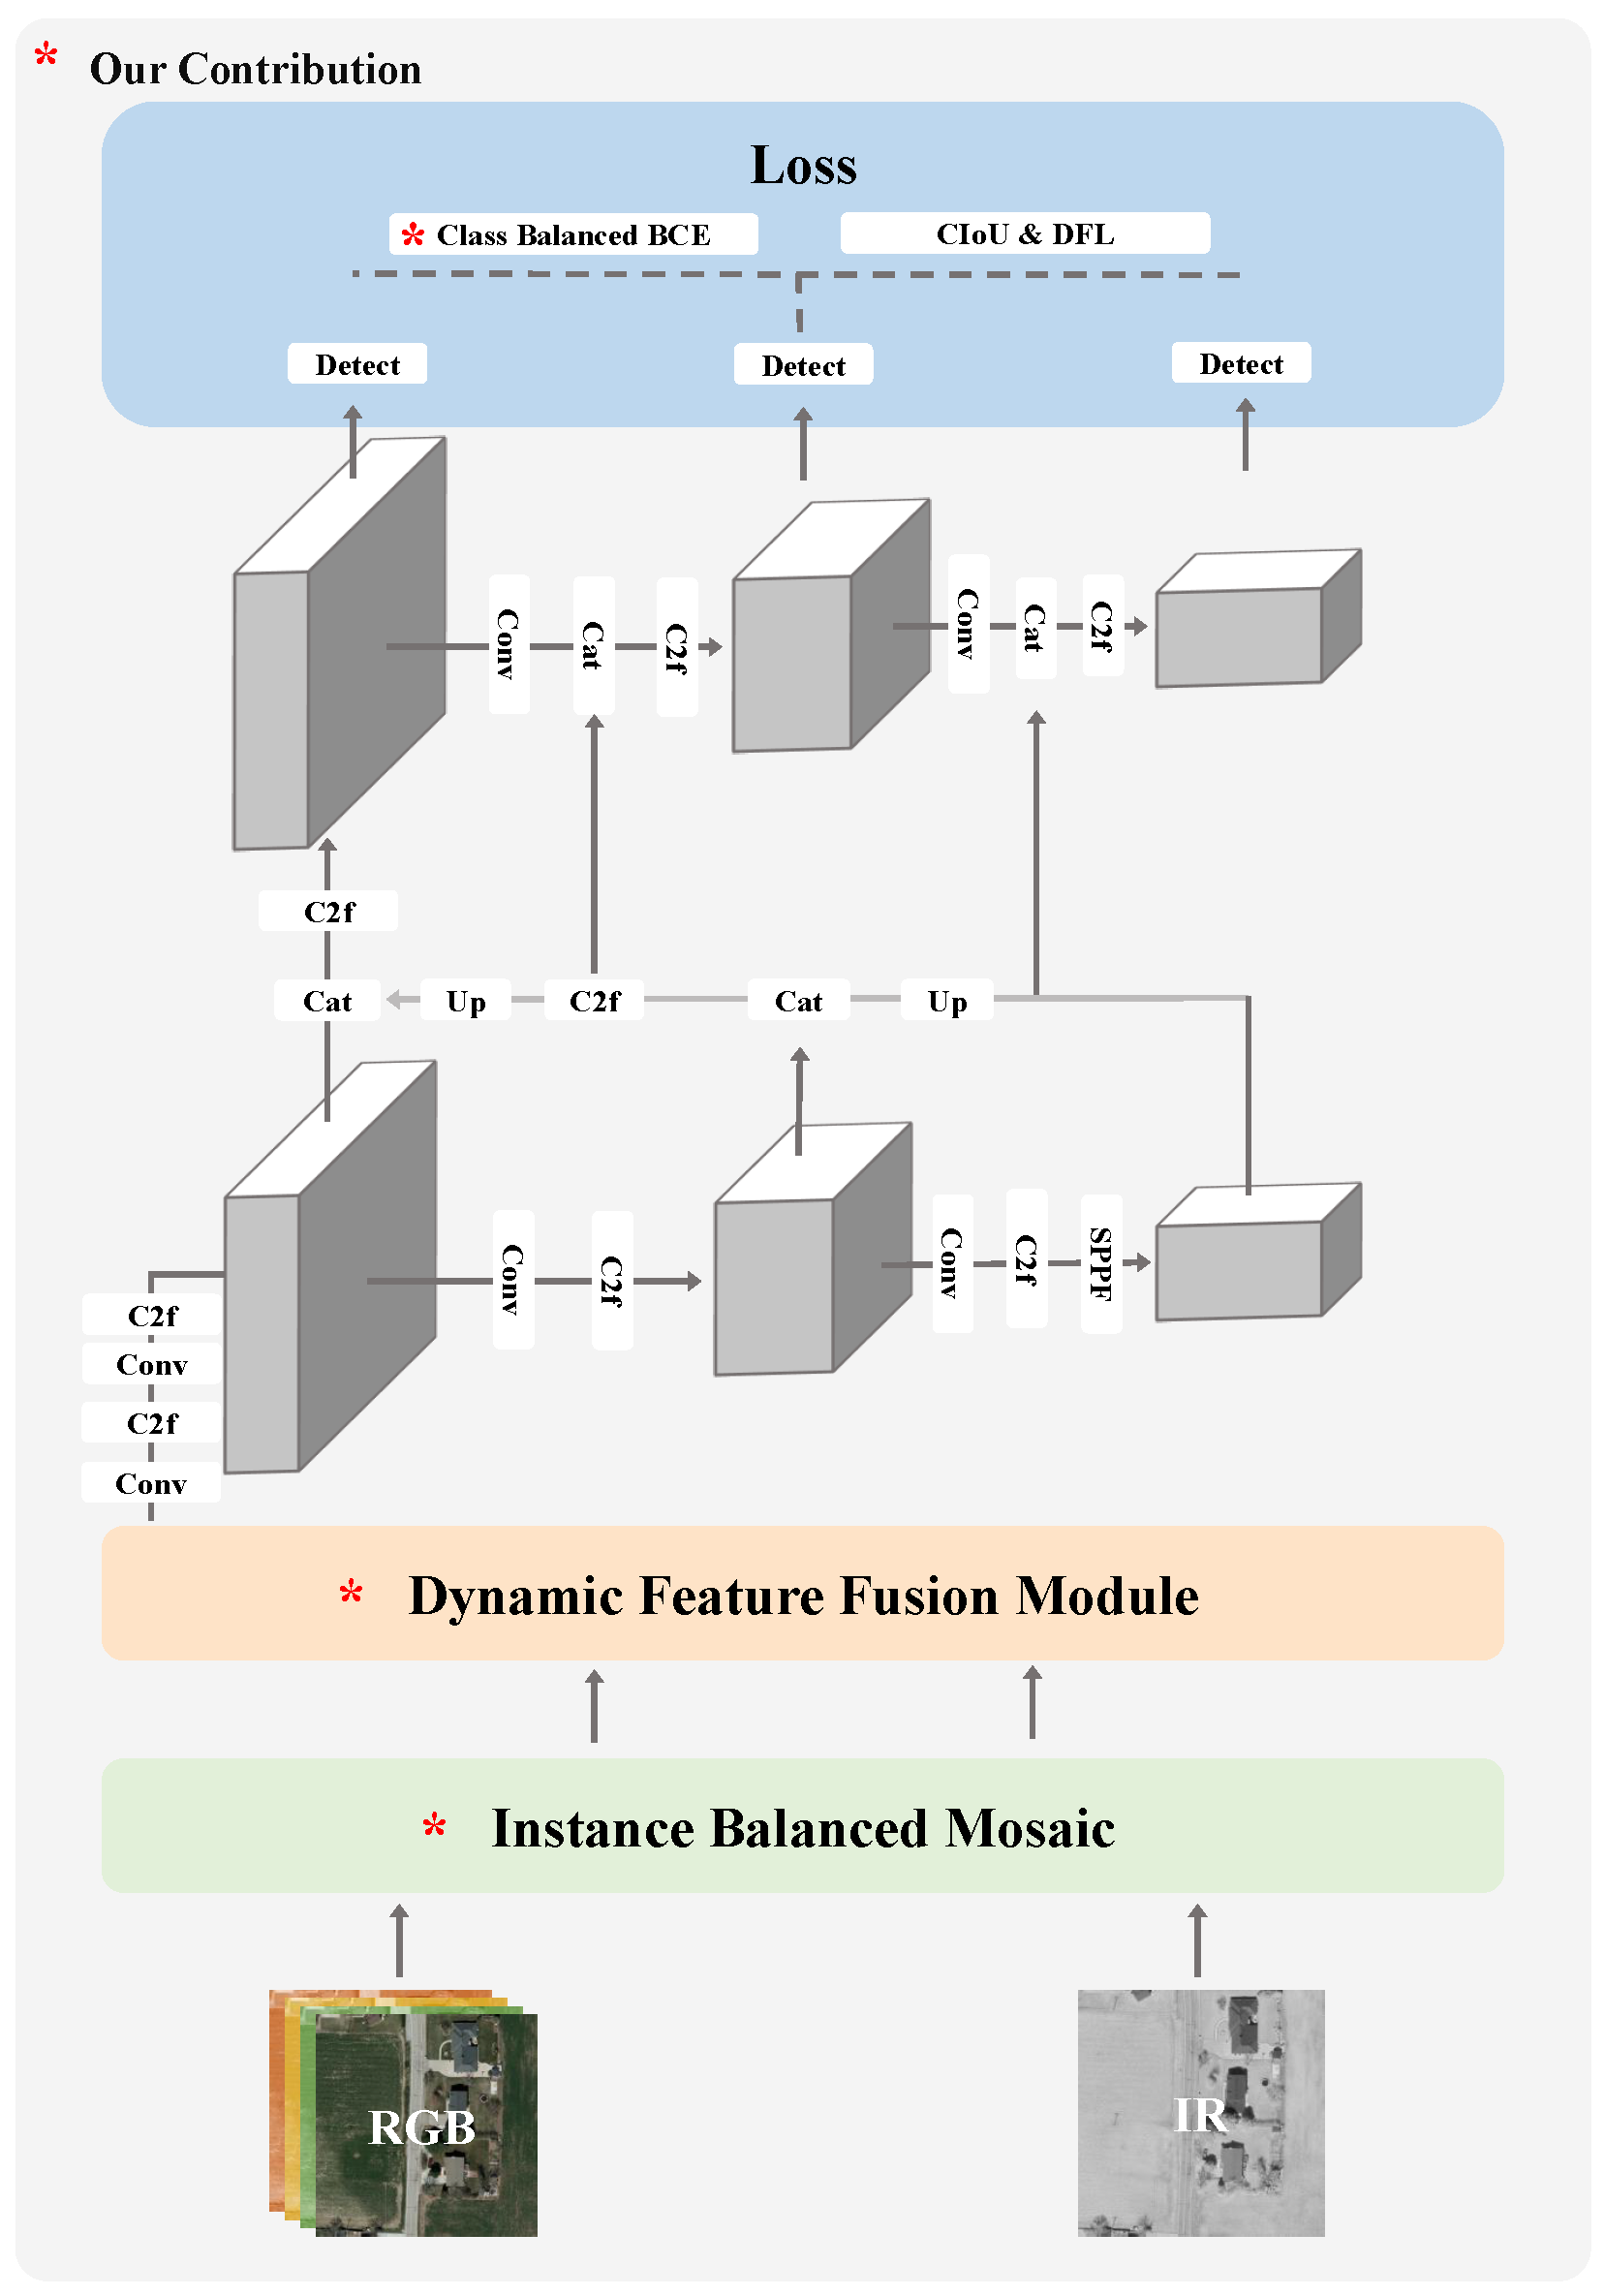
In this section, we first introduce the basic architecture of the method, and then describe the proposed modules in detail. The overall framework of our model is shown in Figure 3, which mainly consists of three parts: the dynamic feature fusion module, instance-balanced mosaic and class-balanced BCE loss. Through the collaboration of these three modules, we achieve the detection of multimodal long-tailed datasets.
3.1. Basic Architecture
As shown in Figure 3, the baseline architecture YOLOv8 [19] network used by our method consists of two main components: a backbone network and a head module. The backbone network is used to extract multi-scale feature maps, including low-level texture features and high-level semantic features. Then, these feature maps are fed into the head for object detection and classification. Compared with YOLOv5 [32], YOLOv8 replaces C3 with a C2f module for lighter weight, and uses split instead of conv to layer the features. It also uses a decoupled head in the head module, which aligns the classification and regression tasks by introducing task-alignment learning, making the model design more reasonable and efficient.
YOLOv8, as the latest SOTA model, has strong performance in object detection, but it still has some limitations.
Limitation 1: YOLOv8 cannot perform multimodal fusion object detection, resulting in low detection accuracy. Because there are differences between different modal images, simply fusing them cannot fully utilize the complementary information between them. For example, in good lighting conditions, visible light images contain more information such as texture, color, etc., than infrared images. Conversely, in low-visibility environments, especially when there is slight occlusion, infrared images can capture the outline of the target and other information significantly. These problems affect the accuracy and robustness of object detection, so it is necessary to design a more effective multimodal fusion method to transform the YOLO network, to extract the complementary information between different modalities and eliminate the differences and noise between different modalities.
Limitation 2: The mosaic data augmentation method used by YOLOv8 is not suitable for remote sensing object detection; because remote sensing target samples are small and scattered, cropping and stitching will lead to loss of tail-class samples, resulting in a decrease in the overall detection accuracy of the model. The mosaic data augmentation method can increase the diversity of data without increasing the size of the dataset, thereby improving the generalization ability of deep network models. The specific method is to randomly crop four images and then combine and stitch them into a new image input network. However, this method is not suitable for remote sensing object detection; because the targets in remote sensing images are usually small and sparse, random cropping will cause many targets to be cut off or only retain a part, thus affecting the model’s detection and localization of targets. Especially for tail class targets, since they are rare in themselves, if they are cropped off, it will cause the model to lack enough training samples, thereby reducing the model’s detection accuracy for tail classes.
Limitation 3: The loss function of YOLOv8 only considers hard samples, not tail class samples learning, resulting in low detection accuracy for tail-class instances. YOLOv8 network uses the CIoU loss function [33] to optimize the regression of target boxes. It is a loss function based on IoU (intersection over union), which can consider factors such as overlap degree, center distance, aspect ratio, etc. between target boxes, and improves the localization accuracy of target boxes. However, this loss function only focuses on hard samples, i.e., prediction boxes with low overlap with ground truth boxes, and ignores the detection difficulty difference between classes. For tail-class targets, since they are rare and difficult to detect in themselves, if only hard samples are considered and tail-class samples are ignored, this will cause the model to calculate inaccurate losses, thereby reducing the model’s detection accuracy for tail classes. Therefore, it is necessary to design a loss function that can consider both hard samples and tail-class samples at the same time to improve the model’s detection performance for tail classes.
3.2. Dynamic Feature Fusion Module
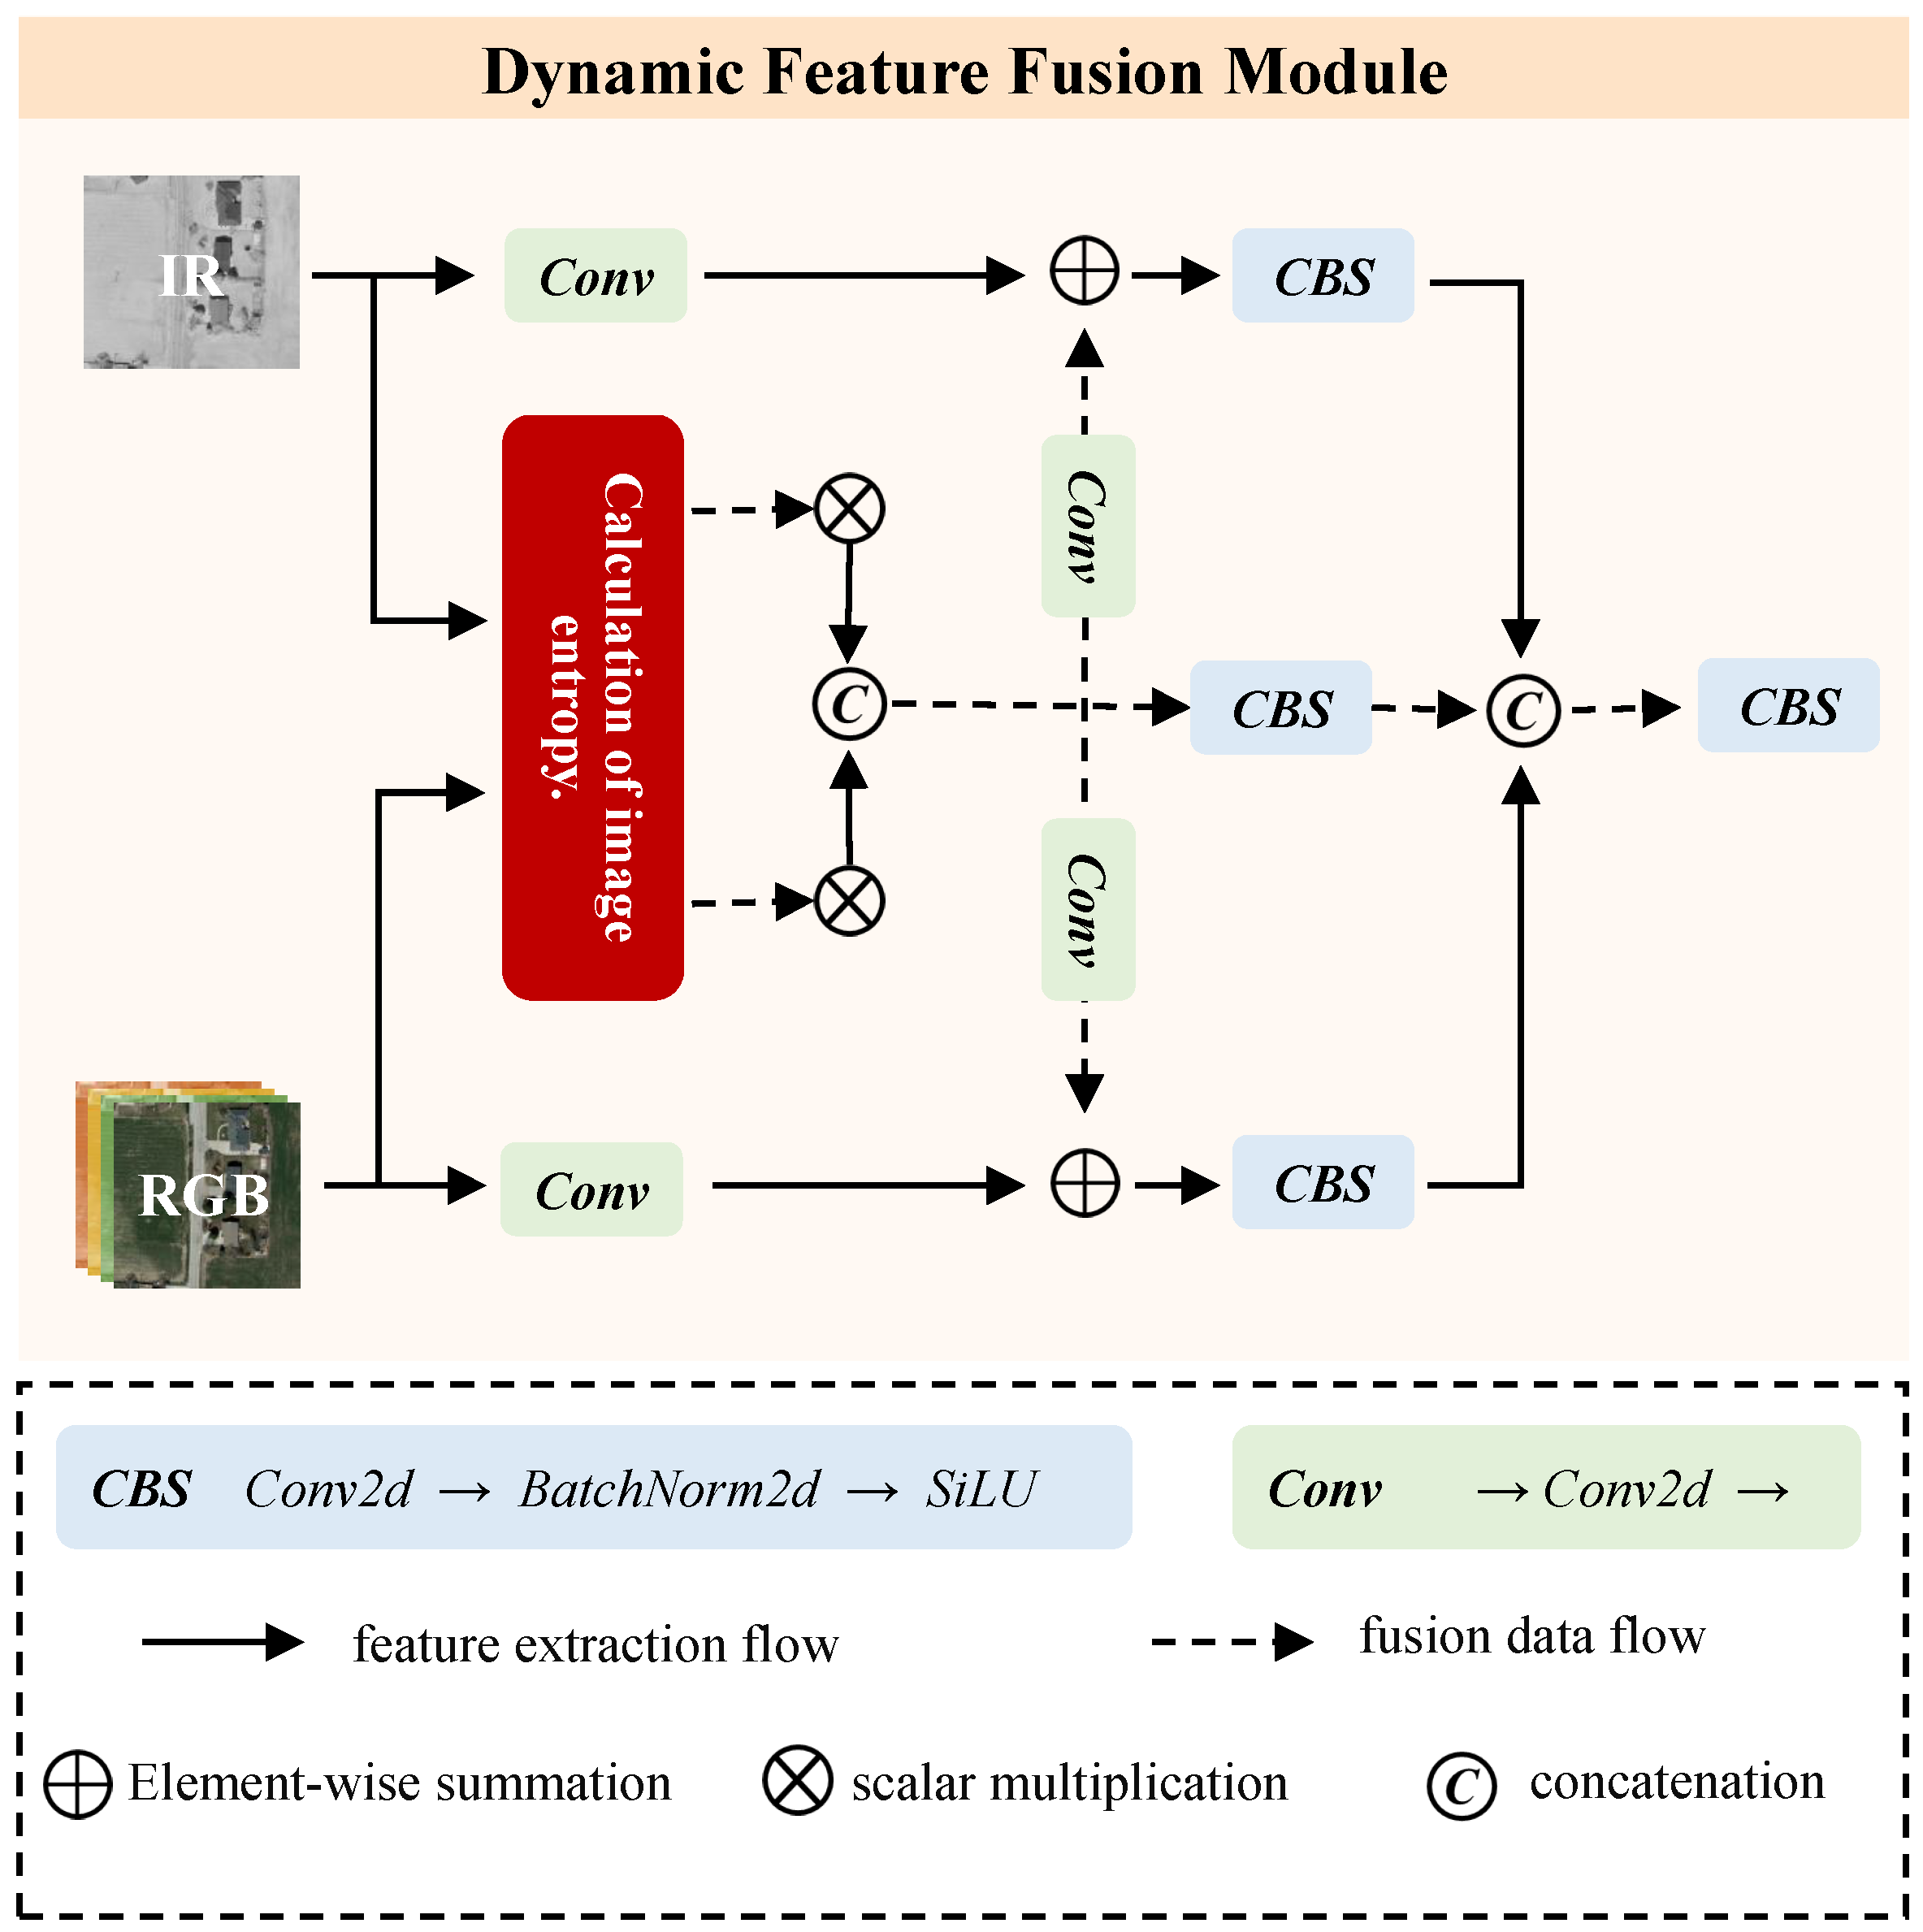
To efficiently utilize multi-source information for object detection, we propose the dynamic feature fusion module. As shown in Figure 4, the module consists of two parts, namely the calculation of image entropy module and the multimodal feature fusion module. The image information quantity calculation module can accurately perceive the target scene by calculating the image entropy and dynamically assigning fusion coefficients for the images. The feature fusion module then fuses the images according to the information quantity, providing more salient features for subsequent object detection.
3.2.1. Calculation of Image Entropy
Preliminaries. The model input in the image multimodal object detection task is multimodal images, where we use to represent the corresponding visible light image and infrared image. For convenience of calculating the image information quantity, we separate the visible light image into , where .
First, calculate the gradient magnitude and direction of the input images. The gradient magnitude is the change amplitude in the direction of maximum gray level change, and the gradient direction is the direction of maximum gray level change. Previous researchers have proposed many operators to calculate the gradient magnitude and direction, such as Sobel operator [34], Prewitt operator [35], Roberts operator [36], etc., which are all based on the difference between adjacent pixels in the image to estimate the gradient. In order to maintain the stability of model detection, we choose Sobel operator to calculate the image gradient.
where I is the image matrix, , is convolution operation, and are gradients in horizontal and vertical directions, respectively. Then, the image gradient magnitude and direction can be obtained by the following formulas:
where G is gradient magnitude, is gradient direction. After obtaining the gradient magnitude and direction of each pixel, calculate the two-dimensional joint histogram n of gradient magnitude and direction. Each element can be calculated by
where W and H are the width and height of the image, , , , is an indicator function that obtains the gradient distribution map by judging each pixel one by one, i.e.,
Further, the pixel probability can be obtained. Then, the probability of gradient magnitude being i and direction value being j is
Based on the probability map r, the final two-dimensional gradient entropy [37] of the image can be calculated.
Using the above method, we can obtain the image entropy of the images , respectively.
3.2.2. Multimodal Feature Fusion
To fuse multimodal information for object detection, we propose multimodal feature fusion. As shown in Figure 4, we extract the shallow features of the visible light and infrared images input to the model using 1 × 1 convolution module while sending them to the image entropy calculation module.
Then, we fuse each channel of the image according to the calculated information quantity, and the obtained features can be expressed as
In the formula, represents the concatenation operation along the channel axis; ∗ is the multiplication of image entropy and image. Further, we use 1 × 1 convolution module to extract global features and fuse different modal features,
On the basis of preliminary fusion of shallow features, in order to extract more spatial information, we use module to extract global features and fusion features of different modalities.
Finally, we use a CBS module to fuse all the features calculated by the above formula and pass them to the subsequent backbone network for high-level semantic information extraction.
The final output of this module is f that fuses visible light and infrared images.
3.3. Instance-Balanced Mosaic
As mentioned in Section 3.1, the default data augmentation module of YOLOv8 network is not suitable for remote sensing object detection. Because the targets in remote sensing images are small and sparse, especially when the instances present a long-tailed distribution, the tail-class instances with fewer numbers will be discarded, resulting in low detection accuracy of the model for these classes.
In order to improve the model’s detection accuracy for tail classes, we propose the instance-balanced mosaic module, which considers the long-tailed problem of data and tries to preserve tail-class instances as much as possible during data augmentation. By stitching part of the content and annotation information of four original images onto a gray image to increase the diversity of the training set, this method enhances the model’s detection performance for remote sensing images. As shown in Figure 5, the process can be divided into three steps.
Step 1: We generate a gray image , where W and H represent the width and height of the target image, respectively. We randomly select four images from the training set, denoted as .
Step 2: In the rectangular area on the gray image that satisfies , , we randomly select a point as the stitching center point , and split the gray image from this point along horizontal and vertical directions to form stitching areas.
For each selected image , we traverse each instance’s class and count the number of that class in the training set . Then, we randomly select an instance of the class with the least number , and calculate the Euclidean distance between its center point and the four vertices of the image, and select the closest vertex as the stitching point . This distance can be calculated by
where are the coordinates of the k-th vertex, .
Step 3: For each image , according to the stitching point and direction, we stitch it onto the gray image so that the stitching point is aligned with the stitching center point . If the two points are not aligned, we need to rotate, flip or perform other transformations on the original image; the coordinates of the aligned stitching point can be expressed as . The stitching transformation can be expressed by
where is the stitched image, is the i-th quadrant of stitching area on the gray image. For each image , we also copy its target instance annotation information (such as bounding box, class etc.) to the gray image and adjust it according to stitching position. This way, we obtain a new data-augmented image that contains part of content and annotation information from four original images.
3.4. Class-Balanced BCE Loss
The overall loss function of our network is consistent with the baseline network, which consists of three parts: box loss , classification loss , and regression loss [38], which can be expressed as
where are the balance coefficients set at the beginning of training. In the calculation of classification loss, compared with the original YOLOv5 network, YOLOv8 learns from TOOD [39] and introduces dynamic positive and negative sample allocation tasks, which aligns the classification and regression tasks. Unfortunately, the calculation of classification loss still does not consider the impact of long-tailed distribution of datasets. The datasets with long-tailed distribution have extremely unbalanced sample numbers among different classes, with a few minority classes having many samples, while most classes have few samples. This will cause the model to pay more attention to majority-class samples during training, and ignore minority-class samples. In order to better recognize tail class samples, and thus improve the model’s detection accuracy on long-tailed datasets, we adjust the loss to class-balanced BCE loss based on the original BCE loss.
In order to assign reasonable weights to classes based on the number of instances per class, we first need to establish a formula that assigns higher weights to classes with fewer samples. Suppose we have N samples, the weight of class c can be
where is the number of samples belonging to class c. Based on the calculated weight , we calculate the target score. The calculation of positive and negative samples is consistent with the original method [39], which first calculates the alignment degree between candidate anchor points and objects
where and are two hyperparameters that control the weights of classification and localization. represents the score of class c for anchor point j of sample i. represents the predicted box corresponding to anchor point j of sample i. represents the ground truth box corresponding to anchor point j of sample i. IoU is the intersection over union calculated by CIoU method [33] between two boxes.
Then, we obtain the target score related to alignment degree , where l is the corresponding sample class label. By weighting, we obtain the final target score
where is a hyperparameter that controls the weighted strength of a class, and is the normalized weight of for more stable balancing of importance between classes.
The weighted classification loss assigns larger weights to minority classes and smaller weights to majority classes according to the distribution of different classes in the dataset, which makes the model pay more attention to minority-class samples. The final classification loss continues to use cross-entropy loss function
where is the predicted probability that sample i belongs to class c.
4. Experiment and Results
4.1. Dataset
We conducted relevant experiments on three common datasets to test the effectiveness of our method.
(1) VEDAI dataset. VEDAI (vehicle detection in aerial imagery) dataset is a dataset designed specifically for vehicle detection in aerial images, released by the University of Caen in 2015. The images in this dataset contain various types of vehicles, which have differences in illumination, occlusion and orientation. In addition, each image contains two bands of visible light and infrared, and two resolutions of 512 × 512 and 1024 × 1024. In order to better reproduce the experimental results and compare with other experiments, it provides a unified division of training set and test set data, which makes this dataset have the ability to verify whether the model has complex multimodal object detection ability. The VEDAI dataset contains a total of 1246 images, including eight different types of vehicles, such as cars, pickups, trucks, etc., and each image has corresponding annotation information such as location.
(2) LLVIP dataset. LLVIP dataset is a dataset created specifically for low-light vision tasks, collecting a large number of visible light and infrared images taken under low-illumination conditions. These images are captured by a dual-spectral camera with a bird’s-eye-view monitoring angle, containing a lot of pedestrians and cyclists on the street, and each pair of infrared and visible light images is spatially and temporally aligned. Therefore, this dataset can be used to study visual tasks such as image fusion, pedestrian detection and image-to-image translation. Since most of the images are taken at night with poor lighting conditions, it can well reflect the complementarity between visible light and infrared images, thus testing the model’s fusion detection ability for multimodal images. All pedestrians in this dataset have accurate annotation files, recording their categories and locations. According to statistics, it contains 33,672 images, that is, 16,836 pairs of images; each image has a pixel size of 640 × 512.
(3) FLIR dataset. FLIR dataset is a visible light and infrared dataset for training neural network object detection, mainly containing daytime and nighttime scenes on the highway, aiming to test the model’s fusion ability of complementary information from multispectral images. However, with regard to the original version released by Teledyne FLIR company with 26,442 fully annotated images, although annotated with various types such as people, cars, traffic lights, etc., there are a lot of unaligned images in time and space, which makes the model training too complicated and unable to reasonably test the model’s performance. Therefore, ref. [40] released an “aligned” version, which contains 5142 pairs of strictly aligned infrared and visible light images, excluding other categories besides people, cars and bicycles. In our experiments, we also choose to use this “aligned” version of the dataset to test and verify our model.
4.2. Implementation Details
In this experiment, we deployed our model using the PyTorch framework based on Python 3.8. The model training used a server with two NVIDIA GeForce 3090 GPUs, with a CPU of inter 13,900 k and a memory of 128 G. During the training process, we set momentum to 0.9 and weight_decay to 5 × . We chose the optimizer corresponding to the dataset according to the dataset, and chose AdamW for FLIR and VEDAI datasets, and SGD for LLVIP dataset. Because the LLVIP dataset has large image size and many samples in the training set, the model has more iterations during training, and SGD can better escape local optimal solutions. On the contrary, although the AdamW optimizer may fall into local optimal solutions, it can dynamically adjust the learning rate according to the gradient size of parameters, and converge faster on small datasets. The initial learning rate was set to 1 × and the final learning rate was 1 × . The batch size was fixed at 16 and the total epoch was 100.
4.3. Accuracy Metrics
In the model evaluation, we chose to use the evaluation metric mean average precision (mAP) created by the MS-COCO dataset to evaluate the performance of the model, which represents the average value of average precision (AP), and is used to measure the performance of detection models. The higher the mAP, the stronger the detection ability, that is, the higher the better. It can be calculated by
where is precision and r is recall, and they are calculated as follows:
where TP stands for true positive, which is the number of positive-class samples that are correctly predicted by the model under a certain IoU threshold; FP stands for false positive, which is the number of negative-class samples that are misreported by the model under this IoU threshold; FN stands for false negative, which is the number of positive-class samples that are missed by the model. As the most widely used evaluation metric in object detection field, mAP has various different IoU threshold standards such as mAP50 and mAP50:95. mAP50 means the average value of AP values of all classes at IoU = 0.50, and mAP50:95 means the average value when IoU = 0.50:0.05:0.95. We choose these metrics to evaluate our proposed model.
4.4. Comparisons with Previous Methods
4.4.1. Experiment Results of the VEDAI Dataset
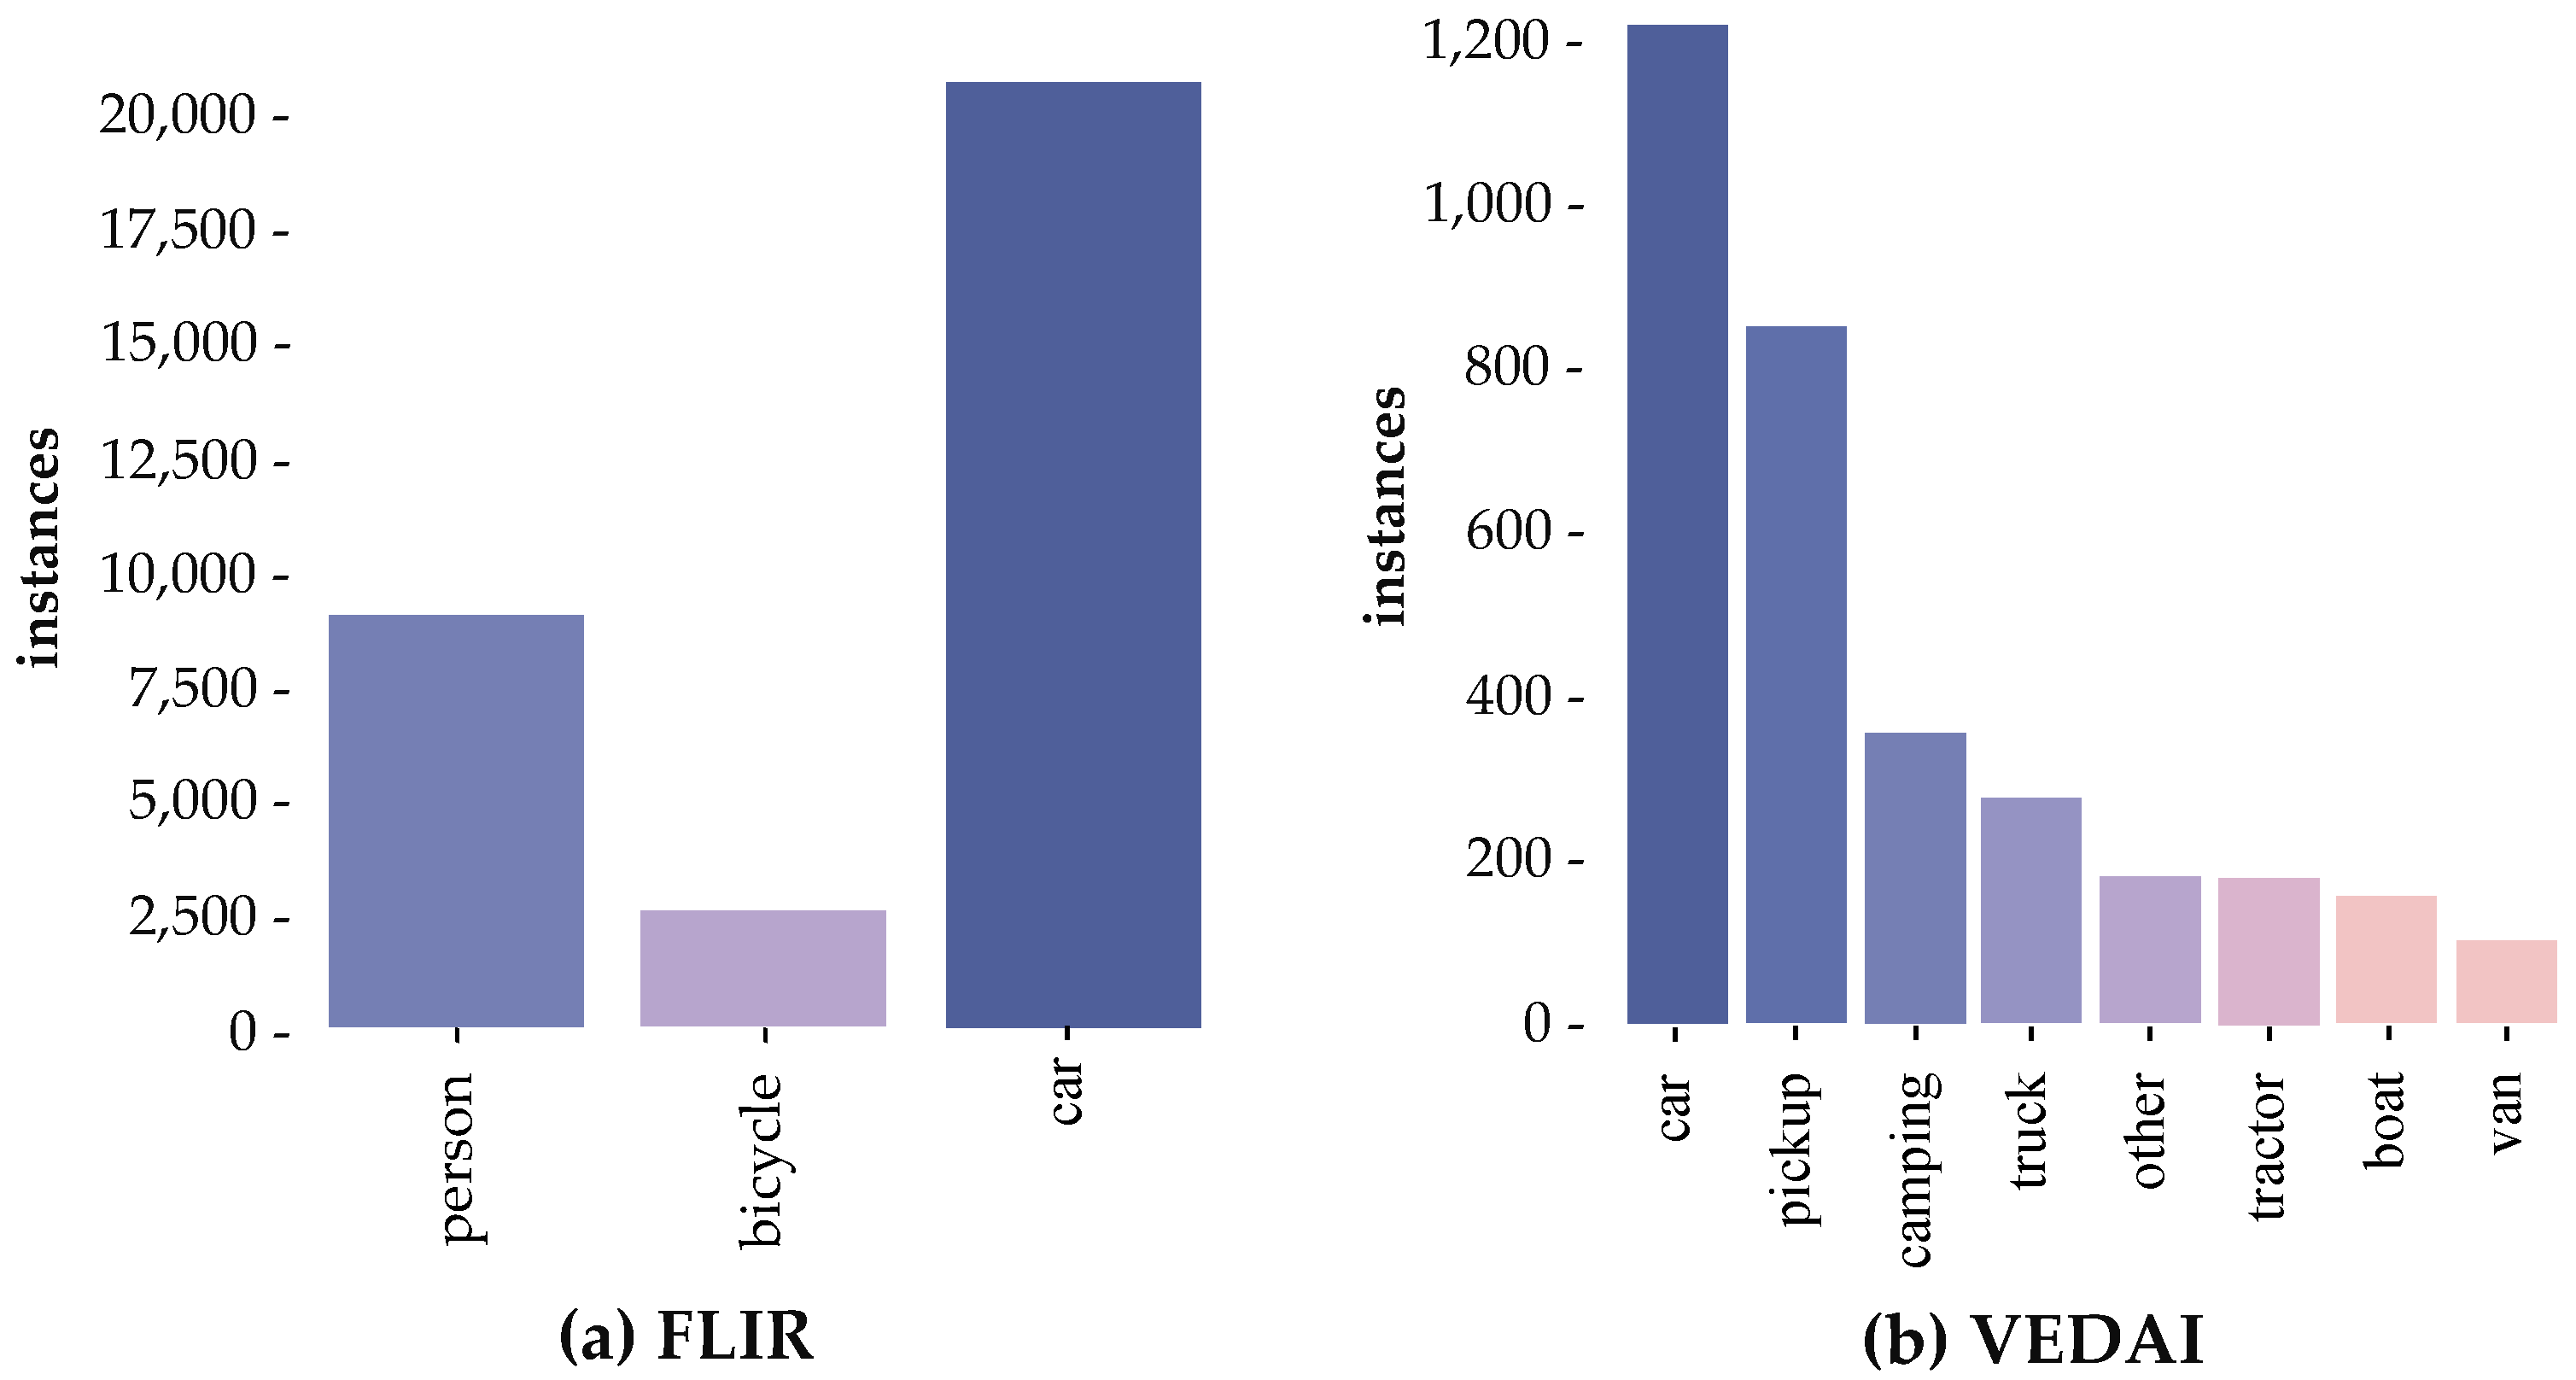
The VEDAI dataset is a long-tailed remote sensing image dataset composed of eight classes; as shown in Figure 6, the car class has a large number of samples, while tail classes such as vans have very few samples. In this paper, we conducted extensive comparative experiments on this dataset to verify the effectiveness of our method for remote sensing object detection data with long-tailed instance distribution.
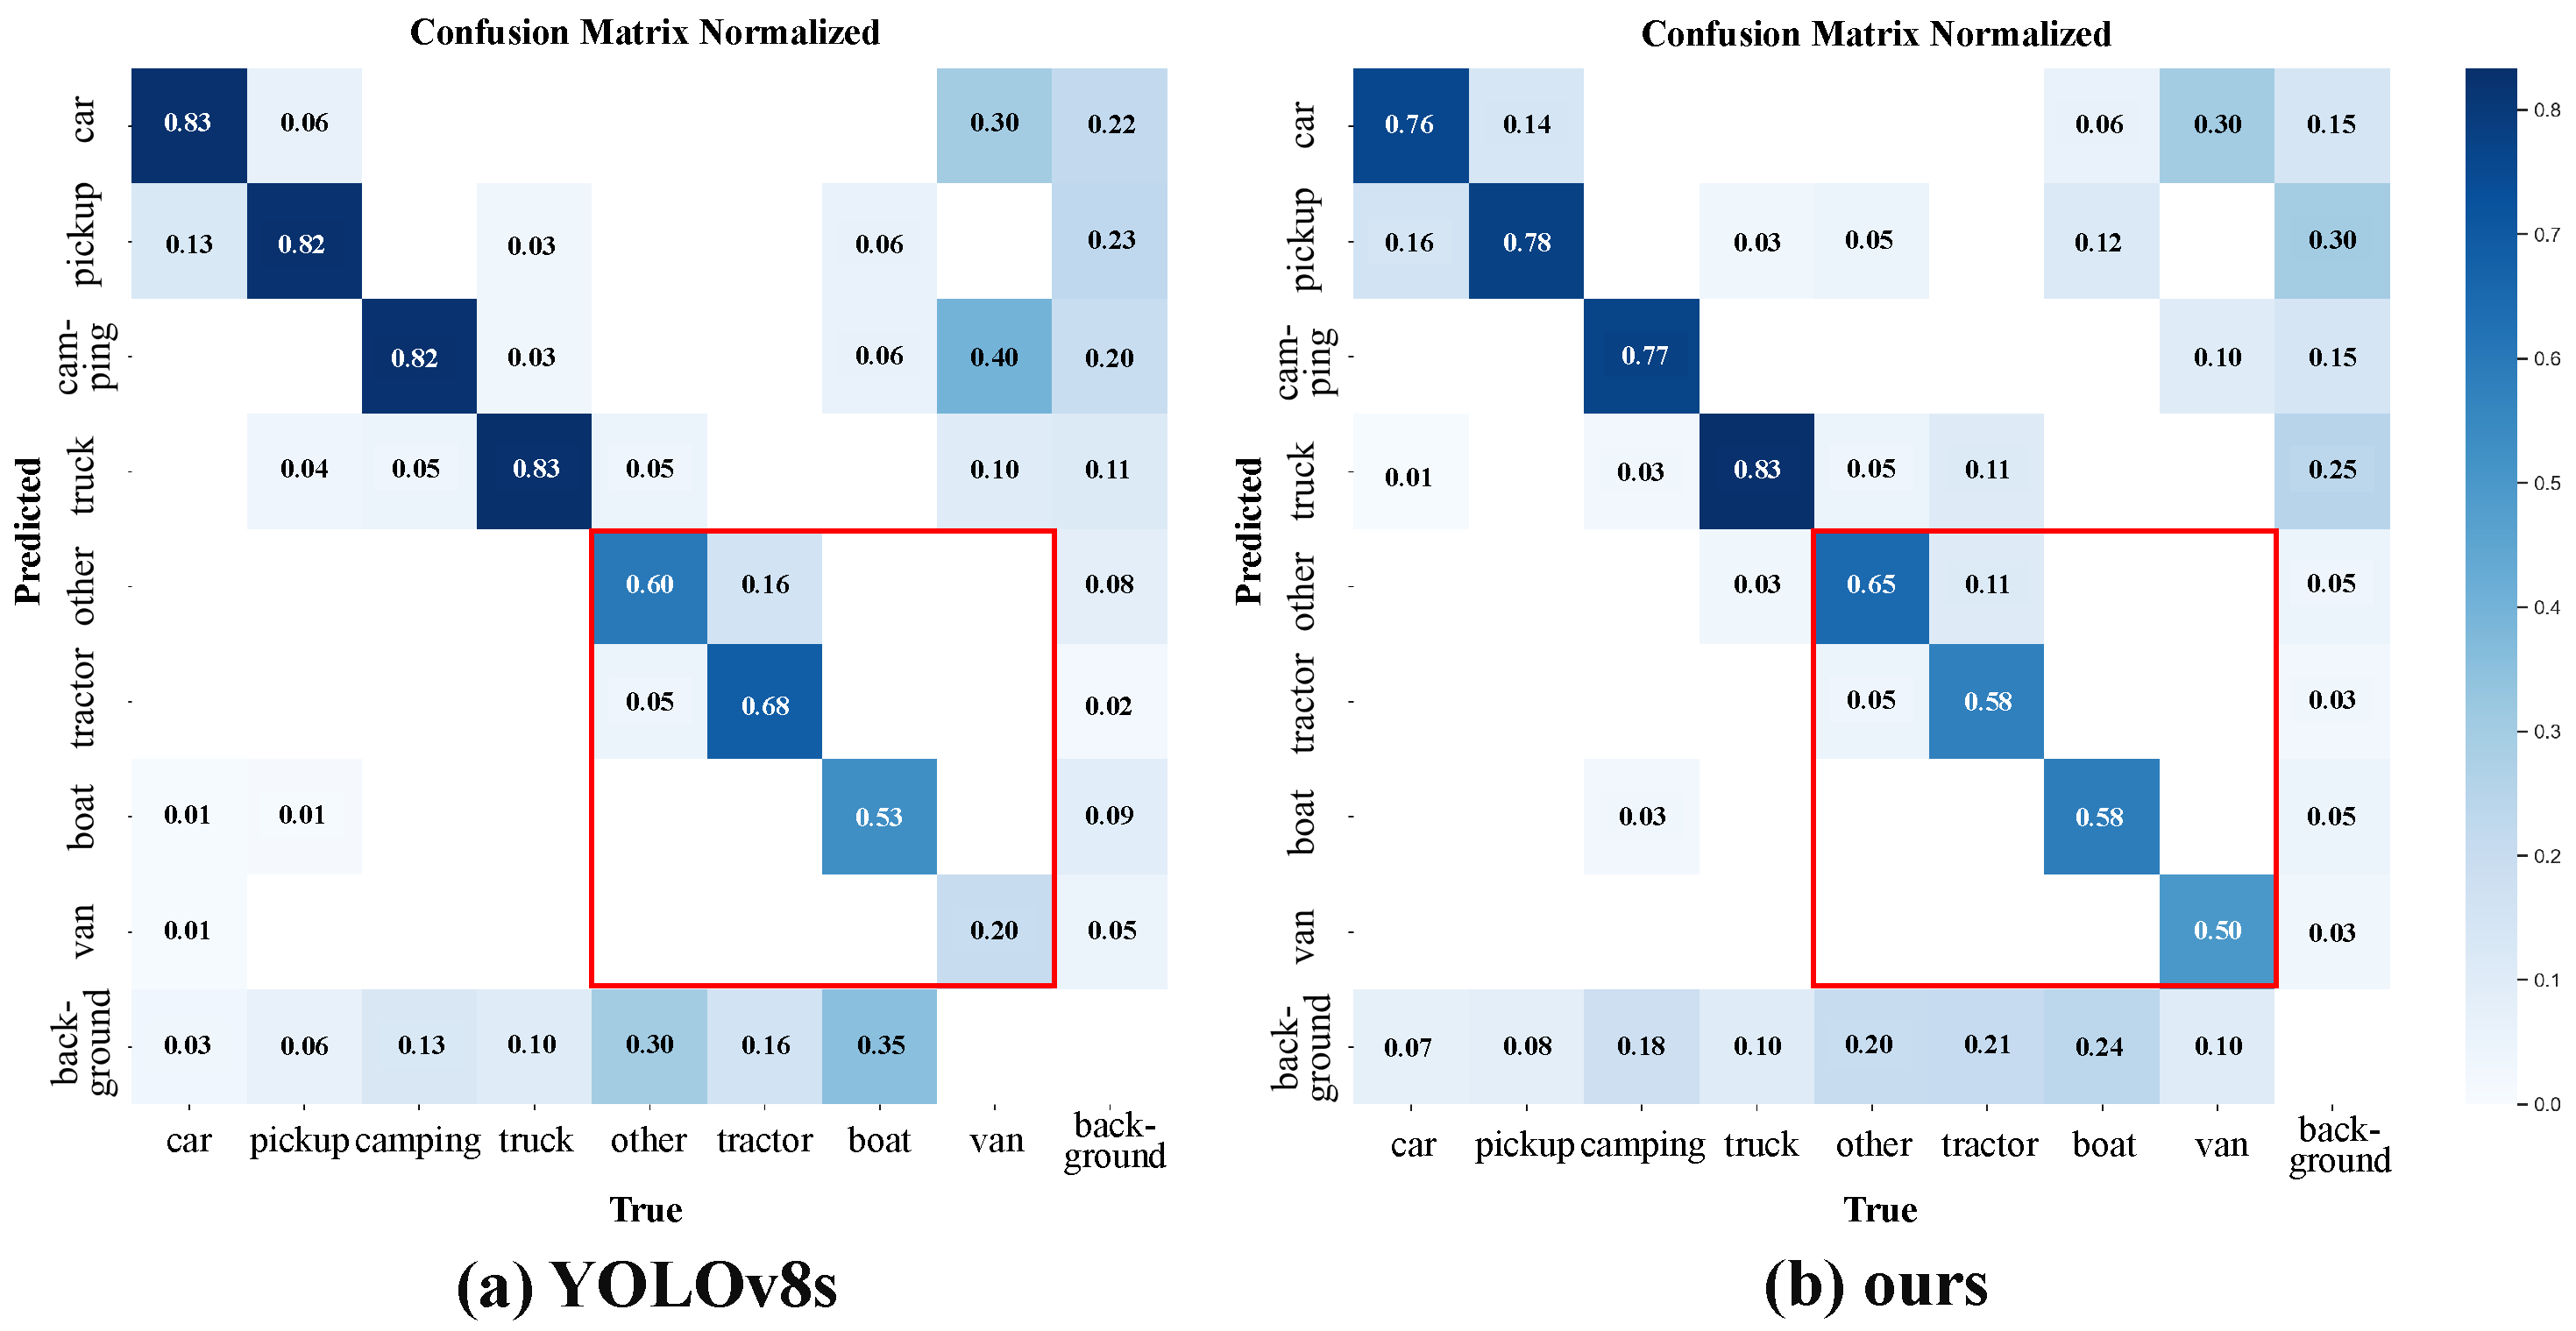
The results in Table 2 show that our proposed method achieves the highest detection accuracy on VEDAI dataset. This fully verifies the effectiveness of our proposed method for long-tailed remote sensing object detection data. Specifically, our method can achieve superior performance over other methods for two main reasons. One is that the DFF module fuses complementary information from infrared and visible light images, and obtains an mAP50 of 81% after fusion, which is much higher than 76.6% using only infrared images and 72.7% using only visible light images. These data further illustrate the performance of our proposed DFF module. The other is that by balancing classes between instances, we reduce the model’s overconfidence for head instances. As shown in Figure 7, our method has the highest performance compared to other methods on tail instances such as boats, thereby improving the overall performance of the model.
4.4.2. Experiment Results of the FLIR Dataset
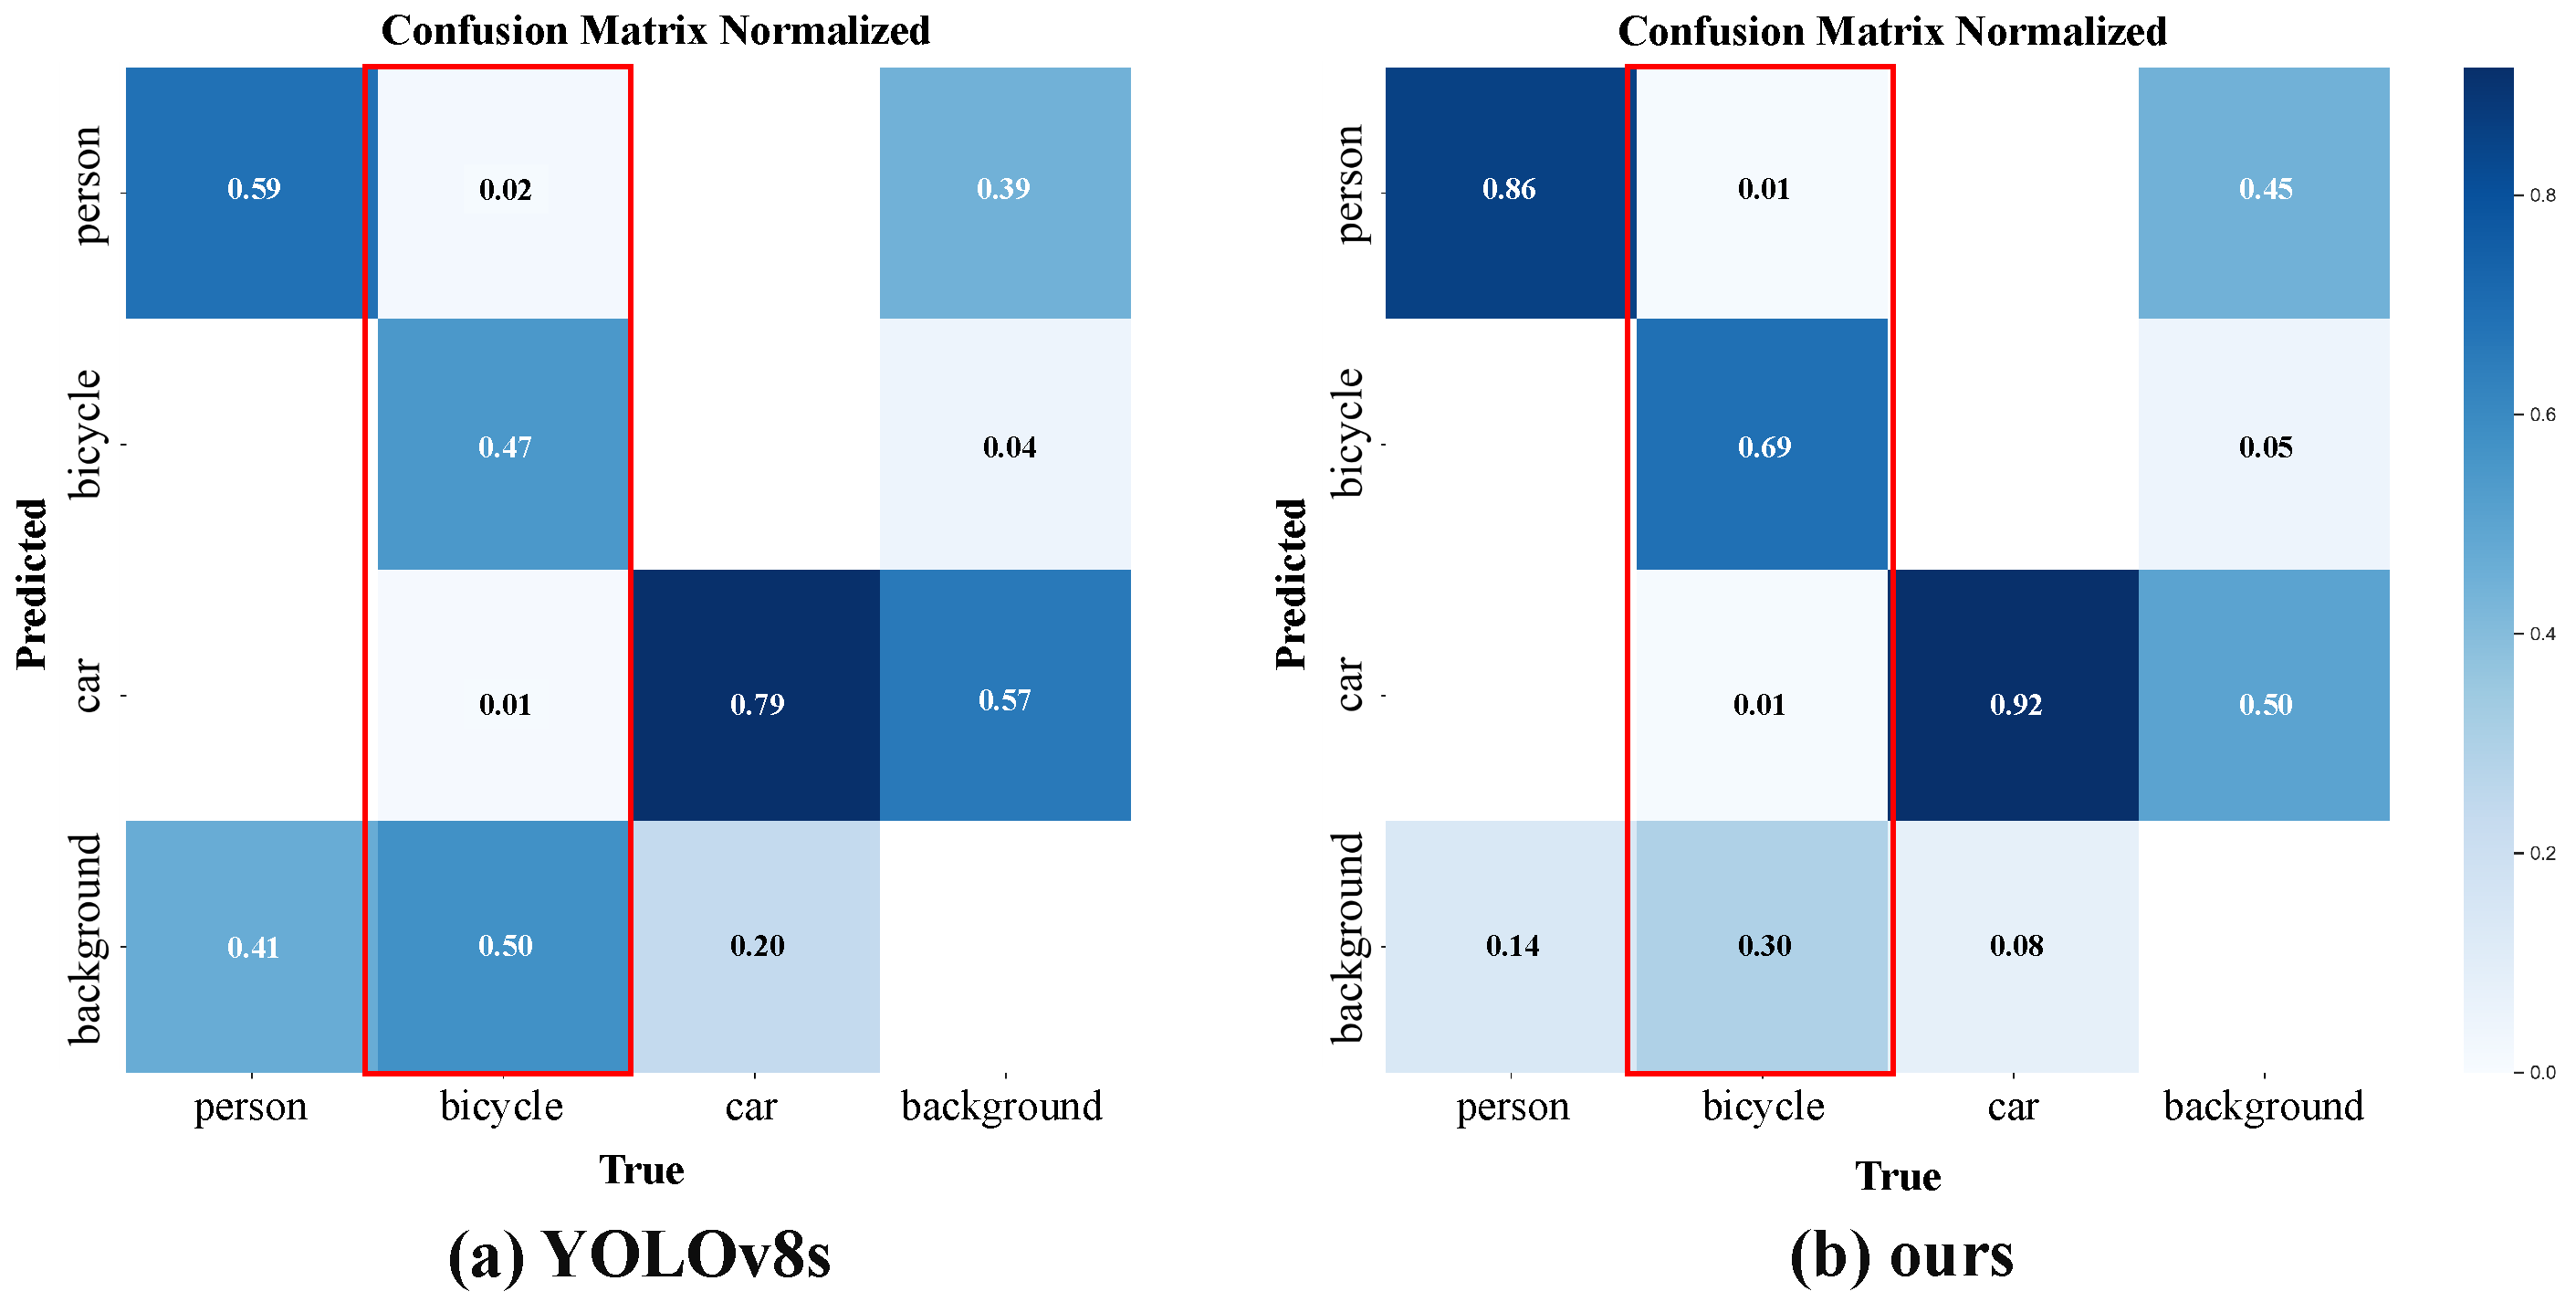
As shown in Figure 6a, FLIR is a remote sensing object detection dataset that contains three categories. We conducted extensive comparative experiments on this dataset with the current state-of-the-art methods to verify the effectiveness of our proposed method for long-tailed remote sensing object detection datasets. The experimental results are shown in Figure 8 and Table 3.
The results in Table 3 show that our proposed method achieves the highest average detection accuracy on the FLIR dataset. It can be observed that compared to single-modality methods, multi-source fusion methods generally have higher performance. Our method can surpass other multi-source fusion methods, mainly due to the solution of the long-tailed problem. From Figure 8, it can also be seen that our proposed method can solve the long-tailed distribution problem in remote sensing object detection by significantly improving the detection accuracy of tail-category instances, while maintaining or slightly improving the detection accuracy of head-category instances. Since the data obtained by remote sensing usually show a long-tailed distribution, our proposed method is more consistent with the real-world situation and has broad application value. The experimental data on the FLIR dataset fully demonstrate that our proposed method has very good detection performance on long-tailed remote sensing detection data, especially for better detection of tail-category instances.
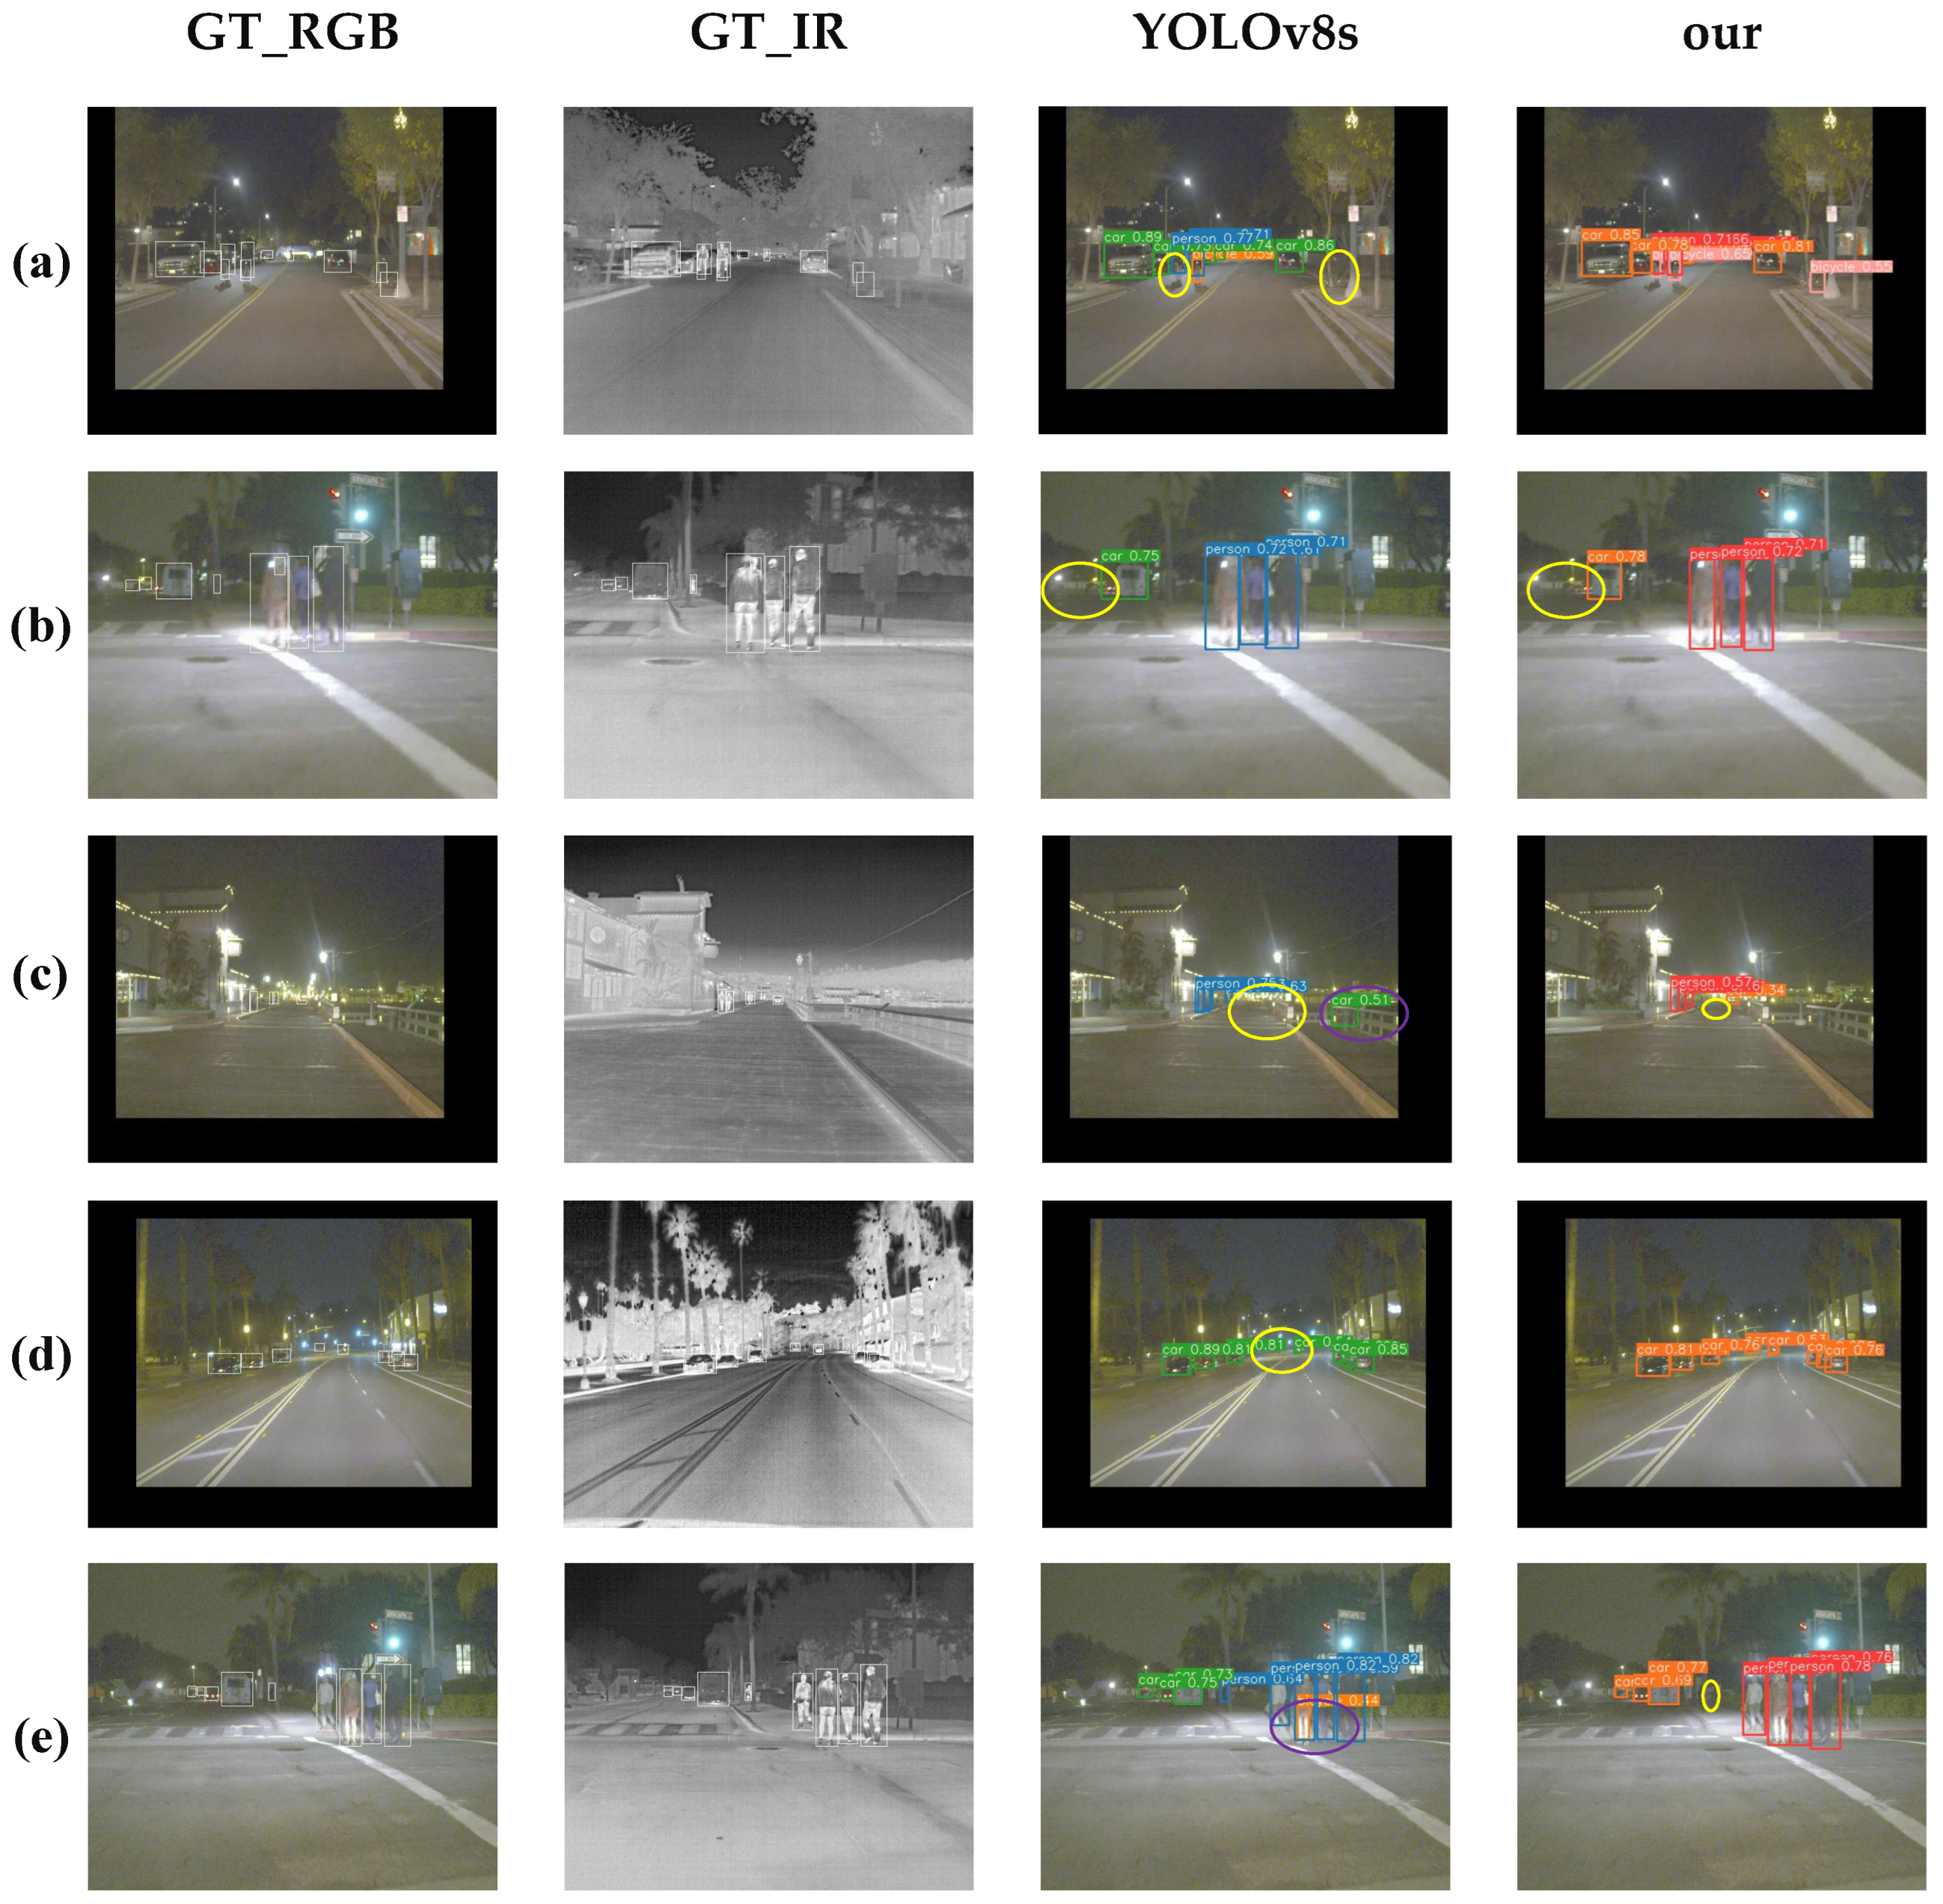
The visual detection results of the baseline method YOLOv8s and our method in five randomly selected scenes are shown in Figure 9, where the yellow ellipses represent the targets missed by the model in detection, and the purple ellipses indicate the targets falsely detected by the model. We can observe that our method is significantly better than the baseline method in tail-class samples and complex scenes. In Figure 9a, our model detects two tail-class samples of bicycles that are missed by the baseline model, and moreover, the confidence of the only bicycle detected by the baseline model is also lower than that of our model. As marked by the purple ellipses in scenes Figure 9c,e, the baseline model also erroneously detects cars and bicycles, further demonstrating the advantage of our method.
4.4.3. Experiment Results of the LLVIP Dataset
The LLVIP dataset is a single-target remote sensing dataset that contains multiple scene categories. Although this dataset only has one target of pedestrians and does not have a long-tailed distribution, the scenes in this dataset are mostly under dark light conditions, which can well test the performance of the DFF module in our method. Therefore, we conducted extensive comparative experiments on this dataset with current advanced similar methods to verify the effectiveness of our proposed method for multi-source data fusion. The experimental results are shown in Table 4.
The results in Table 4 show that our proposed method achieves the highest average detection accuracy on this dataset. At the same time, other similar algorithms such as YOLOFusion [44] also have very good performance, which indicates that multimodal fusion methods are very effective remote sensing object detection methods. In contrast, the detection accuracy of methods based on single modality is generally not high. This fully illustrates the powerful performance of the DDF module in our proposed method.
5. Discussion
This study aims to solve the long-tailed object detection problem in remote sensing images, and the experimental results show that our method has better performance than other similar methods. In order to verify the effectiveness of each module in our method and find the optimal parameter settings, we conducted ablation experiments and parameter analysis experiments in this section.
5.1. Ablation Study
To verify the effectiveness of the modules in our proposed method, we conducted extensive ablation experiments on three datasets. The ablation experiments were consistent with the settings in Section 4.4, having the same backbone network and training strategy. The results of the ablation experiments are shown in Table 5 and Table 6, which fully demonstrate the effectiveness of each module in our proposed method.
5.1.1. Ablation Studies for Each Module
Specifically, on the VEDAI dataset, the IBM and CBB modules contribute the most to the performance improvement, with a cumulative increase of 5.6% in mAP50, due to the typical long-tailed distribution of instance categories on this dataset. Meanwhile, this dataset has good illumination conditions for data acquisition, and the visible light images already contain a lot of useful information, which makes the DFF module that fuses visible light and infrared images have limited performance improvement, with only a 2.7% increase in mAP50. On the FLIR dataset, DFF contributes more to the performance improvement than the other two modules, because this dataset has large variations in illumination conditions for data acquisition, and visible light and infrared images can provide complementary information, but there are only three instance categories, and the data is not very long-tailed. At the same time, we can see that the IBM and CBB modules have limited improvement on mAP50:95, because these two modules mainly balance the categories of samples, and mAP50:95 has higher requirements for localization accuracy. The LLVIP dataset is a remote sensing dataset collected under low-light conditions, with only one category. The baseline model achieves more than 5% improvement in mAP50 accuracy after adding our DFF module.
5.1.2. Impact of Instance-Balanced Mosaic
As described in Section 3.1, the baseline model YOLOv8 uses mosaic data augmentation by default, which crops out tail-class samples, resulting in lower recognition accuracy for tail-class samples in long-tailed distribution datasets. To address this issue, we propose an instance-balanced mosaic, which balances the distribution of head and tail classes by restricting the image stitching direction. To verify the effectiveness of our proposed IBM method, we compare three commonly used data augmentation methods on three datasets. The first method is mosaic data augmentation [20], which stitches four different images into a large image as the input for training, which can improve the model’s detection ability for objects with different scales and backgrounds. The second method is shear augmentation, which shears the image along an axis, thereby improving the model’s detection ability for objects with different shapes and angles. The third method is perspective augmentation [46], which performs perspective transformation on the image to improve the model’s detection ability for objects with different viewpoints and distances. The experimental results are shown in Table 6, which demonstrate that our proposed IBM data augmentation method can achieve the highest detection performance on all three datasets.
5.2. Parameter Analysis
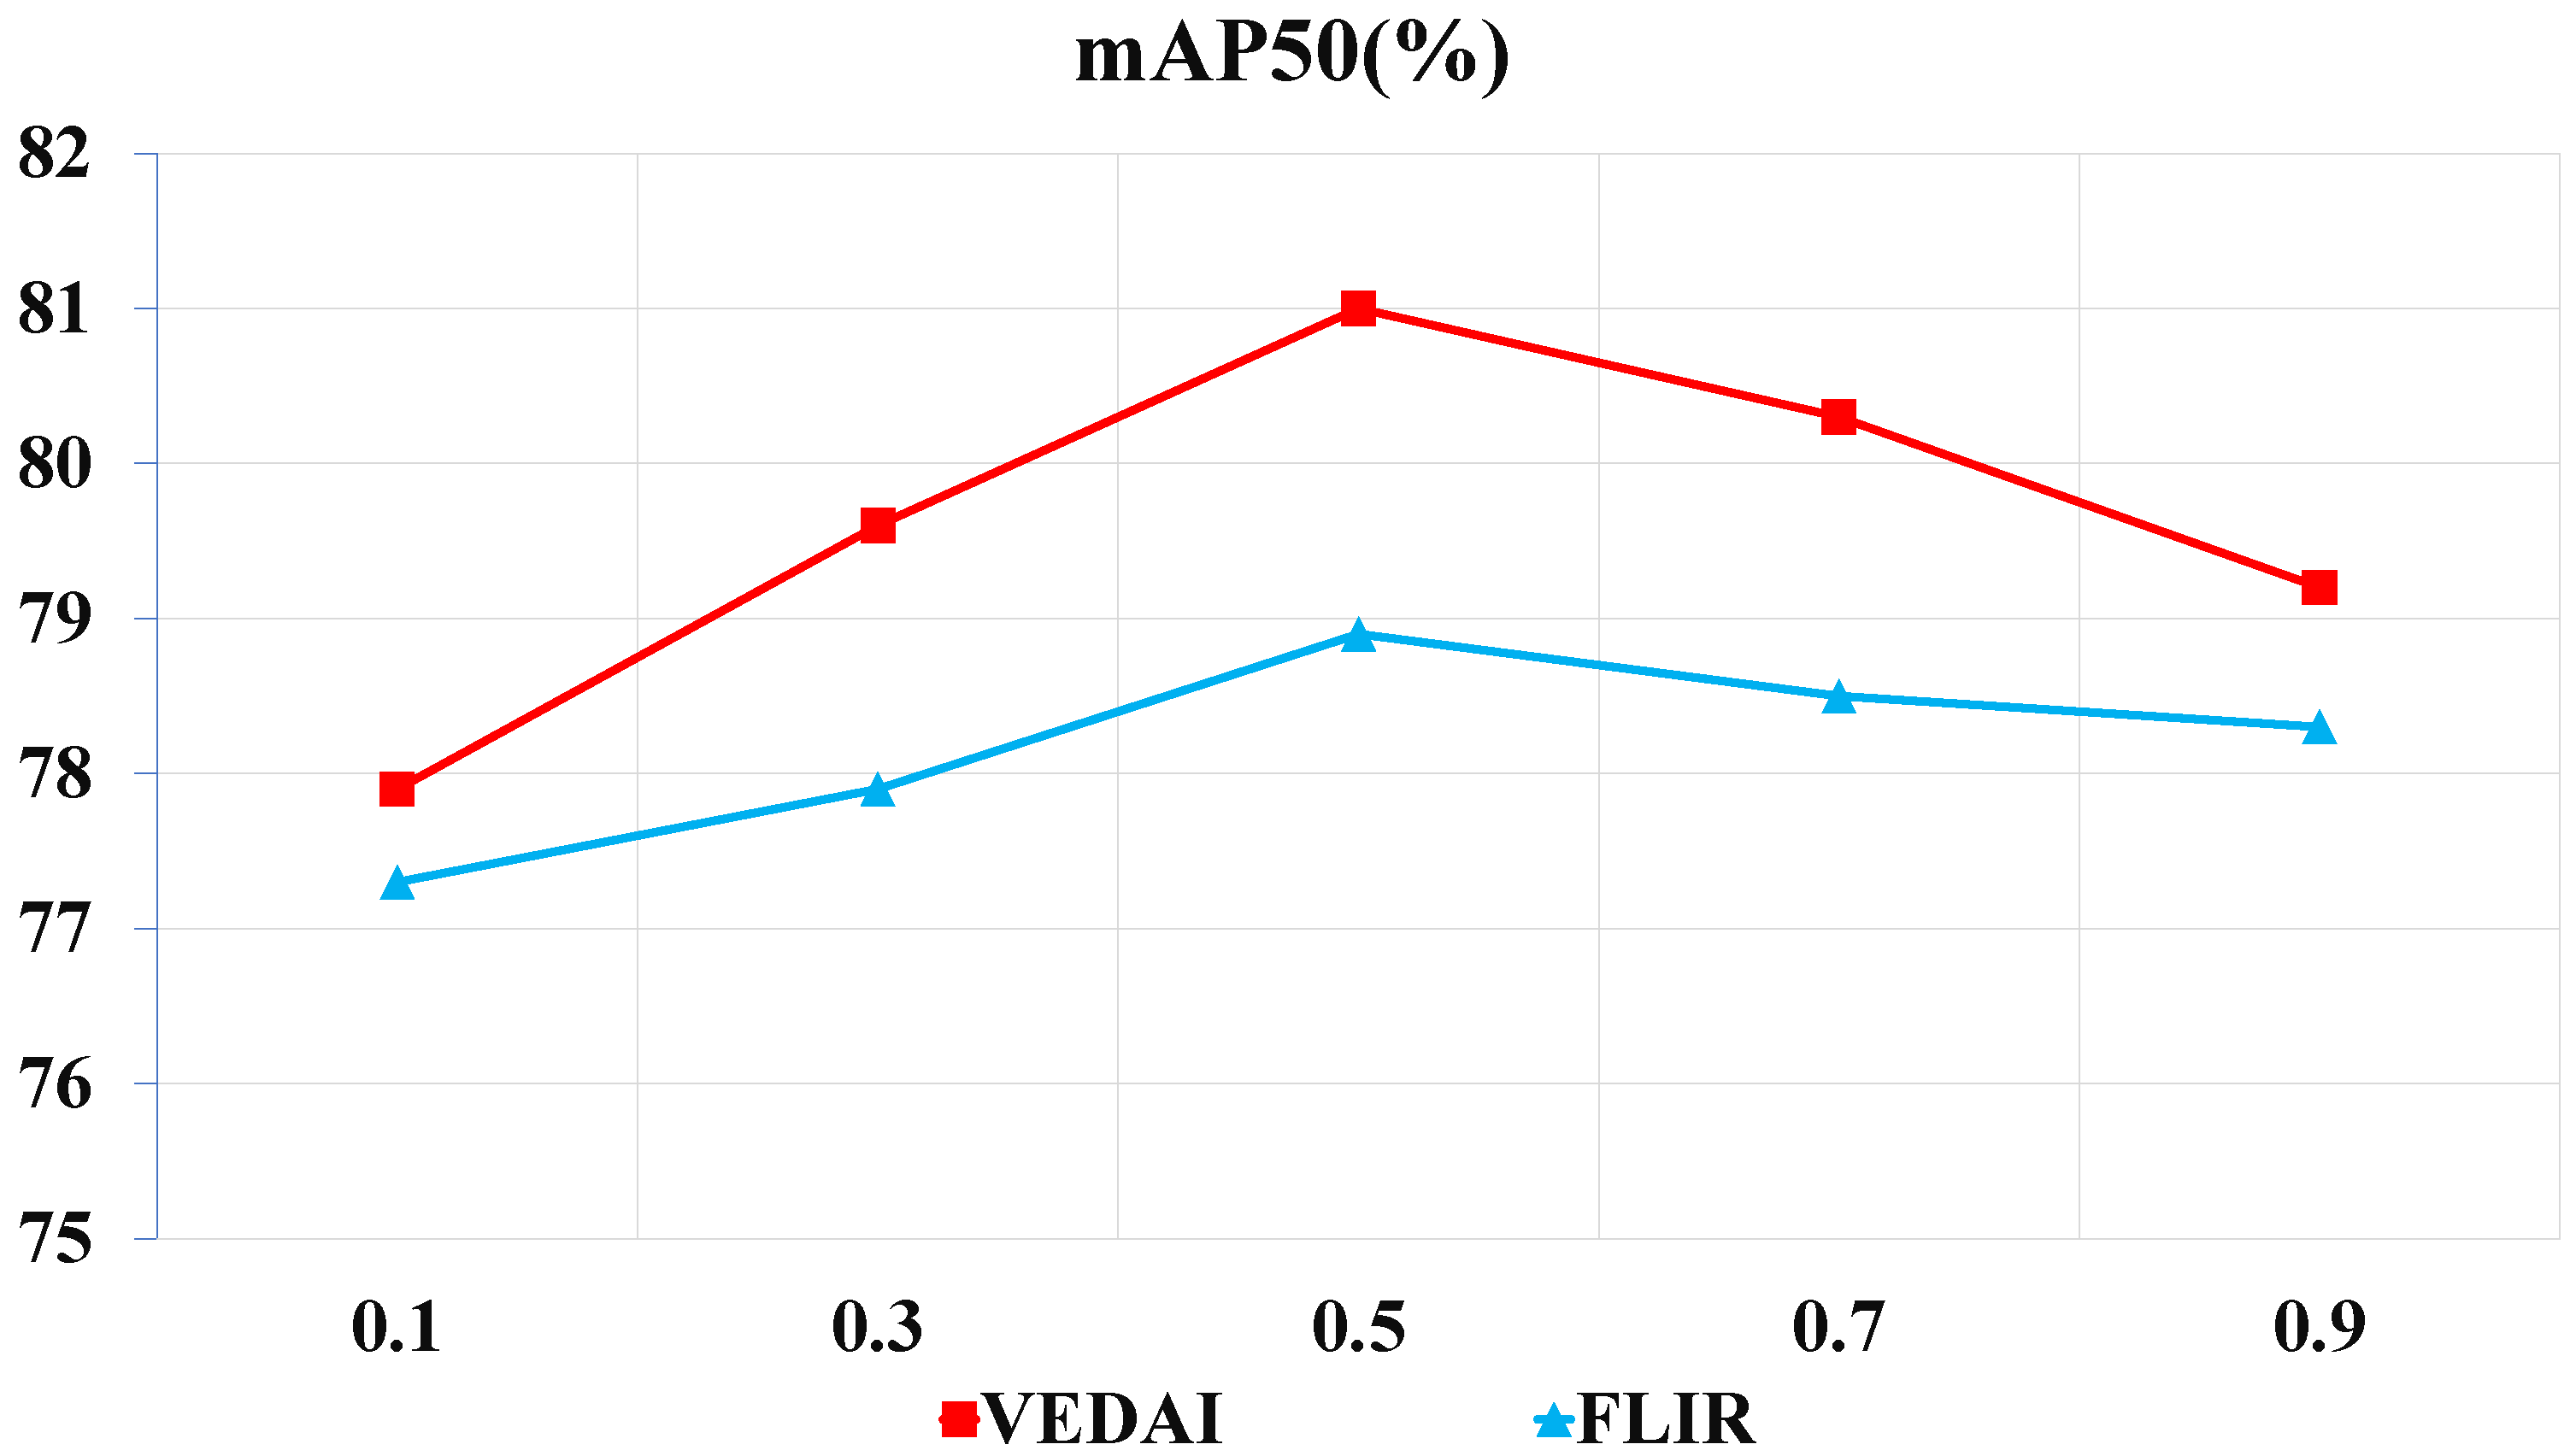
A suitable hyperparameter can make the model have more powerful performance, so in order to obtain a suitable parameter, we conducted a parameter sensitivity experiment on the VEDAI and FLIR datasets, and the experimental results are shown in Figure 10. The hyperparameter is used to weight the classes. The larger the value, the higher the positive weight given to the tail classes. As can be seen from the figure, as the hyperparameter value gradually increases, the detection accuracy of our method experiences a process of gradually increasing and then decreasing. This is because at the beginning, by weighting the tail class samples, the model achieves balanced attention for each class. However, as the value further increases, it causes the model to over-focus on the tail classes, thereby reducing the detection accuracy of the model. When , the model achieves the highest performance on the two datasets, achieving 81% and 78.9% mAP50, respectively.
5.3. Effect of Operators
In Section 3.2, we use the Sobel operator to calculate the image entropy, which assigns reasonable weights for image fusion. In previous studies, many operators have been proposed, such as Sobel operator [34], Prewitt operator [35], Roberts operator [36], etc. To select a suitable operator for our model, we evaluate the performance of each operator on three datasets. As shown in Table 7, the experimental results show that our method is robust to different operators, and using different operators has no significant impact on the detection accuracy of the model.
6. Conclusions
In this paper, we propose a new method for long-tailed object detection in multimodal remote sensing images, which can effectively fuse the complementary information of visible light and infrared images, and adapt to the imbalance between positive and negative samples of different classes. The main contributions of this paper are as follows: (1) Based on image entropy, the dynamic feature fusion module can dynamically adjust the fusion coefficient according to the information content of different source images, and retain more key feature information for subsequent object detection. (2) The instance-balanced mosaic data augmentation method can balance the sampling of instances in the data augmentation stage, provide more sample features for the model, and reduce the negative impact of data distribution imbalance. (3) Class-balanced BCE loss can consider both instance learning difficulty and class learning difficulty, and improve the model’s detection accuracy for tail instances. The experimental results on three public benchmark datasets show that proposed method achieves state-of-the-art performance.
In summary, we propose a new method for long-tailed object detection in multimodal remote sensing images, which can effectively fuse the complementary information of visible light and infrared images, and adapt to the imbalance between positive and negative samples of different classes. Our method can improve detection accuracy and robustness of remote sensing objects, especially for tail classes. However, our method is not robust to multi-source images that are not geometrically aligned. In future, we plan to extend our method to other modalities such as radar and hyperspectral images, and explore more effective methods to deal with long-tailed data distribution.
Author Contributions
Conceptualization, J.Z. and S.H.; methodology, J.Y.; software, J.Y.; validation, J.Y., M.Y. and S.L.; formal analysis, J.Y.; writing—original draft preparation, J.Y.; funding acquisition, S.L. All authors have read and agreed to the published version of the manuscript.
Funding
This research was funded by the National Natural Science Foundation of China (grant numbers 62101571 and 61806215).
Data Availability Statement
All the datasets presented in this paper can be found through the referenced papers.
Conflicts of Interest
The authors declare no conflict of interest.
References
- Earthdata. What Is Remote Sensing?|Earthdata. 2021. Available online: https://www.earthdata.nasa.gov/learn/backgrounders/remote-sensing (accessed on 11 September 2023).
- Chi, M.; Plaza, A.; Benediktsson, J.A.; Sun, Z.; Shen, J.; Zhu, Y. Big Data for Remote Sensing: Challenges and Opportunities. Proc. IEEE 2016, 104, 2207–2219. [Google Scholar] [CrossRef]
- Redmon, J.; Divvala, S.; Girshick, R.; Farhadi, A. You only look once: Unified, real-time object detection. In Proceedings of the IEEE Conference on Computer Vision and Pattern Recognition, Las Vegas, NV, USA, 26 June–1 July 2016; pp. 779–788. [Google Scholar]
- Liu, W.; Anguelov, D.; Erhan, D.; Szegedy, C.; Reed, S.; Fu, C.Y.; Berg, A.C. Ssd: Single shot multibox detector. In Proceedings of the European Conference on Computer Vision (ECCV), Munich, Germany, 8–14 September 2016; Springer: Berlin/Heidelberg, Germany, 2016; pp. 21–37. [Google Scholar]
- Ren, S.; He, K.; Girshick, R.; Sun, J. Faster r-cnn: Towards real-time object detection with region proposal networks. In Proceedings of the Advances in Neural Information Processing Systems, Lake Tahoe, NV, USA, 6–14 December 2015; pp. 91–99. [Google Scholar]
- He, K.; Gkioxari, G.; Dollár, P.; Girshick, R. Mask R-CNN. In Proceedings of the IEEE International Conference on Computer Vision, Venice, Italy, 22–29 October 2017; pp. 2961–2969. [Google Scholar]
- Girshick, R.; Donahue, J.; Darrell, T.; Malik, J. Rich feature hierarchies for accurate object detection and semantic segmentation. In Proceedings of the IEEE Conference on Computer Vision and Pattern Recognition, Columbus, OH, USA, 23–28 June 2014; pp. 580–587. [Google Scholar]
- Janakiramaiah, B.; Kalyani, G.; Karuna, A.; Prasad, L.N.; Krishna, M. Military object detection in defense using multi-level capsule networks. Soft Comput. 2021, 27, 1045–1059. [Google Scholar] [CrossRef]
- Ennouri, N.; Mourshed, M.; Bray, M. Advances in remote sensing applications for urban sustainability. Euro-Mediterr. J. Environ. Integr. 2016, 1, 1–15. [Google Scholar]
- Rezaei, M.; Azarmi, M.; Pour Mir, F.M. Traffic-Net: 3D Traffic Monitoring Using a Single Camera. arXiv 2021, arXiv:2109.09165. [Google Scholar] [CrossRef]
- Ma, T.J. Remote sensing detection enhancement. J. Big Data 2021, 8, 1–13. [Google Scholar] [CrossRef]
- Liu, Z.; Miao, Z.; Zhan, X.; Wang, J.; Gong, B.; Yu, S.X. Large-scale long-tailed recognition in an open world. In Proceedings of the IEEE Conference on Computer Vision and Pattern Recognition, Long Beach, CA, USA, 15–20 June 2019; pp. 2537–2546. [Google Scholar]
- Li, B.; Yao, Y.; Tan, J.; Zhang, G.; Yu, F.; Lu, J.; Luo, Y. Equalized focal loss for dense long-tailed object detection. In Proceedings of the IEEE/CVF Conference on Computer Vision and Pattern Recognition, New Orleans, LA, USA, 18–24 June 2022; pp. 1–10. [Google Scholar]
- Zang, Y.; Zhou, K.; Huang, C.; Loy, C.C. Semi-Supervised and Long-Tailed Object Detection with CascadeMatch. Int. J. Comput. Vis. 2023, 131, 987–1001. [Google Scholar] [CrossRef]
- Wang, T.; Zhu, Y.; Zhao, C.; Zeng, W.; Wang, J.; Tang, M. Adaptive class suppression loss for long-tail object detection. In Proceedings of the 2021 IEEE/CVF Conference on Computer Vision and Pattern Recognition (CVPR), Nashville, TN, USA, 20–25 June 2021; pp. 3103–3112. [Google Scholar]
- Zhao, W.; Liu, J.; Liu, Y.; Zhao, F.; He, Y.; Lu, H. Teaching teachers first and then student: Hierarchical distillation to improve long-tailed object recognition in aerial images. IEEE Trans. Geosci. Remote Sens. 2022, 60, 1–12. [Google Scholar] [CrossRef]
- Duan, Y.; Liu, X.; Jatowt, A.; Yu, H.T.; Lynden, S.; Kim, K.S.; Matono, A. Long-Tailed Graph Representation Learning via Dual Cost-Sensitive Graph Convolutional Network. Remote Sens. 2022, 14, 3295. [Google Scholar] [CrossRef]
- Shannon, C.E. A Mathematical Theory of Communication. Bell Syst. Tech. J. 1948, 27, 379–423. [Google Scholar] [CrossRef]
- YOLOv8. 2021. Available online: https://github.com/ultralytics/ultralytics (accessed on 11 September 2023).
- Bochkovskiy, A.; Wang, C.Y.; Liao, H.Y.M. YOLOv4: Optimal Speed and Accuracy of Object Detection. arXiv 2020, arXiv:2004.10934. [Google Scholar]
- Liu, X.; Li, H.; Wang, J.; Li, L.; Ouyang, W. Deep learning for generic object detection: A survey. Int. J. Comput. Vis. 2020, 128, 261–318. [Google Scholar] [CrossRef]
- Yaman, B.; Mahmud, T.; Liu, C.H. Instance-Aware Repeat Factor Sampling for Long-Tailed Object Detection. arXiv 2023, arXiv:2305.08069. [Google Scholar]
- Li, Y.; Wang, T.; Kang, B.; Tang, S.; Wang, C.; Li, J.; Feng, J. Overcoming classifier imbalance for long-tail object detection with balanced group softmax. In Proceedings of the IEEE/CVF Conference on Computer Vision and Pattern Recognition, Seattle, WA, USA, 13–19 June 2020; pp. 10991–11000. [Google Scholar]
- Lin, T.Y.; Goyal, P.; Girshick, R.; He, K.; Dollár, P. Focal loss for dense object detection. In Proceedings of the IEEE International Conference on Computer Vision, Venice, Italy, 22–29 October 2017; pp. 2980–2988. [Google Scholar]
- Tan, J.; Wang, C.; Li, B.; Li, Q.; Ouyang, W.; Yin, C.; Yan, J. Equalization loss for long-tailed object recognition. In Proceedings of the IEEE/CVF Conference on Computer Vision and Pattern Recognition, Seattle, WA, USA, 13–19 June 2020; pp. 11662–11671. [Google Scholar]
- Liu, J.; Fan, X.; Jiang, J.; Liu, R.; Luo, Z. Learning a Deep Multi-Scale Feature Ensemble and an Edge-Attention Guidance for Image Fusion. IEEE Trans. Circuits Syst. Video Technol. 2021, 32, 105–119. [Google Scholar] [CrossRef]
- Zhang, J.; Lei, J.; Xie, W.; Fang, Z.; Li, Y.; Du, Q. SuperYOLO: Super Resolution Assisted Object Detection in Multimodal Remote Sensing Imagery. IEEE Trans. Geosci. Remote Sens. 2023, 61, 1–15. [Google Scholar] [CrossRef]
- Chen, C.; Zhao, X.; Wang, J.; Li, D.; Guan, Y.; Hong, J. Dynamic graph convolutional network for assembly behavior recognition based on attention mechanism and multi-scale feature fusion. Sci. Rep. 2022, 12, 7394. [Google Scholar] [CrossRef]
- Li, J.; Li, B.; Jiang, Y.; Cai, W. MSAt-GAN: A generative adversarial network based on multi-scale and deep attention mechanism for infrared and visible light image fusion. Complex Intell. Syst. 2022, 8, 4753–4781. [Google Scholar] [CrossRef]
- Ai, Y.; Liu, X.; Zhai, H.; Li, J.; Liu, S.; An, H.; Zhang, W. Multi-Scale Feature Fusion with Attention Mechanism Based on CGAN Network for Infrared Image Colorization. Appl. Sci. 2023, 13, 4686. [Google Scholar] [CrossRef]
- Ahmed, M.R.; Ashrafi, A.F.; Ahmed, R.U.; Shatabda, S.; Islam, A.M.; Islam, S. DoubleU-NetPlus: A novel attention and context-guided dual U-Net with multi-scale residual feature fusion network for semantic segmentation of medical images. Neural Comput. Appl. 2023, 35, 14379–14401. [Google Scholar] [CrossRef]
- YOLOv5. 2021. Available online: https://github.com/ultralytics/yolov5 (accessed on 14 September 2023).
- Zheng, Z.; Wang, P.; Liu, W.; Li, J.; Ye, R.; Ren, D. Distance-IoU Loss: Faster and Better Learning for Bounding Box Regression. Proc. Aaai Conf. Artif. Intell. 2020, 34, 12993–13000. [Google Scholar] [CrossRef]
- Sobel, I. Camera Models and Machine Perception; Technical Report; Stanford University: Standford, CA, USA, 1968. [Google Scholar]
- Prewitt, J.M. Object enhancement and extraction. Pict. Process. Psychopictorics 1970, 10, 15–19. [Google Scholar]
- Roberts, L.G. Machine perception of three-dimensional solids. In Optical and Electro-Optical Information Processing; Massachusetts Institute of Technology: Cambridge, MA, USA, 1963; pp. 159–197. [Google Scholar]
- Kapur, J.; Sahoo, P.; Wong, A. A new method for gray-level picture thresholding using the entropy of the histogram. Comput. Vision Graph. Image Process. 1986, 29, 273–285. [Google Scholar] [CrossRef]
- Li, X.; Wang, W.; Wu, L.; Chen, S.; Hu, X.; Li, J.; Tang, J.; Yang, J. Generalized focal loss: Learning qualified and distributed bounding boxes for dense object detection. Adva. Neural Inf. Process. Syst. 2020, 33, 21002–21012. [Google Scholar]
- Feng, C.; Zhong, Y.; Gao, Y.; Scott, M.R.; Huang, W. TOOD: Task-aligned one-stage object detection. In Proceedings of the 2021 IEEE/CVF Conference on Computer Vision and Pattern Recognition (CVPR), Nashville, TN, USA, 20–25 June 2021; pp. 12893–12902. [Google Scholar]
- Zhang, H.; Fromont, E.; Lefevre, S.; Avignon, B. Multispectral fusion for object detection with cyclic fuse-and-refine blocks. In Proceedings of the 2020 IEEE International Conference on Image Processing (ICIP), Virtual, 25–28 October 2020; pp. 1016–1020. [Google Scholar]
- Redmon, J.; Farhadi, A. YOLOv3: An Incremental Improvement. arXiv 2018, arXiv:1804.02767. [Google Scholar]
- Sharma, M.; Dhanaraj, M.; Karnam, S.; Chachlakis, D.G.; Ptucha, R.; Markopoulos, P.P.; Saber, E. YOLOrs: Object Detection in Multimodal Remote Sensing Imagery. IEEE J. Sel. Top. Appl. Earth Obs. Remote Sens. 2021, 14, 1497–1508. [Google Scholar] [CrossRef]
- Pham, M.T.; Courtrai, L.; Friguet, C.; Lefèvre, S.; Baussard, A. YOLO-Fine: One-Stage Detector of Small Objects under Various Backgrounds in Remote Sensing Images. Remote Sens. 2020, 12, 2501. [Google Scholar] [CrossRef]
- Fang, Q.; Wang, Z. Cross-Modality Attentive Feature Fusion for Object Detection in Multispectral Remote Sensing Imagery. Pattern Recognit. 2022, 130, 108786. [Google Scholar]
- Zhang, H.; Fromont, E.; Lefevre, S.; Avignon, B. Guided attentive feature fusion for multispectral pedestrian detection. In Proceedings of the 2021 IEEE Winter Conference on Applications of Computer Vision (WACV), Waikoloa, HI, USA, 3–8 January 2021. [Google Scholar] [CrossRef]
- Wang, K.; Fang, B.; Qian, J.; Yang, S.; Zhou, X.; Zhou, J. Perspective transformation data augmentation for object detection. IEEE Access 2019, 8, 4935–4943. [Google Scholar] [CrossRef]
Figure 1.
Comparison of visible light and infrared images. (a) Image examples from the LLVIP dataset. In low-light environments, infrared images can provide more information than visible light images. (b) Image examples from the VEDAI dataset. In good lighting conditions, visible light images can provide more color, texture and other detail information.

Figure 2.
A combination plot of instance number and detection accuracy on the VEDAI dataset.

Figure 3.
An overview of the model’s overall framework. Our model is based on YOLOv8 architecture, and the main contributions are as follows: (1) we propose the dynamic feature fusion module to achieve efficient and accurate fusion of multi-source images; (2) the proposed instance-balanced mosaic reduces the underfitting of the model for tail instances by balancing the sampling of instances; (3) class-balanced BCE loss not only considers the learning difficulty of instances, but also balances the learning difficulty between classes.

Figure 4.
Dynamic feature fusion module. It consists of two parts: a calculation of image entropy module and a multimodal feature fusion module composed of multiple Conv layers. Among them, IR represents infrared image and RGB represents visible light image.
Figure 4.
Dynamic feature fusion module. It consists of two parts: a calculation of image entropy module and a multimodal feature fusion module composed of multiple Conv layers. Among them, IR represents infrared image and RGB represents visible light image.

Figure 5.
A schematic diagram of the instance-balanced mosaic method. It consists of three steps: first, generating a gray image as the image to be stitched and randomly selecting four images; second, randomly selecting a stitching center point in the gray image, and calculating the stitching point and direction of the selected images in turn; third, combining the four images into the gray image according to the stitching point and direction to generate a new image.

Figure 6.
(a) Class distribution diagram of FLIR dataset. (b) Class distribution diagram of VEDAI dataset. (Because the LLVIP dataset has only one category, this figure does not show it).
Figure 6.
(a) Class distribution diagram of FLIR dataset. (b) Class distribution diagram of VEDAI dataset. (Because the LLVIP dataset has only one category, this figure does not show it).

Figure 7.
(a) Normalized confusion matrix of the baseline methods. (b) Our method.

Figure 8.
(a) Normalized confusion matrix of the baseline method. (b) Normalized confusion matrix of our method.
Figure 8.
(a) Normalized confusion matrix of the baseline method. (b) Normalized confusion matrix of our method.

Figure 9.
(a–e) Detection visualization on FLIR dataset. Yellow ellipses represent the targets missed by the model in detection, and purple ellipses indicate the targets falsely detected by the model.
Figure 9.
(a–e) Detection visualization on FLIR dataset. Yellow ellipses represent the targets missed by the model in detection, and purple ellipses indicate the targets falsely detected by the model.

Figure 10.
Parameter analysis of hyperparameter on VEDAI and FLIR datasets.


Table 1.
Summary of the dataset.
| Dataset | #Classes | Image Size | #Train | #Test |
|---|---|---|---|---|
| FLIR | 3 | 640 × 512 | 4129 | 1013 |
| LLVIP | 1 | 1280 × 1024 | 12,025 | 3463 |
| VEDAI | 8 | 1024 × 1024 | 1089 | 121 |
Table 2.
Comparison of our method with other state-of-the-art methods on the VEDAI dataset. The values in the table are mAP50 .
Table 2.
Comparison of our method with other state-of-the-art methods on the VEDAI dataset. The values in the table are mAP50 .
| Category | Car | Pickup | Camping | Truck | Other | Tractor | Boat | Van | Total | |
|---|---|---|---|---|---|---|---|---|---|---|
| Instances | 134 | 95 | 39 | 30 | 20 | 19 | 17 | 10 | 364 | |
| YOLOv3 [41] | IR | 80.2 | 67.0 | 65.6 | 47.8 | 25.9 | 40.1 | 32.7 | 53.3 | 51.5 |
| RGB | 83.1 | 71.5 | 69.1 | 59.3 | 48.9 | 67.3 | 33.5 | 55.7 | 61.1 | |
| Multi | 84.6 | 72.7 | 67.1 | 62.0 | 43.0 | 65.2 | 37.1 | 58.3 | 61.3 | |
| YOLOv4 [20] | IR | 80.5 | 67.9 | 68.8 | 53.7 | 30.0 | 44.2 | 25.4 | 51.4 | 52.8 |
| RGB | 83.7 | 73.4 | 71.2 | 59.1 | 51.7 | 65.9 | 34.3 | 60.3 | 62.4 | |
| Multi | 85.5 | 72.8 | 72.4 | 62.8 | 48.9 | 69.0 | 34.3 | 54.7 | 62.6 | |
| YOLOv5s [32] | IR | 77.3 | 65.3 | 66.5 | 51.6 | 25.9 | 42.4 | 21.9 | 48.9 | 49.9 |
| RGB | 80.1 | 58.0 | 66.1 | 51.5 | 45.8 | 64.4 | 21.6 | 40.9 | 54.8 | |
| Multi | 80.8 | 68.5 | 69.1 | 54.7 | 46.8 | 64.3 | 24.3 | 46.0 | 56.8 | |
| YOLOrs [42] | IR | 82.0 | 73.9 | 63.8 | 54.2 | 44.0 | 54.4 | 22.0 | 43.4 | 54.7 |
| RGB | 85.3 | 72.9 | 70.3 | 50.7 | 42.7 | 76.8 | 18.7 | 38.9 | 57.0 | |
| Multi | 84.2 | 78.3 | 68.8 | 52.6 | 46.8 | 67.9 | 21.5 | 57.9 | 59.7 | |
| YOLO-Fine [43] | IR | 76.8 | 74.4 | 64.7 | 63.5 | 45.0 | 78.1 | 70.0 | 77.9 | 68.2 |
| RGB | 79.7 | 74.5 | 77.1 | 81.0 | 37.3 | 70.7 | 60.8 | 63.6 | 68.8 | |
| YOLOFusion [44] | IR | 86.7 | 75.9 | 66.6 | 77.1 | 43.0 | 62.3 | 70.7 | 84.3 | 70.8 |
| RGB | 91.1 | 82.3 | 75.1 | 78.3 | 33.3 | 81.2 | 71.8 | 62.2 | 71.9 | |
| Multi | 91.7 | 85.9 | 78.9 | 78.1 | 54.7 | 71.9 | 71.7 | 75.2 | 75.9 | |
| SuperYOLO [27] | IR | 87.9 | 81.4 | 76.9 | 61.6 | 39.4 | 60.6 | 46.1 | 71.0 | 65.6 |
| RGB | 90.3 | 82.7 | 76.7 | 68.6 | 53.9 | 79.5 | 58.1 | 70.3 | 72.5 | |
| Multi | 91.1 | 85.7 | 79.3 | 70.2 | 57.3 | 80.4 | 60.2 | 76.5 | 75.1 | |
| Ours | IR | 88.9 | 87.4 | 81.3 | 78.4 | 60.2 | 80.7 | 70.1 | 75.7 | 76.6 |
| RGB | 88.4 | 80.1 | 77.7 | 78.8 | 51.3 | 69.8 | 64.0 | 71.4 | 72.7 | |
| Multi | 91.6 | 87.2 | 84.1 | 85.1 | 72.0 | 84.7 | 75.7 | 80.7 | 81.0 | |
Note: The best results are shown in bold.
Table 3.
Comparison of our method with other state-of-the-art methods on the FLIR dataset.
| Model | Data | Backbone | mAP50 | mAP50:95 |
|---|---|---|---|---|
| FasterR-CNN [5] | RGB | ResNet50 | 64.9 | 28.9 |
| FasterR-CNN [5] | IR | ResNet50 | 74.4 | 37.6 |
| SSD [4] | RGB | VGG16 | 52.2 | 21.8 |
| SSD [4] | IR | VGG16 | 65.5 | 29.6 |
| YOLOv3 [41] | RGB | Darknet53 | 58.3 | 25.7 |
| YOLOv3 [41] | IR | Darknet53 | 73.6 | 36.8 |
| YOLOv5 [32] | RGB | CSPD53 | 67.8 | 31.8 |
| YOLOv5 [32] | IR | CSPD53 | 73.9 | 39.5 |
| YOLOv8 [19] | RGB | - | 60.7 | 28.8 |
| YOLOv8 [19] | IR | - | 73.7 | 38.3 |
| CFR3 [40] | Multi | VGG16 | 72.4 | - |
| GAFF [45] | Multi | ResNet18 | 72.9 | 37.5 |
| YOLOFusion [44] | Multi | CFB | 78.7 | 40.2 |
| SuperYOLO [27] | Multi | YOLO | 74.6 | 39.4 |
| Ours | Multi | YOLO | 78.5 | 42.6 |
Note: The best results are shown in bold.
Table 4.
Comparison of our method with other state-of-the-art methods on the LLVIP dataset.
| Model | Data | Backbone | mAP50 | mAP50:95 |
|---|---|---|---|---|
| FasterR-CNN [5] | RGB | ResNet50 | 91.4 | 49.2 |
| FasterR-CNN [5] | IR | ResNet50 | 96.1 | 61.1 |
| SSD [4] | RGB | VGG16 | 82.6 | 39.8 |
| SSD [4] | IR | VGG16 | 90.2 | 53.5 |
| YOLOv3 [41] | RGB | Darknet53 | 87.1 | - |
| YOLOv3 [41] | IR | Darknet53 | 94.0 | - |
| YOLOv5 [32] | RGB | CSPD53 | 90.8 | - |
| YOLOv5 [32] | IR | CSPD53 | 96.5 | - |
| YOLOv8 [19] | RGB | - | 92.5 | 54.1 |
| YOLOv8 [19] | IR | - | 96.6 | 63.2 |
| YOLOFusion [44] | Multi | CFB | 97.5 | 63.6 |
| SuperYOLO [27] | Multi | YOLO | 96.7 | 65.2 |
| Ours | Multi | YOLO | 97.7 | 67.6 |
Note: The best results are shown in bold.
Table 5.
Ablation experiments on VEDAI, FLIR, LLVIP datasets.
| Dataset | DFF | IBM | CBB | mAP50 | mAP50:95 |
|---|---|---|---|---|---|
| VEDAI | 72.7 | 44.3 | |||
| ✓ | 75.4 | 50.1 | |||
| ✓ | ✓ | 77.7 | 51.4 | ||
| ✓ | ✓ | ✓ | 81.0 | 54.5 | |
| FLIR | 60.7 | 28.8 | |||
| ✓ | 75.2 | 40.4 | |||
| ✓ | ✓ | 76.2 | 41.3 | ||
| ✓ | ✓ | ✓ | 78.5 | 42.6 | |
| LLVIP | 92.5 | 54.1 | |||
| ✓ | 97.7 | 67.6 |
Note: The best results are shown in bold.
Table 6.
The impact of data augmentation. The evaluation metric is mAP50 (%).
| Dataset | VEDAI | FLIR | LLVIP |
|---|---|---|---|
| Mosaic | 79.7 | 76.2 | 97.2 |
| Shear | 76.2 | 75.1 | 96.6 |
| Perspective | 74.4 | 76.0 | 96.9 |
| IBM (ours) | 81.0 | 78.5 | 97.7 |
Note: The best results are shown in bold.
Table 7.
The impact of using different operators in the DFF module. The evaluation metric is mAP50 (%).
Table 7.
The impact of using different operators in the DFF module. The evaluation metric is mAP50 (%).
| Dataset | SobSobel | Prewitt | Robert |
|---|---|---|---|
| VEDAI | 81.0 | 80.1 | 80.6 |
| FLIR | 78.5 | 78.3 | 78.6 |
| LLVIP | 97.7 | 97.7 | 97.6 |
Disclaimer/Publisher’s Note: The statements, opinions and data contained in all publications are solely those of the individual author(s) and contributor(s) and not of MDPI and/or the editor(s). MDPI and/or the editor(s) disclaim responsibility for any injury to people or property resulting from any ideas, methods, instructions or products referred to in the content. |
© 2023 by the authors. Licensee MDPI, Basel, Switzerland. This article is an open access article distributed under the terms and conditions of the Creative Commons Attribution (CC BY) license (https://creativecommons.org/licenses/by/4.0/).
Share and Cite
MDPI and ACS Style
Yang, J.; Yu, M.; Li, S.; Zhang, J.; Hu, S. Long-Tailed Object Detection for Multimodal Remote Sensing Images. Remote Sens. 2023, 15, 4539. https://0-doi-org.brum.beds.ac.uk/10.3390/rs15184539
AMA Style
Yang J, Yu M, Li S, Zhang J, Hu S. Long-Tailed Object Detection for Multimodal Remote Sensing Images. Remote Sensing. 2023; 15(18):4539. https://0-doi-org.brum.beds.ac.uk/10.3390/rs15184539
Chicago/Turabian StyleYang, Jiaxin, Miaomiao Yu, Shuohao Li, Jun Zhang, and Shengze Hu. 2023. "Long-Tailed Object Detection for Multimodal Remote Sensing Images" Remote Sensing 15, no. 18: 4539. https://0-doi-org.brum.beds.ac.uk/10.3390/rs15184539
Note that from the first issue of 2016, this journal uses article numbers instead of page numbers. See further details here.