Article

Research on the Shape Classification Method of Rural Homesteads Based on Parcel Scale—Taking Yangdun Village as an Example

1
Institute of Agricultural Information, Chinese Academy of Agricultural Sciences, Beijing 100081, China
2
Key Laboratory of Agricultural Blockchain Application, Ministry of Agriculture and Rural Affairs, Beijing 100081, China
3
School of Environment & Natural Resources, Renmin University of China, Beijing 100086, China
4
School of Land Science and Technology, China University of Geosciences, Beijing 100083, China
*
Author to whom correspondence should be addressed.
Remote Sens. 2023, 15(19), 4763; https://0-doi-org.brum.beds.ac.uk/10.3390/rs15194763
Submission received: 10 August 2023 / Revised: 20 September 2023 / Accepted: 27 September 2023 / Published: 28 September 2023

Abstract

:
The basic information survey on homesteads requires understanding the shape of homesteads, and the shape of the homesteads based on the spatial location can reflect information such as their outline and regularity, but the current shape classification of rural homesteads at the parcel scale lacks analytical methods. In this study, we endeavor to explore a classification model suitable for characterizing homestead shapes at the parcel scale by assessing the impact of various research methods. Additionally, we aim to uncover the evolutionary patterns in homestead shapes. The study focuses on Yangdun Village, located in Deqing County, Zhejiang Province, as the research area. The data utilized comprise Google Earth satellite imagery and a vector layer representing homesteads at the parcel scale. To classify the shapes of homesteads and compare classification accuracy, we employ a combination of methods, including the fast Fourier transform (FFT), Hu invariant moments (HIM), the Boyce and Clark shape index (BCSI), and the AlexNet model. Our findings reveal the following: (1) The random forest method, when coupled with FFT, demonstrates the highest effectiveness in identifying the shape categories of homesteads, achieving an average accuracy rate of 88.6%. (2) Combining multiple methods does not enhance recognition accuracy; for instance, the accuracy of the FFT + HIM combination was 88.4%. (3) The Boyce and Clark shape index (BCSI) proves unsuitable for classifying homestead shapes, yielding an average accuracy rate of only 58%. Furthermore, there is no precise numerical correlation between the homestead category and the shape index. (4) It is noteworthy that over half of the homesteads in Yangdun Village exhibit rectangular-like shapes. Following the “homesteads reform”, square-like homesteads have experienced significant vacating, resulting in a mixed arrangement of homesteads overall. The research findings can serve as a methodological reference for the investigation of rural homestead shapes. Proficiency in homestead shape classification holds significant importance in the realms of information investigation, regular management, and layout optimization of rural land.

Graphical Abstract

1. Introduction

In China, rural homesteads are owned collectively by villages, representing a welfare guarantee provided by the state to farmers, and they cannot be bought or sold. The term “homesteads” encompasses the land used by rural villagers for constructing various living-related structures, such as houses, courtyards, grain-drying fields, toilets, and cowsheds [1]. Homesteads play a crucial role in rural settlements [2]. In 2015, the Chinese Ministry of Agriculture and Rural Affairs initiated the first wave of rural homestead system reform, selecting 33 counties nationwide as pilot projects for “homesteads reform”. Assessing the status of rural homesteads resources in China is a critical undertaking [3], and understanding their spatial configurations is of paramount importance. The spatial arrangement of homesteads can indicate their regularity, which, in turn, impacts the regularity of neighboring parcels. Irregularities can lead to increased resource utilization costs, particularly in cases of irregularly shaped arable land surrounding homesteads, resulting in higher cultivation expenses. Furthermore, irregularly shaped homesteads pose challenges for rational planning and construction, thereby impacting the surrounding environment and travel accessibility. In both China and Vietnam, rural homesteads are state-owned, with farmers granted the right to utilize them. Given the similarity in homestead components [4], farmers are required to adhere to national policies and planning regulations when undertaking homestead transformations. Rural buildings in Britain are privately owned and can be bought and sold. While these buildings differ from homesteads in China and Vietnam, any alterations must align with state regulations or the Localism Act [5]. Supervision of rural homesteads is often lax, making them susceptible to post-construction expansion or dismantling, thereby impacting the equilibrium between rural construction land and arable land. Consequently, it holds significant importance to understand homestead shape classifications and patterns of change, facilitating information investigation, regular management, and layout optimization of rural land.
Shape classification of homesteads is essential for analyzing the two-dimensional graphics of rural homesteads in China. Similarities exist between these graphics and those of buildings or rural settlements. Numerous scholars have conducted extensive research on describing and classifying such shape features. Broadly, methods for expressing shape features can be categorized into two main types: (1) outline-based shape representation and (2) region-based shape representation.
Outline-based shape representation involves describing shape using the outer boundary of two-dimensional graphics and representing it through contour features. Common methods include Fourier transform, the wavelet descriptor method, chain coding, and shape features. For instance, Li and Zhang utilized Fourier transform to convert vector coordinates into a function in the frequency domain, expressing the boundary shapes of faceted elements of varying scales [6]. While effective for polygons with smooth boundaries, this method may not suit right angles. The wavelet descriptor method compensates for Fourier transform’s limitations in local feature extraction. Thus, Sui and Kim decomposed building images into different scales using wavelet descriptors and described shapes using wavelet coefficient series [7]. The chain code method is simple and can significantly reduce data; however, it is susceptible to noise. Liu and Žalik utilized chain coding to extract key points for representing the shape of two-dimensional graphics [8]. To circumvent the contour point-matching process, Shen et al. transformed the shape into a feature vector using the shape feature bag and represented the shape outline by encoding and aggregating local contour features [9]. While this method is straightforward in terms of calculation, it to some extent neglects visual cognition factors [10].
The second type of region-based method involves utilizing the internal region of the two-dimensional graph to represent shape [11], Mainstream methods within this category encompass four types. (1) The skeleton method [12]: This method entails extracting the skeleton line from the two-dimensional representation of the residence and analyzing settlement shape through multiple rounds of extraction and aggregation. (2) Boyce–Clark shape index [13]: This approach is based on the radius measurement and yields a relative shape index by comparing a standard circle with the shape boundary profile. It is frequently employed to assess urban boundary shapes and analyze the direction and extent of urban expansion. (3) Hu invariant moments (HIM): This method relies on algebraic invariants and introduces moment invariants. Through the nonlinear combination of geometric moments, it derives a set of moments that remain invariant to the translation and rotation of two-dimensional images. For instance, in the literature [14], a high-spatial-resolution method was proposed, characterizing the geometric invariant moments of building shapes from various viewing angles. (4) Matching method: This method involves matching house shapes with letters [15] or graphics [16] and templates and exploring the relationship between residences and templates by calculating similarity.
Both of the abovementioned machine learning (ML) methods heavily rely on manual parameter configuration and expert knowledge [17]. To address this limitation, scholars have explored deep learning (DL) methods, which have gained widespread adoption in fields such as computer vision, natural language processing, and speech recognition, yielding impressive results [18,19]. Among these, convolutional neural networks (CNNs) stand out for their powerful learning capabilities and significant achievements in shape recognition and classification. Consequently, some researchers have applied CNNs to the study of buildings, which can be categorized into two main areas. The first area focuses on building shape recognition. For instance, Yan et al. [20] employed a graph convolutional neural network (GCNN) architecture to analyze the graphical structures of buildings, studying the distinctive characteristics of individual buildings and examining the distribution patterns of building clusters. Yang et al. [21] introduced an integrated classification approach that combines vector-based building data with points of interest, enhancing the GCNN to extract morphological features of buildings. The second area deals with building shape classification. For instance, Meng et al. [22] employed ResNet50 to automatically classify rural building characteristics for large-scale village surveys. Yan et al. [23], with the assistance of the graph convolutional automatic encoder (GCAE) model, conducted an analysis distinguishing various building shapes while effectively representing both local and global shape features. Jiao et al. [24] utilized the AlexNet model to classify and recognize the shapes of large-scale buildings, achieving an impressive recall rate of 92.32%. In comparison to other CNN models, the AlexNet model notably enhanced building shape classification, proving effective even for buildings with complex shapes. The aforementioned research represents valuable progress in utilizing deep learning for building target detection and classification.
In conclusion, numerous studies have examined shape recognition and classification, whether in the context of urban buildings or rural settlements. Traditional feature extraction methods and deep learning approaches are commonly employed. However, rural settlements, in contrast to urban buildings, exhibit greater compositional diversity and dispersion, and their shapes can evolve post-construction. Thus, urban building shape classification methods may not fully encapsulate the complexity of rural homesteads. Rural homesteads encompass more than just buildings; they also include courtyards, grain-basking fields, cowsheds, and other ancillary land. Moreover, not all rural buildings are part of homesteads; for instance, schools, factories, and shops require classification based on land use. Therefore, methods suitable for rural building classification may not necessarily be optimal for rural homestead classification.
Based on the above analysis, we conducted method comparison experiments. These methods have demonstrated effectiveness in recognizing urban and rural buildings and were chosen from four categories based on image contours, image regions, urban boundaries, and deep learning. Consequently, this research aims to achieve the following objectives: (1) determine the optimal method for rural homestead shape classification by comparing traditional and emerging deep learning approaches and (2) uncover the spatiotemporal evolution pattern of rural homestead shapes using Yangdun Village as an illustrative example. The primary contributions of this study are as follows:
(1)
We introduced mature methods from other fields into homestead classification and demonstrated an effective approach for classifying homestead shapes through experimentation, including the determination of key parameters for FFT and the random forest (RF) method.
(2)
We conducted a numerical comparison to reveal the practicality of common shape classification methods for homesteads, encompassing four method categories and eight scenarios, including both machine learning and deep learning.
(3)
We conducted a comparative analysis of multiple feature extraction methods with a single classification algorithm, departing from the common practice of comparing multiple classification methods with a single feature extraction method. This approach offers insights for future research.
(4)
Utilizing Yangdun Village as a case study, we elucidated the spatiotemporal variation patterns in rural homestead shapes in the context of the “homesteads reform”.
The remainder of this article is structured as follows: Section 2 provides an introduction to the research area, data sources, classification scheme, feature extraction methods, and accuracy evaluation criteria. Section 3 outlines an in-depth analysis of the accuracy achieved conducted using various methods in the shape classification of homesteads and elucidates the spatiotemporal evolution patterns of rural homestead shapes in Yangdun Village based on the best classification method. Section 4 and Section 5 comprise discussion and conclusions, respectively.

2. Materials and Methods

This article employs various methods: fast Fourier transform (FFT), Hu invariant moments (HIM), the Boyce and Clark Shape Index (BCSI), and AlexNet. These methods, representing image contours, image regions, urban boundaries, and deep learning approaches, respectively, have been effectively applied in extracting shapes of urban boundaries and rural buildings. However, determining the most suitable single or combined method for classifying homestead shapes required a comprehensive investigation in this study.

2.1. Study Area

In 2015, the Ministry of Agriculture and Rural Affairs of China designated 33 counties (cities and districts) across the country for a pilot program on rural homestead system reform, commonly known as “homesteads reform”. Our research is centered in Yangdun Village, Deqing County, Huzhou City, Zhejiang Province. Deqing County was among the pioneering counties in the first wave of “homesteads reform” pilots and was recognized for its outstanding achievements in rural “homesteads reform” [25]. Over the decade preceding and following the “homesteads reform”, Yangdun Village’s homesteads underwent significant transformations, offering insights into the evolving shape of rural homesteads under this reform. This holds valuable implications for guiding homestead policy development in other regions. Yangdun Village is situated in the southern-central region of Deqing County, at the intersection of Huzhou City and Hangzhou City, covering an area of 6.11 square kilometers. The terrain is predominantly flat, with an average elevation of approximately 12 m, and the region boasts ample water resources. Yangdun Village comprises 931 households organized into 26 groups, with residential buildings dominating the landscape. Homesteads are primarily concentrated in areas with abundant water sources and well-developed road networks, resulting in an overall clustered layout. Figure 1 illustrates the diverse shapes and sizes of homesteads in Yangdun Village. Area 1 exhibits irregular patterns with noticeable elevations and depressions, while areas 2 and 3 feature more regular homestead layouts.

2.2. Data Source

The research encompasses spatial distribution data of homesteads, remote sensing data, and field survey data, with the following specifics:
(1)
Spatial distribution data of homesteads: This dataset includes vector data for the years 2010, 2015, and 2020. The 2010 and 2015 data were meticulously compiled parcel by parcel, utilizing Google Earth satellite imagery and on-site surveys. The 2020 vector data were obtained from the Deqing County Agriculture and Rural Bureau.
(2)
Remote sensing data: Our dataset includes Google Earth satellite images from 2010 and 2015, accessible at https://earth.google.com (accessed on 20 December 2021).
(3)
Field survey data: Field visits were conducted to determine the locations of homesteads within the study area and to document the reasons for any changes.

2.3. Construction of Homestead Patch Classification Scheme

2.3.1. Classification Scheme

FFT, HIM, and the Boyce and Clark shape index (BCSI), along with their various combinations, were employed to extract homestead characteristics. Additionally, we utilized the random forest (RF) algorithm to oversee homestead shape classification. The deep learning method took AlexNet as an example. The specific method flow was as follows: (1) Based on OpenCV, the homesteads in Yangdun Village were divided, and each homestead was cyclically exported. (2) Combining with the shape classification library of homesteads summarized in advance, we manually distinguished and set classification numbers for each homestead and obtained sample standards with different shapes. (3) Fast Fourier transform (FFT), HIM, and the BCSI were used to extract the features of each homestead and divide them into single features and combinations of multiple features. The former refers to the use of a feature extraction algorithm, while the latter refers to the combination of more than two algorithms. (4) Based on different features, the RF method was used to carry out model training. A cross-validation method involving 100 random trials was employed to enhance reliability. In each experiment, 70% of the patches (with a total sample of 877) were randomly selected as the training set. We used the training model to classify the remaining patches, and obtained the classification results for each category of feature. (5) The classification results of the previous step model were compared with the manual classification categories, and the accuracy of the classification results of the RF method based on different feature methods was evaluated. (6) Simultaneously with steps (3)–(5), the AlexNet model based on deep learning was established by using the sample library of homestead shapes, and 100 random experiments were also carried out to obtain classification accuracy. (7) The optimal classification method was selected based on the accuracy evaluation results of various methods. (8) The optimal method was used to study the spatiotemporal evolution characteristics of the homestead shapes in Yangdun Village. The technical route is shown in Figure 2.

2.3.2. Classification Criteria

Based on the analysis of the homesteads in Yangdun Village in 2010, it was found that they had different sizes and shapes and could be classified into four categories. The specific description and diagram are shown in Figure 3.

2.4. Feature Extraction Methods and Scenario Design

2.4.1. Fast Fourier Transform Algorithms

Fast Fourier transform (FFT) is simple and efficient, and it is one of the common methods to extract the boundary contour of an object [26,27]. Therefore, this study attempted to employ this method for the identification and classification of homestead boundaries. The difficulty was in how to select an appropriate descriptor. If the value is too large, the recognition efficiency will be reduced, and if it is too small, the features will be lost, and the accuracy of boundary extraction will be affected. Using the equal interval method, multiple tests were conducted on the four homestead categories. As shown in Figure 4, the first column represents four types of original homesteads, and the next five columns are the recognition results of descriptors with values of 50, 40, 30, 20, and 10. Comparative analysis revealed that setting the descriptor to 40 struck a balance between preserving feature integrity and maintaining recognition efficiency.

2.4.2. Hu Invariant Moments Algorithm

The Hu invariant moments (HIM) method, proposed by Hu in 1962 [28], summarizes image features such as shape, symmetry, and structural information through invariant moments. It was often used to analyze the shape rules of images or whether they were of the same category [29]. In this study, it was introduced into the shape feature extraction of homesteads. HIM gave seven related moment expressions (ϕ1–ϕ7). The calculation formula can be found in the literature [28]. The identification results of certain homesteads based on this method are presented in Table 1.

2.4.3. Boyce–Clark (BC) Shape Index

The Boyce and Clark shape index (BCSI) is a widely adopted method in urban space shape measurement. It was proposed by Boyce and Clark in 1964 [30] to address shape boundary measurement challenges. Based on the radius measurement, the BCSI method compares the standard circle with the shape boundary outline to obtain a relative shape index, which is simple and universal, and it can reflect the compactness of the parcel shape; the smaller the value, the more compact the parcels [31]. For example, the BCSI yields smaller values for circular shapes, approaching 0, and larger values for linear shapes.
Based on this method, Wang et al. [31] studied the outline shapes of 31 megacities in China and proposed 15 standard shape indices, as shown in Figure 5A; furthermore, they quantitatively explained the corresponding relationship between the index value range and standard shapes [31]. On this basis, Wang et al. (2022) took Long Town, Mizhi County, as an example and summarized rural settlements into five shapes, as shown in Figure 5B [32]. These two studies show that the number of standard graphics for urban and rural clustering is different. It can be seen that there are differences in the classification results for different application fields. Can this method effectively classify homestead shapes, and how accurate is it in doing so? To address these questions, this study investigated its suitability for homestead shape classification.
In this study, the centroid of the homesteads was used as the center of the standard circle, and rays were emitted from the center at a specific interval angle α. The value of α affected the accuracy of the BCSI, so the parameter setting was very important. The intersection point of the ray and the boundary of the homesteads was defined as the feature point, and the line connecting the feature point and the centroid of the parcels was the radius. The calculation formula is shown in the Formula (1).
B C = i 1 n r i i = 1 n r i × 100 100 n
If there are multiple feature points between a ray and the border of the parcels, which one should be selected as the optimal feature point? As shown in Figure 6a, rays L1, L2, L3, and L4 all have three intersections with the boundary, namely, the internal intersection, central intersection, and external intersection from inside to outside. The three selection effects are shown in Figure 6b–d. After comparison, we found that the external feature points were closest to the shape of the original homesteads. Therefore, the feature point farthest from the centroid was defined as the optimal choice.

2.4.4. Characteristic Scenario Design

The above methods constructed features from two perspectives, such as the outline and area of the homesteads, and each of them had its advantages and disadvantages. Therefore, to explore the best method for extracting the shape of the homesteads, seven scenarios were intentionally designed, as illustrated in Table 2.

2.5. Classification Model Construction

2.5.1. Random Forest Method

The random forest method is a classifier algorithm that combines and integrates multiple decision trees [33,34]. The returned random sample was used as the training set, and each training set generated a new decision tree. After multiple extractions and comparisons of the decision tree scores, the final classification result was determined [35,36]. The RF method has the advantages of strong stability, high precision, easy implementation, and strong noise resistance [37], and it has been widely employed in tasks such as crop information extraction [38], land use classification [39], and tree species identification [40].
When utilizing the RF algorithm for homestead classification, two crucial parameters need consideration, namely the number of randomly extracted feature quantities in the decision tree and the number of decision trees (Ntrees). With the help of results in relevant industry research and actual homestead data tests, the number of feature quantities was the square root of feature quantities [41]. Determination of the parameter Ntrees was closely related to an out-of-bag (OOB) error. When Ntrees iterated to a certain value, the OOB error was insensitive to the change in Ntrees [42]. To avoid the contingency caused by a single test set, 50 random simulation experiments were conducted to mitigate errors (with Ntrees values ranging from 1 to 500). As shown in Figure 7a, each experiment generated a curve, and it was not easy to find the decision tree threshold from Figure 7a, resulting in a statistical chart displaying the average values, as illustrated in Figure 7b. It was observed that once Ntrees reached 120, the OOB error stabilized. Consequently, this value was chosen to optimize the model’s processing time, and the default values were selected for other parameters.

2.5.2. AlexNet Method

The AlexNet network model was proposed by Krizhevsky et al. and made a significant breakthrough in the image classification task of ILSVRC in 2012 [18]. This approach has become a classic in the field of deep learning and has been applied to the classification of building shapes [24]. To preserve the salient features of the image, the maximum pooling layer was used in the AlexNet network. In addition, the Dropout function was applied in the fully connected layer to improve the generalization ability of the model. Therefore, our study tried to use this method to classify the shape of homesteads and accelerate the model training through a GPU to improve the calculation speed.
For this study, the AlexNet convolutional neural network model was implemented using the Python language and the PyTorch deep learning framework. The computer platform for training was the Linux system, the CPU model was AMD-7742, the GPU model was A100-SXM4, and the memory was 40G. The initial learning rate of the network training was set at 0.0002, and the Adam optimizer was employed to facilitate automatic adjustment. The network underwent 100 iterations with 32 samples per batch. In our study, a total of 100 model training and testing sessions were carried out. The average accuracy rate of the model for the classification of the test set was 0.807, the calculated loss value dropped to 0.705, and the experiment took a total of 300 min.

2.6. Accuracy Evaluation

Based on manually labeled category data and the classification standard, we utilized a confusion matrix and the accuracy index to evaluate the model’s classification results. Additionally, we employed key indicators, including accuracy, precision, and recall, to assess the classifier’s performance. The meaning and formulas of these three indicators are as follows: (1) Accuracy (ACC): This metric calculated the ratio of correctly predicted samples to the total number of samples, providing insight into the classifier’s overall classification ability for all categories, as demonstrated in Formula (2). (2) Precision (P): Precision measured, among the samples predicted as positive by the classifier, the proportion of samples that were truly positive compared to all samples predicted as positive. For instance, in our research, the first category was considered positive, while the other three were considered negative. This metric illustrated the classifier’s accuracy in positive classification, as indicated in Formula (3). (3) Recall (R): Recall calculated the proportion of correctly predicted positive samples out of all actual positive samples. This metric reflected the classifier’s ability to identify positive samples, as shown in the Formula (4).
A C C = T P + T N T P + T N + F P + F N
P = T P T P + F P
R = T P T P + F N
where TP represents the number of positive categories judged as positive categories, TN represents the number of positive categories recognized as negative categories, FP represents the number of negative categories judged as positive categories, and FN represents the number of negative categories recognized as negative categories.

3. Results

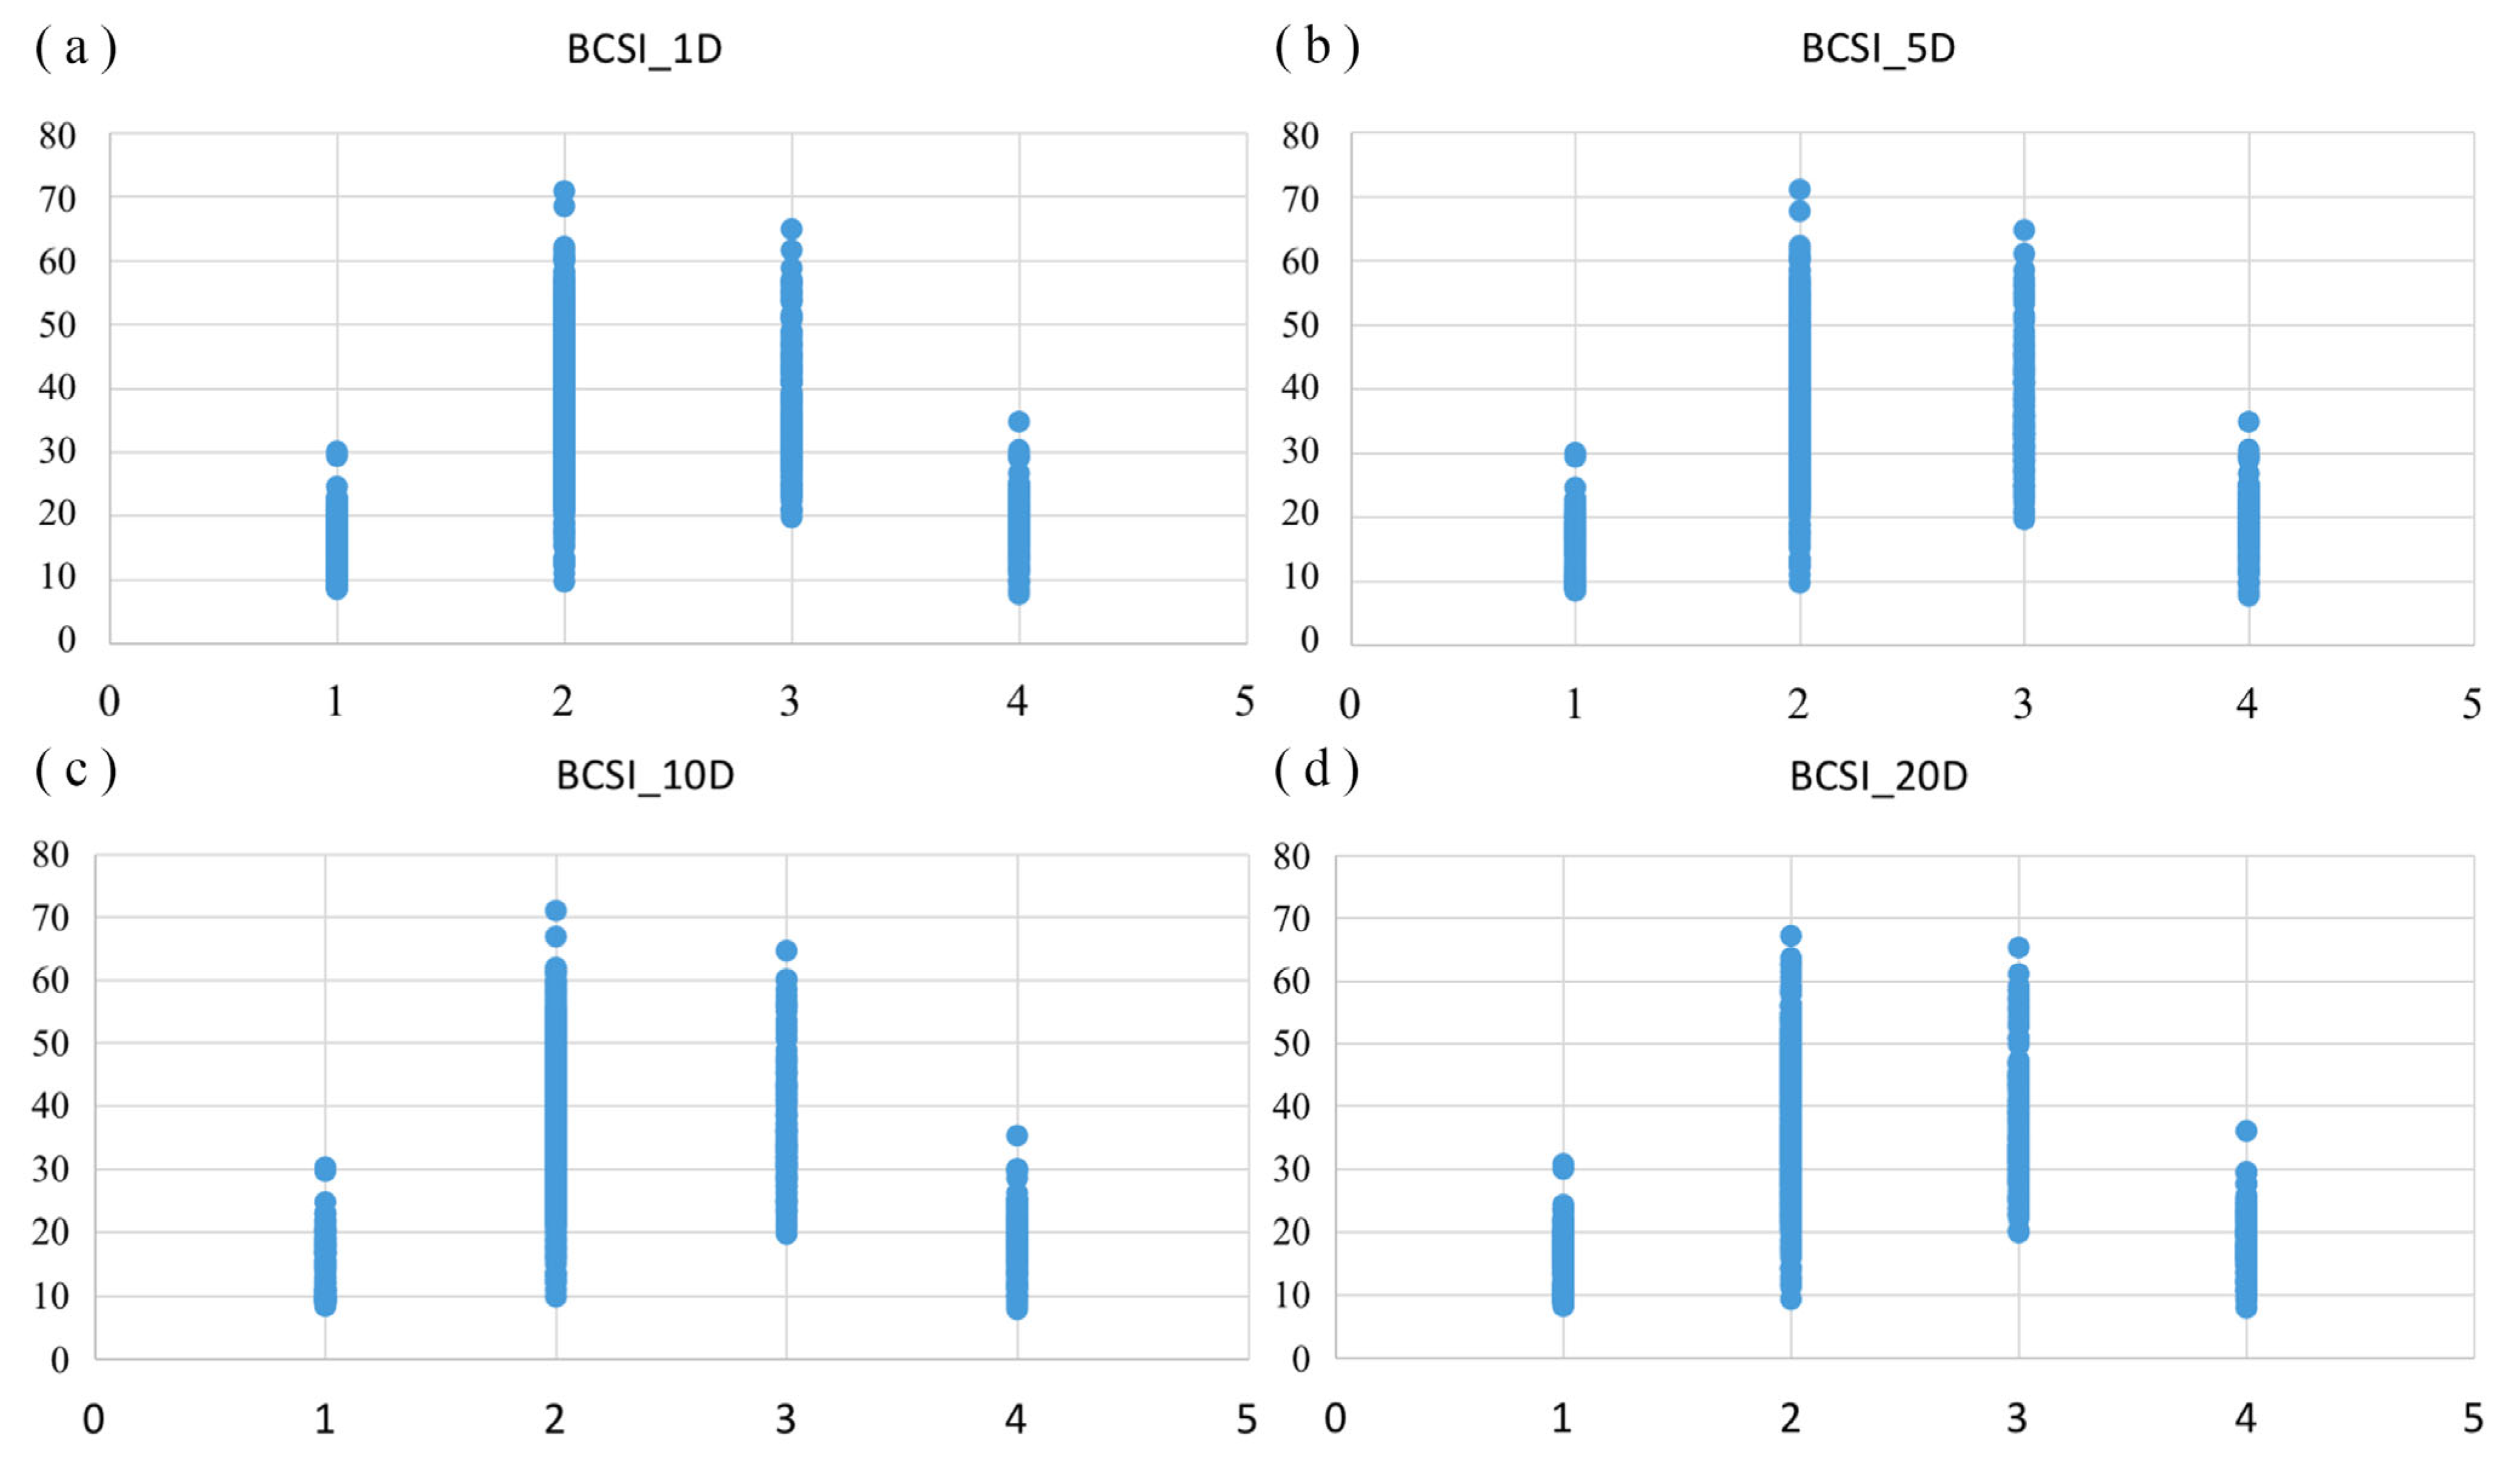
3.1. Effect of Different Interval Degrees of BCSI

The scatter plot depicting the relationship between the BCSI and homestead categories is presented in Figure 8. To investigate the impact of ray interval degrees on the relationship, we specifically analyzed intervals of 1 degree, 5 degrees, 10 degrees, and 20 degrees, and the following was observed: (1) The interval degree of rays caused by the centroid had little effect on the BCSI results of the homesteads, and some values fluctuated with a small range. (2) The BCSI values for homestead parcels were distributed in the range of 6.23–71.06, the BCSI values of homestead parcels in categories 2 and 3 were larger than those of the other two categories, and the distribution of BCSI values in category 1 was relatively centralized. (3) Intersections were observed in the BCSI values of four categories, and the intersections were mainly distributed in the range of 9–25. Within this range, four categories of shapes could not be distinguished. Parcel shapes with a BCSI greater than 35 were classified as either the second or third category, and there was no obvious range correspondence between the set of four categories of shapes and the BCSI.

3.2. Comparison of Classification Accuracy of Different Feature Extraction Technologies

3.2.1. Overall Accuracy

To mitigate the risk of overfitting in classification models tailored to specific datasets and address the challenge of insufficiently convincing individual classification results, a cross-validation approach was employed. This involved training and evaluating the model through 100 random selections of training and verification sets. Figure 9 displayed the results comparing the accuracy rates of seven scenarios, including FS1–FS7, across 100 random experiments using the RF method and AlexNet. It was found that FS1 had the highest average accuracy rate of 88.6%, followed closely by FS4, FS6, and FS7, with little difference among these four. FS2 and FS5 both had an average accuracy rate of 83%, while FS3 had the lowest average accuracy rate. This observation highlights the significant role of FFT in homestead shape classification. In comparison, using the AlexNet model resulted in an average accuracy rate of 80.7% for homesteads, surpassing only the FS3 scenario but falling short of other scenarios.

3.2.2. Between-Category Accuracy

For the sake of clarity in understanding the mutual judgment results across categories in 100 random experiments, we present them in the form of a hierarchical confusion matrix. This matrix revealed that classifiers utilizing FFT and HIM of the RF method exhibit high accuracy, as shown in Figure 10. In addition, Figure 10a reveals that in the case of FFT, 14% of Category 1 homesteads were wrongly identified as Category 2, and 14.8% of Category 3 homesteads were also misidentified as Category 2. These errors were relatively large, indicating that some square-like and irregular rectangular-like homesteads were prone to be misidentified as regular rectangular-like. Furthermore, 8% of Category 4 homesteads were erroneously categorized as Category 1, implying that certain irregular shapes were mistakenly identified as square-like. Misclassification rates for the remaining categories were below 6%. Notably, there were no instances of Category 1 being misclassified as Category 3 or Category 4 being misclassified as Category 3.
Figure 10b illustrated that with HIM, there was a notable 19.8% likelihood of Category 3 being misclassified as Category 2, making it one of the highest inter-category error rates. Additionally, Category 4 was erroneously identified as Category 1 at a rate of 11.5%, with no instances of Category 1 being mistaken for Category 3.
Figure 10c depicted the generally unsatisfactory outcomes when employing the BCSI for homestead shape differentiation, yielding an average accuracy of 58%. Square-like shapes were recognized with the highest accuracy of 75%, while Categories 3 and 4 had lower accuracy rates. Regarding inter-category accuracy, Category 4 was frequently confused with Category 1, and Category 3 was often misclassified as Category 2 with a high probability.
Figure 10d presents the recognition result of combining FFT with the BCSI. Categories 1 and 3 were frequently confused with Category 2, with probabilities of 12.9% and 14.7%, respectively, while 8.6% of Category 4 was erroneously classified as Category 1. Misidentifications occurred among the remaining categories, but the misidentification rates were all below 5%, resulting in an overall satisfactory outcome.
Figure 10e displayed the results of combining HIM and the BCSI, showing significant confusion within each category. Notably, 12.8% of Category 1 was mistakenly identified as Category 2, 9.3% of Category 2 was misclassified as Category 3, 20.1% of Category 3 was erroneously identified as Category 2, and 11.8% of Category 4 was misclassified as Category 1.
Figure 10f illustrated recognition using FFT combined with HIM. It is evident that that the distinction between Categories 1 and 3 was improved, with no mutual confusion. Specifically, 12.8% of Category 1 was classified as Category 2, and 14.8% of Category 3 was mistakenly labeled as Category 2, while the remaining inter-category recognition error rate was minimal.
Figure 10g presents the confusion matrix for identification when combining with FFT, Hu invariant movements, and the BCSI. It could be seen that whether the BCSI was added to FFT and HIM had little effect on the recognition. Categories 1 and 3 were clearly distinguished from each other; however, the identification error rate was higher when Category 1 was mistakenly classified as Category 2 and when Category 3 was erroneously labeled as Category 2, both exceeding 10%.
Figure 10h displayed the results of recognition using the AlexNet model. Notably, the most significant recognition error occurred when Category 3 of homesteads was incorrectly identified as Category 2, accounting for 34.9% of the errors. Category 4 was erroneously classified as Category 1 or Category 3, with both errors exceeding 10%. The recognition error rate for the remaining categories was minimal, and Category 2 exhibited superior recognition and classification, with a correct recognition rate of 91.5%.
In terms of inter-category accuracy for homesteads (Table 3): when considering individual methods, the FFT algorithm outperformed HIM and the BCSI across all categories. The first and second categories exhibited minimal differences, whereas the latter two categories had significant differences. FFT achieved classification accuracy of 10.1% higher in the third category and 9.6% higher in the fourth category compared to HIM. However, the BCSI had low category accuracy rates across all four categories. Within the AlexNet model, only the second category boasted a higher accuracy rate than FFT, reaching 91.5%, while the remaining three categories fell short of FFT’s performance. Regarding recall, the FFT algorithm also exhibited a higher proportion of correct predictions compared to HIM, with gains of 0.2%, 0.7%, 18%, and 17.8% across the four categories. The FFT algorithm outperformed the AlexNet model in recall, while the BCSI had the lowest recall rate. Concerning combination methods, aside from HIM when combined with the BCSI, which showed lower performance, the categories did not differ significantly in terms of precision and recall. Overall, the FFT algorithm demonstrated superiority over the combination of individual indices and the AlexNet model.
In summary, when comparing the two shape feature classification algorithms, FFT proved to be more adept at describing the shape features of homesteads.

3.3. Shape Spatiotemporal Evolution Characteristics of Homesteads in Yangdun Village

Employing the combination of FFT and the RF method to identify the shapes of the homesteads in Yangdun Village for the years 2015 and 2020, the statistical results are presented in Table 4. The findings revealed the following: (1) The predominant shape of homesteads in Yangdun Village was primarily rectangular-like, constituting over 50% of the total. There is a minor variation in the number of square-like and irregular rectangular-like homesteads. Except for 2020, homesteads with irregular shapes were the least common, accounting for 10% of the total. (2) Prior to the “homesteads reform”, there was minimal change in the shape of homesteads. Following the reform, the demolition of the northern part of Yangdun Village resulted in a significant reduction in homesteads. Notably, square-like homesteads witnessed a substantial increase in vacancy rates, dropping from 16.6% to 8.1%. Meanwhile, the proportion of irregular rectangular-like and irregular homesteads experienced a slight uptick.
Figure 11a–c illustrate the spatial distribution of homestead shapes in Yangdun Village in 2010, 2015, and 2020, respectively. Figure 11d shows the changes in the homesteads over the past 10 years, revealing that homesteads of diverse shapes were interspersed throughout the village. Among the four shape categories, rectangular-like homesteads predominantly manifested in clustered formations, with fewer instances of isolation. Between 2010 and 2015, the number of square homesteads in the northern region of Yangdun Village was approximately twice that in the southern region. The majority of the homesteads featuring irregular graphics were solitary, and instances of two irregular homesteads positioned adjacent to one another were rare. Furthermore, the southern villages in Yangdun Village were characterized by a prevalence of rectangular-like homesteads along their borders, with square-like homesteads comprising a minimal proportion.

4. Discussion

Feature extraction methods such as FFT and HIM are widely employed in object recognition and classification [43]. What accounts for the significant disparity in homestead shape classification? These algorithms operate on distinct principles: the former excels at extracting boundaries and outlining features, while the latter specializes in capturing regional characteristics of research objects [44]. Homesteads contained no texture, color, or additional data, and the parcel areas lacked voids or complex structures, so recognition accuracy and stability were superior with FFT as opposed to HIM. Furthermore, while the BCSI method demonstrated superior performance in urban shape classification [31], its effectiveness in homestead classification was notably diminished. The reasons for the substantial difference were as follows: (1) Urban outlines exhibited considerable disparities, resulting in a wide range of BCSI values [31]. Consequently, the BCSI values for homesteads were more concentrated, posing challenges in differentiation. (2) Previous research on cities often had small sample sizes, with many studies having fewer than 100 samples [13,45,46]. In contrast, our dataset comprised 877 homesteads, making it challenging to extrapolate patterns that cover such a diverse range of shapes. (3) The BCSI served as an approximate measure of two-dimensional graphic shapes and did not provide precise identifications [31].
In most studies, a single feature extraction method was utilized to assess classification performance through comparisons with multiple classifiers [20,47,48,49]. Our research primarily centered on evaluating the impacts of various feature extraction methods and their combinations within the context of a single classifier. For example, Yang et al. [50] conducted a comparison between the RF method and other widely-used ML classification algorithms, demonstrating that the RF method yielded superior classification results compared to the decision tree, support vector machine, and naive Bayesian methods. Reference [47] reported that the combination of FFT and the RF method exhibited exceptional pothole detection capabilities, achieving an accuracy rate as high as 96.5%, aligning with our study’s findings. However, Yang et al. [50] did not elaborate on the process of selecting key RF parameters, despite achieving high accuracy with default settings. In our study, we optimized the key parameter (Ntrees), resulting in improved classification accuracy and reduced algorithm runtime. Additionally, Yang et al. [50] exclusively compared three common ML algorithms, overlooking the comparison between ML and DL. Our study, on the other hand, delved into the impact of both ML and DL approaches on homestead shape classification. Our classification accuracy stood at 88.6%, which was lower than the 96.5% reported by Yang et al. [50]. This discrepancy can be attributed to our limited set of standard classifications, making it challenging to categorize a few unique homesteads effectively. Yan et al. [20] employed DL for classifying urban building graphics and noted that GCNN performed well in distinguishing between regular and irregular buildings. However, its classification was limited to these two categories. Building upon their work, we extended the classification criteria by including two additional categories, thus enriching the classification process. We also analyzed the spatiotemporal variation characteristics of the shape of the case village homesteads. Due to the limited availability of detailed spatial data for village homesteads, it remains challenging to acquire a sufficient sample size for model training and testing. Additionally, the range of shape categories defined for homesteads in this research may require enrichment. In future studies, we plan to expand the variety of standard types, increase the sample size, and diversify the comparison methods.
Building on the preceding discussion, this study incorporated established methods from other domains in the realm of homestead classification. Our proposed method effectively categorizes homestead shapes, reducing the need for time-consuming manual evaluations and mitigating the variability introduced by cognitive differences. This approach facilitates managers in promptly understanding and adjusting homesteads regularities, with broad applications in rural homesteads investigation and management. Moreover, it holds significance as a reference for international rural planning.

5. Conclusions

The conclusions are as follows: First, we found that the method combining fast Fourier transform (FFT) and the random forest (RF) method proved to be more suitable for homestead shape classification, achieving an average accuracy rate of 88.6%. Second, the combination of multiple feature extraction methods did not lead to improved recognition accuracy. Specifically, the accuracy of the FFT + HIM combination was 88.4%, while the accuracy of FFT + HIM + BCSI was 88%. Third, it should be noted that the BCSI, although commonly used in urban contour classification, proved unsuitable for homesteads, yielding an average accuracy rate of only 58%. There was no precise numerical correlation between the category and shape index in homesteads. Fourth, it is worth noting that over half of the homesteads in Yangdun Village had a rectangular shape. In the five years preceding and following the “homesteads reform”, there was a significant increase in the number of regular-shaped homesteads being vacated, while irregular-shaped homesteads exhibited an upward trend. The method we have proposed has the potential to assist villages in China and globally in swiftly assessing the level of homestead regulation.

Author Contributions

Conceptualization, J.Z. and S.L.; Methodology, J.Z. and B.F.; Software, H.L. and R.W.; Validation, J.Z., H.L. and Y.L.; Formal Analysis, H.L. and Y.L.; Investigation, J.Z. and B.F.; Resources, B.F.; Data Curation, R.W.; Writing—Original Draft Preparation, J.Z., B.F. and Y.L.; Writing—Review and Editing, S.L.; Visualization, Y.L. and R.W.; Supervision, S.L.; Project Administration, S.L.; Funding Acquisition, B.F. and S.L. All authors have read and agreed to the published version of the manuscript.

Funding

This research was supported by Central Public-interest Scientific Institution Basal Research Fund (No. CAAS-ASTIP-2023-AII, No. JBYW-AII-2022-17, and No. JBYW-AII-2023-02).

Data Availability Statement

The datasets used and/or analyzed during the current study are available from the corresponding authors upon reasonable request.

Acknowledgments

We thank the Deqing County Bureau of Agriculture and Rural Areas and Geographic Information Center, Huzhou City, Zhejiang Province, for the data provided. Furthermore, we thank the editors and anonymous reviewers for their insightful comments and constructive suggestions.

Conflicts of Interest

The authors declare no conflict of interest.

References

  1. Xu, Z.; Zhuo, Y.; Li, G.; Bennett, R.M.; Liao, R.; Wu, C.; Wu, Y. An LADM-based model to facilitate land tenure reform of rural homesteads in China. Land Use Policy 2022, 120, 106271. [Google Scholar] [CrossRef]
  2. Zhang, J.; Liu, S.; Zhao, Z.; Li, B.; Fan, B.; Zhou, G. Spatio-Temporal Features and Influencing Factors of Homesteads Expansion at Village Scale. Land 2022, 11, 1706. [Google Scholar] [CrossRef]
  3. Ren, Y.; Wang, Y.; Li, Z.; Zhao, Z. Spatial and temporal distribution and utilization characteristics of rural homestead resources in China. J. China Agric. Univ. 2020, 25, 175–186. [Google Scholar]
  4. Lin, C. Comparison and reference of rural homestead management system between China and Vietnam. World Agric. 2018, 107–113. [Google Scholar] [CrossRef]
  5. Xiao, W.; Gao, L. Main practices and enlightenment of high-quality management of rural houses in typical foreign countries. J. Hunan Inst. Social. 2020, 21, 78–82. [Google Scholar] [CrossRef]
  6. Li, J.; Zhang, J. A morphing method for smooth area features based on Fourier transform. Geomat. Inf. Sci. Wuhan Univ. 2017, 42, 1104–1109. [Google Scholar] [CrossRef]
  7. Sui, K.; Kim, H.-G. Research on application of multimedia image processing technology based on wavelet transform. Eurasip J. Image Video Process. 2019, 2019, 24. [Google Scholar] [CrossRef]
  8. Liu, Y.K.; Žalik, B. An efficient chain code with Huffman coding. Pattern Recognit. 2004, 38, 553–557. [Google Scholar] [CrossRef]
  9. Shen, W.; Du, C.; Jiang, Y.; Zeng, D.; Zhang, Z. Bag of Shape Features with a learned pooling function for shape recognition. Pattern Recognit. Lett. 2018, 106, 33–40. [Google Scholar] [CrossRef]
  10. Yu, Y.; He, K.; Wu, F. Graph convolution neural network method for shape classification of areal settlements. Acta Geod. Et Cartogr. Sin. 2022, 51, 2390–2402. [Google Scholar] [CrossRef]
  11. Liu, L.; Zou, Y.; Chen, B. Review on Research Progress of 2D Shape Description and Classification. Comput. Eng. Appl. 2021, 57, 39–47. [Google Scholar] [CrossRef]
  12. Li, Y.; Lu, X.; Yan, H.; Wang, W.; Li, P. A Skeleton-Line-Based Graph Convolutional Neural Network for Areal Settlements’ Shape Classification. Appl. Sci. 2022, 12, 10001. [Google Scholar] [CrossRef]
  13. Xiong, H.; Zheng, B.; Jia, L. Urban Space Expansion in China under the Interaction between the Driving Force and the Restriction. Econ. Geogr. 2016, 36, 82–88. [Google Scholar] [CrossRef]
  14. Licciardi, G.A.; Villa, A.; Mura, M.D.; Bruzzone, L.; Chanussot, J.; Benediktsson, J.A. Retrieval of the Height of Buildings From WorldView-2 Multi-Angular Imagery Using Attribute Filters and Geometric Invariant Moments. IEEE J. Sel. Top. Appl. Earth Obs. Remote Sens. 2012, 5, 71–79. [Google Scholar] [CrossRef]
  15. Yan, X.; Ai, T.; Yang, M. A simplification of residential feature by the shape cognition and template matching method. Acta Geod. Et Cartogr. Sin. 2016, 45, 874. [Google Scholar] [CrossRef]
  16. Yan, X.; Ai, T.; Zhang, X. Template matching and simplification method for building features based on shape cognition. ISPRS Int. J. Geo-Inf. 2017, 6, 250. [Google Scholar] [CrossRef]
  17. Zhou, J.; Liu, Y.; Nie, G.; Cheng, H.; Yang, X.; Chen, X.; Gross, L. Building Extraction and Floor Area Estimation at the Village Level in Rural China Via a Comprehensive Method Integrating UAV Photogrammetry and the Novel EDSANet. Remote Sens. 2022, 14, 5175. [Google Scholar] [CrossRef]
  18. Krizhevsky, A.; Sutskever, I.; Hinton, G.E. ImageNet classification with deep convolutional neural networks. Commun. ACM 2017, 60, 84–90. [Google Scholar] [CrossRef]
  19. Abdel-Hamid, O.; Mohamed, A.-r.; Jiang, H.; Deng, L.; Penn, G.; Yu, D. Convolutional neural networks for speech recognition. IEEE/ACM Trans. Audio Speech Lang. Process. (TASLP) 2014, 22, 1533–1545. [Google Scholar] [CrossRef]
  20. Yan, X.; Ai, T.; Yang, M.; Yin, H. A graph convolutional neural network for classification of building patterns using spatial vector data. ISPRS J. Photogramm. Remote Sens. 2019, 150, 259–273. [Google Scholar] [CrossRef]
  21. Yang, M.; Kong, B.; Dang, R.; Yan, X. Classifying urban functional regions by integrating buildings and points-of-interest using a stacking ensemble method. Int. J. Appl. Earth Obs. Geoinf. 2022, 108, 102753. [Google Scholar] [CrossRef]
  22. Meng, C.; Song, Y.; Ji, J.; Jia, Z.; Zhou, Z.; Gao, P.; Liu, S. Automatic classification of rural building characteristics using deep learning methods on oblique photography. In Building Simulation; Tsinghua University Press: Beijing, China, 2022; pp. 1161–1174. [Google Scholar]
  23. Yan, X.; Ai, T.; Yang, M.; Tong, X. Graph convolutional autoencoder model for the shape coding and cognition of buildings in maps. Int. J. Geogr. Inf. Sci. 2021, 35, 490–512. [Google Scholar] [CrossRef]
  24. Jiao, Y.Y.; Liu, P.Z.; Liu, A.; Liu, S. Map building shape classification method based on Alexne. J. Geo-Inf. Sci. 2022, 24, 2333–2341. [Google Scholar] [CrossRef]
  25. Yang, B. The Reformer Deqing②|Createdmultiple “National Firsts” Land Reform Brought about Great Changes in the Mountains and Villages. 2019. Available online: https://zj.zjol.com.cn/news.html?id=1281250 (accessed on 15 November 2021).
  26. Bhargava, A.; Bansal, A. Fruits and vegetables quality evaluation using computer vision: A review. J. King Saud Univ.-Comput. Inf. Sci. 2021, 33, 243–257. [Google Scholar] [CrossRef]
  27. Khoje, S.; Bodhe, S. Performance comparison of Fourier transform and its derivatives as shape descriptors for mango grading. Int. J. Comput. Appl. 2012, 53, 17–22. [Google Scholar] [CrossRef]
  28. Hu, M.K. Visual pattern recognition by moment invariants. IRE Trans. Inf. Theory 1962, 8, 179–187. [Google Scholar] [CrossRef]
  29. Flusser, J.; Suk, T. Pattern recognition by affine moment invariants. Pattern Recognit. 1993, 26, 167–174. [Google Scholar] [CrossRef]
  30. Boyce, R.R.; Clark, W.A. The concept of shape in geography. Geogr. Rev. 1964, 54, 561–572. [Google Scholar] [CrossRef]
  31. Wang, X.; Liu, J.; Zhuang, D.; Jiang, Y.; Zhang, H.; Yu, R. Spatial-temporal changes of the shapes of Chinese cities. Resour. Sci 2005, 27, 20–25. [Google Scholar] [CrossRef]
  32. Wang, T.; Hui, Y.; Rui, P.; Ying, S. Morphological types division and its formation of dispersed rural settlements based on Alpha Shape: A case of Long Town, Mizhi County. Arid Land Geogr. 2022, 45, 946–954. [Google Scholar]
  33. Zhang, P.; Hu, S. Fine crop classification by remote sensing in complex planting areas based on field parcel. Trans. Chin. Soc. Agric. Eng. (Trans. CSAE) 2019, 35, 125–134. [Google Scholar] [CrossRef]
  34. Breiman, L. Random forests. Mach. Learn. 2001, 45, 5–32. [Google Scholar] [CrossRef]
  35. Li, G.; Li, H.; Wan, H.; Li, L. Research on determinants of species richness in xinjiang based on random forest appraoch. China Environ. Sci. 2021, 41, 941–950. [Google Scholar] [CrossRef]
  36. Cutler, D.R.; Edwards, T.C., Jr.; Beard, K.H.; Cutler, A.; Hess, K.T.; Gibson, J.; Lawler, J.J. Random forests for classification in ecology. Ecology 2007, 88, 2783–2792. [Google Scholar] [CrossRef] [PubMed]
  37. Hu, Q. Research on Crop Remote Sensing Recognition Method Based on Time Series MODIS Images. Ph.D. Thesis, Chinese Academy of Agricultural Sciences, Beijing, China, 2018. [Google Scholar]
  38. Lin, Z.; Yao, J.; Su, X. Extracting planting information of early rice using MODIS index and random forest in Jiangxi Province, China. Trans. Chin. Soc. Agric. Eng. (Trans. CSAE) 2022, 38, 197–205. [Google Scholar]
  39. Wang, Q.; Song, G. Changes of cultivated land pattern and its spatial driving factors in the typical regions of Lower Liaohe Plain. Trans. Chin. Soc. Agric. Eng. (Trans. CSAE) 2021, 37, 275–283. [Google Scholar] [CrossRef]
  40. Huang, J.; Liu, H.; Ning, J.; Ouyang, X.; Zang, H. Study of Adaptability of the Primary Afforestation Species in Chongyi County, Jiangxi Province Based on Random Forest. For. Resour. Manag. 2022, 117–125. [Google Scholar] [CrossRef]
  41. Qing, J. Remote Sensing Evaluation of Rice Planting System in Jiangxi Province. Master’s Thesis, Jiangxi Normal University, Nanchang, China, 2020. [Google Scholar]
  42. Yang, B.; Chen, S.; Yu, H.; Qin, A. Remote sensing estimation of rice yied based on random forest regression method. J. China Agric. Univ. 2020, 25, 26–34. [Google Scholar] [CrossRef]
  43. Xue, J.; Zong, Y.; Yang, Z. Gesture recognition based on improved YCBCR space and multi-feature integration. Comput. Appl. Softw. 2016, 33, 151–155. [Google Scholar] [CrossRef]
  44. Chen, B.; Rao, H.; Liu, M. Shape feature recognition of camellia fruit basd on Fourier descriptors and Hu invariant moments. Zhejiang Agric. Sci. 2020, 61, 1876–1880. [Google Scholar] [CrossRef]
  45. Lo, C. Changes in the shapes of Chinese Cities, 1934–1974. Prof. Geogr. 2005, 32, 173–183. [Google Scholar] [CrossRef]
  46. Pan, J.; Dai, W. Spatial-Temporal Characteristics in Urban Morphology of Majior Cities in China during 1990–2010. Econ. Geogr. 2015, 35, 44–52. [Google Scholar] [CrossRef]
  47. Wu, C.; Wang, Z.; Hu, S.; Lepine, J.; Na, X.; Ainalis, D.; Stettler, M. An Automated Machine-Learning Approach for Road Pothole Detection Using Smartphone Sensor Data. Sensors 2020, 20, 5564. [Google Scholar] [CrossRef]
  48. Chauhan, N.K.; Singh, K. Performance Assessment of Machine Learning Classifiers Using Selective Feature Approaches for Cervical Cancer Detection. Wirel. Pers. Commun. 2022, 124, 2335–2366. [Google Scholar] [CrossRef]
  49. Sedik, A.; Marey, M.; Mostafa, H. WFT-Fati-Dec: Enhanced Fatigue Detection AI System Based on Wavelet Denoising and Fourier Transform. Appl. Sci. 2023, 13, 2785. [Google Scholar] [CrossRef]
  50. Yang, K.; Zhang, H.; Wang, F.; Lai, R. Extraction of Broad-Leaved Tree Crown Based on UAV Visible Images and OBIA-RF Model: A Case Study for Chinese Olive Trees. Remote Sens. 2022, 14, 2469. [Google Scholar] [CrossRef]
Figure 1. Yangdun Village: relative location in China and the shape of the homesteads. Note: (a) the location of the study area in China; (b) the location of Yangdun Village in Zhejiang Province; (c) landform of Yangdun Village, with yellow rectangular frames representing different areas; (d) homesteads with different regular shapes.
Remotesensing 15 04763 g001
Figure 2. Technical route for shape classification.
Remotesensing 15 04763 g002
Figure 3. Description of the classification standard of homesteads.
Remotesensing 15 04763 g003
Figure 4. Schematic diagram of different values of FFT descriptors to identify the outline of the homesteads.
Remotesensing 15 04763 g004
Figure 5. Shapes of city and rural settlements based on BCSI. Note: (A) Fifteen types of graphics and shapes in cities; (B) Five types of graphics and shapes in rural settlements.
Remotesensing 15 04763 g005
Figure 6. Optimal feature point selection for the BCSI in homesteads. Note: (a) is the original schematic diagram, where L1, L2, L3 and L4 are rays emitted from the central point; (b) is the effect of taking the internal intersection; (c) is the effect of taking the central intersection; (d) is the effect of taking the external intersection.
Remotesensing 15 04763 g006
Figure 7. The relationship between out-of-bag error and the number of random decision trees. Note: (a) results of 50 random trials, each color line represents one trial; (b) statistical graph of the average value.
Remotesensing 15 04763 g007
Figure 8. Relationship between the BCSI and shape classification of homesteads. Note: (a) diagram shows a ray emitted at 1-degree intervals; (b) diagram shows a ray emitted at 5-degree intervals; (c) diagram shows a ray emitted at 10-degree intervals; (d) diagram shows a ray emitted at 20-degree intervals. The abscissa is the category, and the ordinate is the value of the BCSI.
Remotesensing 15 04763 g008
Figure 9. Accuracy distribution of 100 random experiments. Note: (a) accuracy rate of FFT, Hu; (b) accuracy rate of FFT + BCSI, Hu + BCSI; (c) accuracy rate of FFT + Hu, FFT + Hu + BCSI; (d) accuracy rate of AlexNet.
Remotesensing 15 04763 g009
Figure 10. Between-category accuracy of different methods. Note: (a) FFT; (b) HIM; (c) BCSI; (d) FFT + BCSI; (e) HIM + BCSI; (f) FFT + HIM; (g) FFT + HIM + BCSI; (h) AlexNet.
Remotesensing 15 04763 g010
Figure 11. Shape distribution of homesteads in Yangdun Village from 2010 to 2020. Note: 1—square-like, 2—rectangular-like, 3—irregular rectangular-like, 4—irregular. (a) shape distribution of homesteads in 2010; (b) shape distribution of homesteads in 2015; (c) shape distribution of homesteads in 2020; (d) changes in homesteads from 2010 to 2020.
Remotesensing 15 04763 g011
Table 1. The results of extracting homesteads based on HIM.
Serial Numberϕ1ϕ2ϕ3ϕ4ϕ5ϕ6ϕ7
12.8385.78011.95912.40424.58715.31625.799
22.8455.87110.07210.56821.05314.79421.026
32.7475.56010.10210.30320.50613.09421.696
43.1146.82810.81911.85323.37415.51823.309
53.1076.81010.69511.60322.80715.08923.072
62.7585.60110.25610.35920.66813.22821.638
73.1357.01810.97612.62524.80616.53324.466
83.1728.41213.28514.15427.88218.66128.578
93.0316.39410.75311.50922.81015.31422.773
102.9616.13710.67411.20722.15314.28622.933
Table 2. Overview of 7 group feature scenarios for shape classification.
Feature CategoryFeature ScenariosFeature VariableFeature Size
FFTFS1The first 40 descriptors of the FFT40
HIMFS2Seven moments of HIM7
BCSIFS3Value of BCSI1
FFT + BCSIFS4The first 40 descriptors of the FFT, value of BCSI41
HIM + BCSIFS5Seven moments of HIM, value of BCSI8
FFT + HIMFS6The first 40 descriptors of the FFT, seven moments of HIM47
FFT + HIM + BCSIFS7The first 40 descriptors of the FFT, seven moments of HIM, value of BCSI48
Table 3. Classification accuracy of FFT and HIM.
Homestead Shape CategoryClassification AccuracyCategory 1Category 2Category 3Category 4
FFTAccuracy (%)84.691.383.589.3
Recall (%)84.990.783.991.4
HIMAccuracy (%)79.587.773.479.7
Recall (%)84.79065.973.6
BCSIAccuracy (%)7558.248.147.2
Recall (%)66.779.43331.2
FFT + BCSIAccuracy (%)85.491.782.287
Recall (%)8690.783.488.5
HIM + BCSIAccuracy (%)80.687.873.179.6
Recall (%)84.99066.174.4
FFT + HIMAccuracy (%)85.491.581.785.9
Recall (%)85.790.882.487.9
FFT + HIM + BCSIAccuracy (%)84.691.780.686.8
Recall (%)86.990.582.585.7
AlexNetAccuracy (%)77.691.560.061.2
Recall (%)76.084.074.970.6
Table 4. Statistics on the shape of homesteads in Yangdun Village from 2010 to 2020.
Shape CategoryNumber of Homesteads
Year 2010 Year 2015 Year 2020
Square-like14414548
Rectangular-like490472316
Irregular rectangular-like154160152
Irregular899473
Total number877871589
Disclaimer/Publisher’s Note: The statements, opinions and data contained in all publications are solely those of the individual author(s) and contributor(s) and not of MDPI and/or the editor(s). MDPI and/or the editor(s) disclaim responsibility for any injury to people or property resulting from any ideas, methods, instructions or products referred to in the content.

