


Misaligned RGB-Infrared Object Detection via Adaptive Dual-Discrepancy Calibration


1
School of Information and Communication Engineering, University of Electronic Science and Technology of China, Chengdu 611731, China
2
Beijing Institute of Control and Electronics Technology, Beijing 100038, China
*
Author to whom correspondence should be addressed.
Remote Sens. 2023, 15(19), 4887; https://0-doi-org.brum.beds.ac.uk/10.3390/rs15194887
Submission received: 23 July 2023
/
Revised: 28 September 2023
/
Accepted: 6 October 2023
/
Published: 9 October 2023
(This article belongs to the Special Issue Object Detection and Information Extraction Based on Remote Sensing Imagery)
Abstract
:Object detection based on RGB and infrared images has emerged as a crucial research area in computer vision, and the synergy of RGB-Infrared ensures the robustness of object-detection algorithms under varying lighting conditions. However, the RGB-IR image pairs captured typically exhibit spatial misalignment due to sensor discrepancies, leading to compromised localization performance. Furthermore, since the inconsistent distribution of deep features from the two modalities, directly fusing multi-modal features will weaken the feature difference between the object and the background, therefore interfering with the RGB-Infrared object-detection performance. To address these issues, we propose an adaptive dual-discrepancy calibration network (ADCNet) for misaligned RGB-Infrared object detection, including spatial discrepancy and domain-discrepancy calibration. Specifically, the spatial discrepancy calibration module conducts an adaptive affine transformation to achieve spatial alignment of features. Then, the domain-discrepancy calibration module separately aligns object and background features from different modalities, making the distribution of the object and background of the fusion feature easier to distinguish, therefore enhancing the effectiveness of RGB-Infrared object detection. Our ADCNet outperforms the baseline by 3.3% and 2.5% in on the FLIR and misaligned M3FD datasets, respectively. Experimental results demonstrate the superiorities of our proposed method over the state-of-the-art approaches.
1. Introduction
Object detection technology is a prominent area of research in computer vision, widely applied in autonomous vehicles (AVs), security, and medicine fields. The rapid advancement of deep learning has promoted the presence of many excellent object-detection works [1,2]. For instance, Yang et al. utilized a Dense Feature Pyramid Network (DFPN) to enhance detection [3], and Yao et al. introduced an anchor-free two-stage detection method [4]. Object detection works based on RGB exhibit good performance in ordinary surroundings [5,6]. However, the natural environment is open and dynamic. Existing RGB-based works have found it hard to cope with the challenges brought by some harsh environments [7,8], such as rain, fog occlusion, and low-light conditions. Meanwhile, some works [9,10] have studied infrared-based object-detection methods because infrared has good penetrating ability and works well in low-light conditions [11,12]. However, infrared-based detectors are susceptible to interference from heat and highlight sources [13]. There are some object-detection works based on hyperspectral images [14]. Yan et al. designed an SSD-based variant network with 3D convolution for hyperspectral image object detection [15], and Li et al. proposed a spectral self-expressive model guided deep ensemble network for hyperspectral image tracking [16]. Although they can utilize dense and rich spectral signatures beyond the visible wavelengths, it is relatively difficult to obtain hyperspectral images due to the high cost of the sensor. Therefore, object detection based on RGB-Infrared has become a research focus. Owing to the complementary advantages of RGB and infrared modalities, RGB-Infrared object-detection methods [17,18,19,20] have more robust performance under complex natural scenes. However, there exist spatial-misalignment and domain-discrepancy issues between RGB and infrared modalities, which will adversely impact object detection based on RGB-Infrared.
Spatial misalignment: Since RGB and infrared sensors have different coordinate systems, fields of view, and sampling frequencies, pairs of RGB and infrared images usually are spatial misaligned [21], resulting in low-quality bounding boxes predicted by RGB and infrared fusion object detection, as shown in Figure 1a. Figure 1b indicates that the fusion of original RGB and infrared images via the image fusion algorithm [22] will take in a significantly misaligned ghost, which will also disturb localization. The downsampling may decrease the degree of misalignment [8], yet the situation still exists, as shown in Figure 1c. The performance of RGB and infrared fusion detection methods that directly fuse misaligned features is not ideal. Therefore, achieving spatial alignment between RGB and infrared modalities is crucial. The training process of existing RGB and infrared fusion object-detection networks [7,19] relies on manually aligned datasets in advance. However, manual alignment is a labor-intensive task [13,23], and there will still be subtle misalignments after manual processing, such as the FLIR dataset [24]. A more feasible way is to take misaligned RGB and infrared images as input directly, and how to adaptively perform spatial alignment at the feature level is the concern of our work. Furthermore, RGB and infrared images usually have different resolutions. Existing works [22,25] directly resize different modal images to the same size through downscaling or upscaling, either dropping beneficial information or introducing redundancy and increasing computational overhead.
Domain discrepancy: RGB and infrared images come from distinct sensors, and the deep feature maps extracted by convolutional neural networks (CNN) have apparent domain discrepancies [26,27]. As shown in Figure 2, there is a notable disparity in the distribution of deep features from the two modalities when projected onto the same feature space. Although the object and background distributions of both modalities can be distinguished, the projected points of RGB and infrared features are also clearly divided into two clusters for the same object. Directly fusing the domain-discrepant features from RGB and infrared images will result in overlapping distributions of the object and background, which brings disturbance to the detection head [28,29]. The domain discrepancy makes it challenging to learn object and background distribution from the fusion feature of multi-modal [30,31]. Therefore, domain alignment is necessary before fusing RGB and infrared features. Existing RGB-Infrared object-detection works [19,32] emphasize designing the interaction structure of RGB and infrared, such as various attention mechanisms, ignoring the impact of domain discrepancy between RGB and infrared modalities on object detection.
To address the above problems, we propose an adaptive dual-discrepancy calibration network (ADCNet) for misaligned RGB-Infrared object detection. We adopt a dual-branch network structure, including two feature extractors and a detection head. A size adaptation process is adopted so that our network can directly take RGB and IR images with different resolutions as network input. For the spatial-misalignment issue of RGB and infrared modalities, we append an adaptive spatial discrepancy calibration module in the detection network to achieve spatial alignment before feature fusion. Furthermore, we design a domain discrepancy calibration module to perform domain alignment to make the object and background features of various modalities more distinguishable to facilitate the downstream object-detection task.
Overall, the main contributions of this paper are summarized as follows:
- This paper proposes a misaligned RGB and infrared object-detection network, which can adaptively tackle misalignment with variable degrees of rotation, translation, and scale between RGB and infrared images.
- We use a spatial discrepancy calibration module to achieve spatial alignment, and a domain-discrepancy calibration module is designed to achieve domain alignment that enhances the fusion effectiveness for object detection.
- Our method is validated on two misaligned RGB and infrared object-detection datasets and achieves state-of-the-art performance.
The rest of this paper is scheduled as follows: Section 2 introduces the related work of RGB and infrared fusion object detection. Section 3 elaborates on our method and network structure. Section 4 gives the details of our experiment and a comparison of results to verify the effectiveness of our methodology. Finally, we discuss further and summarize this paper in Section 5. Our code is available at https://github.com/Hiram1026/misaligned_RGB-IR_detection (accessed on 5 October 2023).
2. Related Work
Multi-modal fusion object detection based on RGB and infrared images has rapidly developed thanks to the open source of some RGB and infrared image datasets, e.g., FLIR [13], M3FD [22], LLVIP [33], and VEDAI [34]. The significant challenge for the cooperative detection of RGB and infrared is how to fuse the two modalities’ information effectively. Previous works have explored fusion strategies at different stages, which can be mainly divided into early fusion, mid-fusion, and late fusion [18,20,35,36], as illustrated in Figure 3.
Early fusion is designed to fuse RGB and infrared images before feeding pictures into the object-detection network (cf. Figure 3a). A native way is to concatenate the pair RGB and IR images into a four-channel input [37], but this fusion method is too rough. A high-level approach is intended to fuse RGB and infrared images into a new picture. Fu et al. [38] decomposed RGB and infrared images into multiple sets of high-frequency and low-frequency features by training a neural network, then added the corresponding features of the two modalities to form a fusion image. Zhao et al. [39] implements a fusion network for RGB and infrared images based on an auto-encoder (AE). Liu et al. [22] adopt a generative adversarial network (GAN) for image fusion, where an object discriminator distinguishes foreground objects from the infrared image, and a detail discriminator extracts background texture from the RGB image. However, early fusion is not an end-to-end strategy, and the image generated by fusion is not necessarily beneficial for the object-detection task. In addition, as shown in Figure 1b, it is more complicated to troubleshoot the misaligned issue for fused images.
Mid-fusion is designed to feed RGB and infrared images into dual-branch feature extraction networks, then fuse their features downstream of the network [40], as shown in Figure 3b. Zhang et al. [7] proposed a guided attention feature fusion (GAFF) method, which takes the prediction of the targets’ mask as a subtask and regards the two modalities’ masks as guidance for the attention of intra- and inter-modal. F et al. [19] designed a cross-modal feature fusion structure based on the transformer, the network can naturally perform intra- and inter-modal fusion because of the self-attention [41] mechanism. Mid-fusion works mainly focused on where to fuse multi-modal features and the structure of fusion modules [32,42], ignoring the problem of misalignment and domain discrepancy, which limited the fusion effect. The misaligned RGB-Infrared object detection via adaptive dual-discrepancy calibration, which is our proposed methodology, belongs to the category of mid-fusion.
Late fusion is designed to post-process outputs of two independent object-detection networks to obtain the final result, as illustrated in Figure 3c. Actually, it is ensemble technology. The ensemble is a well-proven method, which is commonly used in engineering to improve performance [43,44,45]. A straightforward manner of the ensemble is intended to pool the results of multiple detectors and then use non-maximum suppression (NMS) [46,47] to conceal overlapping detections. However, the NMS method fails to gain helpful information from the low-scoring modality. A recent work (ProbEn [8]) explores this issue, considering that the suppressed bounding box should enhance the confidence of the preferred bounding box, in turn [48]. Based on this assumption, Chen et al. [8] proposed a probabilistic ensembling technique and achieved excellent performance. Nevertheless, the misaligned image pair is still a challenge. The method ProbEn relies on the performance of multiple detectors, and the misaligned modality cannot train a well-performing detector, which will drag down the result of the ensemble. Some ensemble methods are proposed in earlier studies, such as score-averaging [49] and max-voting [50], which also suffer from the same problem. In addition, late fusion requires more computational resources and more time on inferencing than mid-fusion.
Domain discrepancy: The works discussed above are all based on supervised learning. There are some unsupervised domain adaptation works that have studied the issue of domain discrepancy [51,52]. For instance, Kan et al. proposed a bi-shifting auto-encoder network that exploits the nonlinearity of the encoder network to enable it to transform samples between domains that may be far apart, while sparse representation constraints ensure semantic consistency [53]. Ye et al. proposed a domain adaption model for SAR image retrieval by learning the domain-invariant feature between SAR images and optical aerial images [54]. Jiang et al. proposed an adversarial regressive domain adaptation approach to achieve infrared thermography-based cross-domain remaining useful life prediction by effectively aligning marginal and conditional distributions [55]. The above works mainly discover commonalities between the source and target domains. However, the fusion detection based on RGB-IR aims to extract their complementary information.
3. Methods
3.1. Overall Network Architecture
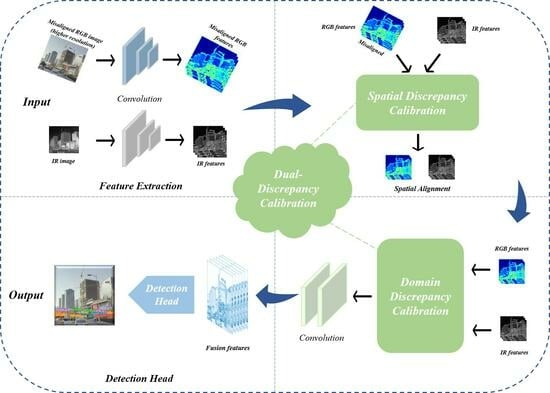
The overall architecture of the proposed ADCNet is illustrated in Figure 4. ADCNet is a dual-branch mid-fusion network for RGB and IR images, which primarily consists of four components: feature extraction, size adaption, spatial discrepancy calibration, and domain-discrepancy calibration. Our work concentrates on dual-discrepancy calibration parts. Among them, the spatial discrepancy calibration module is employed to correct the misalignment to reduce the error caused by directly fusing misaligned features. The domain-discrepancy calibration module declines the domain discrepancy and shortens the distance between the object’s feature distributions, boosting the fusion effect.
Specifically, we take a pair of RGB and IR images as input. For the convenience of illustration, we assume that the manual annotations of the dataset are based on infrared images, i.e., RGB is the misaligned modality. In practical application, RGB images shot by the camera have a higher resolution than IR images captured by the infrared detector. So, the RGB feature, acquired through multiple downsample operations, also has a larger size. However, features and must be the same size for the mid-fusion methodology when fused. In existing works, resizing the images to the same resolution in data preprocessing is a matter of course. Nevertheless, directly resizing the RGB image to a smaller one the same size as the infrared image will lose valuable information and thus lose the advantage of the RGB image. On the contrary, using the interpolation algorithm to enlarge the infrared image will introduce redundant information, and the FLOPs and inference time increase multiply. We balance the performance and computational overhead of the network. So, we take a pair of RGB and infrared images of different resolutions as the input and append a size adaption process after feature extraction to ensure the same size between the two modal features. As shown in Figure 4(1), an extra adaptive average pooling layer and a convolutional layer are appended to the RGB branch. The entire generation process of RGB and infrared features can be written as Equation (1), where is the backbone of our network.
After the input images and are processed through the corresponding feature extraction network and size adaption process, the RGB and IR feature maps are transported to our dual-discrepancy calibration network. To learn the spatial position relationship between feature maps, we concatenate the RGB and IR features and input them into the spatial discrepancy calibration module. Then, the RGB feature is resampled according to the adaptively generated affine transformation matrix. It is worth mentioning that the modules we designed are flexible, and we can decide whether to adopt the size adaption process and spatial discrepancy calibration module or not in any modality branch according to the specific situation of the datasets. Furthermore, the domain-discrepancy calibration module generates a set of new mean and variance from the latent space and then performs adaptive instance normalization (AdaIN) on RGB and IR features to achieve domain alignment. Finally, the features of the two modalities are concatenated and take a series of convolution operations to obtain fusion features, which are sent to the object-detection head to predict the bounding box and category.
The detection head adopts the same configuration as YOLOv5 [56], including a PAN [57] structure and a convolution layer. Multi-scale features with strides of 8, 16, and 32 will be utilized. Then, multi-scale features are passed through the convolution for parameter prediction. The number of output channels of the convolution is because each pixel corresponds to the anchor box of three aspect ratios. N is the parameters that need to be predicted for each anchor box, including object confidence, category logits, and box offset parameters. All prediction boxes are finally processed by NMS [46].
3.2. Spatial Discrepancy Calibration
The features obtained by the feature extraction network will maintain RGB and IR images’ misalignment phenomenon, although the pooling layer can weaken this kind of deviation to a certain extent. Misaligned modality fusion will mislead the detection head to predict low-quality bounding boxes. By inspecting the RGB and IR images, we find that the two modalities can be aligned by rotating, scaling, and translating, which has indeed been done in some previous datasets [13]. However, the workload is massive for artificially calibrating two modal images. We hope the deep-learning network can adaptively learn the spatial position relationship between the two modal features for the same semantic, i.e., to learn a network that can adaptively generate 2D affine transformation parameters. Then, we conduct an affine transformation on one modality to align it with another. Therefore, we embed a spatial discrepancy calibration module to achieve spatial alignment at the feature level.
The spatial discrepancy calibration module has the capacity for spatial transformation, and the parameters of affine transformation are generated through learning rather than manually specified. The whole module of spatial discrepancy calibration is differentiable [58], simple in construction, and can be easily embedded into the CNN network. The spatial discrepancy calibration module consists of three parts: a localization network for learning affine transformation parameters, a parameterized sampling grid [59], and image sampling. Our spatial discrepancy calibration module is directly embedded into the object-detection network without an additional loss function. The model is trained with the constraints of the downstream task.
The spatial discrepancy calibration module is shown in Figure 4(2). For misaligned RGB feature map and IR feature map , since we want to learn the positional relationship between the two modalities, we concatenate and to obtain as the input of the localization network. Then feature goes through a series of convolutional and fully connected layers to generate . The dimension of depends on the affine transformation. Here, we adopt a 2D affine transformation, so the size of is . We convert into an affine matrix of size . The generation process of is formulated as Equation (2).
where is the concatenate operation, and denote the fully connected and convolutional layers. The superscript denotes the number of layers. Please note that the detach operation was conducted when was sent to the localization network during training. Because we merely want to discover the spatial position relationship between features and do not hope that the gradient backpropagation affects the generation of multi-modal features and .
For clarity of exposition, this paper assumes that RGB is the misaligned modality. Therefore, we perform an affine transformation on feature according to parameter , which is learned by the localization network. To conduct the affine transformation, we need to generate a sampling grid, which is the pixel location mapping relation between input and output features. In our method, we set the output feature to have the same width, height, and the number of channels as the input feature . In general, the output pixels are defined to lie on a regular grid of pixels [58]. The pointwise transformation of and can be written as:
where is the coordinate of the i-th pixel of feature that is our target. is the coordinate of the corresponding pixel in feature that is input. In addition, is the affine transformation parameter.
The following step is intended to generate target features by sampling the input features according to a parameterized sampling grid. However, the coordinate calculated according to Equation (3) may be non-integer. For example, the target feature’s coordinate corresponds to the input feature’s coordinate . We adopt bilinear interpolation as the sampling kernel, and the sampling procedure is as Equation (4):
is the value at location in the output feature map , and is the value at location in the input feature map . The means that the value of the target pixel is calculated by weighting the values of the four surrounding pixels of the corresponding coordinate in the input feature.
3.3. Domain-Discrepancy Calibration
RGB and infrared images are obtained from spectral sensors in different wavelengths, and there is a difference in the distribution of features obtained through convolutional neural networks, often referred to as domain discrepancy. Due to the existence of domain discrepancy, directly fusing RGB and IR features will cause interference, which is not conducive to the subsequent object-detection task. Like [60], some works use the mean and variance of the features to represent the style of the image. Furthermore, in some previous works of domain generalization or domain adaptation [61,62], it has been verified that uniformizing datasets’ styles can effectively shorten the distance between their distributions. Inspired by these methodologies, we design a domain-discrepancy calibration module for RGB and IR features to achieve domain alignment, as shown in Figure 4(3).
In general, to make the domain of RGB and IR alignment, we may transfer the IR to the RGB style or the RGB to the IR modality style. However, there is currently no evidence to demonstrate which style is more beneficial for the object-detection task. Our objective is to unify the RGB and IR modalities into a learnable modality style to calibrate domain discrepancy. As shown in Figure 4(3), the learnable style vector is generated through a mapping network, whose input is a random vector sampled from standard normalization distribution [63]. Among them, C is the number of channels of RGB and IR features. are learnable means for each channel, which are denoted as . are learnable standard deviations for each channel, which are denoted as . The mapping network consists of eight fully connected layers, whose parameters are optimized by minimizing the whole object-detection loss . Another advantage of learning a new vector from the latent space is that it decouples the new mean and variance w from the dataset distribution, driving the network to be more robust.
Subsequently, domain alignment and feature fusion are carried out. As shown in the double-branch structure of Figure 5, the operations are performed on RGB and infrared features, respectively, to unify the modality style into the learnable style w. The entire procedure can be written as follows:
where is the adaptive instance normalization, is the RGB feature after the spatial discrepancy calibration module, and is the infrared feature. AdaIN is executed with the same vector w for both the RGB and IR features. The approach of AdaIN and fusion is shown in Figure 5. The calculation formula of AdaIN is as Equation (6):
is instance normalization. and are the new mean and variance contained in the vector w, respectively. First, perform instance normalization on the features, then multiply the features by the new variance and add the new mean. It should be mentioned that, unlike the commonly used batch normalization, instance normalization is conducted at each channel of the feature, as Equations (7) and (8):
is a small value, avoiding variance to be zero. Finally, concatenate the two modalities’ features after and pass through the convolutional layer to obtain fusion features, which are dispatched to the object-detection head for subsequent prediction.
3.4. Loss Function
The loss function of the entire network is as Equation (9). Among them, , and are classification loss, confidence loss, and bounding box loss, respectively.
The confidence loss is used to predict whether a proposal is an object or background, which adopts binary cross-entropy loss (BCELoss). The formula is as Equation (10):
where s indicates the feature map size, B indicates the batch size, is the object label, and is the predicting probability of the object. The classification loss also uses binary cross-entropy loss, and the formula is as Equation (11):
where is the category label and is the predicted value. The loss of the bounding box adopts CIoU loss [64]. The calculation formula of CIoU loss is as Equation (12).
where indicates the Euclidean distance between the predicted box and the ground truth box, and c is the diagonal length of the minimum circumscribed rectangle of them.
4. Experiments and Results
To verify the effectiveness of our proposed ADCNet for misaligned RGB and infrared object detection, we conduct experiments on the FLIR benchmark and a modified (more serious misalignment) M3FD dataset.
4.1. Dataset Introduciton
The FLIR dataset is a challenging multispectral object-detection dataset that includes day and night scenes. The original dataset contains a large number of misaligned RGB and infrared images, and a rough-aligned version is released after being manually corrected, named FLIR-aligned. FLIR is generally used as a benchmark for RGB and infrared fusion detection, which contains 5142 pairs of rough-aligned RGB and infrared images, of which 4129 pairs are used for training, and 1013 pairs are used for validation. The dataset contains three categories of “person”, “car” and “bicycle”.
The M3FD dataset is a street view dataset with 4200 pairs of RGB and infrared images, including a total of 34,407 target labels in six categories: “person”, “car”, “bus”, “motorcycle”, “lamp”, and “truck”. We randomly divided it into a training set of 3200 pairs and a validation set of 1000 pairs for experimentation. In addition, the resolution of both RGB and infrared images of the dataset is . To simulate the misalignment phenomenon, we randomly rotate the RGB image with an angle of and randomly translate the image by one-tenth of the width and height. In addition, we resize the infrared image to a resolution of to constitute a misaligned RGB and infrared image dataset with different resolutions, as shown in Figure 1a. Please note that the bounding boxes of the labels adopt normalized coordinates, and the manual annotations are aligned with the infrared image.
4.2. Implementation Details
Our ADCNet is a dual-branch structure that uses the backbone network of YOLOv5 [65]. Then, after , , and downsampling of the backbone, our adaptive dual-discrepancy calibration is used for the RGB and IR features to generate the fusion feature. Finally, all the fusion features are sent to the detection head for prediction, and the final detection results are acquired after non-maximum suppression (NMS). The object-detection head includes a path aggregation network (PAN) [57].
Our experiments were conducted in PyTorch 1.9 on two RTX3090 GPUs. The CUDA version is 11.1, and the operating system is Ubuntu 20.04. For the parameter settings in the training phase, except for the experiment with the addition of the size adaption process, the image size is set to 640, and the batch size of all experiments is 16. The loss weight parameters , , and in Equation (9) adopt the default settings as YOLOv5 [56], which are 0.243, 0.301, and 0.0296, respectively. For the FLIR dataset, we employed the pre-trained weights obtained from COCO, and the network was fine-tuned by an SGD optimizer for 80 epochs with an initial learning rate of 0.0032. For the M3FD dataset, we train from scratch for 200 epochs with an initial learning rate of 0.01. All our experiments employ mosaic data augmentation in data preprocessing.
4.3. Evaluation Metrics
We adopt precision, recall, and the COCO evaluation protocol that includes (mean Average Precision), , and , as well as FLOPs (G) params (M), inference time (ms) as metrics to compare the detection performance of all methods. The formulas for precision and recall are as follows:
where TP, FP, and FN are true positive, false positive, and false negative, respectively. Judgment of whether the prediction is correct is by checking whether the IoU exceeds the threshold, where the IoU is the intersection ratio of the prediction box and the ground truth box. The P-R curve depicts the precision and the recall value under different confidence thresholds, and is the area under the P-R curve, which is defined as:
is the average of the values of all categories. is calculated at . In general, the metric refers to the average of the ten values when the IoU threshold is set to .
4.4. Analysis of Results
First, we experimented with the FLIR benchmark to verify the effectiveness of our proposed fusion network. Furthermore, in order to prove the fusion effect of the spatial discrepancy calibration module on misaligned datasets, a large number of comparison experiments were carried out on the M3FD dataset with severe misalignment. Several existing excellent works, such as DDFusion [38], DIDFuse [39], TarDAL [22], CFR [25], GAFF [7], CFT [19], MFPT [32], and ProbEn [8], are used to compare with our method. To ensure fairness, the input size of RGB and infrared images is set to , so all comparative experiments in this section did not use our size adaption process.
4.4.1. Experiments on the Rough-Aligned FLIR Dataset
We compare the results of various methodologies on the FLIR dataset, including early fusion strategy, mid-fusion strategy, and late fusion strategy. In addition, a dual-branch network that replaces our adaptive dual-discrepancy calibration with a concatenation operation serves as our baseline. The experiments demonstrate that our ADCNet has noticeable advancement and achieves state-of-the-art object-detection performance for RGB and infrared images. The specific experimental results are shown in Table 1.
The data show that our method achieves 0.428 and 0.840 for and on the FLIR dataset, which is the best performance among all methodologies. Compared with single-modal detection based on infrared and our baseline, the metric are improved by 7.3% and 3.3%, respectively, proving that our adaptive dual-discrepancy calibration network can effectively fuse RGB and infrared multi-modality information. In addition, we can see from Table 1 that the method ProbEn [8] has a similar performance to our ADCNet, even performing better than us in the “bicycle” category. The ProbEn is a two-stage method based on faster-rcnn, which has advantages on localization of the small object due to the secondary refinement of the bounding box. Meanwhile, the ProbEn is an ensemble object-detection method whose results on the FLIR dataset are obtained by integrating the results of three networks (an early-fusion network, a mid-fusion network, and a single-modal detection network). This means that the number of parameters and FLOPs is also much more than that of our method. ProbEn achieves detection performance for difficult categories at the expense of computational complexity. The parameters and FLOPs of the ProbEn should be more than three times those of faster-rcnn. For a more detailed comparison, we give other performance metrics, as shown in Table 2.
To more clearly illustrate the advantages of our method in detecting various targets, the confusion matrix of the test results is shown in Figure 6. It is obviously seen that the performance improvement of our ADCNet on the more difficult category “bicycle” is significant compared to the baseline. Among all methods, our network also has a higher recall in the “car” and “person” categories. Taken together, it is verified that our adaptive dual-discrepancy calibration network also has a remarkable effect on rough-aligned RGB and IR datasets.
4.4.2. Experiments on the Misaligned M3FD Dataset
We conduct comparative experiments on a modified version (severely misaligned) of the M3FD dataset to verify the effectiveness of our method for misaligned RGB and IR fusion. Likewise, we regard a network that replaces the adaptive dual-discrepancy calibration with a concatenated operation as our baseline. The experimental results are shown in Table 3:
Experimental results illustrate that our proposed ADCNet has the best performance in almost all metrics and is significantly improved compared to the baseline. Especially for smaller targets, such as the “lamp” and “motor” categories, the improvement is enormous. We consider that a bit of misalignment is disastrous for the IoU value of the small object-detection box, and our spatial discrepancy calibration module can effectively weaken the error caused by the misaligned situation. From the results in Table 3, it can also be found that the baseline’s performance is not as acceptable as that of infrared-based single-modal detection, which is due to the mistake introduced by the direct fusion of misaligned features. Moreover, the early fusion method directly fused misaligned images, resulting in the formation of ghost images, so the performance was significantly reduced. In addition, the results show that the mid-fusion method [19] can perform well on misaligned datasets, indicating that feature fusion can indeed achieve a certain degree of spatial alignment implicitly through some attention mechanisms.
We visualize the detection results of three scenes. Because the annotation is based on infrared (RGB is the misaligned modality), predicted boxes are painted on the infrared image (boxes of method TarDAL are displayed on the fusion image), as shown in Figure 7. The detection results of different algorithms in the figure illustrate that our ADCNet has a more satisfactory detection effect for smaller objects. In comparison, early fusion methods are most affected by misaligned images. Furthermore, as shown in Figure 7c, although all methods’ detection results are correct, the predicted boxes of our approach have more increased confidence. We conduct multiple experiments on our method to report the standard variance, as shown in Table 4. The experimental results show that our ADCNet has stable performance on FLIR and M3FD datasets. In summary, our proposed detection network can effectively fuse misaligned RGB and infrared image information to enhance object-detection performance.
4.5. Ablation Experiments
We conduct ablation experiments on both the FLIR dataset and the M3FD dataset to verify the effectiveness of our proposed spatial discrepancy calibration module, domain-discrepancy calibration module, and size adaption process. The experimental results are shown in Table 5 and Table 6, while we also give other metrics such as “params” in Table 6 to illustrate the computational complexity of our network.
The experimental results show that adopting the spatial discrepancy calibration module on the FLIR dataset has less performance improvement, which is due to only slight misalignments existing in the FLIR dataset. On the contrary, for the M3FD dataset with the serious misalignment issue, the spatial discrepancy calibration module carries noticeable detection performance advancement, such as a 1.7% improvement for and a 2.9% improvement for . Furthermore, we project RGB features onto IR images like the way of attention map to examine the impact of our spatial discrepancy calibration module, as shown in Figure 8. It can be observed that the RGB feature after our calibration module has a better coincidence with the IR image. This demonstrates that our spatial discrepancy calibration module helps to repair the misaligned issue to make RGB and IR feature fusion more desirable.
It also can be seen in Table 5 and Table 6 that when the domain-discrepancy calibration module is added to the baseline, the detection metrics are significantly improved on both datasets. To show the effectiveness of the domain-discrepancy calibration more clearly, the RGB and IR features, which are before and after the domain-discrepancy calibration module, were projected into a 3D space through the t-SNE algorithm. As shown in Figure 9, the green and blue point clouds represent the objects from the RGB and infrared modalities, respectively. There are domain differences between different modalities of the same object, resulting in more separation in the left part of Figure 9, which is a challenge in the multi-modal detection task [26,32]. We can notice from the figure that the distance between RGB and infrared features is significantly reduced after the calibration module, while the object and background features of the two modalities are more aggregated, respectively. It proves that our domain-discrepancy calibration module can actually reduce the domain discrepancy of multi-modal, enhancing the fusion benefits of RGB and infrared. Furthermore, the data in Table 6 also indicates that the increased parameters of our proposed module are acceptable and will not append too much computational overhead.
In addition, when RGB adopts the original size (1024 × 768) as input (adding the size adaption process), although the computational complexity increases, the detection performance has been significantly improved, as shown in Table 6. However, meanwhile, after resizing IR images of the network’s input to 1024 through the interpolation algorithm (the original size of IR images is 640 × 480), the performance improvement relative to the increased computational overhead is disappointing. This verifies that our adopted strategy of size adaption after feature extraction can maintain the advantage of richer information brought by the high resolution of RGB images and will not introduce redundant information.
We also perform ablation experiments on the hyperparameters in Equation (9). Hyperparameters , , and are the weights of classification loss, confidence loss, and bounding box loss, respectively. We adjust the order of magnitude of one of them to observe its impact on object-detection performance, as shown in Table 7. The experimental results show that the method’s performance is not sensitive to varying hyperparameters and , and the change in is less than 5%. However, the performance drops 25% when the is reduced by ten times. This illustrates that the classification loss has a greater impact on the performance of object detection than the confidence loss and bounding box loss .
Furthermore, we conduct ablation experiments on the FLIR and M3FD to analyze the transferability of the method. As shown in Table 8, we train the network on one of the datasets and then test it on the other. The experimental results show that our ADCNet outperforms the baseline in both experiment scenarios, further validating the superiority of our method. Due to the more severe misalignment of M3FD, the detection performance of both methods in M3FD → FLIR is better than FLIR → M3FD, which shows that it is difficult to generalize performance from aligned datasets to misaligned datasets. We also conduct experiments on the FLIR and M3FD to investigate the dependency of the method on the amount of training data. As shown in Table 9, we randomly discard 50% and 75% of the data for training and test it on the original test set. The results suggest that the ADCNet is not heavily reliant on the amount of training data. We also found that as the training data decreases, there is a more significant decline in compared to , indicating that the with a higher IOU threshold is more sensitive on the amount of training data.
5. Conclusions and Discussion
In this paper, we propose an adaptive dual-discrepancy calibration network (ADCNet) for misaligned RGB-Infrared object detection to address the issues of spatial misalignment and domain discrepancies between RGB and infrared modalities. Specifically, the adaptive spatial discrepancy calibration module drives the spatial alignment of RGB and infrared features to alleviate the localization error introduced by misaligned images. Then, we design a domain-discrepancy calibration module, which separately aligns object and background features from different modalities, making the fusion features easier for the network to distinguish the object and background to improve the performance of object detection. Comprehensive experimental results on two misaligned RGB-Infrared detection datasets demonstrate the effectiveness of our proposed method. In addition, ablation experiments of the hyperparameters and variance reports of multiple experiments verify that our proposed method has stable performance. The migration experiment between datasets verified that our method has good transferability. At the same time, our method is not heavily dependent on the amount of training data. The above performance further demonstrates the superiority of our ADCNet.
Manual calibration of misalignment between RGB and infrared images is a labor-intensive task, making adaptive calibration methods crucial in the field of RGB-Infrared object detection. In future work, we will broaden the research scope to encompass additional modalities, including LiDAR, SAR, and text, aiming to enhance object-detection performance by leveraging the synergistic potential of more modalities. Additionally, the employment of large language models has demonstrated remarkable performance in various object-detection tasks, such as CLIP-based open vocabulary object detection, text-guided object detection, etc. We believe that introducing CLIP into fusion detection based on RGB-IR would be a promising research avenue.
Author Contributions
Conceptualization, M.H. and Q.W.; methodology, M.H.; software, M.H.; validation, M.H., Q.W. and K.N.N.; formal analysis, Q.W.; investigation, F.M. and L.X.; data curation, M.H. and F.J.; writing—original draft preparation, M.H.; writing—review and editing, M.H., Q.W. and K.N.N.; visualization, M.H.; supervision, Q.W., K.N.N., F.J., F.M. and L.X.; project administration, F.J.; funding acquisition, Q.W. All authors have read and agreed to the published version of the manuscript.
Funding
This research was supported in part by the National Natural Science Foundation of China under Grants 61971095, 62271119 and 62071086, and the Natural Science Foundation of Sichuan Province under Grant 2023NSFSC1972.
Data Availability Statement
The FLIR dataset is obtained from https://www.flir.com/oem/adas/adas-dataset-form/ (accessed on 5 October 2023). The M3FD dataset is obtained from https://drive.google.com/drive/folders/1H-oO7bgRuVFYDcMGvxstT1nmy0WF_Y_6?usp=sharing (accessed on 5 October 2023).
Conflicts of Interest
The authors declare no conflict of interest.
References
- Redmon, J.; Farhadi, A. Yolov3: An incremental improvement. arXiv 2018, arXiv:1804.02767. [Google Scholar]
- Ren, S.; He, K.; Girshick, R.; Sun, J. Faster r-cnn: Towards real-time object detection with region proposal networks. Adv. Neural Inf. Process. Syst. 2015, 28. Available online: https://proceedings.neurips.cc/paper_files/paper/2015/hash/14bfa6bb14875e45bba028a21ed38046-Abstract.html (accessed on 5 October 2023). [CrossRef] [PubMed]
- Yang, X.; Sun, H.; Fu, K.; Yang, J.; Sun, X.; Yan, M.; Guo, Z. Automatic Ship Detection in Remote Sensing Images from Google Earth of Complex Scenes Based on Multiscale Rotation Dense Feature Pyramid Networks. Remote Sens. 2018, 10, 132. [Google Scholar] [CrossRef]
- Yao, C.; Xie, P.; Zhang, L.; Fang, Y. ATSD: Anchor-Free Two-Stage Ship Detection Based on Feature Enhancement in SAR Images. Remote Sens. 2022, 14, 6058. [Google Scholar] [CrossRef]
- He, K.; Gkioxari, G.; Dollár, P.; Girshick, R. Mask r-cnn. In Proceedings of the IEEE International Conference on Computer Vision, Venice, Italy, 22–29 October 2017; pp. 2961–2969. [Google Scholar]
- Cai, Z.; Vasconcelos, N. Cascade r-cnn: Delving into high quality object detection. In Proceedings of the IEEE Conference on Computer Vision and Pattern Recognition, Salt Lake City, UT, USA, 18–23 June 2018; pp. 6154–6162. [Google Scholar]
- Zhang, H.; Fromont, E.; Lefèvre, S.; Avignon, B. Guided attentive feature fusion for multispectral pedestrian detection. In Proceedings of the IEEE/CVF Winter Conference on Applications of Computer Vision, Waikoloa, HI, USA, 3–8 January 2021; pp. 72–80. [Google Scholar]
- Chen, Y.T.; Shi, J.; Ye, Z.; Mertz, C.; Ramanan, D.; Kong, S. Multimodal object detection via probabilistic ensembling. In Proceedings of the European Conference on Computer Vision, Tel Aviv, Israel, 23–27 October 2022; Springer: Cham, Switzerland, 2022; pp. 139–158. [Google Scholar]
- Dai, Y.; Wu, Y.; Zhou, F.; Barnard, K. Attentional local contrast networks for infrared small target detection. IEEE Trans. Geosci. Remote Sens. 2021, 59, 9813–9824. [Google Scholar] [CrossRef]
- Kieu, M.; Bagdanov, A.D.; Bertini, M.; Bimbo, A.d. Task-conditioned domain adaptation for pedestrian detection in thermal imagery. In Proceedings of the European Conference on Computer Vision, Glasgow, UK, 23–28 August 2020; Springer: Cham, Switzerland, 2020; pp. 546–562. [Google Scholar]
- Devaguptapu, C.; Akolekar, N.; Sharma, M.M.; Balasubramanian, V.N. Borrow from anywhere: Pseudo multi-modal object detection in thermal imagery. In Proceedings of the IEEE/CVF Conference on Computer Vision and Pattern Recognition Workshops, Long Beach, CA, USA, 16–17 June 2019. [Google Scholar]
- Zhao, C.; Wang, J.; Su, N.; Yan, Y.; Xing, X. Low Contrast Infrared Target Detection Method Based on Residual Thermal Backbone Network and Weighting Loss Function. Remote Sens. 2022, 14, 177. [Google Scholar] [CrossRef]
- Hwang, S.; Park, J.; Kim, N.; Choi, Y.; So Kweon, I. Multispectral pedestrian detection: Benchmark dataset and baseline. In Proceedings of the IEEE Conference on Computer Vision and Pattern Recognition, Boston, MA, USA, 7–12 June 2015; pp. 1037–1045. [Google Scholar]
- Lone, Z.A.; Pais, A.R. Object detection in hyperspectral images. Digit. Signal Process. 2022, 131, 103752. [Google Scholar]
- Yan, L.; Zhao, M.; Wang, X.; Zhang, Y.; Chen, J. Object detection in hyperspectral images. IEEE Signal Process. Lett. 2021, 28, 508–512. [Google Scholar] [CrossRef]
- Li, Z.; Xiong, F.; Zhou, J.; Lu, J.; Qian, Y. Learning a Deep Ensemble Network with Band Importance for Hyperspectral Object Tracking. IEEE Trans. Image Process. 2023, 32, 2901–2914. [Google Scholar] [CrossRef]
- Wang, Q.; Chi, Y.; Shen, T.; Song, J.; Zhang, Z.; Zhu, Y. Improving RGB-Infrared Object Detection by Reducing Cross-Modality Redundancy. Remote Sens. 2022, 14, 2020. [Google Scholar] [CrossRef]
- Xu, D.; Ouyang, W.; Ricci, E.; Wang, X.; Sebe, N. Learning cross-modal deep representations for robust pedestrian detection. In Proceedings of the IEEE Conference on Computer Vision and Pattern Recognition, Honolulu, HI, USA, 21–26 July 2017; pp. 5363–5371. [Google Scholar]
- Qingyun, F.; Dapeng, H.; Zhaokui, W. Cross-modality fusion transformer for multispectral object detection. arXiv 2021, arXiv:2111.00273. [Google Scholar]
- Li, C.; Song, D.; Tong, R.; Tang, M. Multispectral pedestrian detection via simultaneous detection and segmentation. arXiv 2018, arXiv:1808.04818. [Google Scholar]
- Yuan, M.; Wang, Y.; Wei, X. Translation, Scale and Rotation: Cross-Modal Alignment Meets RGB-Infrared Vehicle Detection. In Proceedings of the European Conference on Computer Vision, Tel Aviv, Israel, 23–27 October 2022; Springer: Cham, Switzerland, 2022; pp. 509–525. [Google Scholar]
- Liu, J.; Fan, X.; Huang, Z.; Wu, G.; Liu, R.; Zhong, W.; Luo, Z. Target-aware Dual Adversarial Learning and a Multi-scenario Multi-Modality Benchmark to Fuse Infrared and Visible for Object Detection. In Proceedings of the IEEE/CVF Conference on Computer Vision and Pattern Recognition, New Orleans, LA, USA, 18–24 June 2022; pp. 5802–5811. [Google Scholar]
- Valverde, F.R.; Hurtado, J.V.; Valada, A. There is more than meets the eye: Self-supervised multi-object detection and tracking with sound by distilling multimodal knowledge. In Proceedings of the IEEE/CVF Conference on Computer Vision and Pattern Recognition, Nashville, TN, USA, 20–25 June 2021; pp. 11612–11621. [Google Scholar]
- Team, F. Free Flir Thermal Dataset for Algorithm Training. Available online: https://www.flir.com/oem/adas/adas-dataset-form/ (accessed on 5 October 2023).
- Zhang, H.; Fromont, E.; Lefevre, S.; Avignon, B. Multispectral fusion for object detection with cyclic fuse-and-refine blocks. In Proceedings of the 2020 IEEE International Conference on Image Processing (ICIP), Abu Dhabi, United Arab Emirates, 25–28 October 2020; IEEE: Piscataway, NJ, USA, 2020; pp. 276–280. [Google Scholar]
- Xu, C.; Zheng, X.; Lu, X. Multi-Level Alignment Network for Cross-Domain Ship Detection. Remote Sens. 2022, 14, 2389. [Google Scholar] [CrossRef]
- Liu, Z.; Yang, X.; Gao, R.; Liu, S.; Dou, H.; He, S.; Huang, Y.; Huang, Y.; Luo, H.; Zhang, Y.; et al. Remove appearance shift for ultrasound image segmentation via fast and universal style transfer. In Proceedings of the 2020 IEEE 17th International Symposium on Biomedical Imaging (ISBI), Iowa City, IA, USA, 3–7 April 2020; IEEE: Piscataway, NJ, USA, 2020; pp. 1824–1828. [Google Scholar]
- Liu, M.; Ren, D.; Sun, H.; Yang, S.X. Multibranch Unsupervised Domain Adaptation Network for Cross Multidomain Orchard Area Segmentation. Remote Sens. 2022, 14, 4915. [Google Scholar] [CrossRef]
- Zhang, Y.; Li, M.; Li, R.; Jia, K.; Zhang, L. Exact feature distribution matching for arbitrary style transfer and domain generalization. In Proceedings of the IEEE/CVF Conference on Computer Vision and Pattern Recognition, New Orleans, LA, USA, 18–24 June 2022; pp. 8035–8045. [Google Scholar]
- Atapour-Abarghouei, A.; Breckon, T.P. Real-time monocular depth estimation using synthetic data with domain adaptation via image style transfer. In Proceedings of the IEEE Conference on Computer Vision and Pattern Recognition, Salt Lake City, UT, USA, 18–23 June 2018; pp. 2800–2810. [Google Scholar]
- Zhang, J.; Xu, S.; Sun, J.; Ou, D.; Wu, X.; Wang, M. Unsupervised Adversarial Domain Adaptation for Agricultural Land Extraction of Remote Sensing Images. Remote Sens. 2022, 14, 6298. [Google Scholar] [CrossRef]
- Zhu, Y.; Sun, X.; Wang, M.; Huang, H. Multi-Modal Feature Pyramid Transformer for RGB-Infrared Object Detection. IEEE Trans. Intell. Transp. Syst. 2023, 24, 9984–9995. [Google Scholar] [CrossRef]
- Jia, X.; Zhu, C.; Li, M.; Tang, W.; Zhou, W. LLVIP: A visible-infrared paired dataset for low-light vision. In Proceedings of the IEEE/CVF International Conference on Computer Vision, Montreal, BC, Canada, 11–17 October 2021; pp. 3496–3504. [Google Scholar]
- Razakarivony, S.; Jurie, F. Vehicle detection in aerial imagery: A small target detection benchmark. J. Vis. Commun. Image Represent. 2016, 34, 187–203. [Google Scholar] [CrossRef]
- Choi, H.; Kim, S.; Park, K.; Sohn, K. Multi-spectral pedestrian detection based on accumulated object proposal with fully convolutional networks. In Proceedings of the 2016 23rd International Conference on Pattern Recognition (ICPR), Cancun, Mexico, 4–8 December 2016; IEEE: Piscataway, NJ, USA, 2016; pp. 621–626. [Google Scholar]
- Zhang, L.; Liu, Z.; Zhang, S.; Yang, X.; Qiao, H.; Huang, K.; Hussain, A. Cross-modality interactive attention network for multispectral pedestrian detection. Inf. Fusion 2019, 50, 20–29. [Google Scholar] [CrossRef]
- Wagner, J.; Fischer, V.; Herman, M.; Behnke, S. Multispectral Pedestrian Detection using Deep Fusion Convolutional Neural Networks. In Proceedings of the 24th European Symposium on Artificial Neural Networks, Computational Intelligence and Machine Learning ESANN, Bruges, Belgium, 27–29 April 2016; Volume 587, pp. 509–514. [Google Scholar]
- Fu, Y.; Wu, X.J.; Kittler, J. A deep decomposition network for image processing: A case study for visible and infrared image fusion. arXiv 2021, arXiv:2102.10526. [Google Scholar]
- Zhao, Z.; Xu, S.; Zhang, C.; Liu, J.; Li, P.; Zhang, J. DIDFuse: Deep image decomposition for infrared and visible image fusion. arXiv 2020, arXiv:2003.09210. [Google Scholar]
- Liu, J.; Zhang, S.; Wang, S.; Metaxas, D.N. Multispectral deep neural networks for pedestrian detection. arXiv 2016, arXiv:1611.02644. [Google Scholar]
- Vaswani, A.; Shazeer, N.; Parmar, N.; Uszkoreit, J.; Jones, L.; Gomez, A.N.; Kaiser, Ł.; Polosukhin, I. Attention is all you need. Adv. Neural Inf. Process. Syst. 2017, 30. Available online: https://proceedings.neurips.cc/paper_files/paper/2017/hash/3f5ee243547dee91fbd053c1c4a845aa-Abstract.html (accessed on 5 October 2023).
- Konig, D.; Adam, M.; Jarvers, C.; Layher, G.; Neumann, H.; Teutsch, M. Fully convolutional region proposal networks for multispectral person detection. In Proceedings of the IEEE Conference on Computer Vision and Pattern Recognition Workshops, Honolulu, HI, USA, 21–26 July 2017; pp. 49–56. [Google Scholar]
- Krizhevsky, A.; Sutskever, I.; Hinton, G.E. Imagenet classification with deep convolutional neural networks. Commun. ACM 2017, 60, 84–90. [Google Scholar] [CrossRef]
- Bauer, E.; Kohavi, R. An empirical comparison of voting classification algorithms: Bagging, boosting, and variants. Mach. Learn. 1999, 36, 105–139. [Google Scholar] [CrossRef]
- Dietterich, T.G. Ensemble methods in machine learning. In Proceedings of the International Workshop on Multiple Classifier Systems, Cagliari, Italy, 21–23 June 2000; Springer: Berlin/Heidelberg, Germany, 2000; pp. 1–15. [Google Scholar]
- Bodla, N.; Singh, B.; Chellappa, R.; Davis, L.S. Soft-NMS—improving object detection with one line of code. In Proceedings of the IEEE International Conference on Computer Vision, Venice, Italy, 22–29 October 2017; pp. 5561–5569. [Google Scholar]
- Solovyev, R.; Wang, W.; Gabruseva, T. Weighted boxes fusion: Ensembling boxes from different object detection models. Image Vis. Comput. 2021, 107, 104117. [Google Scholar] [CrossRef]
- Li, C.; Song, D.; Tong, R.; Tang, M. Illumination-aware faster R-CNN for robust multispectral pedestrian detection. Pattern Recognit. 2019, 85, 161–171. [Google Scholar] [CrossRef]
- Dollár, P.; Wojek, C.; Schiele, B.; Perona, P. Pedestrian detection: A benchmark. In Proceedings of the 2009 IEEE Conference on Computer Vision and Pattern Recognition, Miami, FL, USA, 20–25 June 2009; IEEE: Piscataway, NJ, USA, 2009; pp. 304–311. [Google Scholar]
- Xu, P.; Davoine, F.; Denoeux, T. Evidential combination of pedestrian detectors. In Proceedings of the British Machine Vision Conference, Nottingham, UK, 1–5 September 2014; pp. 1–14. [Google Scholar]
- Rostami, M.; Kolouri, S.; Eaton, E.; Kim, K. Deep transfer learning for few-shot SAR image classification. Remote Sens. 2019, 11, 1374. [Google Scholar] [CrossRef]
- Benjdira, B.; Bazi, Y.; Koubaa, A.; Ouni, K. Unsupervised domain adaptation using generative adversarial networks for semantic segmentation of aerial images. Remote Sens. 2019, 11, 1369. [Google Scholar] [CrossRef]
- Kan, M.; Shan, S.; Chen, X. Bi-shifting auto-encoder for unsupervised domain adaptation. In Proceedings of the IEEE International Conference on Computer Vision, Cambridge, MA, USA, 20–23 June 2015; pp. 3846–3854. [Google Scholar]
- Ye, F.; Luo, W.; Dong, M.; He, H.; Min, W. SAR image retrieval based on unsupervised domain adaptation and clustering. IEEE Geosci. Remote Sens. Lett. 2019, 16, 1482–1486. [Google Scholar] [CrossRef]
- Jiang, Y.; Xia, T.; Wang, D.; Fang, X.; Xi, L. Adversarial regressive domain adaptation approach for infrared thermography-based unsupervised remaining useful life prediction. IEEE Trans. Ind. Inform. 2022, 18, 7219–7229. [Google Scholar] [CrossRef]
- Ultralytics. YOLOv5. Available online: https://github.com/ultralytics/yolov5 (accessed on 5 October 2023).
- Liu, S.; Qi, L.; Qin, H.; Shi, J.; Jia, J. Path aggregation network for instance segmentation. In Proceedings of the IEEE Conference on Computer Vision and Pattern Recognition, Salt Lake City, UT, USA, 18–23 June 2018; pp. 8759–8768. [Google Scholar]
- Jaderberg, M.; Simonyan, K.; Zisserman, A. Spatial transformer networks. Adv. Neural Inf. Process. Syst. 2015, 28. Available online: https://proceedings.neurips.cc/paper_files/paper/2015/hash/33ceb07bf4eeb3da587e268d663aba1a-Abstract.html (accessed on 5 October 2023).
- Qian, Y.; Yang, M.; Zhao, X.; Wang, C.; Wang, B. Oriented spatial transformer network for pedestrian detection using fish-eye camera. IEEE Trans. Multimed. 2019, 22, 421–431. [Google Scholar] [CrossRef]
- Huang, X.; Belongie, S. Arbitrary style transfer in real-time with adaptive instance normalization. In Proceedings of the IEEE International Conference on Computer Vision, Venice, Italy, 22–29 October 2017; pp. 1501–1510. [Google Scholar]
- Pan, X.; Luo, P.; Shi, J.; Tang, X. Two at once: Enhancing learning and generalization capacities via ibn-net. In Proceedings of the European Conference on Computer Vision (ECCV), Munich, Germany, 8–14 September 2018; pp. 464–479. [Google Scholar]
- Tang, Z.; Gao, Y.; Zhu, Y.; Zhang, Z.; Li, M.; Metaxas, D.N. Crossnorm and selfnorm for generalization under distribution shifts. In Proceedings of the IEEE/CVF International Conference on Computer Vision, Montreal, QC, Canada, 10–17 October 2021; pp. 52–61. [Google Scholar]
- Karras, T.; Laine, S.; Aila, T. A style-based generator architecture for generative adversarial networks. In Proceedings of the IEEE/CVF Conference on Computer Vision and Pattern Recognition, Long Beach, CA, USA, 15–20 June 2019; pp. 4401–4410. [Google Scholar]
- Zheng, Z.; Wang, P.; Liu, W.; Li, J.; Ye, R.; Ren, D. Distance-IoU loss: Faster and better learning for bounding box regression. In Proceedings of the AAAI Conference on Artificial Intelligence, New York, NY, USA, 7–12 February 2020; Volume 34, pp. 12993–13000. [Google Scholar]
- Zhu, X.; Lyu, S.; Wang, X.; Zhao, Q. TPH-YOLOv5: Improved YOLOv5 based on transformer prediction head for object detection on drone-captured scenarios. In Proceedings of the IEEE/CVF International Conference on Computer Vision, Montreal, BC, Canada, 11–17 October 2021; pp. 2778–2788. [Google Scholar]
Figure 1.
Illustration of spatial misalignment. (a) Low-quality bounding boxes caused by spatial misalignment. (b) The fusion image generated by the method TarDAL [22] will produce a ghost, disturbing the localization. (c) The proposed ADCNet method is intended to learn the spatial relationship between RGB and IR to achieve spatial discrepancy calibration at the feature level.

Figure 2.
Directly fusing RGB and IR deep features with domain discrepancies will result in overlapping distributions of the object and background, making it challenging for the detection head. Our method first performs domain-discrepancy calibration on multi-modal features and then conducts feature fusion.

Figure 3.
Comparison of RGB-Infrared fusion methods in different stages. (a) Early fusion. (b) Mid-fusion. (c) Late fusion.
Figure 3.
Comparison of RGB-Infrared fusion methods in different stages. (a) Early fusion. (b) Mid-fusion. (c) Late fusion.

Figure 4.
An overview of our adaptive dual-discrepancy calibration network (ADCNet) for misaligned RGB-Infrared object detection. (1) Size adaption module. The main focus of our method is on the dual-discrepancy calibration, i.e., (2) spatial discrepancy calibration and (3) domain discrepancy calibration in the graph. Among them, the rotated picture highlights the issue of spatial misalignment, and the colormap of the feature only represents the domain discrepancy.

Figure 5.
The flowchart of Adaptive Instance Normalization (AdaIN) and fusion. The highlighted part of the cube on the right illustrates the dimensions for normalization.
Figure 5.
The flowchart of Adaptive Instance Normalization (AdaIN) and fusion. The highlighted part of the cube on the right illustrates the dimensions for normalization.

Figure 6.
Confusion matrix of validation results on FLIR by different methods. (a) ADCNet (ours). (b) Baseline. (c) Pool and nms. (d) CFT [19]. (e) TarDAL [22]. (f) Only infrared.

Figure 7.
Qualitative comparison of object-detection results in (a–c) three scenarios on the M3FD dataset. The rows from top to bottom in the figure are the results of infrared detection, TarDAL, CFT, baseline, and our ADCNet, respectively. From scene (a,b), it can be found that our ADCNet has a more satisfactory detection effect for smaller objects. In scene (c), the results of our method have higher confidence.

Figure 8.
A demonstration of the effect of our spatial discrepancy calibration module. The RGB and infrared images in the figure are from the misaligned version of the M3FD dataset. We project the RGB deep features of the baseline and the deep features through our calibration onto the IR original image (the third and fourth rows in the figure). Rows 5 and 6 highlight the cropped regions shown by the red and green dashed frames in rows 3 and 4. From the visualization results, it can be seen that the features after the spatial discrepancy calibration module have a higher coincidence with the IR image.

Figure 9.
Visualization of the distance relationship between two modalities’ features before (a) and after (b) domain-discrepancy calibration module through the t-SNE algorithm. Each point represents the feature of crop regions of objects and backgrounds, of which the green and blue five-pointed stars are typical examples as shown in the figure. The RGB and IR features are aligned after our domain-discrepancy calibration. The rows from top to bottom represent the three adaptive dual-discrepancy calibrations of our network, which are, respectively, located after the , , and downsampling of the backbone.


Table 1.
Comparison results of different methods on the FLIR dataset. The best result is boldfaced.
| mAP | |||||||
|---|---|---|---|---|---|---|---|
| Method | Type | Bicycle | Car | Person | mAP | mAP | mAP |
| DDFusion [38] | early fusion | 0.575 | 0.870 | 0.733 | 0.726 | 0.297 | 0.352 |
| DIDFuse [39] | early fusion | 0.474 | 0.873 | 0.707 | 0.685 | 0.291 | 0.340 |
| TarDAL [22] | early fusion | 0.589 | 0.885 | 0.829 | 0.768 | 0.357 | 0.400 |
| CFR [25] | mid-fusion | 0.578 | 0.849 | 0.745 | 0.724 | - | - |
| GAFF [7] | mid-fusion | - | - | - | 0.729 | 0.329 | 0.375 |
| CFT [19] | mid-fusion | 0.598 | 0.894 | 0.827 | 0.773 | 0.349 | 0.397 |
| MFPT [32] | mid-fusion | 0.677 | 0.890 | 0.832 | 0.800 | - | - |
| Pool and NMS | late fusion | 0.610 | 0.904 | 0.833 | 0.782 | 0.355 | 0.400 |
| ProbEn [8] | late fusion | 0.735 | 0.901 | 0.877 | 0.838 | - | - |
| YOLOv5 | Infrared | 0.575 | 0.897 | 0.829 | 0.767 | 0.351 | 0.395 |
| Baseline(ours) | mid-fusion | 0.637 | 0.909 | 0.875 | 0.807 | 0.364 | 0.413 |
| ADCNet(ours) | mid-fusion | 0.734 | 0.915 | 0.871 | 0.840 | 0.383 | 0.428 |
Table 2.
Comparison of performance metrics between the method ProbEn [8] and our method.
Table 2.
Comparison of performance metrics between the method ProbEn [8] and our method.
| Method | Img Size | mAP | Params (M) | FLOPs (G) |
|---|---|---|---|---|
| ProbEn | 0.838 | >180.4 | >283.7 | |
| ADCNet(ours) | 0.840 | 107.8 | 171.7 |
Table 3.
Evaluations on the M3FD (misaligned) dataset. The best indicators are generally boldfaced.
| mAP | ||||||||||
|---|---|---|---|---|---|---|---|---|---|---|
| Method | Type | People | Car | Bus | Motor | Lamp | Truck | mAP | mAP | mAP |
| DDFusion [38] | early fusion | 0.739 | 0.755 | 0.752 | 0.603 | 0.453 | 0.643 | 0.657 | 0.389 | 0.384 |
| DIDFuse [39] | early fusion | 0.725 | 0.725 | 0.747 | 0.618 | 0.399 | 0.597 | 0.635 | 0.360 | 0.366 |
| TarDAL [22] | early fusion | 0.795 | 0.830 | 0.856 | 0.741 | 0.668 | 0.788 | 0.780 | 0.480 | 0.469 |
| CFR [25] | mid-fusion | 0.808 | 0.875 | 0.862 | 0.816 | 0.764 | 0.837 | 0.827 | 0.508 | 0.503 |
| CFT [19] | mid-fusion | 0.818 | 0.884 | 0.880 | 0.833 | 0.757 | 0.819 | 0.832 | 0.551 | 0.522 |
| pool and nms | late fusion | 0.760 | 0.856 | 0.868 | 0.779 | 0.739 | 0.811 | 0.802 | 0.517 | 0.502 |
| YOLOv5 | Infrared | 0.805 | 0.882 | 0.886 | 0.823 | 0.769 | 0.810 | 0.829 | 0.524 | 0.512 |
| Baseline(ours) | mid-fusion | 0.802 | 0.874 | 0.874 | 0.799 | 0.735 | 0.830 | 0.819 | 0.508 | 0.497 |
| ADCNet(ours) | mid-fusion | 0.828 | 0.887 | 0.900 | 0.848 | 0.797 | 0.807 | 0.844 | 0.557 | 0.533 |
Table 4.
Multiple experiments were conducted to report the standard deviation of various metrics of our method on the FLIR and M3FD datasets.
Table 4.
Multiple experiments were conducted to report the standard deviation of various metrics of our method on the FLIR and M3FD datasets.
| Method | Dataset | |||||||||
| Bicycle | Car | Person | ||||||||
| ADCNet | FLIR | 0.001 | 0.01 | 0.005 | 0.006 | 0.001 | 0.003 | |||
| People | Car | Bus | Motor | Lamp | Truck | |||||
| ADCNet | M3FD | 0.001 | 0.005 | 0.001 | 0.004 | 0.002 | 0.002 | 0.006 | 0.006 | 0.004 |
Table 5.
Ablation experiments on the FLIR dataset, where the baseline is a dual-branch detection network that replaces our adaptive dual-discrepancy calibration with a direct concatenate operation.
Table 5.
Ablation experiments on the FLIR dataset, where the baseline is a dual-branch detection network that replaces our adaptive dual-discrepancy calibration with a direct concatenate operation.
| Spatial Discrepancy Calibration | Domain Discrepancy Calibration | mAP | mAP | mAP |
|---|---|---|---|---|
| 0.807 | 0.364 | 0.413 | ||
| ✔ | 0.820 | 0.367 | 0.411 | |
| ✔ | 0.831 | 0.370 | 0.425 | |
| ✔ | ✔ | 0.840 | 0.383 | 0.428 |
Table 6.
Ablation experiments on the M3FD dataset. The baseline is the same as above. The inference time is measured on an RTX3090 GPU when the batch size is set to 16. The original resolution of the RGB image is , and the original resolution of the IR image is in our misaligned M3FD dataset.
Table 6.
Ablation experiments on the M3FD dataset. The baseline is the same as above. The inference time is measured on an RTX3090 GPU when the batch size is set to 16. The original resolution of the RGB image is , and the original resolution of the IR image is in our misaligned M3FD dataset.
| Method | RGB Size | IR Size | mAP | mAP | mAP | Params (M) | FLOPs (G) | Infer Time (ms) |
|---|---|---|---|---|---|---|---|---|
| Baseline | 640 | 640 | 0.819 | 0.508 | 0.497 | 98.5 | 159.6 | 8.0 |
| Baseline ⋆ | 640 | 640 | 0.836 | 0.534 | 0.526 | 99.7 | 160.4 | 8.1 |
| Baseline ⋆⋄ | 640 | 640 | 0.844 | 0.557 | 0.533 | 107.8 | 171.7 | 8.4 |
| Baseline ⋆⋄• | 1024 | 640 | 0.873 | 0.569 | 0.544 | 120.2 | 290.1 | 14.1 |
| Baseline ⋆⋄ | 1024 | 1024 | 0.870 | 0.587 | 0.550 | 107.8 | 439.6 | 22.3 |
⋆⋄• represent spatial discrepancy calibration, domain-discrepancy calibration, and size adaption process, respectively.
Table 7.
Ablation experiments of the hyperparameters of Equation (9) on the FLIR dataset, where are the weights of loss , respectively.
Table 7.
Ablation experiments of the hyperparameters of Equation (9) on the FLIR dataset, where are the weights of loss , respectively.
| mAP | mAP | mAP | |||
|---|---|---|---|---|---|
| 0.840 | 0.383 | 0.428 | |||
| 0.814 | 0.329 | 0.397 | |||
| 0.794 | 0.353 | 0.397 | |||
| 0.800 | 0.342 | 0.391 | |||
| 0.841 | 0.376 | 0.427 | |||
| 0.59 | 0.311 | 0.325 | |||
| 0.828 | 0.371 | 0.422 |
Table 8.
Ablation experiments on the FLIR and M3FD to analyze the transferability performance of our method. We only used categories common to the two datasets during training and testing.
Table 8.
Ablation experiments on the FLIR and M3FD to analyze the transferability performance of our method. We only used categories common to the two datasets during training and testing.
| Method | Training Data | Test Data | mAP | mAP | mAP |
|---|---|---|---|---|---|
| baseline | M3FD | FLIR | 0.796 | 0.384 | 0.415 |
| ADCNet | M3FD | FLIR | 0.791 | 0.393 | 0.420 |
| baseline | FLIR | M3FD | 0.562 | 0.263 | 0.284 |
| ADCNet | FLIR | M3FD | 0.589 | 0.281 | 0.301 |
Table 9.
Ablation experiments were performed on FLIR and M3FD to analyze dependence on the amount of training data. We randomly discarded 50% and 75% of the training images.
Table 9.
Ablation experiments were performed on FLIR and M3FD to analyze dependence on the amount of training data. We randomly discarded 50% and 75% of the training images.
| Dataset | Training Data | Test Data | mAP | mAP | mAP |
|---|---|---|---|---|---|
| FLIR | 100% | 100% | 0.840 | 0.383 | 0.428 |
| FLIR | 50% | 100% | 0.832 | 0.362 | 0.415 |
| FLIR | 25% | 100% | 0.815 | 0.343 | 0.409 |
| M3FD | 100% | 100% | 0.844 | 0.557 | 0.533 |
| M3FD | 50% | 100% | 0.828 | 0.537 | 0.525 |
| M3FD | 25% | 100% | 0.806 | 0.522 | 0.502 |
Disclaimer/Publisher’s Note: The statements, opinions and data contained in all publications are solely those of the individual author(s) and contributor(s) and not of MDPI and/or the editor(s). MDPI and/or the editor(s) disclaim responsibility for any injury to people or property resulting from any ideas, methods, instructions or products referred to in the content. |
© 2023 by the authors. Licensee MDPI, Basel, Switzerland. This article is an open access article distributed under the terms and conditions of the Creative Commons Attribution (CC BY) license (https://creativecommons.org/licenses/by/4.0/).
Share and Cite
MDPI and ACS Style
He, M.; Wu, Q.; Ngan, K.N.; Jiang, F.; Meng, F.; Xu, L. Misaligned RGB-Infrared Object Detection via Adaptive Dual-Discrepancy Calibration. Remote Sens. 2023, 15, 4887. https://0-doi-org.brum.beds.ac.uk/10.3390/rs15194887
AMA Style
He M, Wu Q, Ngan KN, Jiang F, Meng F, Xu L. Misaligned RGB-Infrared Object Detection via Adaptive Dual-Discrepancy Calibration. Remote Sensing. 2023; 15(19):4887. https://0-doi-org.brum.beds.ac.uk/10.3390/rs15194887
Chicago/Turabian StyleHe, Mingzhou, Qingbo Wu, King Ngi Ngan, Feng Jiang, Fanman Meng, and Linfeng Xu. 2023. "Misaligned RGB-Infrared Object Detection via Adaptive Dual-Discrepancy Calibration" Remote Sensing 15, no. 19: 4887. https://0-doi-org.brum.beds.ac.uk/10.3390/rs15194887
Note that from the first issue of 2016, this journal uses article numbers instead of page numbers. See further details here.