
Implementation Method of Automotive Video SAR (ViSAR) Based on Sub-Aperture Spectrum Fusion


1
Xi’an Key Laboratory of Network Convergence Communication, Xi’an University of Science and Technology, Xi’an 710054, China
2
National Laboratory of Radar Signal Processing, Xidian University, Xi’an 710071, China
*
Author to whom correspondence should be addressed.
Remote Sens. 2023, 15(2), 476; https://0-doi-org.brum.beds.ac.uk/10.3390/rs15020476
Submission received: 26 November 2022
/
Revised: 28 December 2022
/
Accepted: 11 January 2023
/
Published: 13 January 2023
(This article belongs to the Topic Information Sensing Technology for Intelligent/Driverless Vehicle)
Abstract
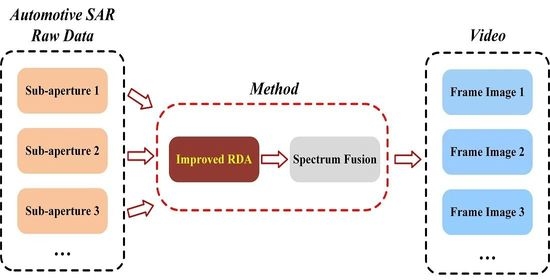
:The automotive synthetic aperture radar (SAR) can obtain two-dimensional (2-D) high-resolution images and has good robustness compared with the other sensors. Generally, the 2-D high-resolution always conflicts with the real-time requirement in conventional SAR imaging. This article suggests an automotive video SAR (ViSAR) imaging technique based on sub-aperture spectrum fusion to address this issue. Firstly, the scene space variation problem caused by close observation distance in automotive SAR is analyzed. Moreover, the sub-aperture implementation method, frame rate and resolution of automotive ViSAR are also introduced. Then, the improved Range Doppler algorithm (RDA) is used to focus the sub-aperture data. Finally, a sub-aperture stitching strategy is proposed to obtain a high-resolution frame image. Compared with the available ViSAR imaging method, the proposed method is more efficient, performs better, and is more appropriate for automotive ViSAR. The simulation results and actual data of the automotive SAR validate the effectiveness of the proposed method.
1. Introduction
As the main development direction of the automobile industry in the future, autonomous driving technology has received extensive attention in recent years. The premise of autonomous driving is real-time, high-precision and high-reliability perceptions of the road traffic environment. As the information source of environment sensing and control systems, the sensor is one of the main contents in autonomous driving technology. To achieve the ultimate goal of autonomous driving, Advanced Driver Assistance Systems (ADAS) include multiple sensors such as cameras, ultrasonic sensors, infrared sensors, lidar, and Millimeter-Wave (MMW) radar [1].
As one of the core sensors for autonomous driving systems, MMW radar is more robust to environmental conditions such as illumination changes, rain, and fog, and can measure range, azimuth angles, and instantaneous velocity [2]. In addition, the detection range of MMW radar can reach 250 m under harsh conditions where other sensors cannot work [3]. Although MMW radar can measure radial range and speed with high accuracies, the angular resolution is limited by the actual antenna array aperture and sensor cost. As a result, the angular resolution of MMW radar finds it challenging to meet the spatial resolution requirements in driving environments [4]. Synthetic Aperture Radar (SAR) technology utilizes automotive motion to synthesize a large antenna aperture, which can break through the limitation of the actual antenna aperture and realize the two-dimensional (2-D) high-resolution imaging of targets [5]. Therefore, SAR systems are emerging as one of the most promising technologies to perform high-resolution imaging of the driving scenario [5,6] and have been continuously developed in recent years [7,8,9,10,11]. However, there are still several problems for automotive SAR that need to be tackled:
- Compared with other platforms, such as airborne and spaceborne, the automotive platform has slow speed, low altitude, and short distance characteristics. While motion error often significantly influences the instantaneous slant range, motion compensation is a vital issue to be solved in automotive SAR imaging.
- To achieve a 2-D high-resolution image, large, transmitted bandwidth and long integration time are necessary, which conflicts with the real-time imaging requirements in the driving scenario. Therefore, the realization of automotive SAR real-time imaging is also a problem that needs to be solved.
- In the automotive SAR imaging scene, the range-azimuth coupling of near targets is much more severe than that of distant targets, which means that there is a serious spatial variation problem. Some conventional imaging algorithms will cause defocus and distortion of the target. Therefore, the space-variant problem must be analyzed with specific imaging algorithms.
Recently, some motion compensation methods have been proposed to improve the accuracy of automotive SAR imaging [12,13,14,15], which ignores the real-time imaging and spatially variant of the range dimension. The real-time imaging proposed by [16,17] only aims at the system’s processing speed without considering the synthetic aperture time. Conventional SAR imaging requires sufficient synthetic aperture time to obtain 2-D high resolution, but limits its real-time performance. The video SAR (ViSAR) can continuously output multiple frames of images, which can overcome the contradiction of conventional SAR and meet the real-time requirements of driving scenes simultaneously. Similar to conventional SAR, ViSAR can be applied to different platforms (e.g., satellites [18,19], aircraft [20,21], and automobiles [22]). In addition, the ViSAR can work in different modes depending on the requirement, such as strip-map mode [23], spotlight mode [18], etc. In recent research, ViSAR has mainly been applied to monitor the area of interest and move target detection in real-time [24,25]. However, in the field of intelligent driving, automotive ViSAR needs to meet the needs of automotive peripheral imaging, which requires higher real-time performance. Therefore, the processing method of automotive ViSAR is a problem that needs to be solved.
Back-projection algorithm (BPA) is a common way to process ViSAR images [26,27], which is unconstrained by the motion trajectory. Moreover, for the aperture overlap mode of video SAR, the single-pulse imaging results of BPA can be reused to avoid repeating the data calculation. However, the BPA has much computation, which burdens the hardware system processing. The fast back-project algorithm (FBPA) [28] and fast-factorized back-project algorithm (FFBPA) [29,30] proposed in recent years are simpler and more efficient than the BPA. For the FBPA and FFBPA, the operation numbers are significantly reduced by sub-aperture techniques. However, regarding the computational load, time-domain algorithms (TDAs) are not always the best for real-time imaging of automotive SAR systems. The polar format algorithm (PFA) is also used to process ViSAR data [31,32]. However, the far-field assumption of PFA is invalid due to the close observation distance in automotive SAR, which brings large residual errors. The residual errors, mainly referring to wavefront bending errors, brings spatially variant distortions and defocus effects in the final image [33]. A sub-aperture method is proposed in [19], based on the Extended Chirp Scaling algorithm (ECSA), to reasonably realize space-borne ViSAR imaging by dividing a frame image into several sub-apertures. It can also avoid the problem of repeated data processing in the aperture overlap mode.
Furthermore, the method of dividing sub-apertures is also used in real-time imaging of spaceborne SAR [34,35]. The frequency domain algorithm, which has more advantages than the TDAs in processing efficiency, is typically used in the sub-aperture real-time imaging technique [19,34,35]. However, the above-mentioned sub-aperture stitching methods are based on space-borne spotlight mode SAR imaging, which causes image aliasing in strip-map mode. Moreover, the CSA requires the range signal have linear frequency modulation characteristics, which makes it unsuitable for the Frequency Modulated Continuous Wave (FMCW) signal that has been de-chirped in the automotive SAR. Therefore, this article proposes a new sub-aperture processing method to realize automotive strip-map ViSAR imaging. This method combines the Range Doppler algorithm (RDA) to directly construct existing functions without complicated operations such as interpolation, with small computation and high processing efficiency. In addition, the focus algorithm in this article also considers the space-variant of the range dimension of the automotive SAR scene.
In this paper, a geometric model of automotive SAR imaging is established first, and the implementation of automotive ViSAR is introduced. In addition, the resolution and frame rate of vehicle-mounted ViSAR images in sub-aperture mode is also analyzed based on the automotive ViSAR model. Then, a method of realizing automotive ViSAR in strip map mode based on sub-aperture spectrum fusion is designed, which is realized by constantly changing the aperture center moment of a sub-aperture block. Moreover, for the severe space-variation problem in the automotive SAR imaging scene, the segmented range cell migration correction (RCMC) method is used to avoid the complex calculation caused by sinc interpolation. This method can effectively improve the distortion problem caused by space variation.
The rest of this work is organized as follows: Section 2 establishes the automotive SAR imaging model, briefly introduces the method of sub-aperture to realize ViSAR, and provides some characteristic analysis of automotive ViSAR. Section 3 mainly introduces the specific steps of ViSAR implementation. Section 4 is the vehicle video SAR simulation results and the measured experiments’ processing results. Section 5 supplements the span of range dimension blocks, and the proposed method is compared with the traditional method in terms of computational complexity. Conclusions are drawn in Section 6.
2. Modeling
2.1. Geometric Model
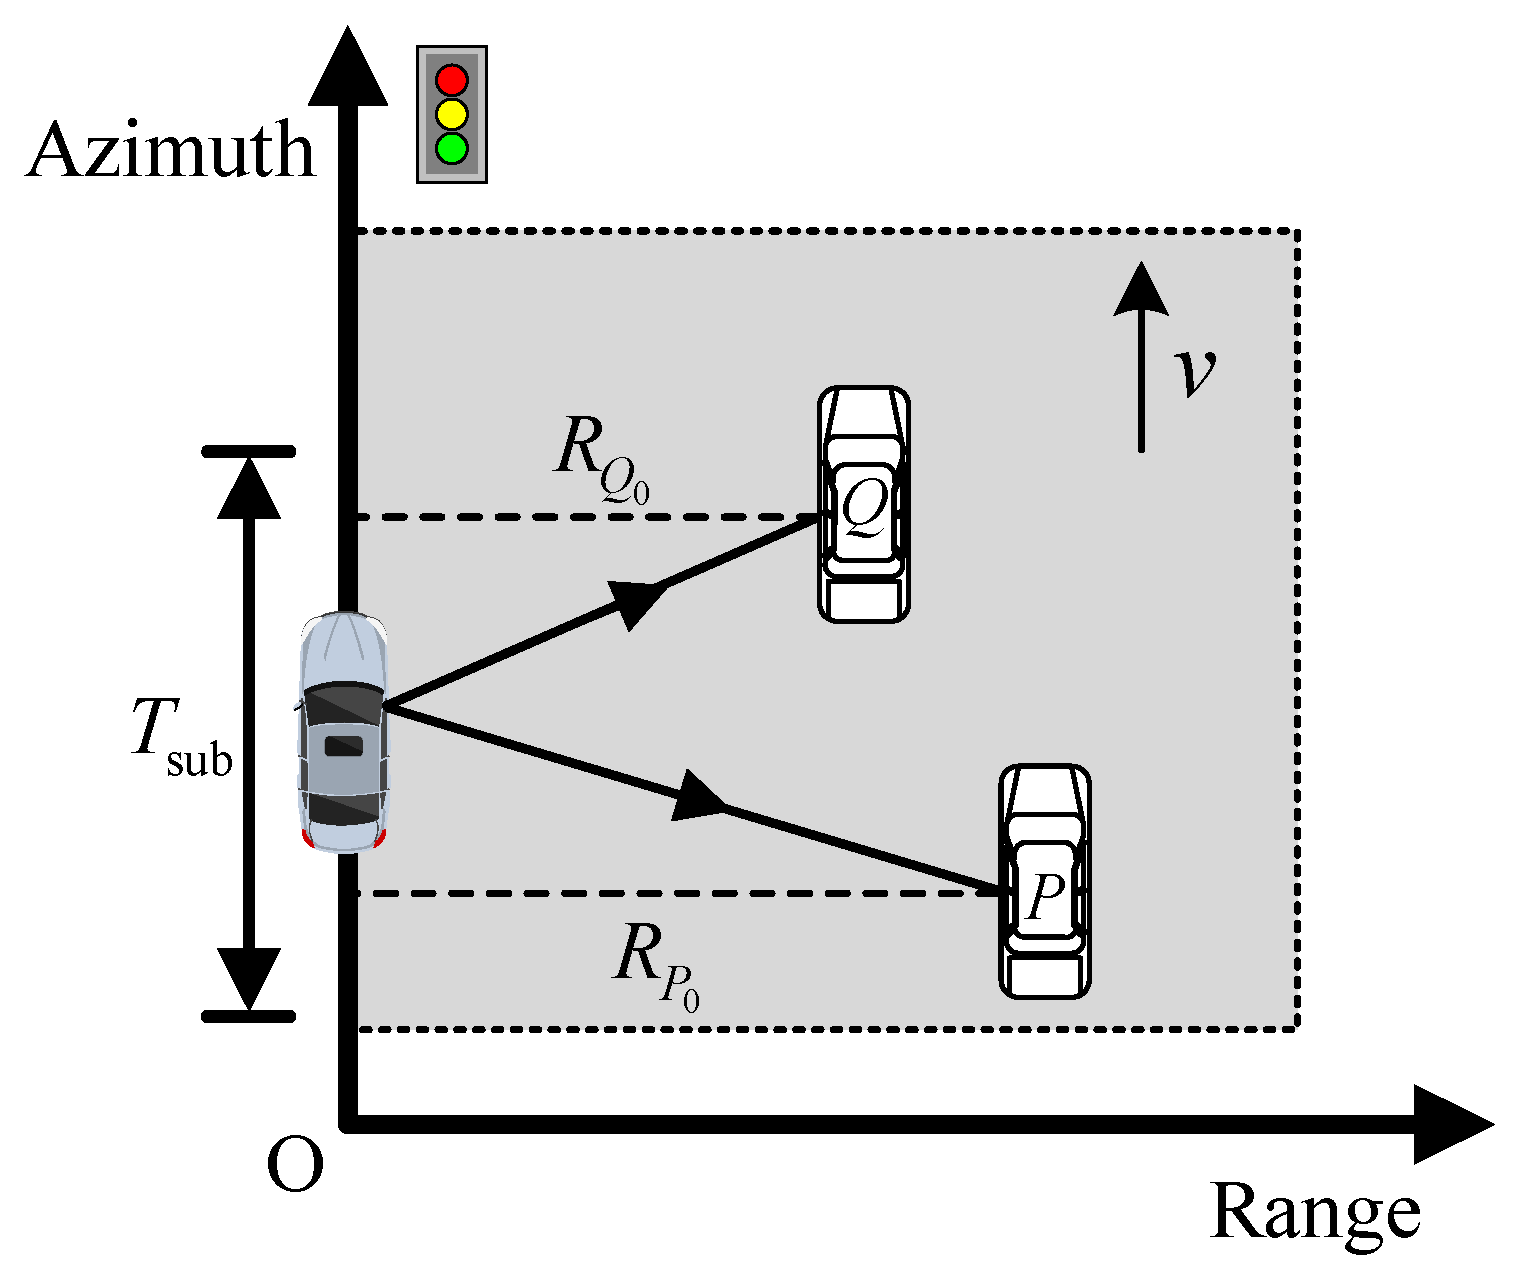
The geometric model of automotive SAR imaging, which works in strip-map mode, is shown in Figure 1. The automotive radar moves along the azimuth axis with a constant velocity . Assuming that points Q and P are, respectively, the central reference point and an arbitrary point on the ground scene. and represent the minimum slant range of Q and P, respectively. is the synthetic aperture time of the sub-aperture.
Traditionally, the FMCW system uses a non ‘stop-go’ range model, i.e., the effect of fast time on the instantaneous slope range cannot be ignored. However, considering the short distance and slow speed of automotive SAR, this paper re-analyses the problem. According to [36,37], the effect of the continuous movement of the radar during signal transmission on the echo signal can be approximated as a frequency offset at the signal’s center frequency, as shown in Figure 2. Whether the ‘stop-go’ mode can be used in automotive SAR imaging depends on the frequency offset . After de-chirp processing of the echo signal, this frequency offset is converted to a slant range offset:
where is the center frequency, is the signal bandwidth, is the frequency sweep period, and is the squint angle of view between the radar and the target at the time of signal transmission. Generally, the values of these parameters are listed in Table 1. The maximum slant range offset that can be obtained:
where is range resolution simplified to . The maximum slant range offset caused by a continuous movement of the radar during the signal transmission is much less than a quarter of the range resolution unit, which can be ignored [36,38].
Therefore, the ‘stop-go’ assumption is valid in automotive SAR imaging under general parameters. According to the imaging geometry, the instantaneous slant range of the point P is expressed as:
where represents the azimuth time of the sub-aperture, is the aperture center moment of the k-th sub-aperture, is the azimuth position of the point P.
Figure 3 shows the phase error caused by simplifying range history in ‘stop-go’ mode. The contour map is measured in units. Hence, this signifies that the maximum phase error is less , indicating that the range history approximation under the automotive FMCW system is reasonable.
Then, the instantaneous range of the point target P can be expanded by Taylor series:
In the traditional airborne or spaceborne SAR case, the minimum slant range of the targets in the scene is much more extensive than the length of the synthetic aperture, which can be considered equally. Thus, the space-variant in-range migration compensation can be ignored and replaced by the reference point. However, this approximation cannot be used in automotive SAR imaging due to the significant spatial variation issue. The space-variant range curvature term is depicted schematically in Figure 4. Figure 4a depicts the curvature space-variance phase error. The unit of the contour map is . The maximum spatial variations are larger than , which cannot be neglected. If the range space variance is ignored, the range curvature correction of the short-range and far-range targets would fail, shown in Figure 4b. It is noted that only the reference point is corrected well.
2.2. Basic Implementation Methods of Automotive ViSAR
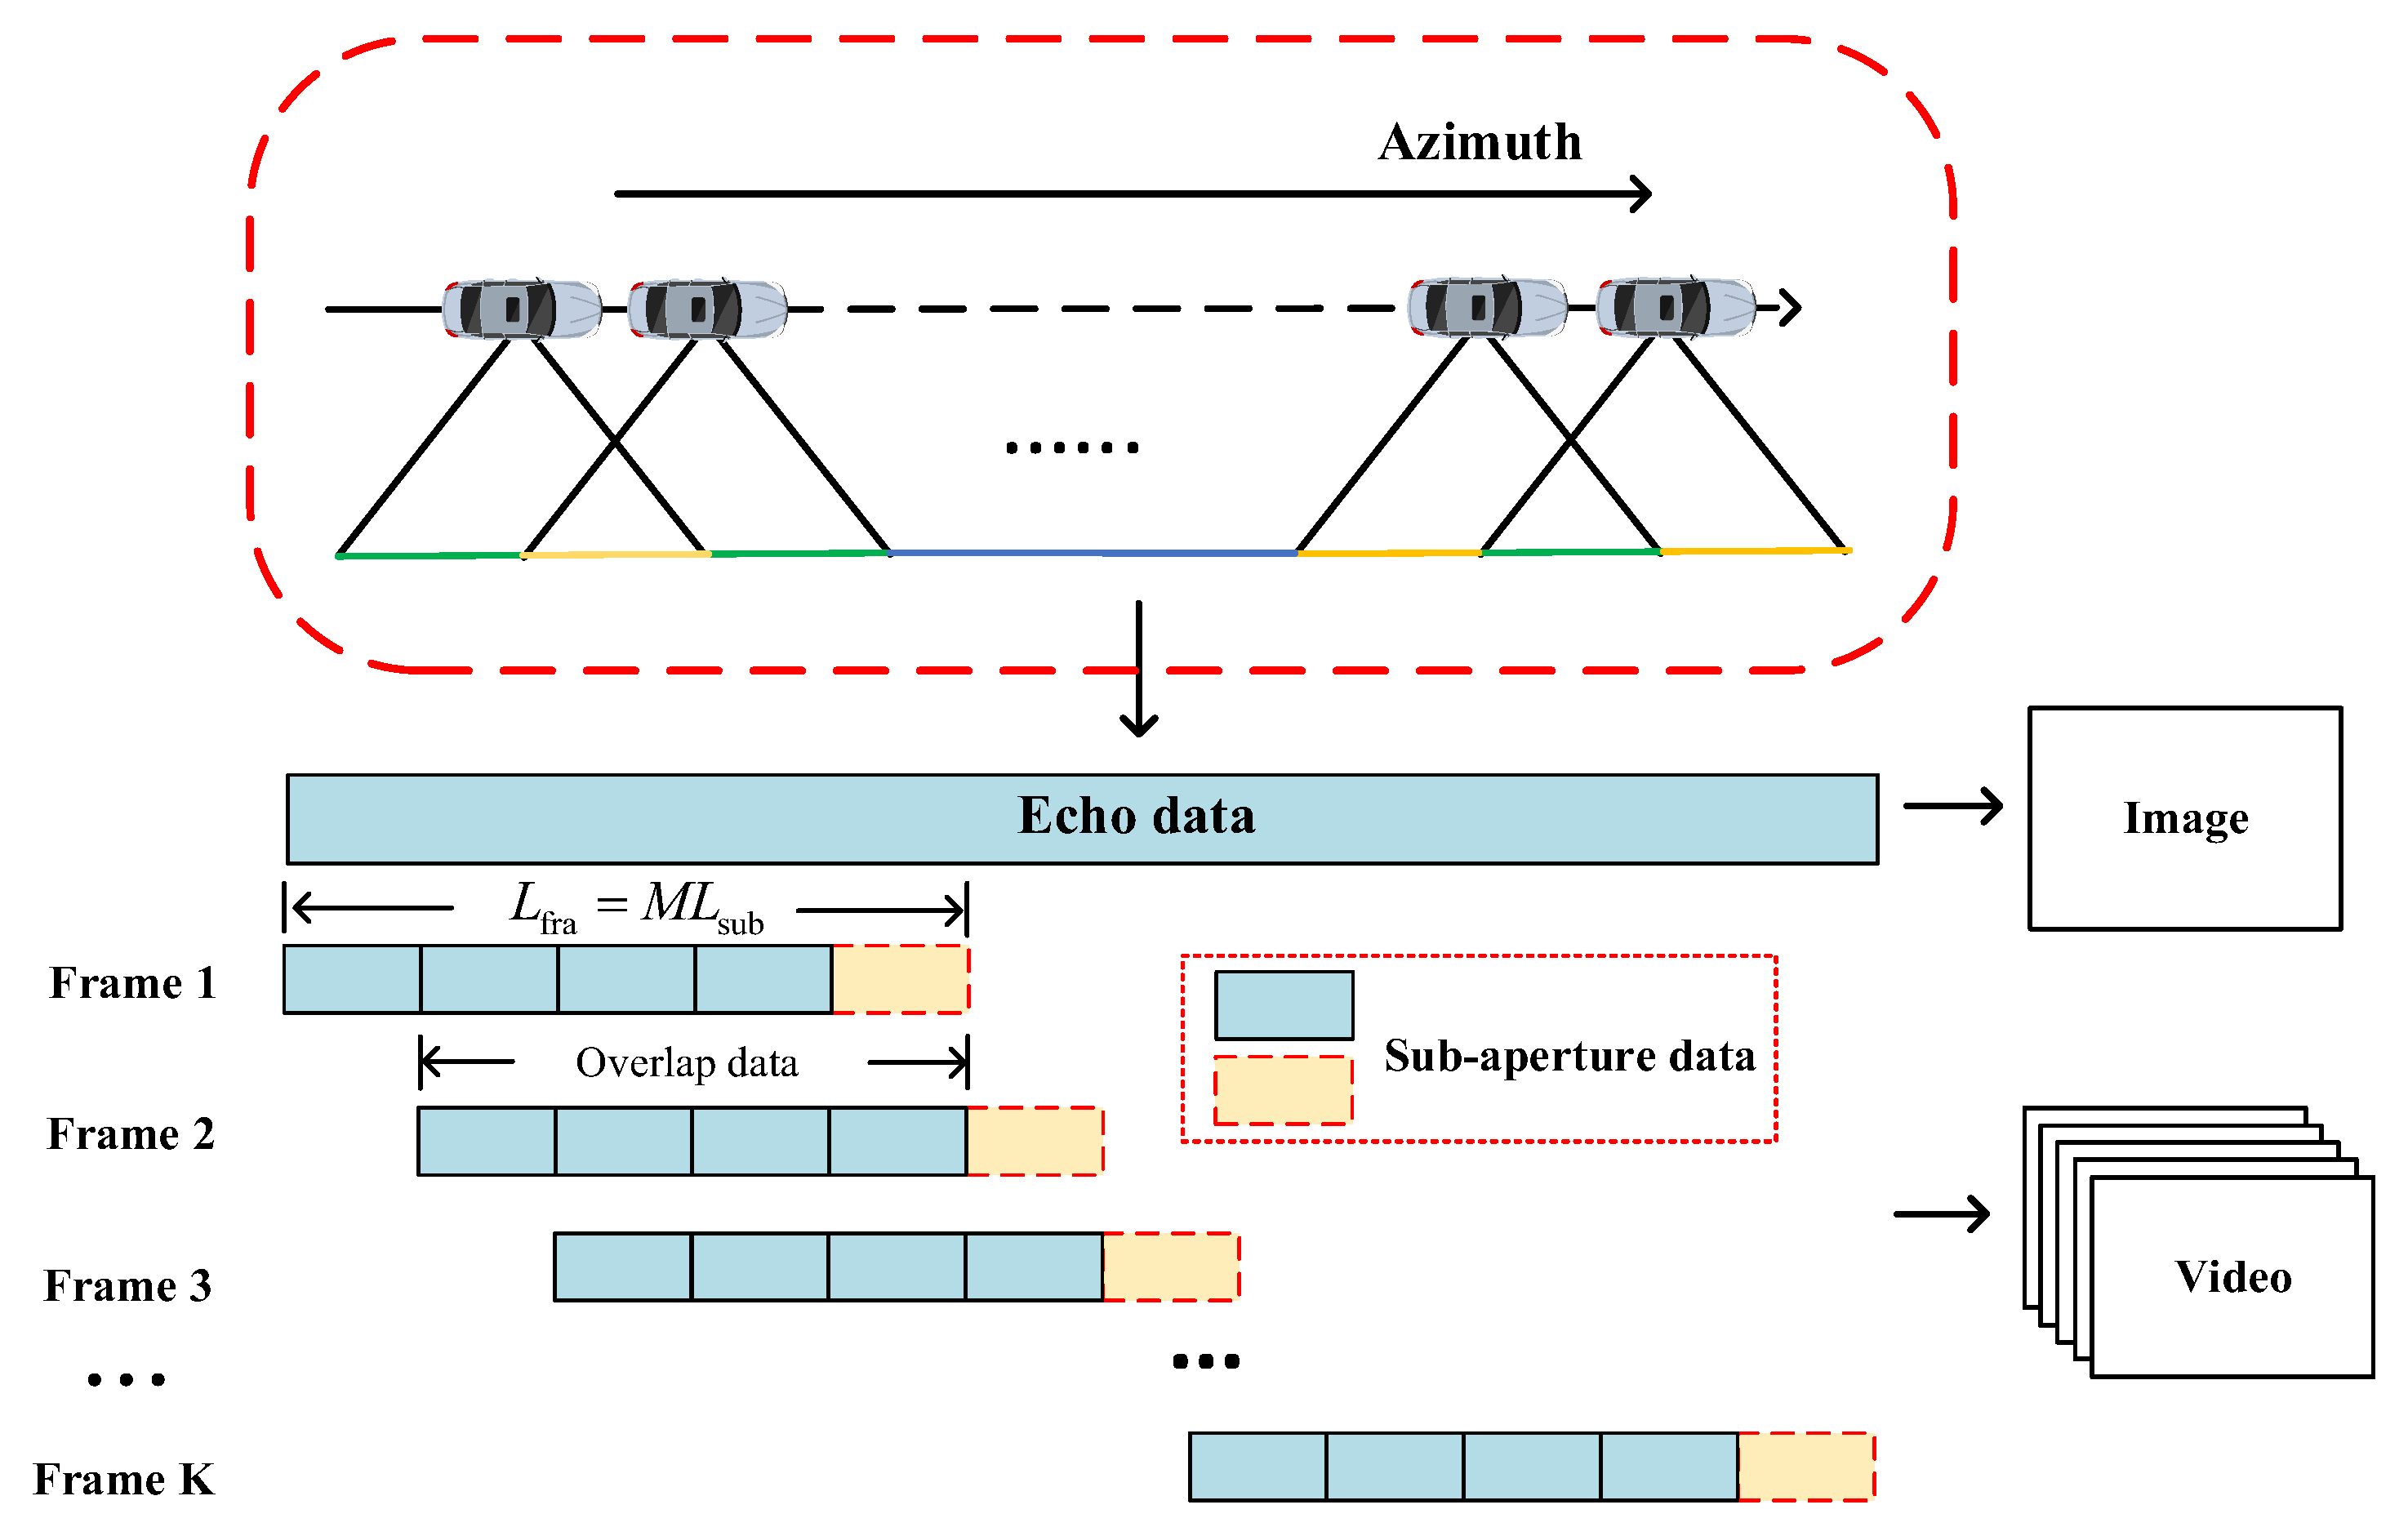
There are two ways to implement ViSAR, i.e., aperture without overlap processing and aperture overlap processing [22]. In general, the carrier frequency of the radar cannot satisfy the high frame rate requirements in the non-overlap mode. Moreover, aperture overlap processing is usually selected to increase the coherence of adjacent frame images and demonstrate the image changes continuously. Figure 5 shows the basic implementation principle of automotive ViSAR in the aperture overlap mode. The traditional SAR imaging result is a single static image with low real-time performance. ViSAR divides the traditional SAR echo data and outputs the imaging results as image streams. As shown in Figure 5, in the aperture overlap method, the data of the previous frame will be reused when generating the next frame image in ViSAR, which means that a new ViSAR image can be generated with a shorter synthetic aperture length.
The sub-aperture method is used in this article to realize the automotive ViSAR, which effectively solves the problem of repeated data processing due to the additional processing burden of data overlap. Figure 5 shows the synthetic aperture length corresponding to each frame, divided into sub-apertures with the sub-aperture length being . Since each sub-aperture is processed separately, the sub-aperture data of the previous frame image are reused to focus on the next frame image, which does not need to reprocess. During the new frame imaging, most of the calculation amount will be concentrated on processing one sub-aperture marked in yellow in Figure 5. Nevertheless, the azimuth resolution of a single sub-aperture is low due to the short coherent accumulation time. Next, we will discuss how to improve the resolution of the frame image.
2.3. The Frame Resolution of Automotive ViSAR Images
Generally, the sub-aperture coherent stitching method is used to solve the problem of low sub-aperture resolution. For the point target P in Figure 6a, the Doppler bandwidth of the sub-aperture is expressed as:
where and represent the starting and ending angles of the k-th sub-aperture, respectively, and is the coherence accumulation angle. Meanwhile, is the starting angle of the (k + 1)-th sub-aperture. Therefore, the Doppler frequency of two adjacent sub-aperture data is continuous, as shown in Figure 6b. The spectrum fusion method can achieve coherent splicing of multiple sub-aperture signal bandwidths, improving the azimuth dimension resolution of the point target. After splicing, the signal bandwidth is given as:
where is the bandwidth of the sub-aperture signals. Then, the resolution of the frame image after sub-aperture stitching can be expressed as:
2.4. The Frame Rate of Automotive ViSAR Images
If the frame length is less than the synthetic aperture, the frame rate of ViSAR can be derived based on the relationship with frame resolution [39]. Usually, the target distance in the automotive SAR case is less than 30 m, and the beamwidth of the radar is about 8°. As a result, the synthetic aperture length of the automotive SAR is less than 5 m. However, to display more information, the frame length of automotive ViSAR is usually longer than . Thus, the frame rate expression of automotive ViSAR is re-derived in this paper.
If the overlap rate of data is defined as , the time to form a new frame image should be:
The frame rate of the ViSAR can be expressed as:
where is usually times of , is a coefficient which is generally chosen to be 4 or 5. And according to Section 2.2, , the frame rate can be rewritten as:
where is the range of the farthest target in the scene. According to (10), the frame rate is related to the number of sub-apertures .
3. Imaging Approach
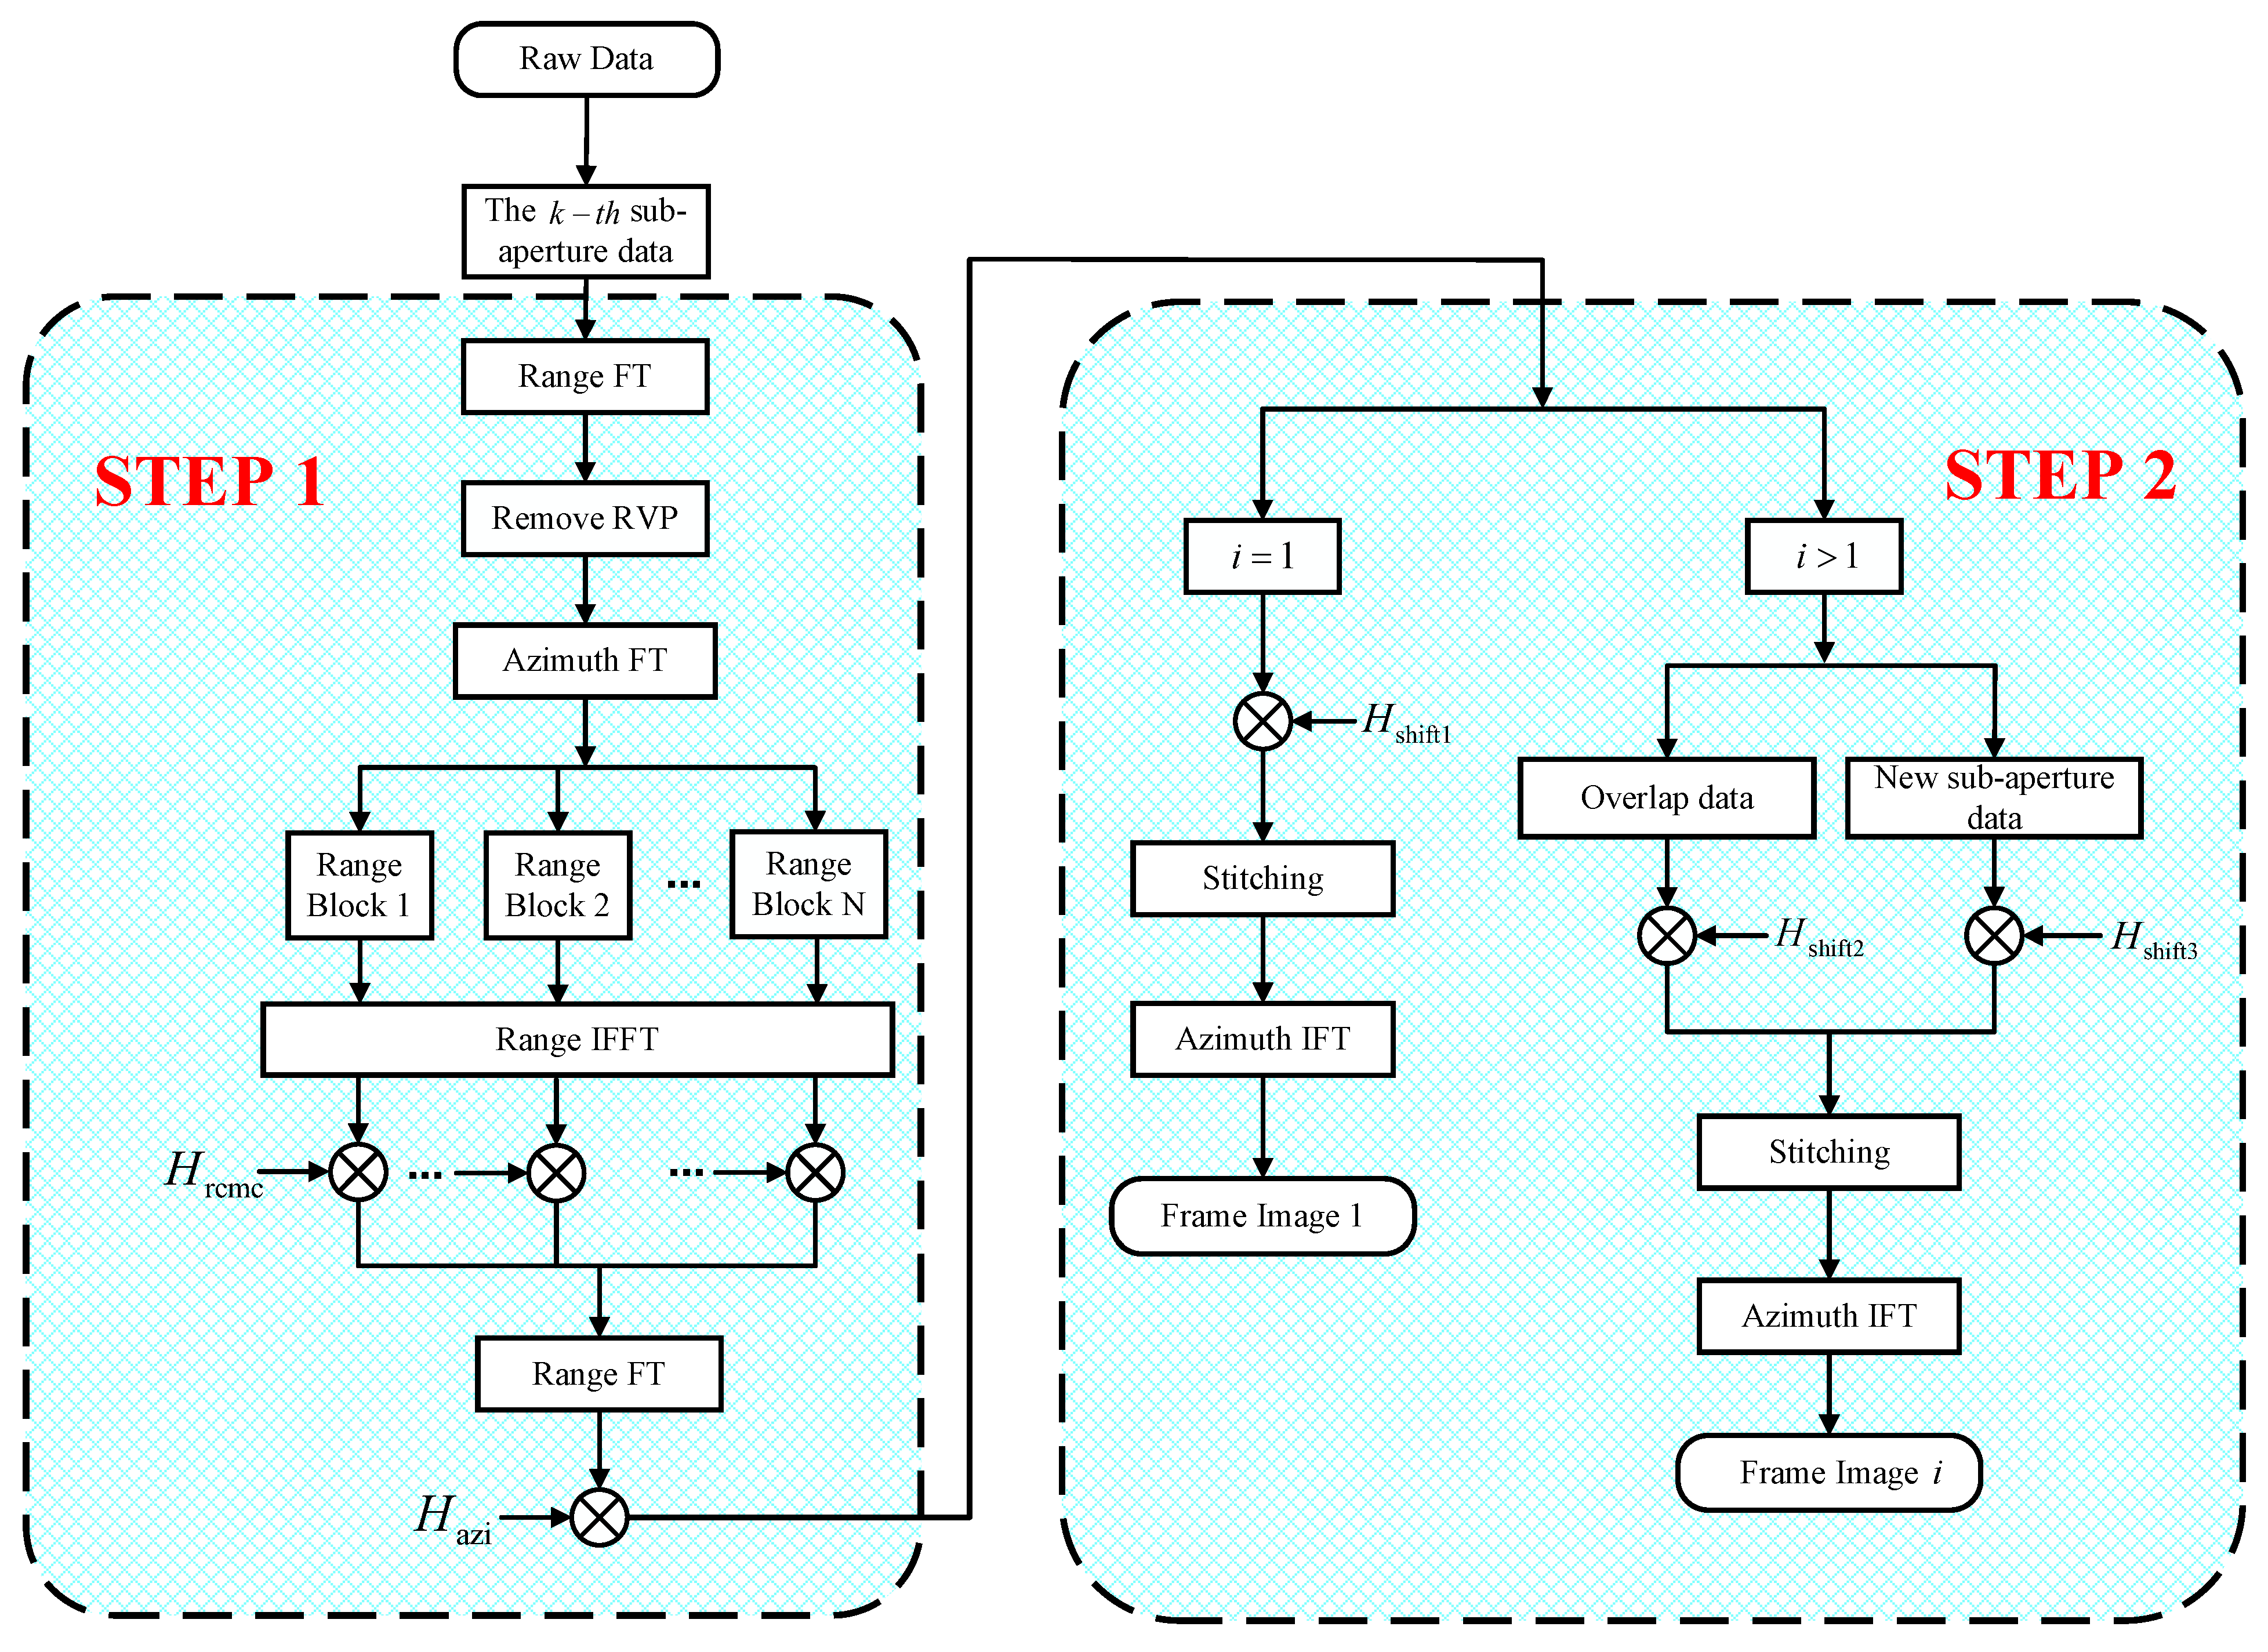
In this section, we propose a method to realize automotive ViSAR imaging based on the principle of sub-aperture spectrum fusion. The method is mainly divided into two steps. In the first step, the frequency domain algorithm is used to focus the sub-aperture signal. It is worth mentioning that several focusing approaches such as RDA, CSA, and the Range Migration algorithm (RMA) [16] can be applied for SAR imaging. Consider the computational load, the improved RDA with segmented RCMC is presented in this paper. The second step is sub-aperture stitching to obtain the whole frame image based on the method of spectrum fusion.
3.1. Sub-Aperture Signal Focusing Processing
3.1.1. Range Dimension Preprocessing
Since the vehicle-mounted MMW radar is a frequency-modulated continuous wave system, the received signal is de-chirped before being sampled by A/D converters to reduce the digital hardware cost of the system. After mixing with the transmitted signal and ignoring unimportant amplitude and phase terms, the received sub-aperture echo signal (without residual video phase) at point P in the range frequency and azimuth time domain is expressed as:
where is the azimuth window function in the time domain, is the carrier frequency of the signal, is the modulated frequency rate, and is the signal frequency sweep period. Substituting (4) into (11), and then performing a Fourier Transform (FT) of the azimuth time by the principle of stationary phase, the 2-D frequency domain signal can be rewritten as:
where is the azimuth frequency of the sub-aperture signal, and represents the range cell migration of the point P. There are two standard RCMC methods: phase compensation [38] and sinc interpolation [40]. However, the calculation load brought by correcting the curvature with interpolation is extremely large, which would affect the imaging efficiency. Therefore, we will adopt phase compensation to correct range cell migration in this paper. Transforming the signal into the range time and azimuth frequency domain yields:
where is the window function in the range time domain. The first phase term in (13) is range curvature and needs to be compensated. As mentioned in the previous section, the spatial variation of the range dimension in the automotive SAR will bring about the problem of image defocusing. Because the range space variance cannot be ignored, the sub-aperture data are divided into several range blocks along the range direction for range curvature compensation. The compensation function of the i-th range block can be expressed as:
where represents the reference range for the n-th range block.
Multiplying (13) with (14) the signal after the range dimension processing in the two-dimensional frequency domain is as follows:
This range cell migration is corrected and then compared with (12).
3.1.2. Azimuth Dimension Processing
After range migration correction, the range signal and azimuth signal are decoupled. Therefore, the signal can be azimuthally compressed in the two-dimensional frequency domain. The reference function in the frequency domain for azimuth compression is:
Multiplying (15) with (16), the sub-aperture data after azimuth compression can be written as:
3.2. Sub-Aperture Data Stitching
In order to obtain a high-resolution frame image, sub-aperture data stitching needs to be implemented. The inverse FT must be performed on the azimuth signal to obtain the sub-aperture focusing results per (17). However, the focusing position in the azimuth time would vary with or the azimuth sub-aperture index , which generates azimuth-aliasing. Therefore, a spectrum fusion procedure for automotive ViSAR is designed.
3.2.1. The First Frame Image Stitching
For the first frame image processing, it is necessary to eliminate the center moment of each sub-aperture and focus it on the correct position. The first sub-apertures will be multiplied by the azimuth compensation function:
After multiplying with (18), the sub-aperture signal can be expressed as:
The azimuth inverse FT is performed, and the stitched signals are given as:
where repents the azimuth time of the frame. Then, the first frame image is obtained by stitching the sub-aperture signals.
3.2.2. The i-th Frame Image Stitching
Unlike the first frame imaging, the frame consists of overlapping sub-aperture data and new sub-aperture data mentioned in Section 2.2. Thus, the i-th frame image stitching is achieved in two steps.
- (1)
- Processing of overlap sub-aperture data
According to the ViSAR principle, the sequence of overlap data in the i-th frame shifts relative to the previous frame. An azimuth compensation function for sequence shifting is introduced to solve this problem:
- (2)
- Processing of new sub-aperture data
In order to align with overlap data, the new sub-aperture data after the azimuth process in the i-th frame should be flited by:
Then, the i-th frame data is multiplied by (21) or (22), and the spliced signal of i-th frame image can be written as:
Finally, the i-th frame image is obtained, in which the position of the point target has an offset relative to the first frame. The schematic diagram of sub-aperture stitching is shown in Figure 7.
The flowchart of sub-aperture data processing is shown in Figure 8. Considering the complex scenarios, the focusing algorithm in step 1 needs to be improved to ensure that the sub-aperture data is well-focused.
4. Simulation Results
In this section, the results of the point targets simulation and actual experimental data are provided to demonstrate the effectiveness of the proposed approach.
4.1. Point Targets Simulation
The imaging scene is shown in Figure 9, and a set of 4 6-point targets is included. The distance between two adjacent point targets is 6 m in azimuth and 3 m in range. There are six-point targets PT1 to PT6 marked in Figure 9. The main simulation parameters are listed in Table 2.
The simulation, is set to 28 m, and each frame image contains 11 sub-apertures. According to the parameters in Table 2, the frame rate of automotive ViSAR, calculated using formula (10), is about 5 Hz. Furthermore, the movement amount of each point target on the two adjacent frame images is 256 samples. From the simulation results shown in Figure 10, it can be seen that the image information demonstrated by ViSAR will change with the movement of the SAR platform. When comparing Figure 10b,c, the position of the same point target, such as PT2, in the two adjacent frame images, is offset by 256 samples.
The method of sub-aperture data stitching is verified below. Under the simulation parameters listed in Table 2, the length of its full aperture for a single-point target is three times that of the sub-aperture. Figure 11 shows the resolution improvement process of point PT1. It is noted that the azimuth resolution is gradually improved. However, the edge points in each frame image will not achieve full-aperture azimuth resolution due to an insufficient number of sub-aperture stitching, such as PT5 in the second frame image in Figure 10b. Simulation results for three randomly selected point targets processed with different methods are provided to demonstrate the efficacy of the proposed method, namely PT3 in the second frame image, PT4 in the fourth frame image, and PT5 in the sixth frame image. The focusing results of the traditional RDA and the proposed method with segmented RCMC are shown in Figure 12a,b, respectively. The time-domain algorithm also avoids repeated operations in ViSAR data processing. As a comparison, the focusing results of three-point targets in the ViSAR image generated by FFBPA [29] are also given. FFBPA performs point-by-point interpolation during the imaging process, which can effectively solve the problem of scene space variation.
To quantify the precision of the proposed approach, the impulse–response width (IRW), peak sidelobe ratio (PSLR), and integrated sidelobe ratio (ISLR) of the azimuth profile are also used as criteria. The results are listed in Table 3. The method proposed herein has the same focusing performance as FFBPA. Therefore, only one sub-aperture datum is processed. Then, a frame image can be obtained by coherent splicing with the previously processed data, which reduces the burden of the system processing.
4.2. Automotive SAR Real Data Experiments
In this section, a set of automotive SAR experimental systems was established and is shown in Figure 13, which was utilized to obtain the actual data in a scene demonstrated in Figure 14. Moreover, the robot mobile platform speed moved at a constant of 1.6 m/s, the height of the radar from the ground was about 1.5 m, the carrier frequency was 77 GHz, the transmission bandwidth was 3600 MHz, and the system sampling frequency was 10 MHz.
Figure 15 shows the SAR imaging results of the experimental scene focused on by the proposed method in this work. Figure 15a is the first frame image, in which the front part of the cars was encircled by a white dotted line and the flower beds behind the cars were encircled by a solid red line. Both of them were well focused in the ViSAR image. Meanwhile, the measuring length of the headstock and the interspace were, respectively, 1.72 m and 0.9 m, marked on the image. The length of the real headstock was 1.70 m, which is approximately equal to the imaging result. In addition, the image information displayed by ViSAR will vary with the forward movement of the radar platform, which is similar to the simulation results. It is noted that the position of car A marked in Figure 15 is changed in each frame image.
Figure 16 shows the comparison results of actual data by RDA and FFBPA. In this article, image entropy was used to quantitatively evaluate the imaging results of the actual data. For SAR images, it is generally believed that the smaller the image entropy, the better the image focus [41]. The image entropy of Figure 16b,c is 1.133 and 1.135, respectively, while that of Figure 16a is 1.647, demonstrating our superiority. Meanwhile, from the perspective of visual effect, the headstock enclosed by the white dotted line in Figure 16a is obviously defocused. Figure 16b,c prove that the proposed method can achieve almost the same focusing quality as the FFBPA for ViSAR.
5. Discussion
5.1. Size of the Range Blocks
The determination of the span for the range blocks is a critical component. As shown in Figure 17, represents the reference range for the n-th range block, and represents the span of each range block along the range dimension. In this section, the range cell migration of point P is represented by the difference between the slant range at the edge of the synthetic aperture and the minimum range:
Then, the range cell migration difference between the farthest target and the nearest target in the n-th range block is:
If is less than a quarter of the range resolution unit , it is considered that the range curvature of the far and near point targets in the n-th range block is the same [38]. Therefore, the range block span is expressed as:
5.2. Computational Complexity
The FFBPA avoids the repeated calculation of overlap data through the sub-aperture method and obtains higher imaging accuracy. However, FFBPA is not always the best choice due to its high computational requirement. In this section, the computational complexity of the proposed method is analyzed and compared with FFBPA.
Suppose that and represent the azimuth and range points of the sub-aperture under the proposed method. In the case of the same data overlap rate, the computational complexity of generating a frame image by FFBPA is expressed as:
where denotes the length of sub-aperture under the FFBPA. The proposed method consists of three range dimension FT operations, two azimuth dimension FT operations and multiplication operations, which is more straightforward than FFBPA. Suppose that the number of segments is the computational complexity of the proposed method with segmented RCMC processing is:
Meanwhile, to verify the efficiency of improved RDA selected in this paper, the computational complexity of the proposed method based on RMA can be expressed as:
where is the length of the interpolation kernel. Ratios at five sample sizes of azimuth are computed to quantify the comparison (Table 4). Clearly, the computational loads of FFBPA and RMA with incorporation of 2-D spectrum fusion method are both much higher than that of the proposed approach.
6. Conclusions
The ViSAR imaging method based on sub-aperture spectrum fusion is proposed in this paper, which can meet the real-time requirements of automotive SAR imaging in strip-map mode. The main characteristics of the vehicle platform were analyzed through the establishment of the sub-aperture imaging model, which includes the problem of scene space variation, and the resolution and the frame rate of ViSAR images. The improved RDA was then used to remove the scene space variation and finish the sub-aperture data focus processing. A spectrum fusion strategy was presented to obtain a high azimuth resolution frame image, which introduces different azimuth compensation functions for different focused sub-aperture data to complete coherent stitching of frame data in the Doppler domain. Compared with FFBPA, the proposed method dramatically improves imaging efficiency. The simulation and actual data show that the proposed method is well applied to the real-time imaging of automotive SAR. It is worth mentioning that the proposed method is mainly applied for the strip-map mode because the beam pointing of the millimeter wave radar always keeps fixed. Considering the spotlight case, modifications corresponding to the azimuth compensations should be applied. Particularly, to ensure the applicability, the improved focusing algorithm for complex scenarios will be studied in our next work.
Author Contributions
P.G. conceived the main idea; F.W., S.T. and C.J. conceived and designed the experiments; P.G., F.W. and C.L. analyzed the data; P.G. and F.W. wrote the paper. All authors have read and agreed to the published version of the manuscript.
Funding
This work was supported in part by the National Natural Science Foundation of China under Grants 61701393, and 61971329, by the Natural Science Basis Research Plan in Shaanxi Province of China under Grant 2020ZDLGY02-08, and in part by Funded by National Key Laboratory of Science and Technology on Space Microwave, No. HTKJ2022KL504019.
Conflicts of Interest
The authors declare no conflict of interest.
References
- Gao, C.; Wang, G.; Shi, W.; Wang, Z.; Chen, Y. Autonomous Driving Security: State of the Art and Challenges. IEEE Internet Things J. 2022, 9, 7572–7595. [Google Scholar] [CrossRef]
- Cui, H.; Wu, J.; Zhang, J.; Chowdhary, G.; Norris, W. 3D Detection and Tracking for On-road Vehicles with a Monovision Camera and Dual Low-cost 4D mmWave Radars. In Proceedings of the 2021 IEEE International Intelligent Transportation Systems Conference (ITSC), Indianapolis, IN, USA, 19–22 September 2021; pp. 2931–2937. [Google Scholar]
- Marti, E.; Miguel, M.A.; Garcia, F.; Perez, J. A Review of Sensor Technologies for Perception in Automated Driving. IEEE Intell. Transp. Syst. Mag. 2019, 11, 94–108. [Google Scholar] [CrossRef] [Green Version]
- Sun, S.; Petropulu, A.P.; Poor, H.V. MIMO Radar for Advanced Driver-Assistance Systems and Autonomous Driving: Advantages and Challenges. IEEE Signal Process. Mag. 2020, 37, 98–117. [Google Scholar] [CrossRef]
- Laribi, A.; Hahn, M.; Dickmann, J.; Waldschmidt, C. Performance Investigation of Automotive SAR Imaging. In Proceedings of the 2018 IEEE MTT-S International Conference on Microwaves for Intelligent Mobility (ICMIM), Munich, Germany, 15–17 April 2018; pp. 1–4. [Google Scholar]
- Tagliaferri, D.; Rizzi, M.; Nicoli, M.; Tebaldini, S.; Russo, L.; Monti-Guarnieri, A.; Prati, C.; Spagnolini, U. Navigation-Aided Automotive SAR for High-Resolution Imaging of Driving Environments. IEEE Access 2021, 9, 35599–35615. [Google Scholar] [CrossRef]
- Wu, H.; Zwick, T. Automotive SAR for Parking Lot Detection. In Proceedings of the 2009 German Microwave Conference, Munich, Germany, 16–18 March 2009; pp. 1–8. [Google Scholar]
- Iqbal, H.; Sajjad, M.B.; Mueller, M.; Waldschmidt, C. SAR imaging in an automotive scenario. In Proceedings of the 2015 IEEE 15th Mediterranean Microwave Symposium (MMS), Lecce, Italy, 30 November 2015–2 December 2015; pp. 1–4. [Google Scholar]
- Kobayashi, T.; Yamada, H.; Sugiyama, Y.; Muramatsu, S.; Yamagchi, Y. Study on Imaging Method and Doppler Effect for Millimeter Wave Automotive SAR. In Proceedings of the 2018 International Symposium on Antennas and Propagation (ISAP), Busan, Republic of Korea, 23–26 October 2018; pp. 1–2. [Google Scholar]
- Iqbal, H.; Schartel, M.; Roos, F.; Urban, J.; Waldschmidt, C. Implementation of a SAR Demonstrator for Automotive Imaging. In Proceedings of the 2018 18th Mediterranean Microwave Symposium (MMS), Istanbul, Turkey, 31 October 2018–2 November 2018; pp. 240–243. [Google Scholar]
- Rizzi, M.; Manzoni, M.; Tebaldini, S.; Monti–Guarnieri, A.; Prati, C.; Tagliaferri, D.; Nicoli, M.; Russo, L.; Mazzucco, C.; Alfageme, S.; et al. Multi-Beam Automotive SAR Imaging in Urban Scenarios. In Proceedings of the 2022 IEEE Radar Conference (RadarConf22), New York City, NY, USA, 21–25 March 2022. [Google Scholar]
- Wu, H.; Zwirello, L.; Li, X.; Reichardt, L.; Zwick, T. Motion compensation with one-axis gyroscope and two-axis accelerometer for automotive SAR. In Proceedings of the 2011 German Microwave Conference, Darmstadt, Germany, 14–16 March 2011; pp. 1–4. [Google Scholar]
- Harrer, F.; Pfeiffer, F.; Löffler, A.; Gisder, T.; Biebl, E. Synthetic aperture radar algorithm for a global amplitude map. In Proceedings of the 2017 14th Workshop on Positioning, Navigation and Communications (WPNC), Bremen, Germany, 25–26 October 2017; pp. 1–6. [Google Scholar]
- Farhadi, M.; Feger, R.; Fink, J.; Wagner, T.; Gonser, M.; Hasch, J.; Stelzer, A. Space-variant Phase Error Estimation and Correction for Automotive SAR. In Proceedings of the 2020 17th European Radar Conference (EuRAD), Utrecht, The Netherlands, 10–15 January 2021; pp. 310–313. [Google Scholar]
- Manzoni, M.; Rizzi, M.; Tebaldini, S.; Monti–Guarnieri, A.; Prati, C.; Tagliaferri, D.; Nicoli, M.; Russo, L.; Mazzucco, C.; Duque, S.; et al. Residual Motion Compensation in Automotive MIMO SAR Imaging. In Proceedings of the 2022 IEEE Radar Conference (RadarConf22), New York City, NY, USA, 21–25 March 2022; pp. 1–7. [Google Scholar]
- Tang, K.; Guo, X.; Liang, X.; Lin, Z. Implementation of Real-time Automotive SAR Imaging. In Proceedings of the 2020 IEEE 11th Sensor Array and Multichannel Signal Processing Workshop (SAM), Hangzhou, China, 8–11 June 2020. [Google Scholar]
- Fembacher, F.; Khalid, F.B.; Balazs, G.; Nugraha, D.T.; Roger, A. Real-Time Synthetic Aperture Radar for Automotive Embedded Systems. In Proceedings of the 2018 15th European Radar Conference (EuRAD), Madrid, Spain, 26–28 September 2018; pp. 517–520. [Google Scholar]
- Zhao, S.; Chen, J.; Yang, W.; Sun, B.; Wang, Y. Image formation method for spaceborne video SAR. In Proceedings of the 2015 IEEE 5th Asia-Pacific Conference on Synthetic Aperture Radar (APSAR), Singapore, 1–4 September 2015; pp. 148–151. [Google Scholar]
- Liang, J.; Zhang, R.; Ma, L.; Lv, Z.; Jiao, K.; Wang, D.; Tan, Z. An Efficient Image Formation Algorithm for Spaceborne Video SAR. In Proceedings of the 2018 IEEE International Geoscience and Remote Sensing Symposium, Valencia, Spain, 22–27 July 2018; pp. 3675–3678. [Google Scholar]
- Wang, W.; An, D.; Zhou, Z. Preliminary Results of Airborne Video Synthetic Aperture Radar in THz Band. In Proceedings of the 2019 6th Asia-Pacific Conference on Synthetic Aperture Radar (APSAR), Xiamen, China, 26–29 November 2019. [Google Scholar]
- Liu, C.; Wang, X.; Zhu, D. An Airborne Video SAR High-resolution Ground Playback System Based on FPGA. In Proceedings of the 2020 IEEE 11th Sensor Array and Multichannel Signal Processing Workshop (SAM), Hangzhou, China, 8–11 June 2020. [Google Scholar]
- Liu, T.; Xu, G.; Zhang, B. A Video SAR Imaging Algorithm for Micro Millimeter-Wave Radar. In Proceedings of the 2021 IEEE 4th International Conference on Electronic Information and Communication Technology (ICEICT), Xi’an, China, 18–20 August 2021; pp. 410–414. [Google Scholar]
- Song, X.; Yu, W. Derivation and application of stripmap Video SAR parameter relations. J. Univ. Chin. Acad. Sci. 2016, 33, 121–127. [Google Scholar]
- Tian, X.; Liu, J.; Mallick, M.; Huang, K. Simultaneous Detection and Tracking of Moving-Target Shadows in ViSAR Imagery. IEEE Trans. Geosci. Remote Sens. 2020, 59, 1182–1199. [Google Scholar] [CrossRef]
- Zhong, C.; Ding, J.; Zhang, Y. Video SAR Moving Target Tracking Using Joint Kernelized Correlation Filter. IEEE J. Sel. Top. Appl. Earth Observat. Remote Sens. 2022, 15, 1481–1493. [Google Scholar] [CrossRef]
- Miller, J.; Bishop, E.; Doerry, A. An application of backprojection for video SAR image formation exploiting a subaperature circular shift register. Proc. SPIE 2013, 8746, 874609. [Google Scholar]
- Bishop, E.; Linnehan, R.; Doerry, A. Video-SAR using higher order Taylor terms for differential range. In Proceedings of the 2016 IEEE Radar Conference (RadarConf), Philadelphia, PA, USA, 2–6 May 2016; pp. 1–4. [Google Scholar]
- Song, X.; Yu, W. Processing video-SAR data with the fast backprojection method. IEEE Trans. Aerosp. Electron. Syst. 2016, 52, 2838–2848. [Google Scholar] [CrossRef]
- Li, H.; Li, j.; Hou, Y.; Zhang, L.; Xing, M.; Bao, Z. Synthetic aperture radar processing using a novel implementation of fast factorized back-projection. In Proceedings of the IET International Radar Conference 2013, Xi’an, China, 14–16 April 2013; pp. 1–6. [Google Scholar]
- Farhadi, M.; Feger, R.; Fink, J.; Gonser, M.; Hasch, J.; Stelzer, A. Adaption of Fast Factorized Back-Projection to Automotive SAR Applications. In Proceedings of the 2019 16th European Radar Conference (EuRAD), Paris, France, 2–4 October 2019; pp. 261–264. [Google Scholar]
- Zuo, F.; Min, R.; Pi, Y.; Li, J.; Hu, R. Improved Method of Video Synthetic Aperture Radar Imaging Algorithm. IEEE Geosci. Remote Sens. Lett. 2019, 16, 897–901. [Google Scholar] [CrossRef]
- Gao, A.; Sun, B.; Li, J.; Li, C. A Parameter-Adjusting Autoregistration Imaging Algorithm for Video Synthetic Aperture Radar. IEEE Trans. Geosci. Remote Sens. 2022, 60, 5215414. [Google Scholar] [CrossRef]
- Gorham, L.A.; Rigling, B.D. Scene size limits for polar format algorithm. IEEE Trans. Aerosp. Electron. Syst. 2016, 52, 73–84. [Google Scholar] [CrossRef]
- Sun, G.; Liu, Y.; Xing, M.; Wang, S.; Guo, L.; Yang, J. A Real-Time Imaging Algorithm Based on Sub-Aperture CS-Dechirp for GF3-SAR Data. Sensors 2018, 18, 2562–2577. [Google Scholar] [CrossRef] [PubMed] [Green Version]
- Zhou, F.; Yang, J.; Sun, G.; Zhang, J. A Real-Time Imaging Processing Method Based on Modified RMA with Sub-Aperture Images Fusion for Spaceborne Spotlight SAR. In Proceedings of the 2018 IEEE International Geoscience and Remote Sensing Symposium, Waikoloa, HI, USA, 26 September 2020–2 October 2020; pp. 1905–1908. [Google Scholar]
- Cai, Y.; Zhang, X.; Jiang, J. Echo modeling and signal analysis of frequency modulated continuous wave continuous wave synthetic aperture radar. Chin. J. Radio Sci. 2015, 30, 1157–1163. [Google Scholar]
- Kang, Y.; Jung, D.; Park, S. Validity of Stop-and-Go Approximation in High-Resolution Ku-band FMCW SAR with High-Velocity Platform. In Proceedings of the 2021 7th Asia-Pacific Conference on Synthetic Aperture Radar (APSAR), Bali, Indonesia, 1–3 November 2021; pp. 1–4. [Google Scholar]
- Bao, Z.; Xing, M.; Wang, T. Radar Imaging Technology; Publishing House of Electronics Industry: Beijing, China, 2014. [Google Scholar]
- Yan, H.; Mao, X.; Zhang, J.; Zhu, D. Frame rate analysis of video synthetic aperture radar (ViSAR). In Proceedings of the 2016 International Symposium on Antennas and Propagation (ISAP), Okinawa, Japan, 24–28 October 2016; pp. 446–447. [Google Scholar]
- Wang, B.; Hu, Z.; Guan, W.; Liu, Q.; Guo, J. Study on the echo signal model and R-D imaging algorithm for FMCW SAR. In Proceedings of the IET International Radar Conference 2015, Hangzhou, China, 14–16 October 2015; pp. 1–6. [Google Scholar]
- Li, X.; Liu, G.; Ni, J. Autofocusing of ISAR images based on entropy minimization. IEEE Trans. Aerosp. Electron. Syst. 1999, 35, 1240–1252. [Google Scholar] [CrossRef]
Figure 1.
Automotive SAR geometric model.

Figure 2.
Time-frequency characteristics of transmitted/received signals.

Figure 3.
The phase error with range history simplification.

Figure 4.
Schematic diagram of space-variant range curvature. (a) The phase error of space-variant curvature term; (b) Correction range curvature by an approximate method.
Figure 4.
Schematic diagram of space-variant range curvature. (a) The phase error of space-variant curvature term; (b) Correction range curvature by an approximate method.

Figure 5.
Implementation principle of automotive ViSAR with overlap.

Figure 6.
Instantaneous Doppler frequency of a single-point target. (a) Coherent accumulation angle of sub-aperture; (b) Instantaneous Doppler bandwidth of sub-aperture.
Figure 6.
Instantaneous Doppler frequency of a single-point target. (a) Coherent accumulation angle of sub-aperture; (b) Instantaneous Doppler bandwidth of sub-aperture.

Figure 7.
Schematic diagram of sub-aperture data stitching.

Figure 8.
Flowchart of the proposed method.

Figure 9.
The ground scene for simulation.

Figure 10.
ViSAR simulation result. (a) First frame image; (b) Second frame image; (c) Third frame image; (d) Fourth frame image; (e) Fifth frame image; (f) Sixth frame image.
Figure 10.
ViSAR simulation result. (a) First frame image; (b) Second frame image; (c) Third frame image; (d) Fourth frame image; (e) Fifth frame image; (f) Sixth frame image.

Figure 11.
Contour map of spectral fusion results for PT1. (a) Single sub-aperture fusion; (b) Two sub-aperture fusion; (c) Three sub-aperture fusion.
Figure 11.
Contour map of spectral fusion results for PT1. (a) Single sub-aperture fusion; (b) Two sub-aperture fusion; (c) Three sub-aperture fusion.

Figure 12.
Comparative results of targets PT3, PT4, and PT5. (a) The traditional RDA; (b) The proposed method with segmented RCMC; (c) FFBPA.
Figure 12.
Comparative results of targets PT3, PT4, and PT5. (a) The traditional RDA; (b) The proposed method with segmented RCMC; (c) FFBPA.

Figure 13.
Experimental system of automotive SAR.

Figure 14.
Camera image of the experimental scene.

Figure 15.
ViSAR imaging result of actual data. (a) First frame image; (b) Second frame image; (c) Third frame image; (d) Fourth frame image; (e) Fifth frame image; (f) Sixth frame image.
Figure 15.
ViSAR imaging result of actual data. (a) First frame image; (b) Second frame image; (c) Third frame image; (d) Fourth frame image; (e) Fifth frame image; (f) Sixth frame image.

Figure 16.
Comparative results of actual data. (a) The traditional RDA; (b) The proposed method with segmented RCMC; (c) FFBPA.
Figure 16.
Comparative results of actual data. (a) The traditional RDA; (b) The proposed method with segmented RCMC; (c) FFBPA.

Figure 17.
Schematic diagram of range cell migration.


Table 1.
Automotive SAR parameters.
| Parameter | |||||
|---|---|---|---|---|---|
| value | 1~20 m/s | 77 Ghz | 3 GHZ | 51.2 μs | −4°–4° |
Table 2.
Simulation parameter.
| Parameter | Value |
|---|---|
| Carrier Frequency | 77 GHz |
| Sampling Frequency | 10 MHz |
| Frequency Sweep Period | 51.2 μs |
| Bandwidth | 3600 MHz |
| Speed | 10 m/s |
| Reference slant range | 20 m |
| Height | 1.5 m |
Table 3.
Image quality parameters.
| Method | Target | IRW (cm) | PSLR (dB) | ISLR (dB) |
|---|---|---|---|---|
| Traditional RDA | PT3 | 3.86 | −10.35 | −7.98 |
| PT4 | 3.66 | −10.34 | −7.93 | |
| PT5 | 3.70 | −10.33 | −8.03 | |
| Proposed | PT3 | 3.19 | −13.21 | −10.37 |
| PT4 | 3.25 | −13.24 | −10.36 | |
| PT5 | 3.19 | −13.23 | −10.33 | |
| FFBPA | PT3 | 3.19 | −13.34 | −10.32 |
| PT4 | 3.19 | −13.24 | −10.29 | |
| PT5 | 3.31 | −13.27 | −10.34 |
Table 4.
Computational load analysis.
| Size of Sub-Aperture | 64 | 128 | 256 | 512 | 1024 |
|---|---|---|---|---|---|
| FFBPA/Proposed | 6.088 | 8.244 | 12.543 | 17.727 | 25.013 |
| RMA/Proposed | 2.863 | 3.019 | 3.904 | 4.689 | 6.675 |
Disclaimer/Publisher’s Note: The statements, opinions and data contained in all publications are solely those of the individual author(s) and contributor(s) and not of MDPI and/or the editor(s). MDPI and/or the editor(s) disclaim responsibility for any injury to people or property resulting from any ideas, methods, instructions or products referred to in the content. |
© 2023 by the authors. Licensee MDPI, Basel, Switzerland. This article is an open access article distributed under the terms and conditions of the Creative Commons Attribution (CC BY) license (https://creativecommons.org/licenses/by/4.0/).
Share and Cite
MDPI and ACS Style
Guo, P.; Wu, F.; Tang, S.; Jiang, C.; Liu, C. Implementation Method of Automotive Video SAR (ViSAR) Based on Sub-Aperture Spectrum Fusion. Remote Sens. 2023, 15, 476. https://0-doi-org.brum.beds.ac.uk/10.3390/rs15020476
AMA Style
Guo P, Wu F, Tang S, Jiang C, Liu C. Implementation Method of Automotive Video SAR (ViSAR) Based on Sub-Aperture Spectrum Fusion. Remote Sensing. 2023; 15(2):476. https://0-doi-org.brum.beds.ac.uk/10.3390/rs15020476
Chicago/Turabian StyleGuo, Ping, Fuen Wu, Shiyang Tang, Chenghao Jiang, and Changjie Liu. 2023. "Implementation Method of Automotive Video SAR (ViSAR) Based on Sub-Aperture Spectrum Fusion" Remote Sensing 15, no. 2: 476. https://0-doi-org.brum.beds.ac.uk/10.3390/rs15020476
Note that from the first issue of 2016, this journal uses article numbers instead of page numbers. See further details here.