
Evaluation of the High-Resolution MuSyQ LAI Product over Heterogeneous Land Surfaces
by
 , and
, and
Dandan Li
1,2,
Yajun Huang
1,2,
Yao Xiao
1,2,
Min He
3,
Jianguang Wen
4,
Yuanqing Li
1,2 and
Mingguo Ma
1,2,* 1
Chongqing Jinfo Mountain Karst Ecosystem National Observation and Research Station, School of Geographical Sciences, Southwest University, Chongqing 400715, China
2
Chongqing Engineering Research Center for Remote Sensing Big Data Application, School of Geographical Sciences, Southwest University, Chongqing 400715, China
3
State Key Laboratory of Resources and Environmental Information System, Institute of Geographic Sciences and Natural Resources Research, Chinese Academy of Sciences, China University of Chinese Academy of Sciences, Beijing 100049, China
4
State Key Laboratory of Remote Sensing Science, Aerospace Information Research Institute, Chinese Academy of Sciences, Beijing 100101, China
*
Author to whom correspondence should be addressed.
Remote Sens. 2023, 15(5), 1238; https://0-doi-org.brum.beds.ac.uk/10.3390/rs15051238
Submission received: 31 December 2022
/
Revised: 18 February 2023
/
Accepted: 21 February 2023
/
Published: 23 February 2023
(This article belongs to the Special Issue Quantitative Remote Sensing Product and Validation Technology)
Abstract
:In recent years, the retrieval and validation of remotely-sensed leaf area index (LAI) products over complex land surfaces have received much attention due to the high-precision land surface model simulations and applications in global climate change. However, most of these related researches mainly focus on coarse resolution products. This is because few products have been specifically designed for solving the problems derived from complex land surfaces in mountain areas until now. MuSyQ LAI is a new product derived from Gaofen-1 (GF-1) satellite data. This product is characterized with a temporal resolution of 10 days and a spatial resolution of 16 m. As is well known, high-resolution products have less uncertainties because of the homogeneities of sub-pixel. Therefore, to evaluate the precision and uncertainty of MuSyQ LAI, an up-scaling strategy was employed here to validate MuSyQ LAI for three mountain regions in Southwest China. The validation strategy can be divided into three parts. First, a regression model was built by in situ LAI measured by LAI-2200 and the normalized difference vegetation index (NDVI) from unmanned aerial vehicle (UAV) images to obtain a 0.5 m resolution LAI map. Second, an up-scaled LAI map with a spatial resolution consistent with MuSyQ LAI was calculated by the pixel-averaging method from the UAV-based LAI map. Third, the MuSyQ LAI was validated by the up-scaled UAV-based LAI in pixel scale. Simultaneously, the sources of uncertainty were analyzed and compared from the view of data source, retrieval model, and scale effects. The results suggested that MuSyQ LAI in the study areas are significantly underestimated by 53.69% due to the complex terrain and heterogeneous land cover. There are three main reasons for the underestimation. The differences between GF-1 reflectance and UAV-based reflectance employed to estimate LAI are the largest factors for the validation results, even accounting for 61.47% of the total bias. Subsequently, the scale effects led to about 28.44% bias. Last but not least, the models employed to retrieve LAI contributed merely 10.09% uncertainties to the total bias. In conclusion, the accuracy of MuSyQ LAI still has a large space to be improved from the view of reflectance over complex terrain. This study is quite important for applications of MuSyQ LAI products and also provides a reference for the improvement and application of other high-resolution remotely sensed LAI products.
1. Introduction
The leaf area index (LAI) is defined as one half of the total area of all leaves per unit area of vegetation [1]. As a crucial indicator to quantify the total leaf area for vegetations, LAI plays an important role in many land processes such as photosynthesis, respiration, and precipitation retention [2,3]. Therefore, LAI has been listed as one of the most important terrestrial parameters for climate change monitoring by the global climate observing system (GCOS) [4]. The measurement of LAI mainly includes field collection, remotely sensed retrieval, and land surface modeling. In particular, satellite platform provides a powerful means to obtain global LAI products. As is well known, the popular products include moderate resolution imaging spectroradiometer (MODIS) LAI [5], global land surface satellite (GLASS) LAI [6], carbon cycle and change in land observational products from an ensemble of satellites (CYCLOPES) LAI [7], multi-angle imaging spectroradiometer (MISR) LAI [8] and visible infrared imaging radiometer suite (VIIRS) LAI [9]. These LAI products have been widely used in ecohydrological processes and vegetation monitoring due to their high spatial coverage and the length of observation history [10,11,12]. However, these products with resolution in range of 250–1000 m can introduce many more uncertainties and errors especially over such regions with complex terrain [13,14,15,16,17]. Yang et al. compared and analyzed the precision of three products of GEOV1, GLASS, and MODIS LAI over the mountain areas located in Southwestern China. The results show a worse spatio-temporal continuity in mountainous area than over flat area. Furthermore, nearly all products can hardly capture the details of the altitudinal distribution of biome types [16]. Jin et al. found that the percentage of successful retrievals for MODIS LAI and GLASS LAI is vulnerable to topographic indices especially relief amplitude over Southwestern China [15]. Additionally, the two products can barely capture seasonal dynamics of crop, especially in spring, over heterogeneously hilly regions. However, these validation studies are mainly for coarse-resolution LAI products. As is well known, the fragmentation of mountain landscapes is typically severe due to the presence of patchy vegetation ecosystems that are shaped by the underlying climatic and topographic gradients [15]. The coarse-resolution LAI products exhibit limited capacity in characterizing the spatial variability of vegetation in mountainous regions. High-resolution LAI products possess the superior capability in mountainous areas with severe landscape fragmentation.
Here, high spatial-resolution (HSR) LAI products have been developed to address this issue to some degree [18]. Gaofen-1 (GF-1) is the first HSR satellite platform of the China high-resolution Earth observation system, which carries four 16-m-resolution multispectral cameras with a global revisit period of less than 4 days due to large-format wide view [19]. MuSyQ LAI, with a spatial-temporal resolution of 16 m/10-day in China from 2018 to 2020 (version 01), was produced by GF-1 satellite images based on the three-dimensional stochastic radiative transfer (3D-SRT) model [20]. This LAI product can be employed to many specific land processes that need high spatial resolution data. Therefore, it is quite necessary to evaluate the quality of these LAI products. Though a series of LAI validation studies have been conducted for various land cover types in different continental regions [21,22,23], few studies validated the product precision over complex terrain and discussed the source of uncertainties in detail. Besides, few researches compared the differences between direct validation and cross-validation [24]. As is well known, different validation strategies may lead to varying levels of accuracy.
At present, only one work about the validation of MuSyQ LAI products has been carried out by the product manufacturer [20]. This direct validation focused on crops and forests in the Shihezi region of Xinjiang, China. The results demonstrated a root mean square error (RMSE) of 0.743 and a coefficient of determination (R2) of 0.877, which shows a high precision of related land types. Nevertheless, the further validation for other vegetation types such as grasses and shrubs are required to obtain a more comprehensive assessment. Thus, more independent validation about more land covers should be made by a third party.
In this study, an up-scaling strategy was employed here to validate MuSyQ LAI for three mountain regions including Caoshang, Citrus Research Institute, and Hutou Village. To assess and analyze the scale effect and uncertainty source, the data from unmanned aerial vehicles were also collected simultaneously to upscale the in situ LAIs to validate the MuSyQ LAI. The direct validation and upscaled validation are both performed in this paper so as to receive a convincing result apart from the scale effect. Finally, this paper analyzed the uncertainty contributions from reflectance data differences, retrieval model differences, and scale effects, providing a new knowledge of MuSyQ LAI accuracy over rugged terrain.
2. Study Areas and Data
2.1. Study Area and Field Measurements
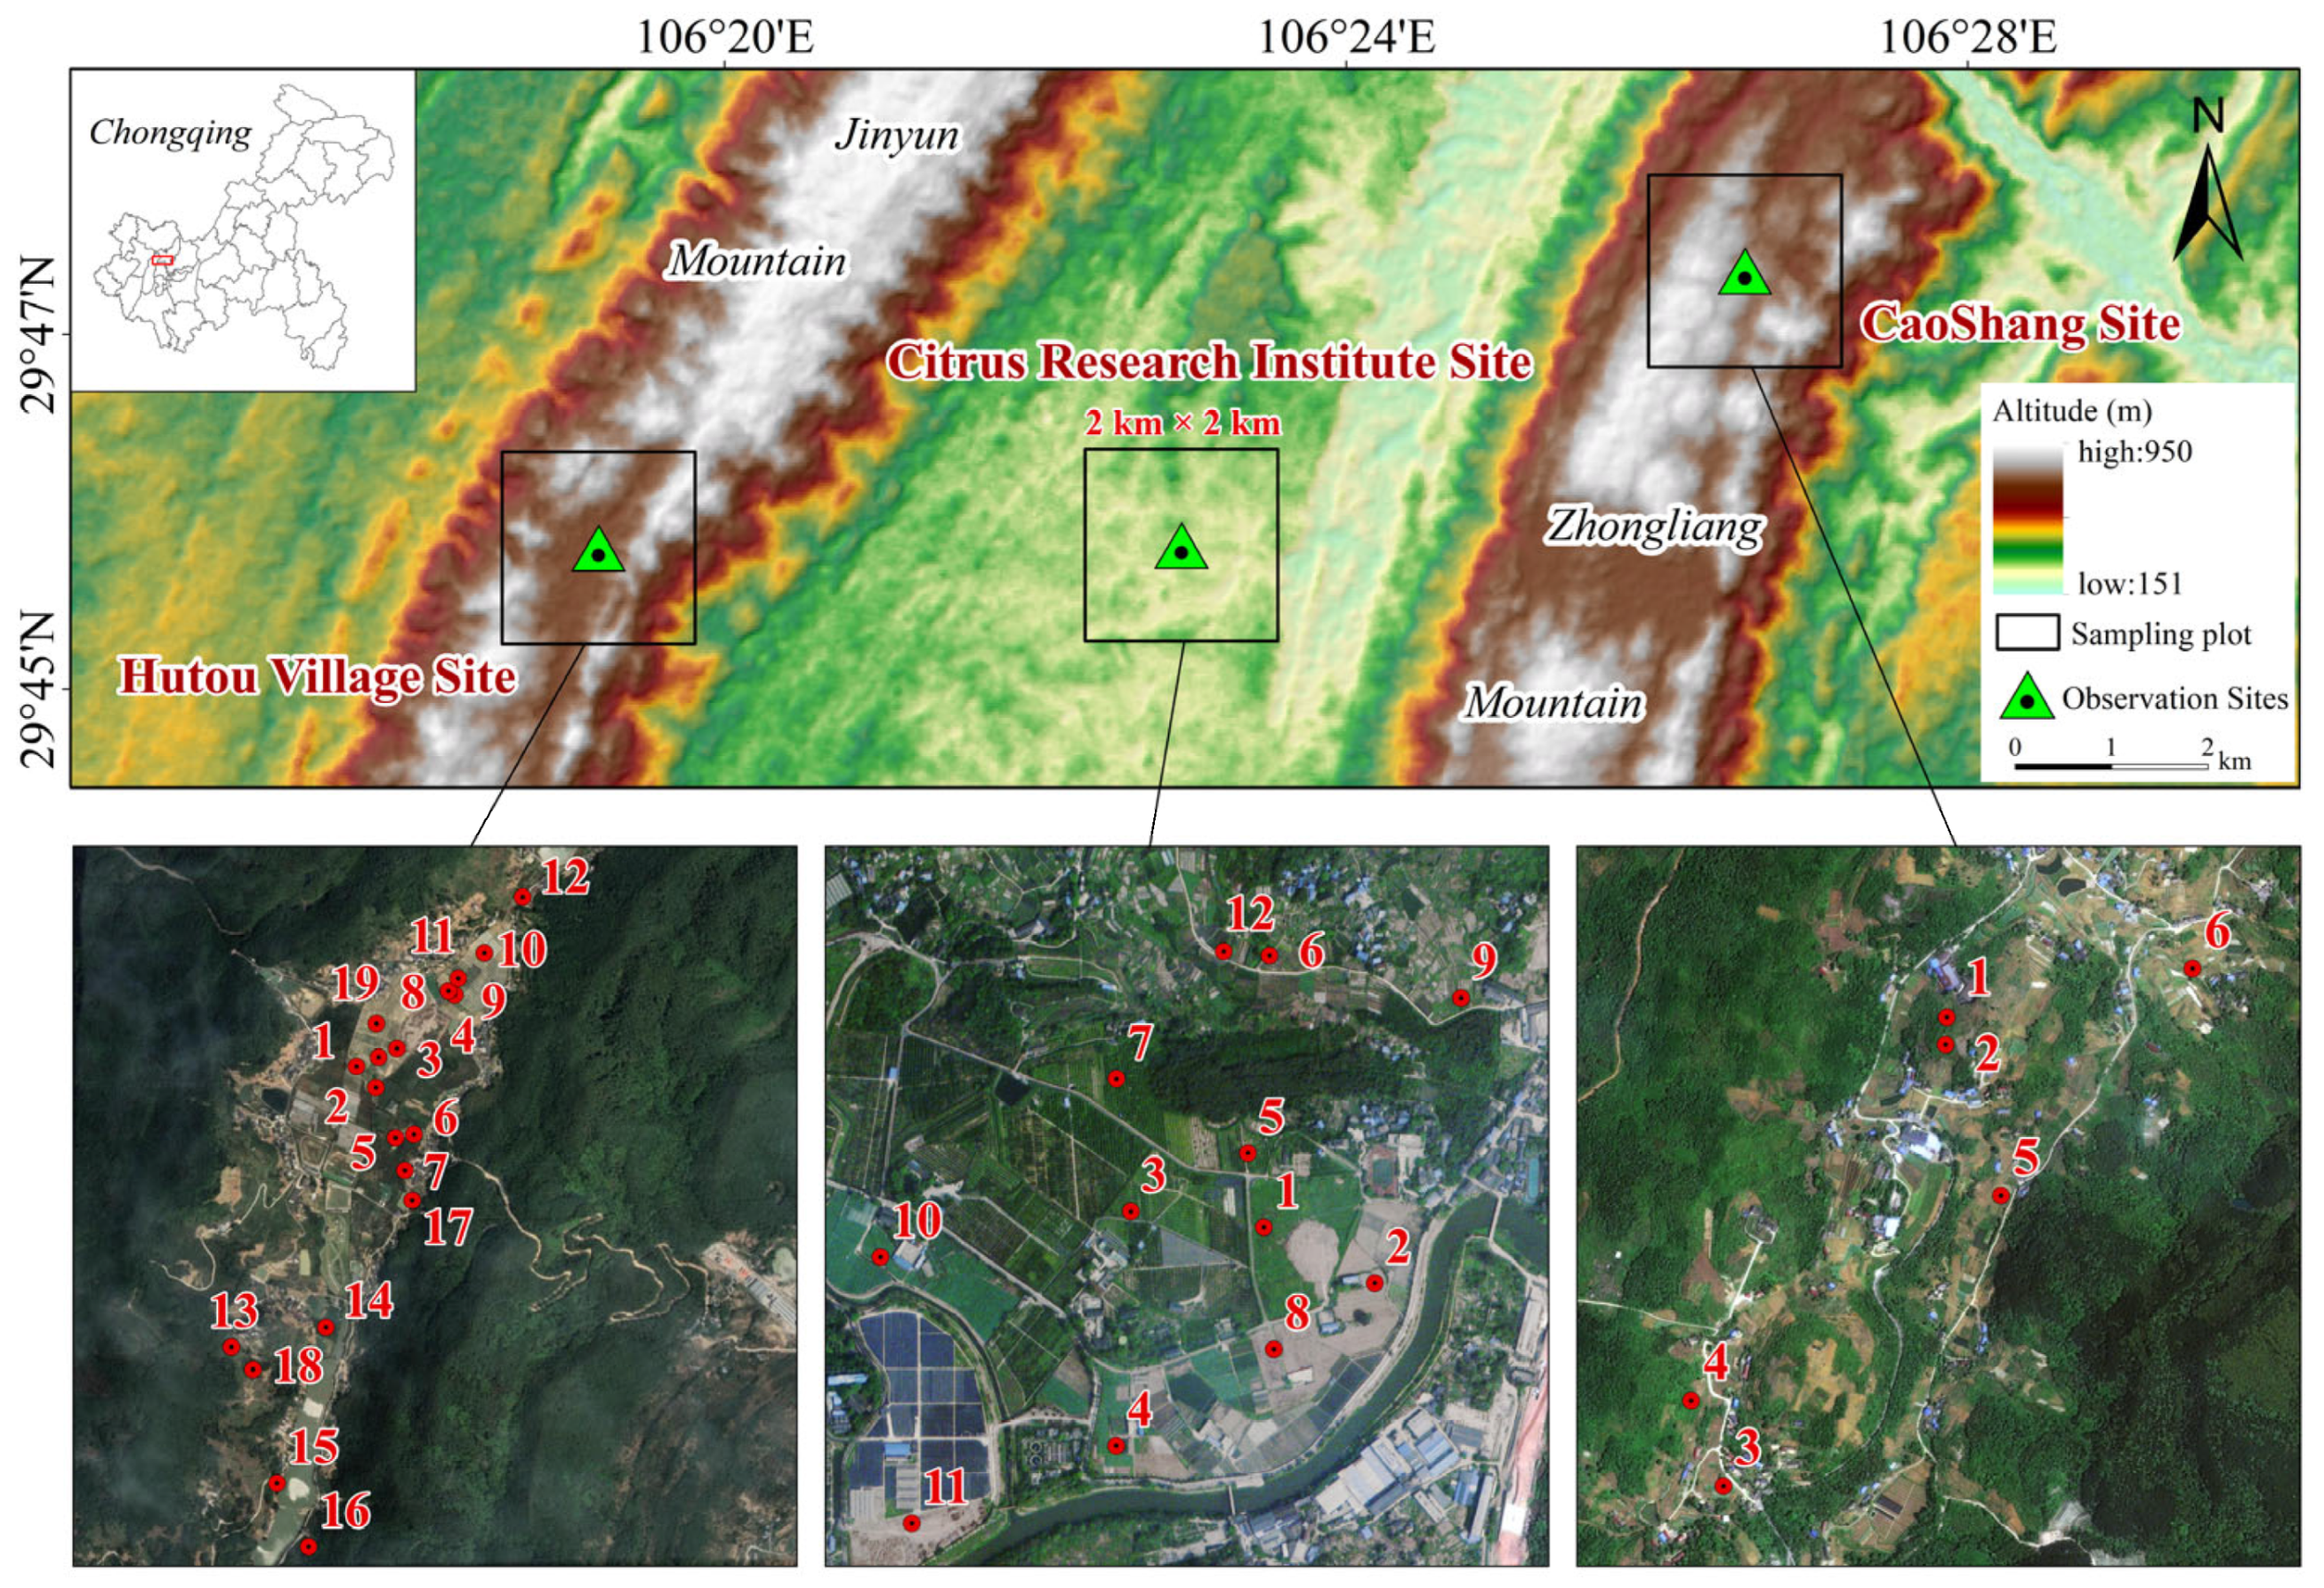
In this study, three remote sensing observation stations in Chongqing were used: Caoshang Station (29°47′14″N, 106°26′33″E), Citrus Research Institute Station (29°45′44″N, 106°22′54″E), and Hutou Village Station (29°45′45″N, 106°19′9″E). Caoshang and Hutou Village stations are located in the mountains of the paralleled ridge-valley of Eastern Sichuan with complex terrain. Land cover mainly includes forest, fragmented farmland, and villages. Yet, Citrus Research Institute Station, located in a wide and flat ridge-trough area in Eastern Sichuan, mostly consists citrus planting area and cultivated land (Figure 1).
A 2 km × 2 km sampling plot was set up at each remote sensing observation station. There were 6, 12, and 18 elementary sampling units (ESUs) of 0.5 m × 0.5 m each at the Caoshang Station, Citrus Research Institute Station, and Hutou Village Station, respectively. Four sampling measurements were performed on each ESU using the LAI-2200 canopy analyzer, and the average value was taken to represent the ESU LAI. The real-time kinematic GPS (RTK-GPS) was used to geo-locate the center of the ESU, providing an accuracy of less than 8 mm. Moreover, with each ESU as the center, the vegetation types within 2 m must be consistent to ensure that the collected data are representative and meaningful.
The LAI-2200 canopy analyzer measures effective LAI values, which can be converted to the true LAI values by taking into account the clumping index. However, the clumping index is difficult to estimate accurately in complex mountainous terrain, resulting in uncertainty in conversion. In order to avoid this uncertainty, this study used effective LAI values for verification.
2.2. High Spatial-Resolution UAV Data
The high-resolution images used in this paper were acquired by the DJI Phantom 4 Multispectral (P4M) UAV from 20 October 2020 to 23 October 2020 at an altitude of 200 m with a spatial resolution of approximately 0.1 m. The UAV was equipped with one visible and five multispectral cameras (blue, green, red, red-edge, and near-infrared), responsible for visible imaging and multispectral imaging, respectively [25]. The P4M camera was also equipped with an irradiance sensor to normalize the digital number (DN) for each band, providing an output that DJI identifies as “reflectance”, although this is not true reflectance data [26]. Then, the acquired raw UAV images were pre-processed with Pix4D software. The P4M system offers vegetation indices (VIs) and consequently obviates the necessity of obtaining reflectance data for these images. Lastly, the UAV images were resampled to 0.5 m resolution to match the size of the ESUs and orthorectified in the UTM-WGS84 projection coordinate system for this study.
2.3. MuSyQ LAI
The MuSyQ LAI product consists of 10-day maximum LAI values, with a spatial resolution of 16 m, gridded on a universal transverse mercator (UTM) projection. The MuSyQ LAI product is based on lookup tables that match red and near-infrared reflectance from the wide field of view (WFV) camera on the GF-1 satellite to seven different vegetation types (grassland, shrub, cropland, evergreen broadleaf forest, deciduous broadleaf forest, evergreen needleleaf forest, and deciduous needleleaf forest). The lookup tables were constructed using the 3D-SRT model. When the physical model-based retrieval algorithm fails, the LAI in the product comes from a time-series reconstruction algorithm [20]. The MuSyQ LAI data are available at the Science Data Bank site for free (https://www.scidb.cn/en, accessed on 1 April 2022). A slight spatial inconsistency was observed between the UAV images and the MuSyQ LAI product, which was subsequently resolved through spatial registration by using ground control points. After data pre-processing, the dataset in this study included field LAI measurement data, UAV image data at 0.5 m spatial resolution, and the MuSyQ LAI products as shown in Table 1 below.
3. Methodology
3.1. Spatial Representativeness of Field LAI Measurements
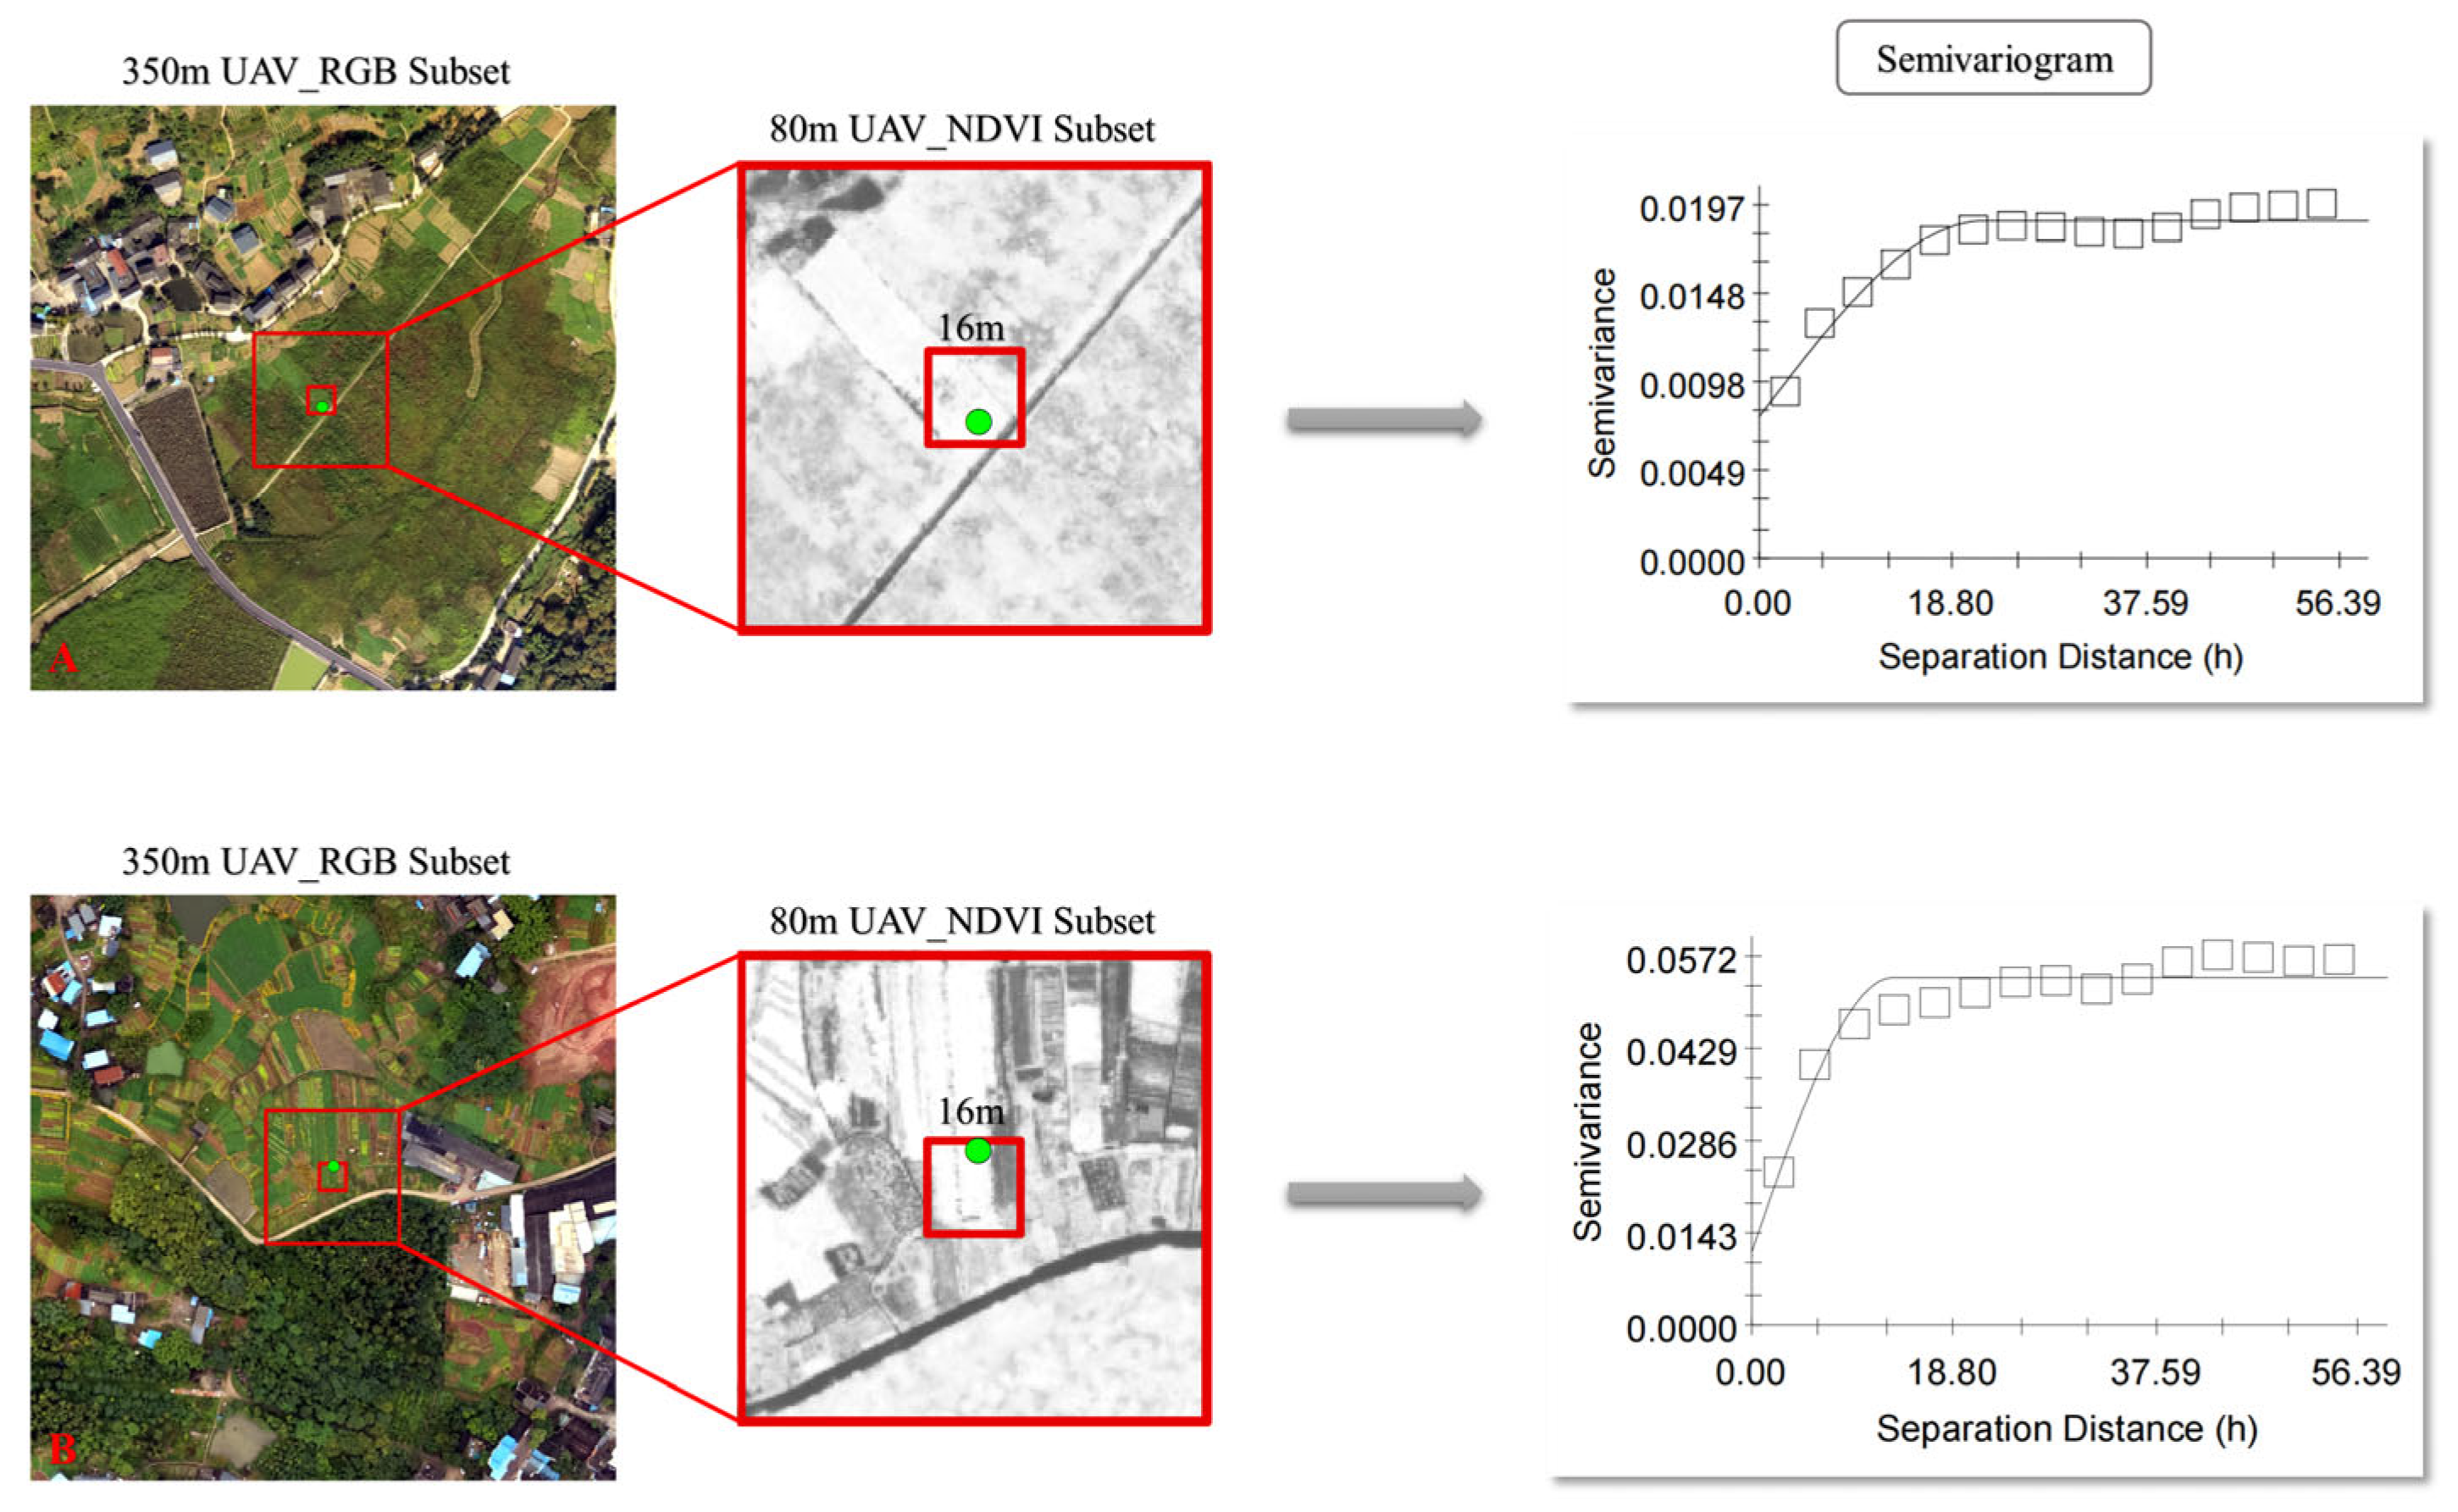
The semivariogram is a useful tool for characterizing and modeling spatial variability in geostatistical remote sensing applications [27,28]. In this study, the semivariogram is used to assess the spatial representativeness of the measurement sites. In order that the spatial variability around the measurement site can be completely encompassed at the image scale, the GF-1 pixel where the measurement site is located was used as the central pixel, and then the window was enlarged to 5 × 5 GF-1 pixels (Figure 2). The semivariograms of the high-resolution NDVI image within each window are calculated using the GS + 9.0 software. The semivariogram γ(h) is defined as follows:
where Z(x) and Z(x + h) are the NDVI values at positions x and x + h, respectively, separated by a vector h with a spatial lag in both distance and direction. A spherical model was employed to fit the calculated semivariogram and determine the model coefficients in this study. The variogram model has three important parameters: nugget effect (C0), sill (C), and range (A). C0 denotes the spatial variation that is attributable to random factors; when there is spatial autocorrelation between object attributes, the variation curve will gradually become smoother with increasing distance. A is the distance at which the variation curve first appears horizontal. C denotes the maximal spatial variation at the variation range [29]. The principles and formula for the semivariogram can be found in other reports [30,31].
The range (A) can refer to the average patch size of the landscape [32], which is a region that differs from its surroundings but is not necessarily homogeneous in its internal composition [29]. Therefore, it is not necessarily homogeneous within the range, the coefficient of sill (CS) is introduced to evaluate the degree of relative spatial heterogeneity within the window [33], as shown in
where s represents the window size, which is 5 × 5 GF-1 pixels in this study. C(s), µ(s) is the sill and mean value of the high-resolution NDVI image within the window, respectively. A larger CS(s) indicates a greater relative spatial variability within the window and a lower spatial representativeness of the measurement sites.
3.2. MuSyQ LAI Product Error Analysis
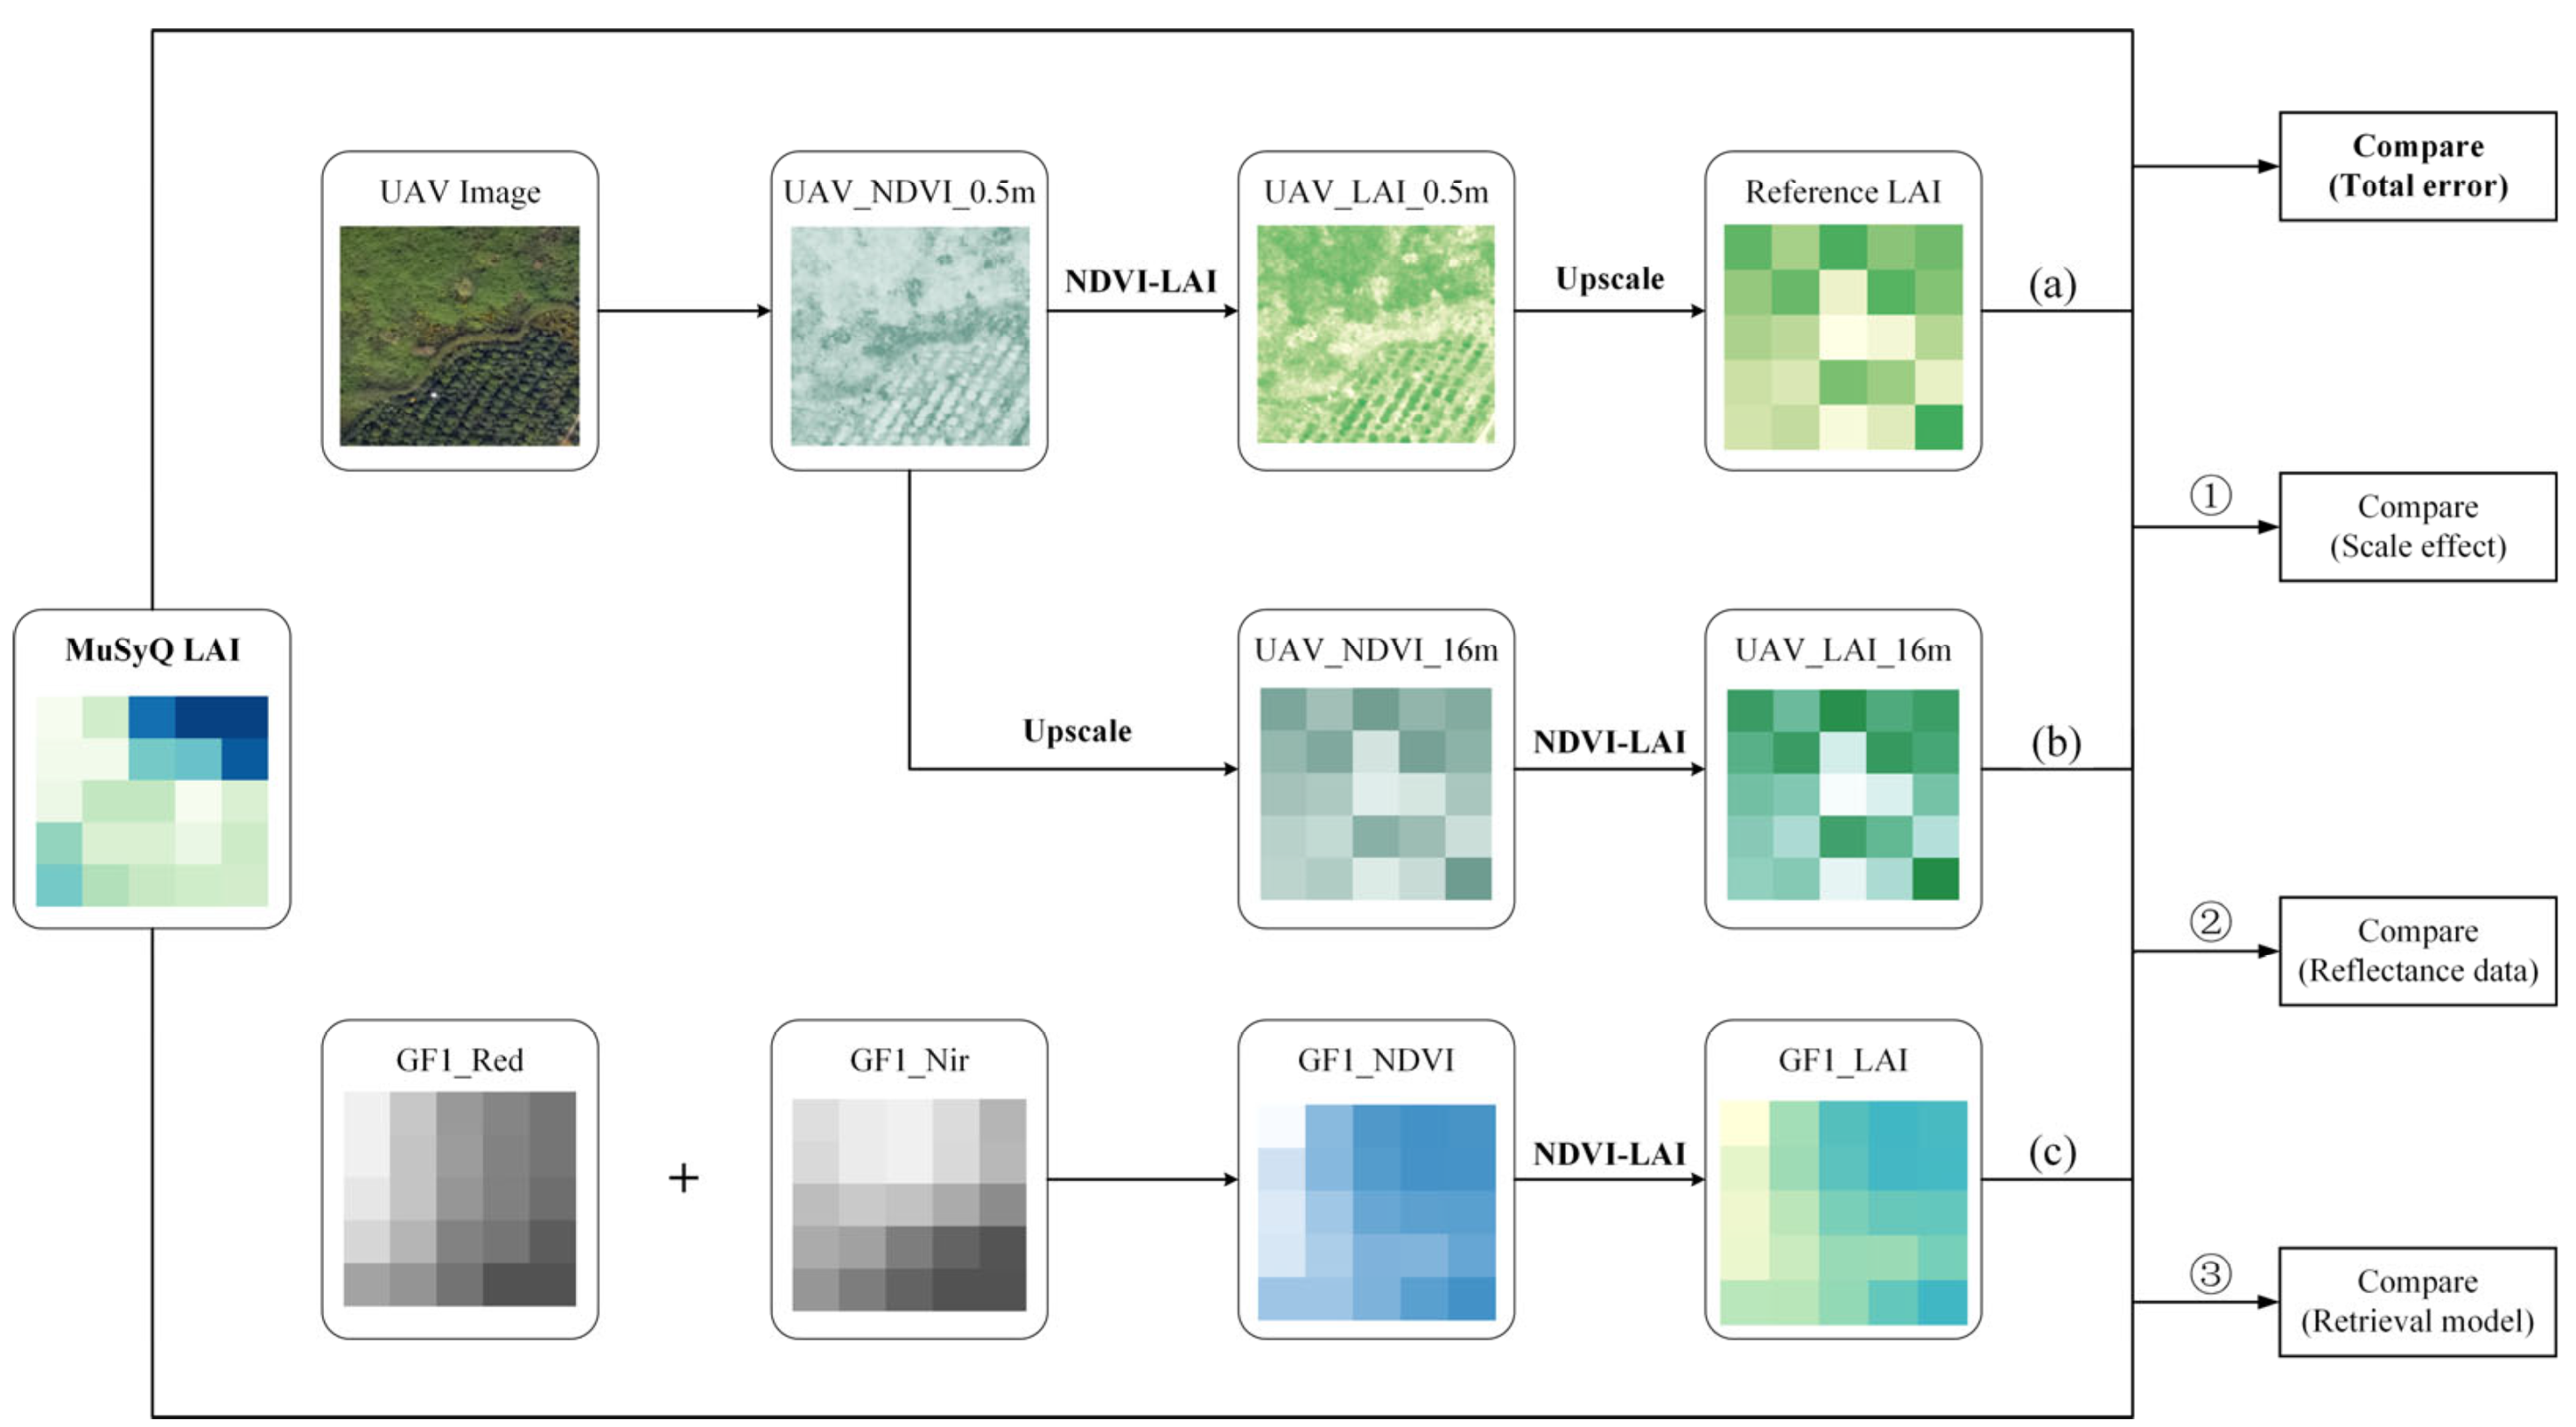
The method followed for MuSyQ LAI product validation is outlined in Figure 3. First, the NDVI-LAI model was established using field LAI measurements and UAV images to obtain the true fine-resolution LAI values. Then, these were up-scaled to a scale consistent with the MuSyQ LAI product using a simple average method. The up-scaled data are referred to as reference LAI, and these are compared with the MuSyQ LAI product to obtain the overall error of the product. Several statistical metrics, such as the bias, RMSE, and R2, were used to assess the accuracy of the MuSyQ LAI products.
There are three main inconsistencies in the production process between MuSyQ LAI products and the reference LAI data. The first is the differences in input data: the input data for the MuSyQ LAI product are the GF-1 WFV camera reflectance data product, while the reference LAI data are calculated from UAV DN image data. Differences between the GF-1 reflectance data and the UAV DN image result in diversities in the LAI data. The second inconsistency is the difference between the retrieval models: the reference LAI data are calculated using the NDVI-LAI model while the MuSyQ LAI product is generated from a look-up table based on the 3D-SRT model using the GF-1 surface reflectance and surface classification data. Differences between these two models may directly affect the results of the validation. The third inconsistency is that the MuSyQ LAI product is directly calculated from the surface reflectance at the 16 m spatial resolution, whereas the reference LAI data were generated by calculating the NDVI from UAV images and then obtaining the LAI values from the NDVI retrieval. Both data generation methods are subject to spatial scale effects, and the scale errors generated by each process are passed on to the next step [34]. The presence of scale effects makes MuSyQ LAI products differ from the reference LAI data. By comparing various data and methods, the impact of three inconsistencies on the validation results of the LAI product is examined.
Data in the MuSyQ LAI product are the maximum LAI value over a 10-day window. The GF-1 surface reflectance data used in this paper are from the GF-1 WFV reflectance product and cover the same period as the MuSyQ LAI product. Reflectance data are not directly available from the UAV products; therefore, it is not possible to directly compare the reflectance from the two sensors. The 0.5 m resolution UAV NDVI image was upscaled to a resolution of 16 m to generate UAV_NDVI_16m. While GF1_NDVI was calculated by the GF-1 surface reflectance data. The UAV_LAI_16m and GF1_LAI were retrieved by the NDVI-LAI model for this study. The differences between UAV_LAI_16m and GF1_LAI reflect the influence of the reflectance data on the validation of the LAI products.
Calculating LAI using different models and the same surface reflectance data gives the effect of model differences on the validation results. GF1_LAI was calculated from the GF-1 surface reflectance data using the NDVI-LAI model and was compared with the MuSyQ LAI product to give the influence of the retrieval model on validation.
The 0.5 m resolution UAV NDVI image and the NDVI-LAI model can be used to calculate two different low-resolution LAI datasets by using different up-scaling methods. The 0.5 m resolution NDVI image was used to obtain the 0.5 m resolution LAI based on the NDVI-LAI model, which was up-scaled to 16 m resolution to obtain the reference LAI data used for validation. Reference LAI is retrieved by the method called “retrieval before average” as mentioned at the beginning of this section, while UAV_LAI_16m is retrieved by the method called ”average before retrieval”. The difference between reference LAI and UAV_LAI_16m retrieved by two different up-scaling methods reflects the uncertainty of scale effects on the validation of the LAI products [34,35].
3.3. Estimating the Fine-Resolution LAI Relative “True” Value
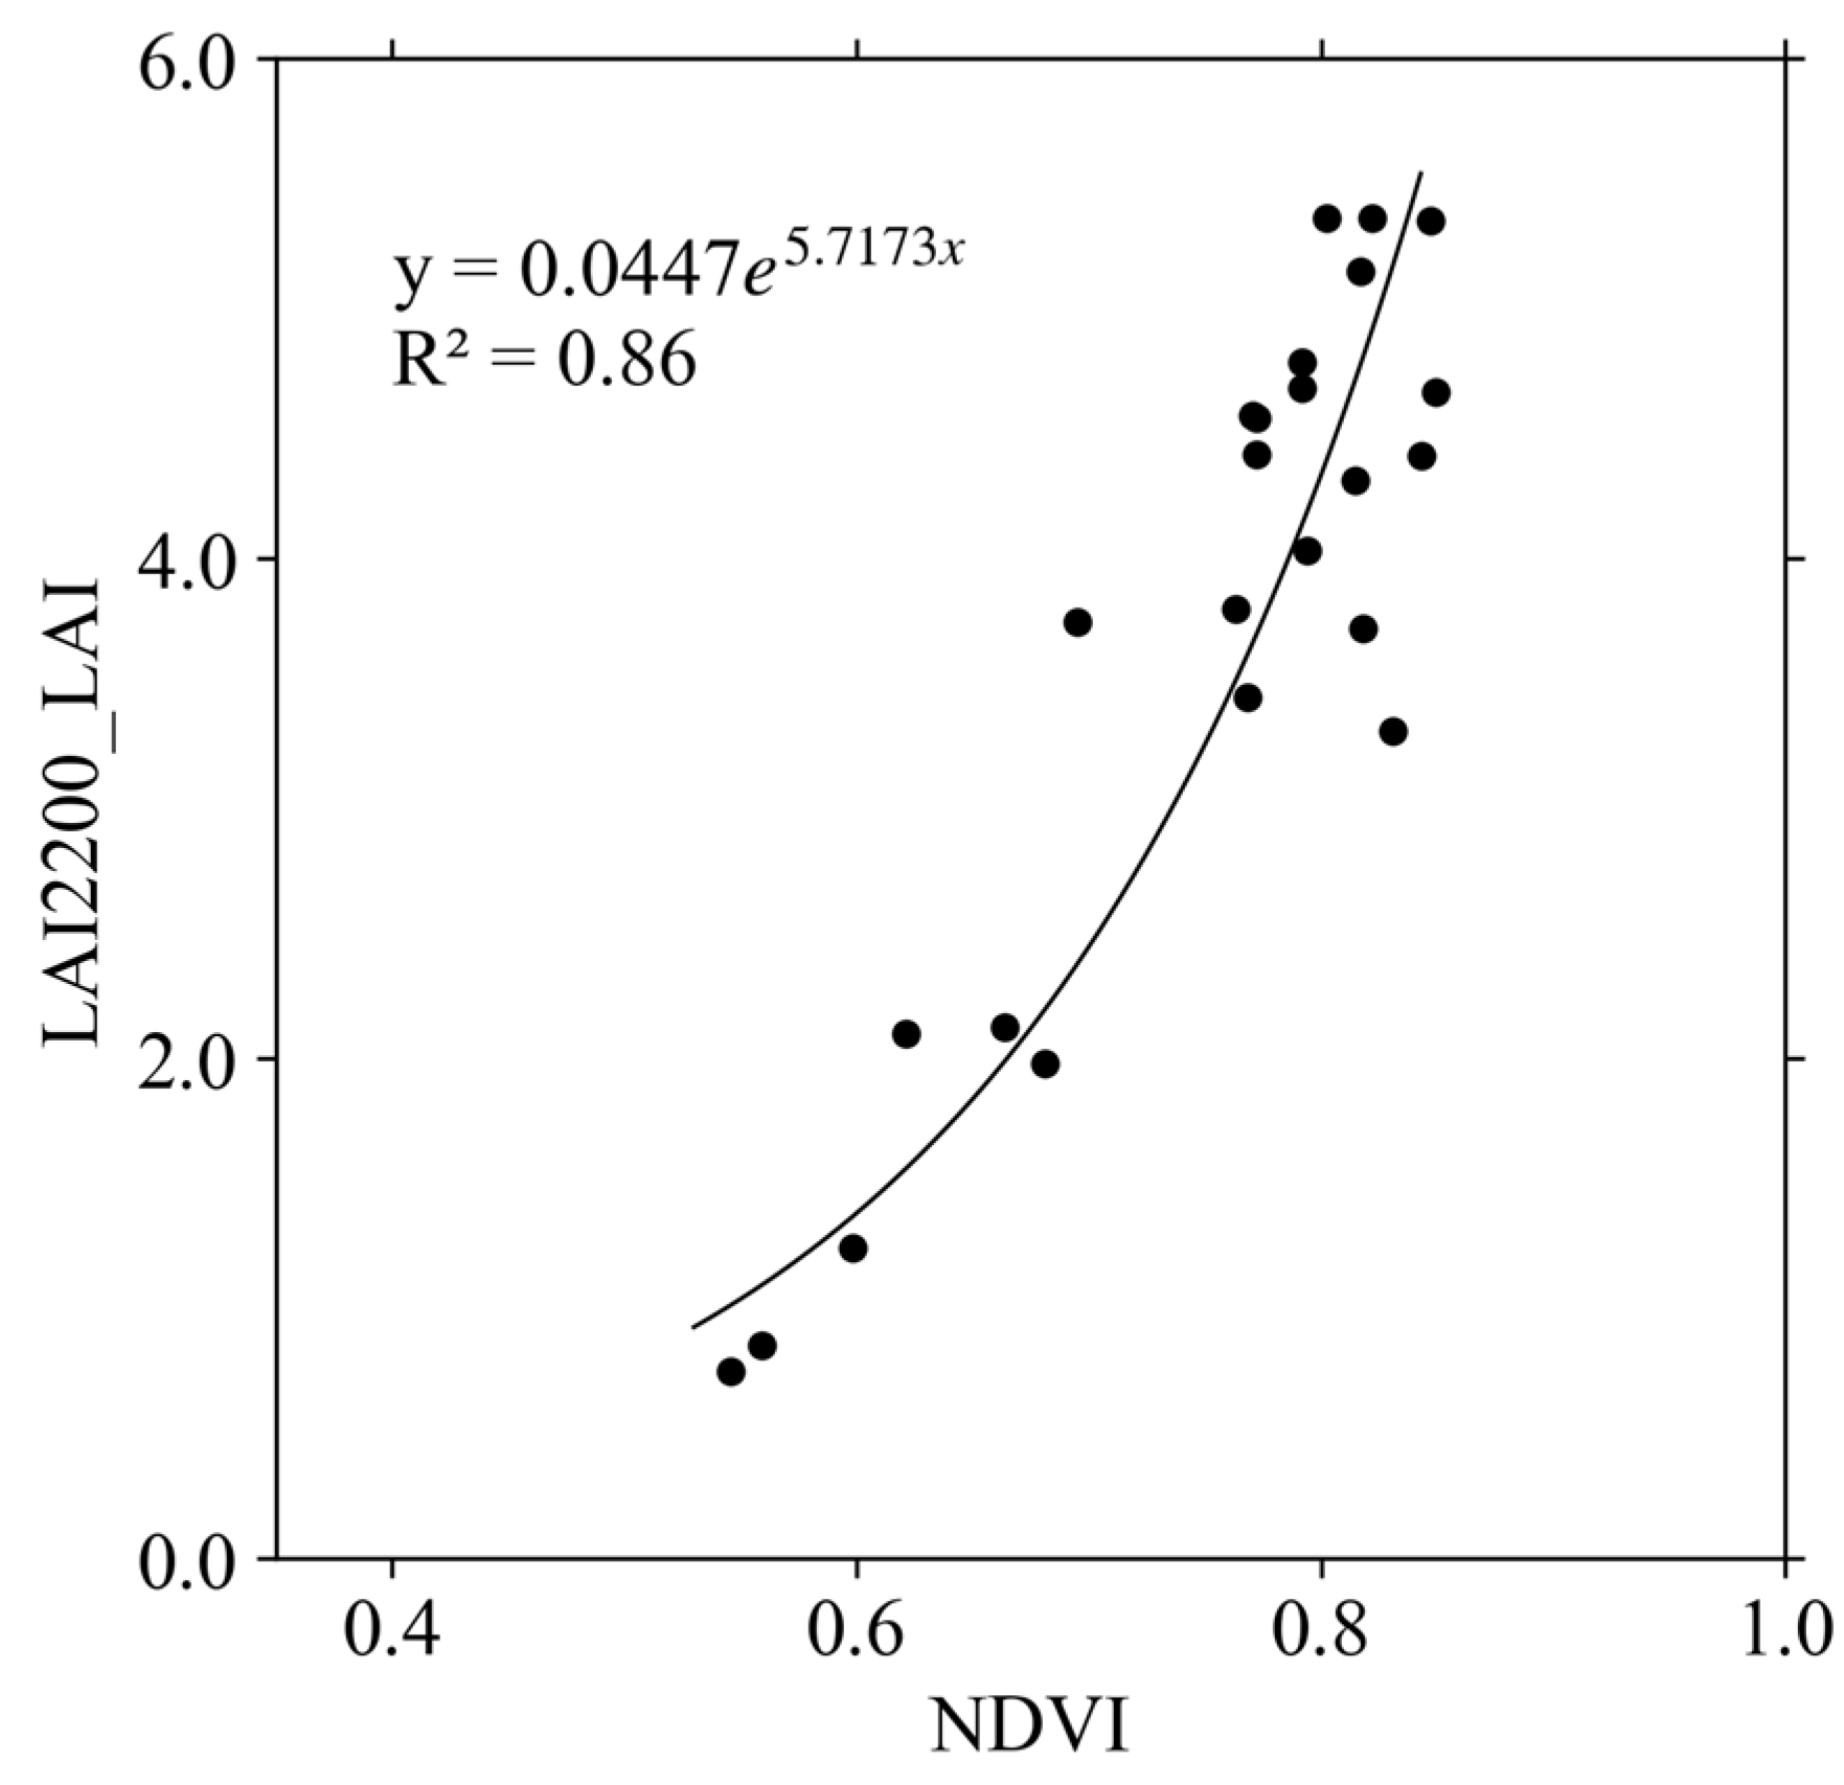
The statistical model for NDVI and LAI that was used to estimate LAI is a concise and effective estimation method, which is often used for the estimation of LAI in the field of remote sensing [36]. In this paper, 2/3 of the ESUs were randomly selected to establish an empirical regression model for LAI, with NDVI values from UAV images, and the model was tested based on the remaining 1/3 data. When the relative true values from the high spatial-resolution LAI met the threshold requirements, they were used for the next test. The fitting results for the study areas are shown in Figure 4. The exponential model was chosen to fit because it had a higher fitting accuracy than other models (e.g., linear regression model, quadratic polynomial regression model, and log-linear regression model). The equation used to fit NDVI for measured LAI was:
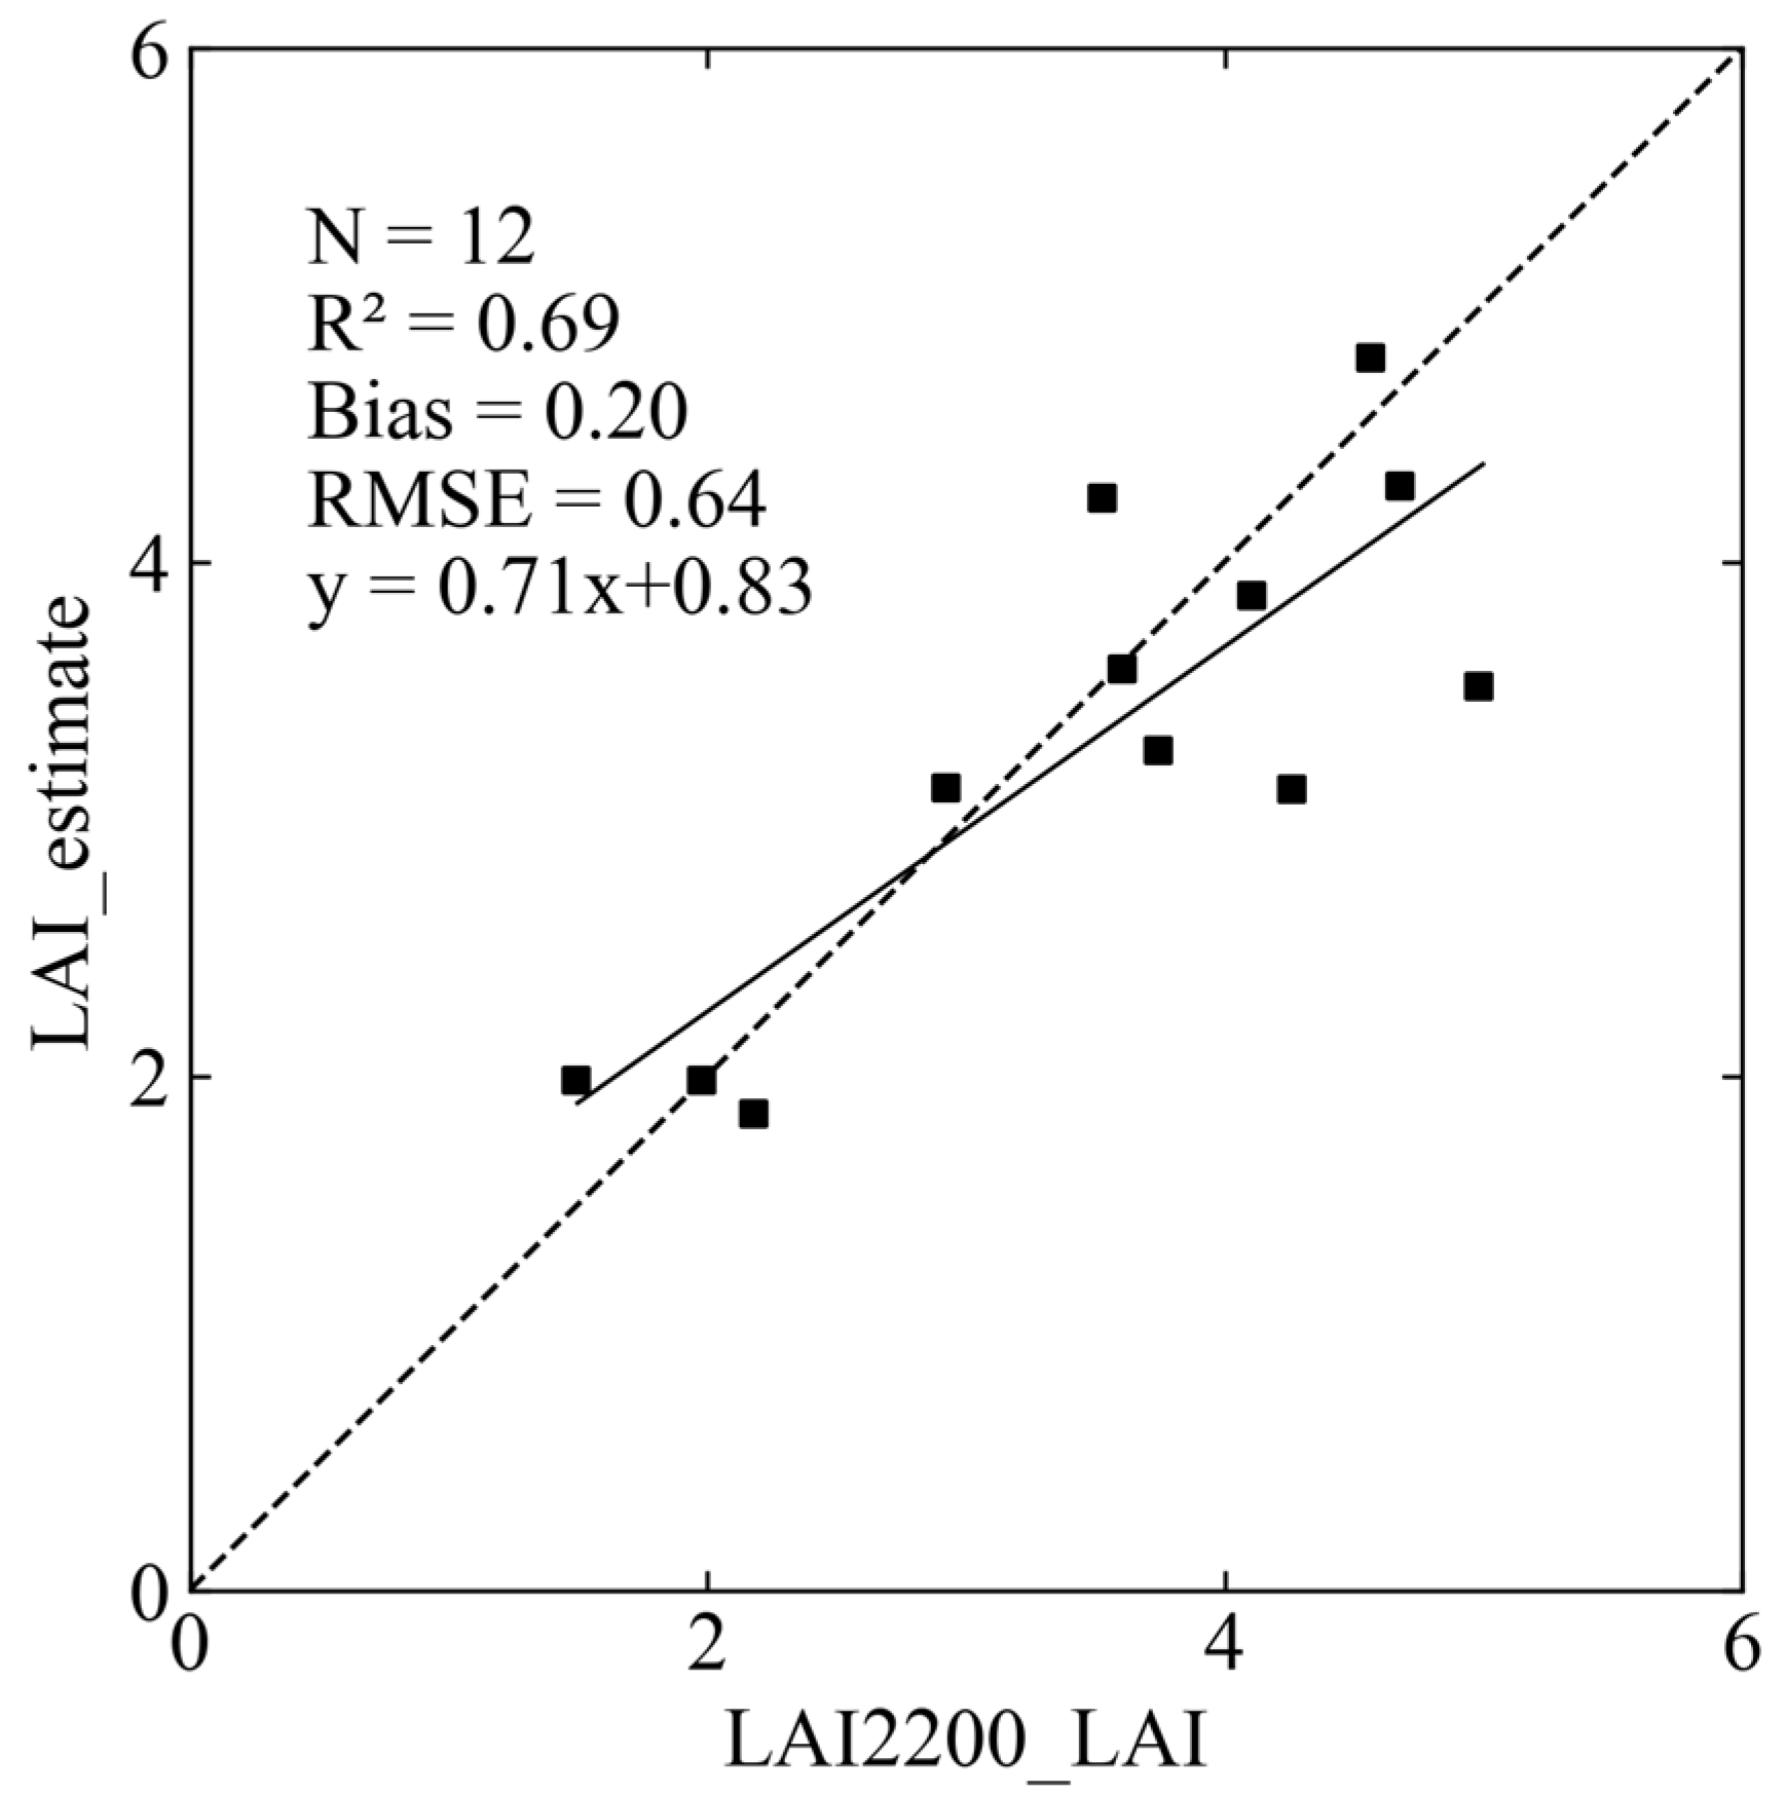
The model in Equation (2) was used to calculate LAI values from the UAV images. As shown in Figure 5, the two datasets were compared and the correlation coefficient and relative error were calculated. The average relative error in the study areas was 13.65% and the correlation coefficient between the two datasets was 0.83. This shows that the statistical analysis model provides a reasonable fit, suggesting the LAI values estimated from the UAV image could be used as reference data for the validation of the MuSyQ LAI products.
4. Results
4.1. Overall Error for MuSyQ LAI Data Products
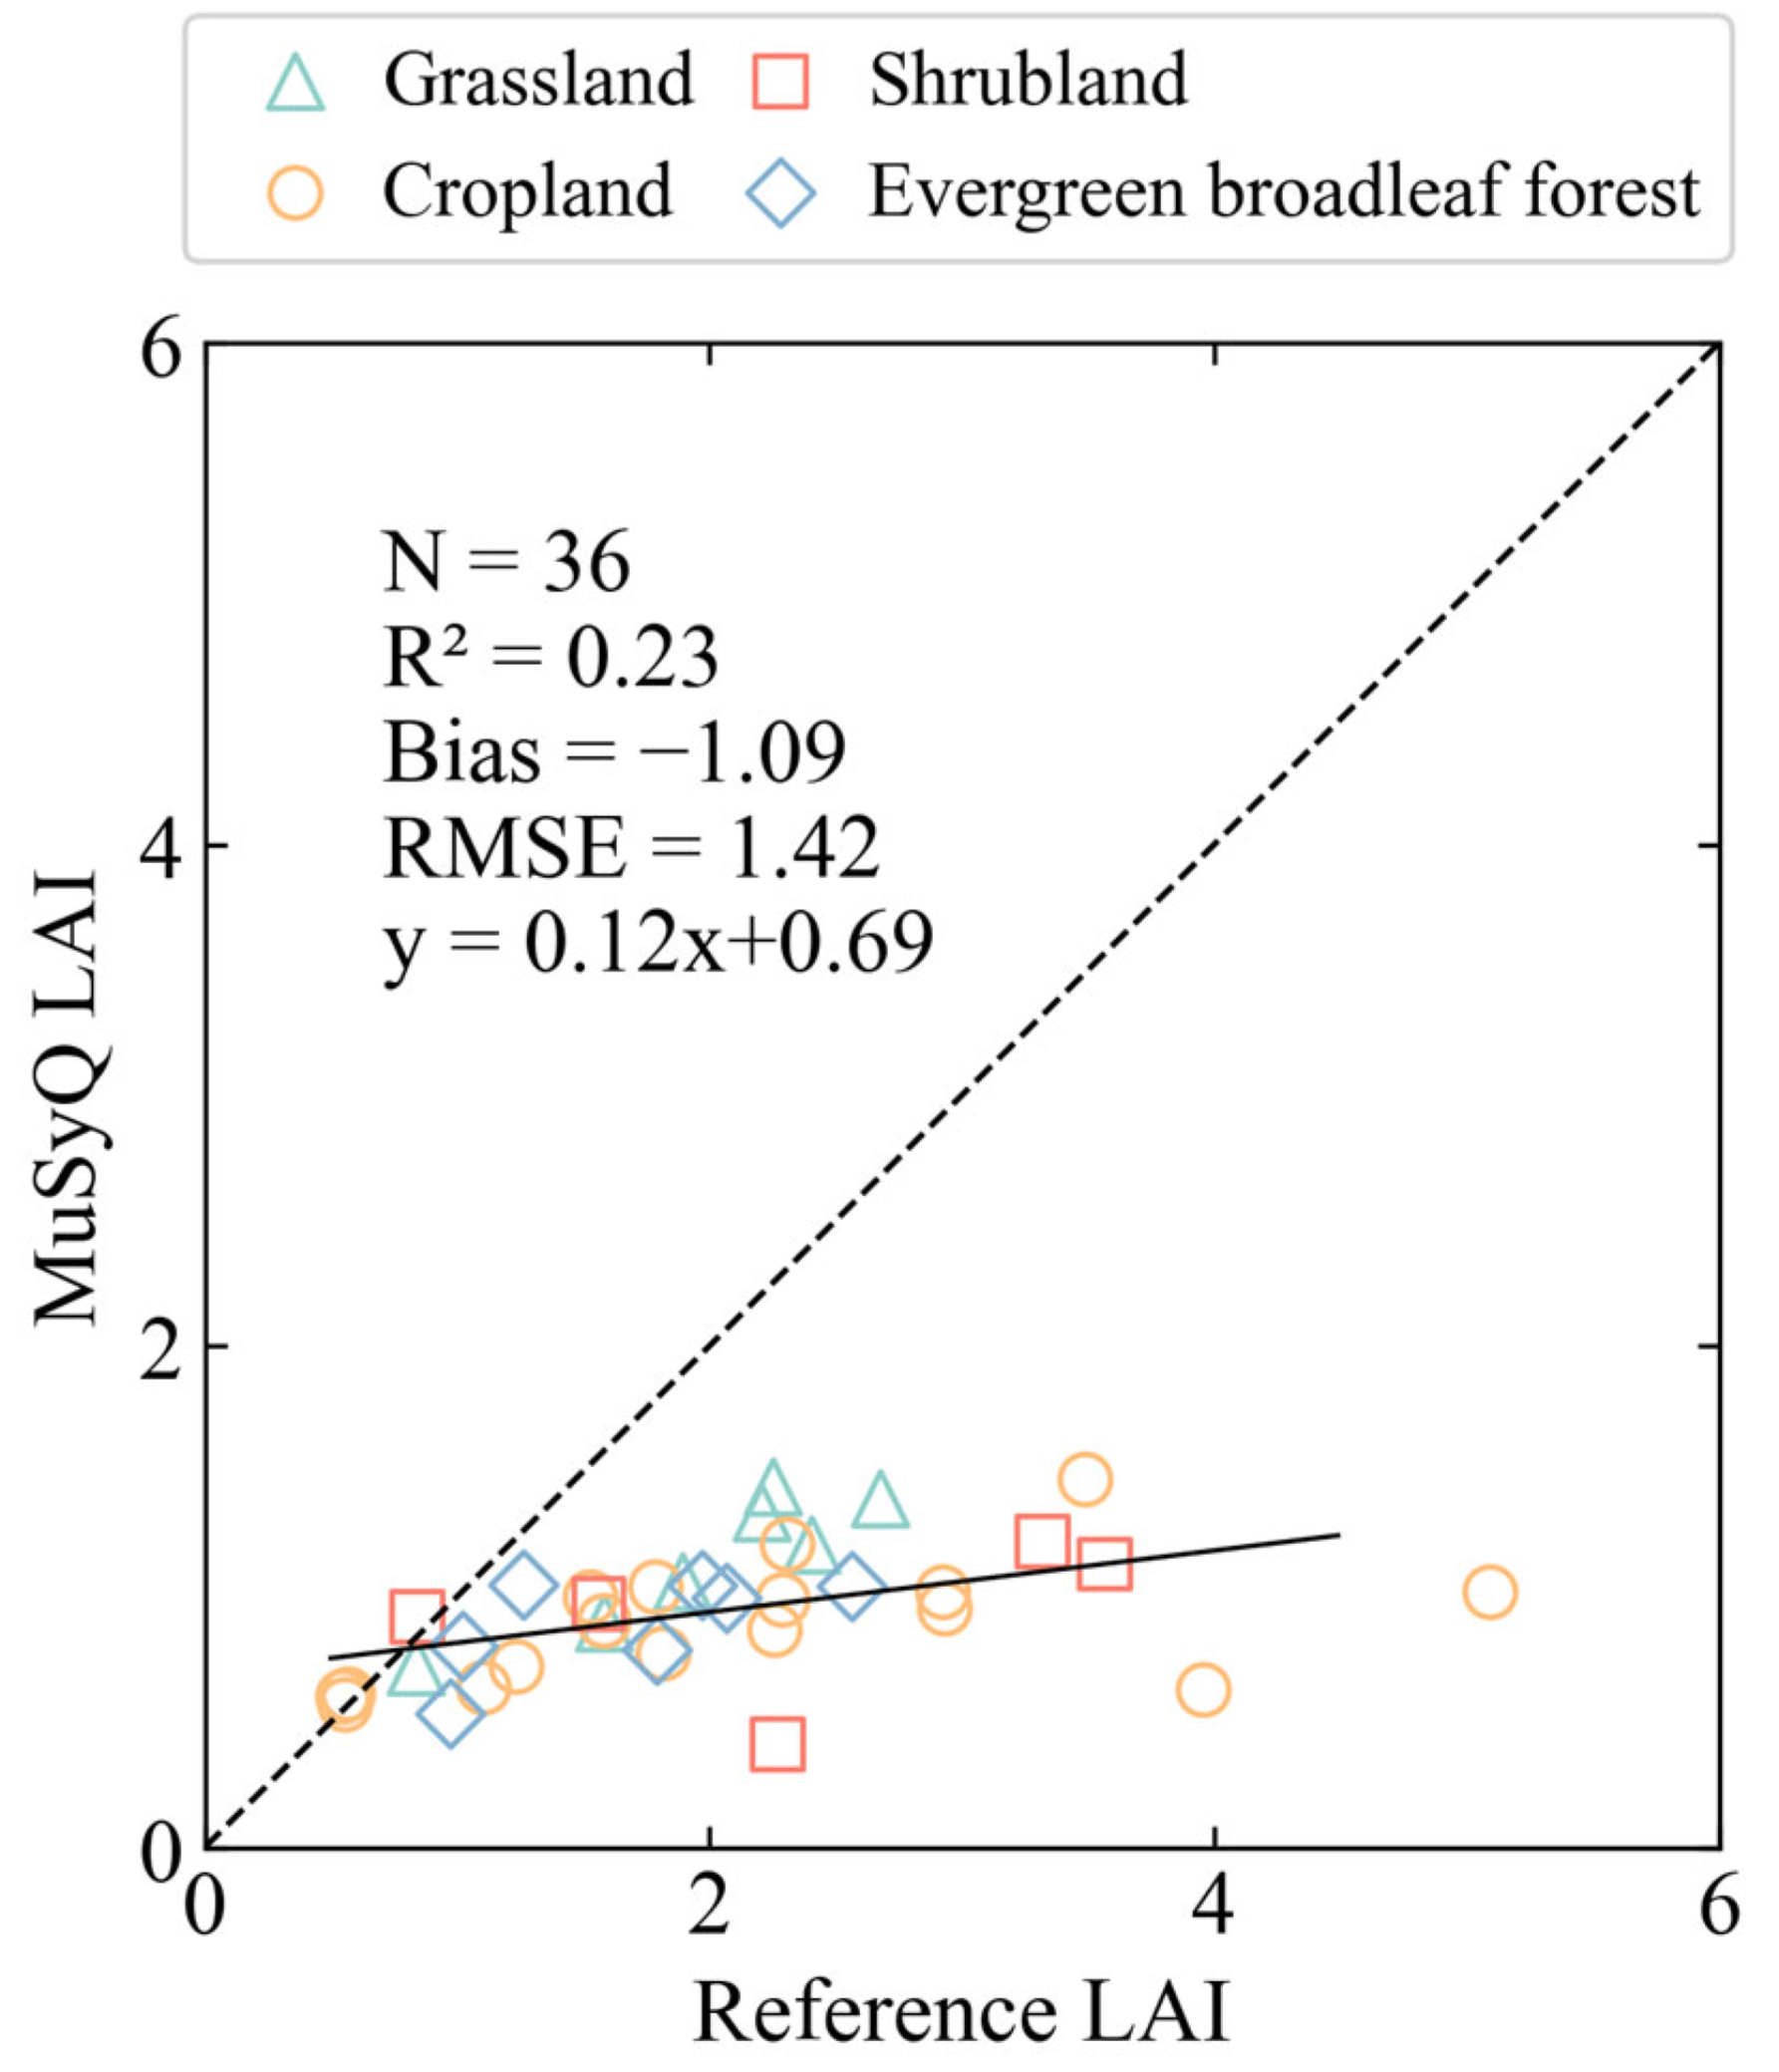
The overall error for the MuSyQ LAI products was calculated using the method from Section 3.2. The amplitude of reference LAI values (ranged from 0.55 to 5.09) varied from the MuSyQ LAI products (ranged from 0.41 to 1.47) in these study areas (i.e., Caoshang, Hutou Village, Citrus Research Institute). Additionally, the general difference of MuSyQ LAI for each biome could not be captured, namely, higher LAI value in shrublands and lower value in croplands could not be found in study areas (Figure 6). The mean value of reference LAI (2.03) was higher than that of MuSyQ LAI data (0.94), suggesting the underestimate (53.69%) of MuSyQ LAI relative to reference LAI. Furthermore, most MuSyQ LAI values lie below the 1:1 line, (i.e., the slope of MuSyQ LAI lower than 1), suggesting a systematic underestimating bias in MuSyQ LAI (Figure 6).
The validation results for each vegetation type were shown in Table 2. Shrublands and croplands were most underestimated in the MuSyQ LAI, which could be reflected in RMSE (1.66 for cropland and 1.68 for shrubland) and bias (−1.23 for cropland and −1.38 for shrubland). The RMSE for grassland and evergreen broadleaf forest was 0.90. However, a high consistency (R2 = 0.84) between MuSyQ LAI and reference LAI in grassland could be found in Table 2, indicating that the MuSyQ product could better represent grassland LAI in contrast to other vegetation types.
4.2. Assessment of Validation Error Attributable to Data Acquisition from Different Platforms
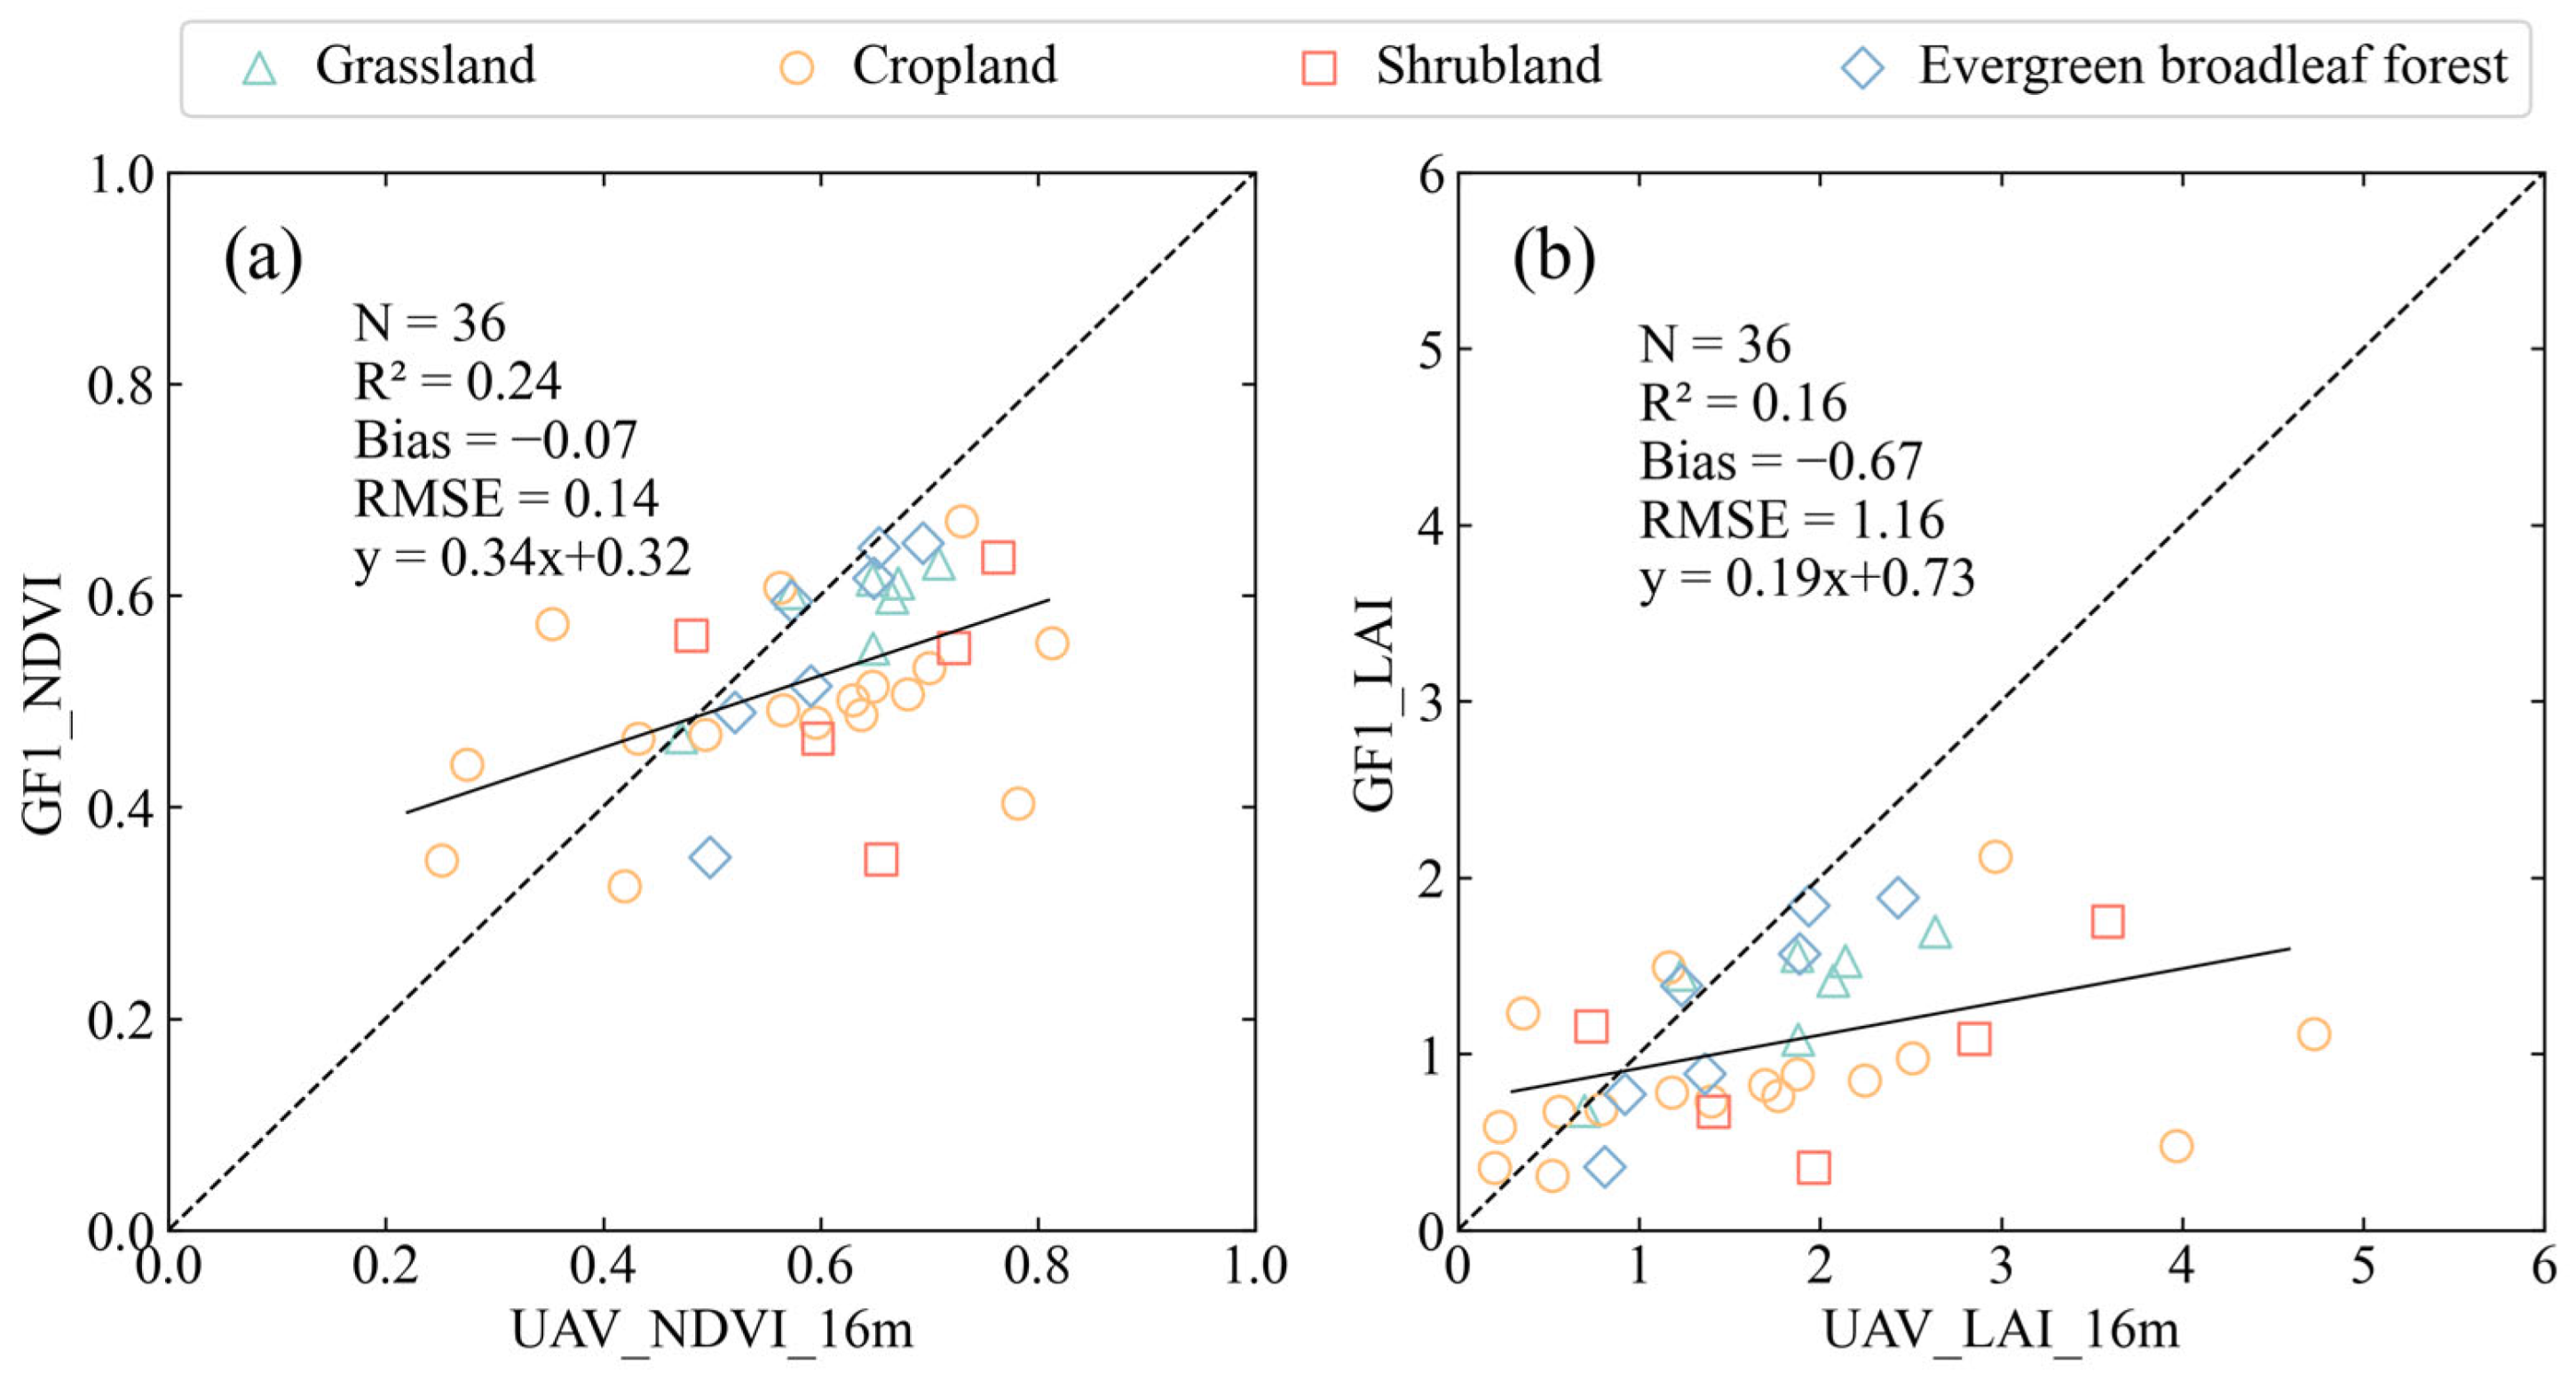
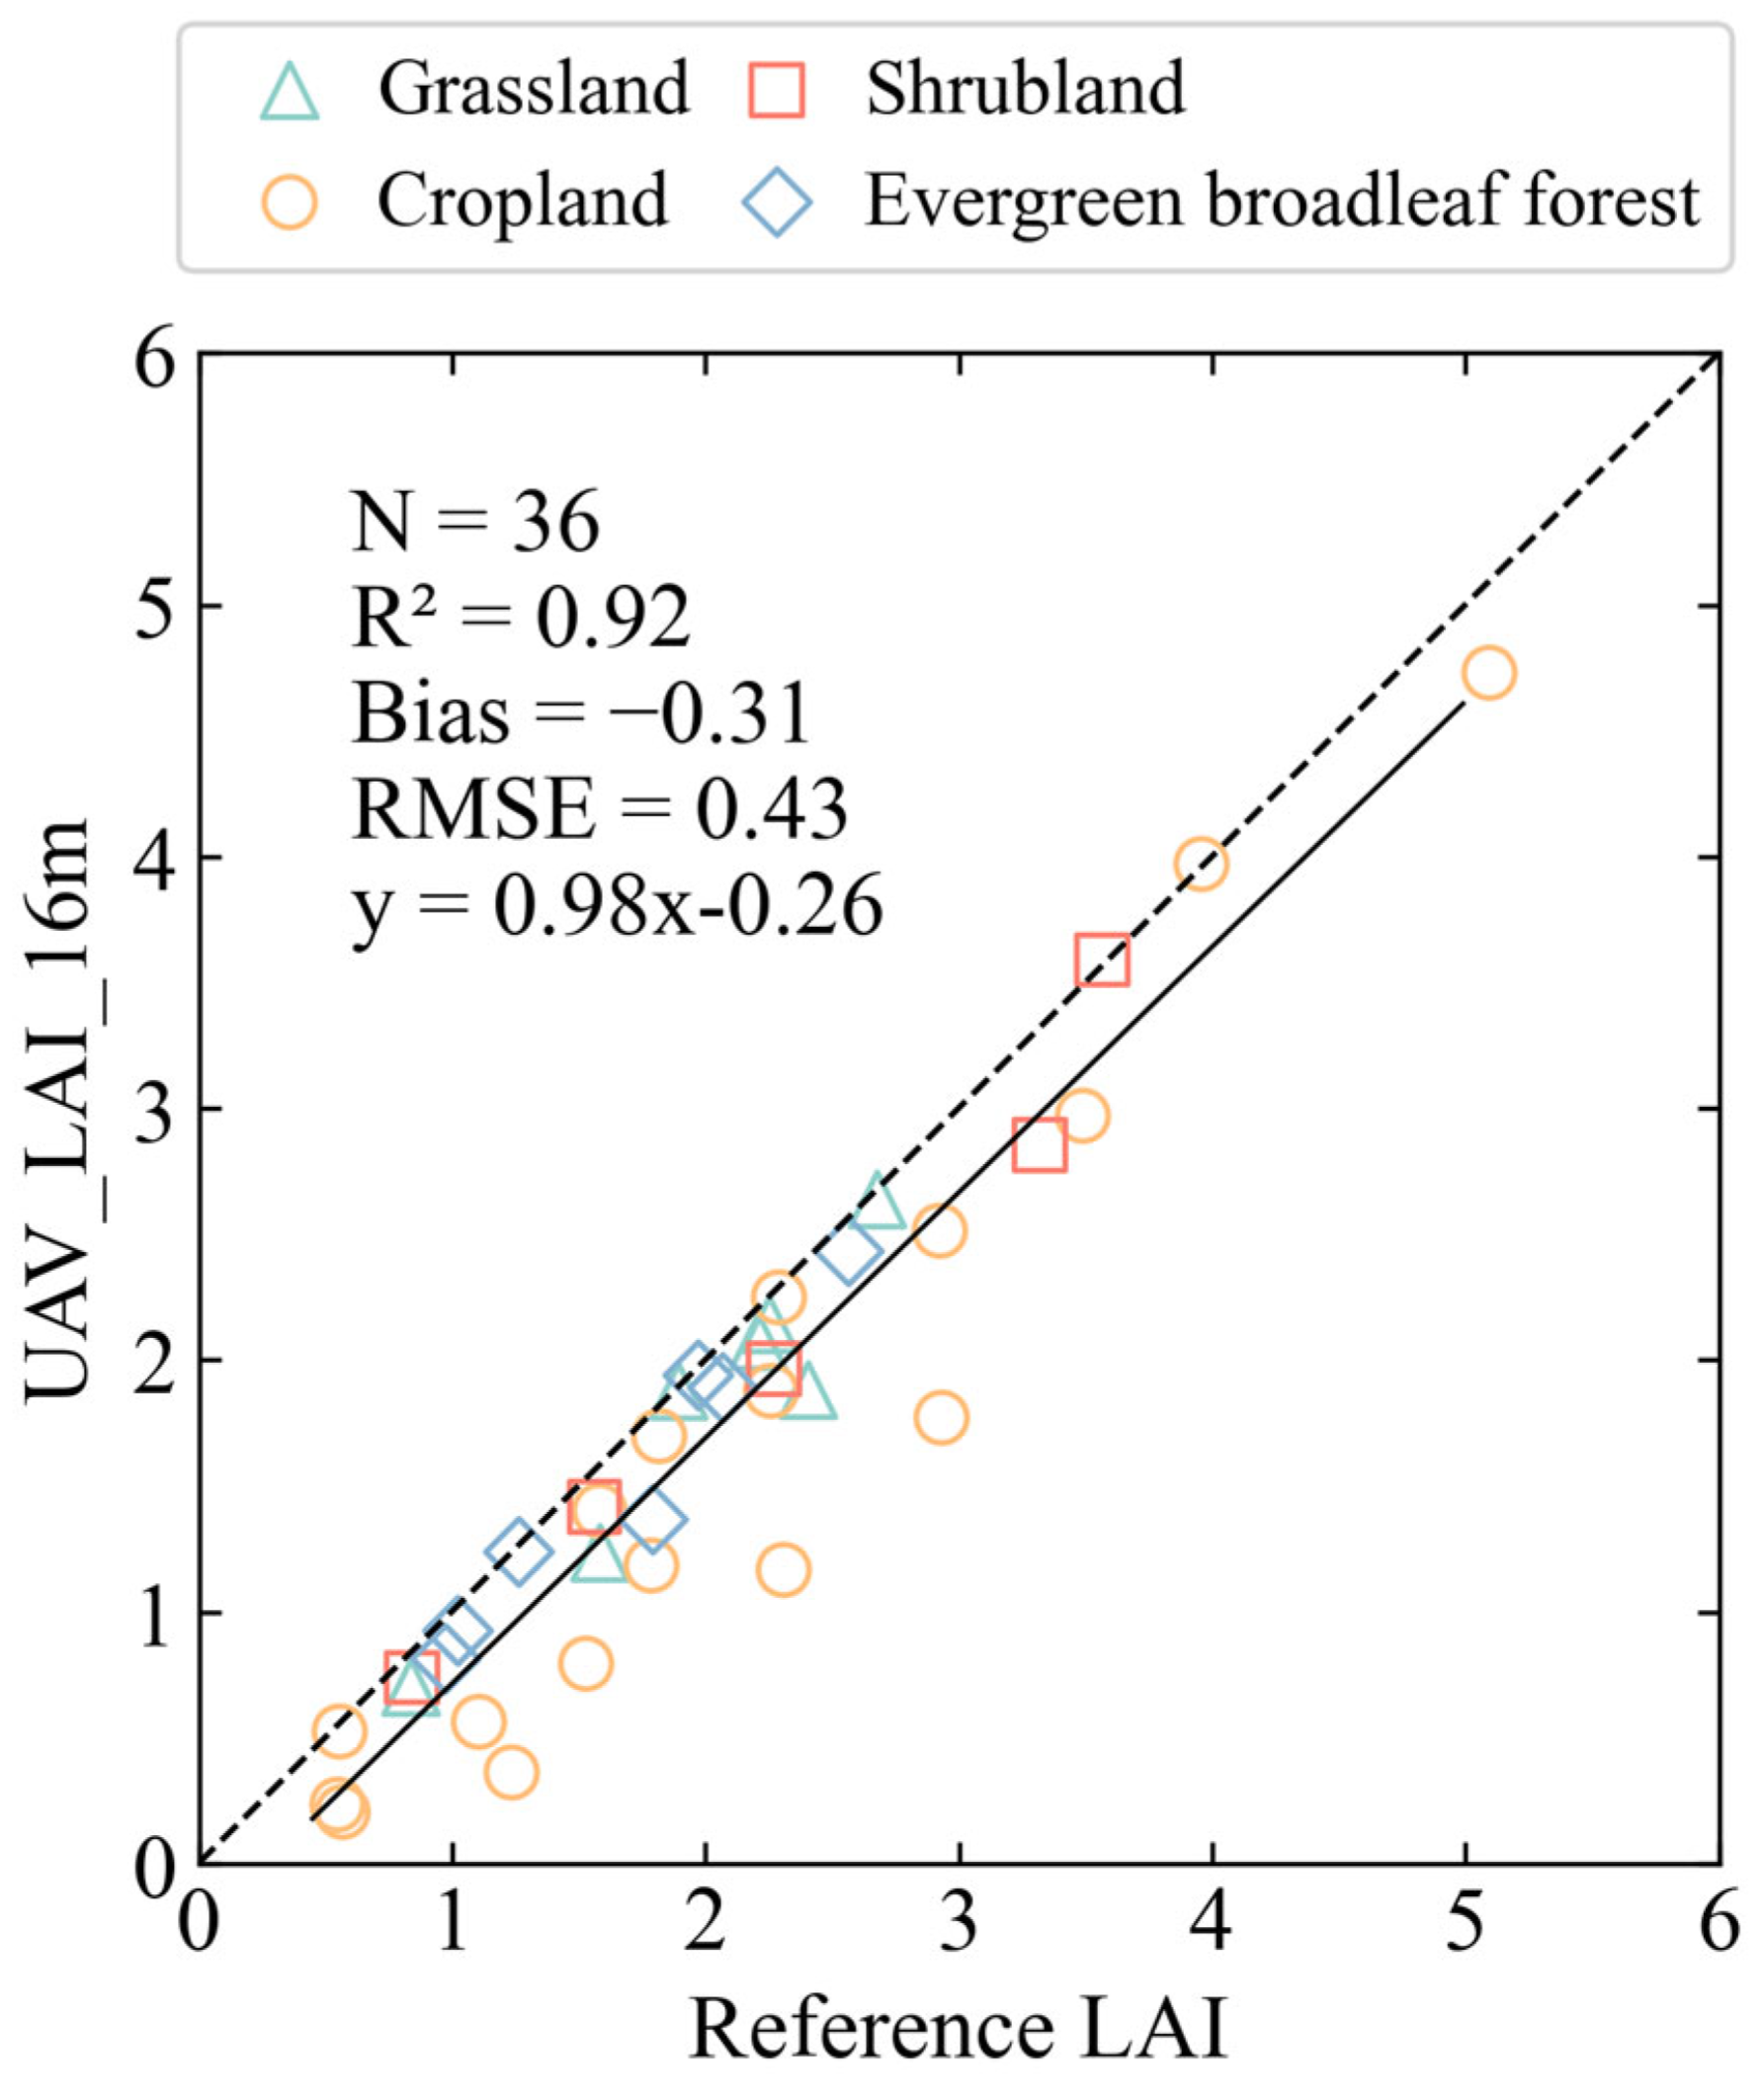
The difference of vegetation indices between UAV and GF-1 was assessed based on reflectance data (Figure 7). The GF1_NDVI was lower than UAV_NDVI_16m when NDVI was greater than 0.5 (Figure 7a), leading to an underestimation of GF1_LAI. The difference between GF1_LAI and UAV_LAI_16m (Figure 7b) were also assessed, finding that the mean value of 1.72 in UAV_LAI_16m was higher than GF1_LAI (1.05). GF1_LAI represented an underestimate of about 38.95%, relative to UAV_LAI_16m, accounting for 61.47% of the total bias. The reasons for this difference may be caused by the different spectral characteristics of the P4M and WFV sensors [37], leading to the difference of NDVI-derived LAI in the P4M and WFV sensors. These results indicated that the differences in the reflectance data may have a significant impact on the validation results.
The GF-1 WFV camera lacks the 2.1 short-wave infrared band compared to the MODIS sensor, resulting in the aerosol dark-pixel retrieval algorithm being unable to be used for the GF-1 data, posing as a challenge the development of a high-precision atmospheric correction [38]. For example, Zhong et al. [39] developed an improved Deep Blue algorithm to obtain atmospheric aerosol information that could be used in an inversion routine to obtain surface reflectance for the general atmosphere and for the land surface (including bright surfaces) for GF-1 WFV data. This algorithm has been validated for the northern region in China, but its accuracy for the southwestern part of China has not been verified, and may differ since climatic conditions are different in the north and south.
4.3. Assessment of Validation Error Attributable to Differences between Retrieval Models
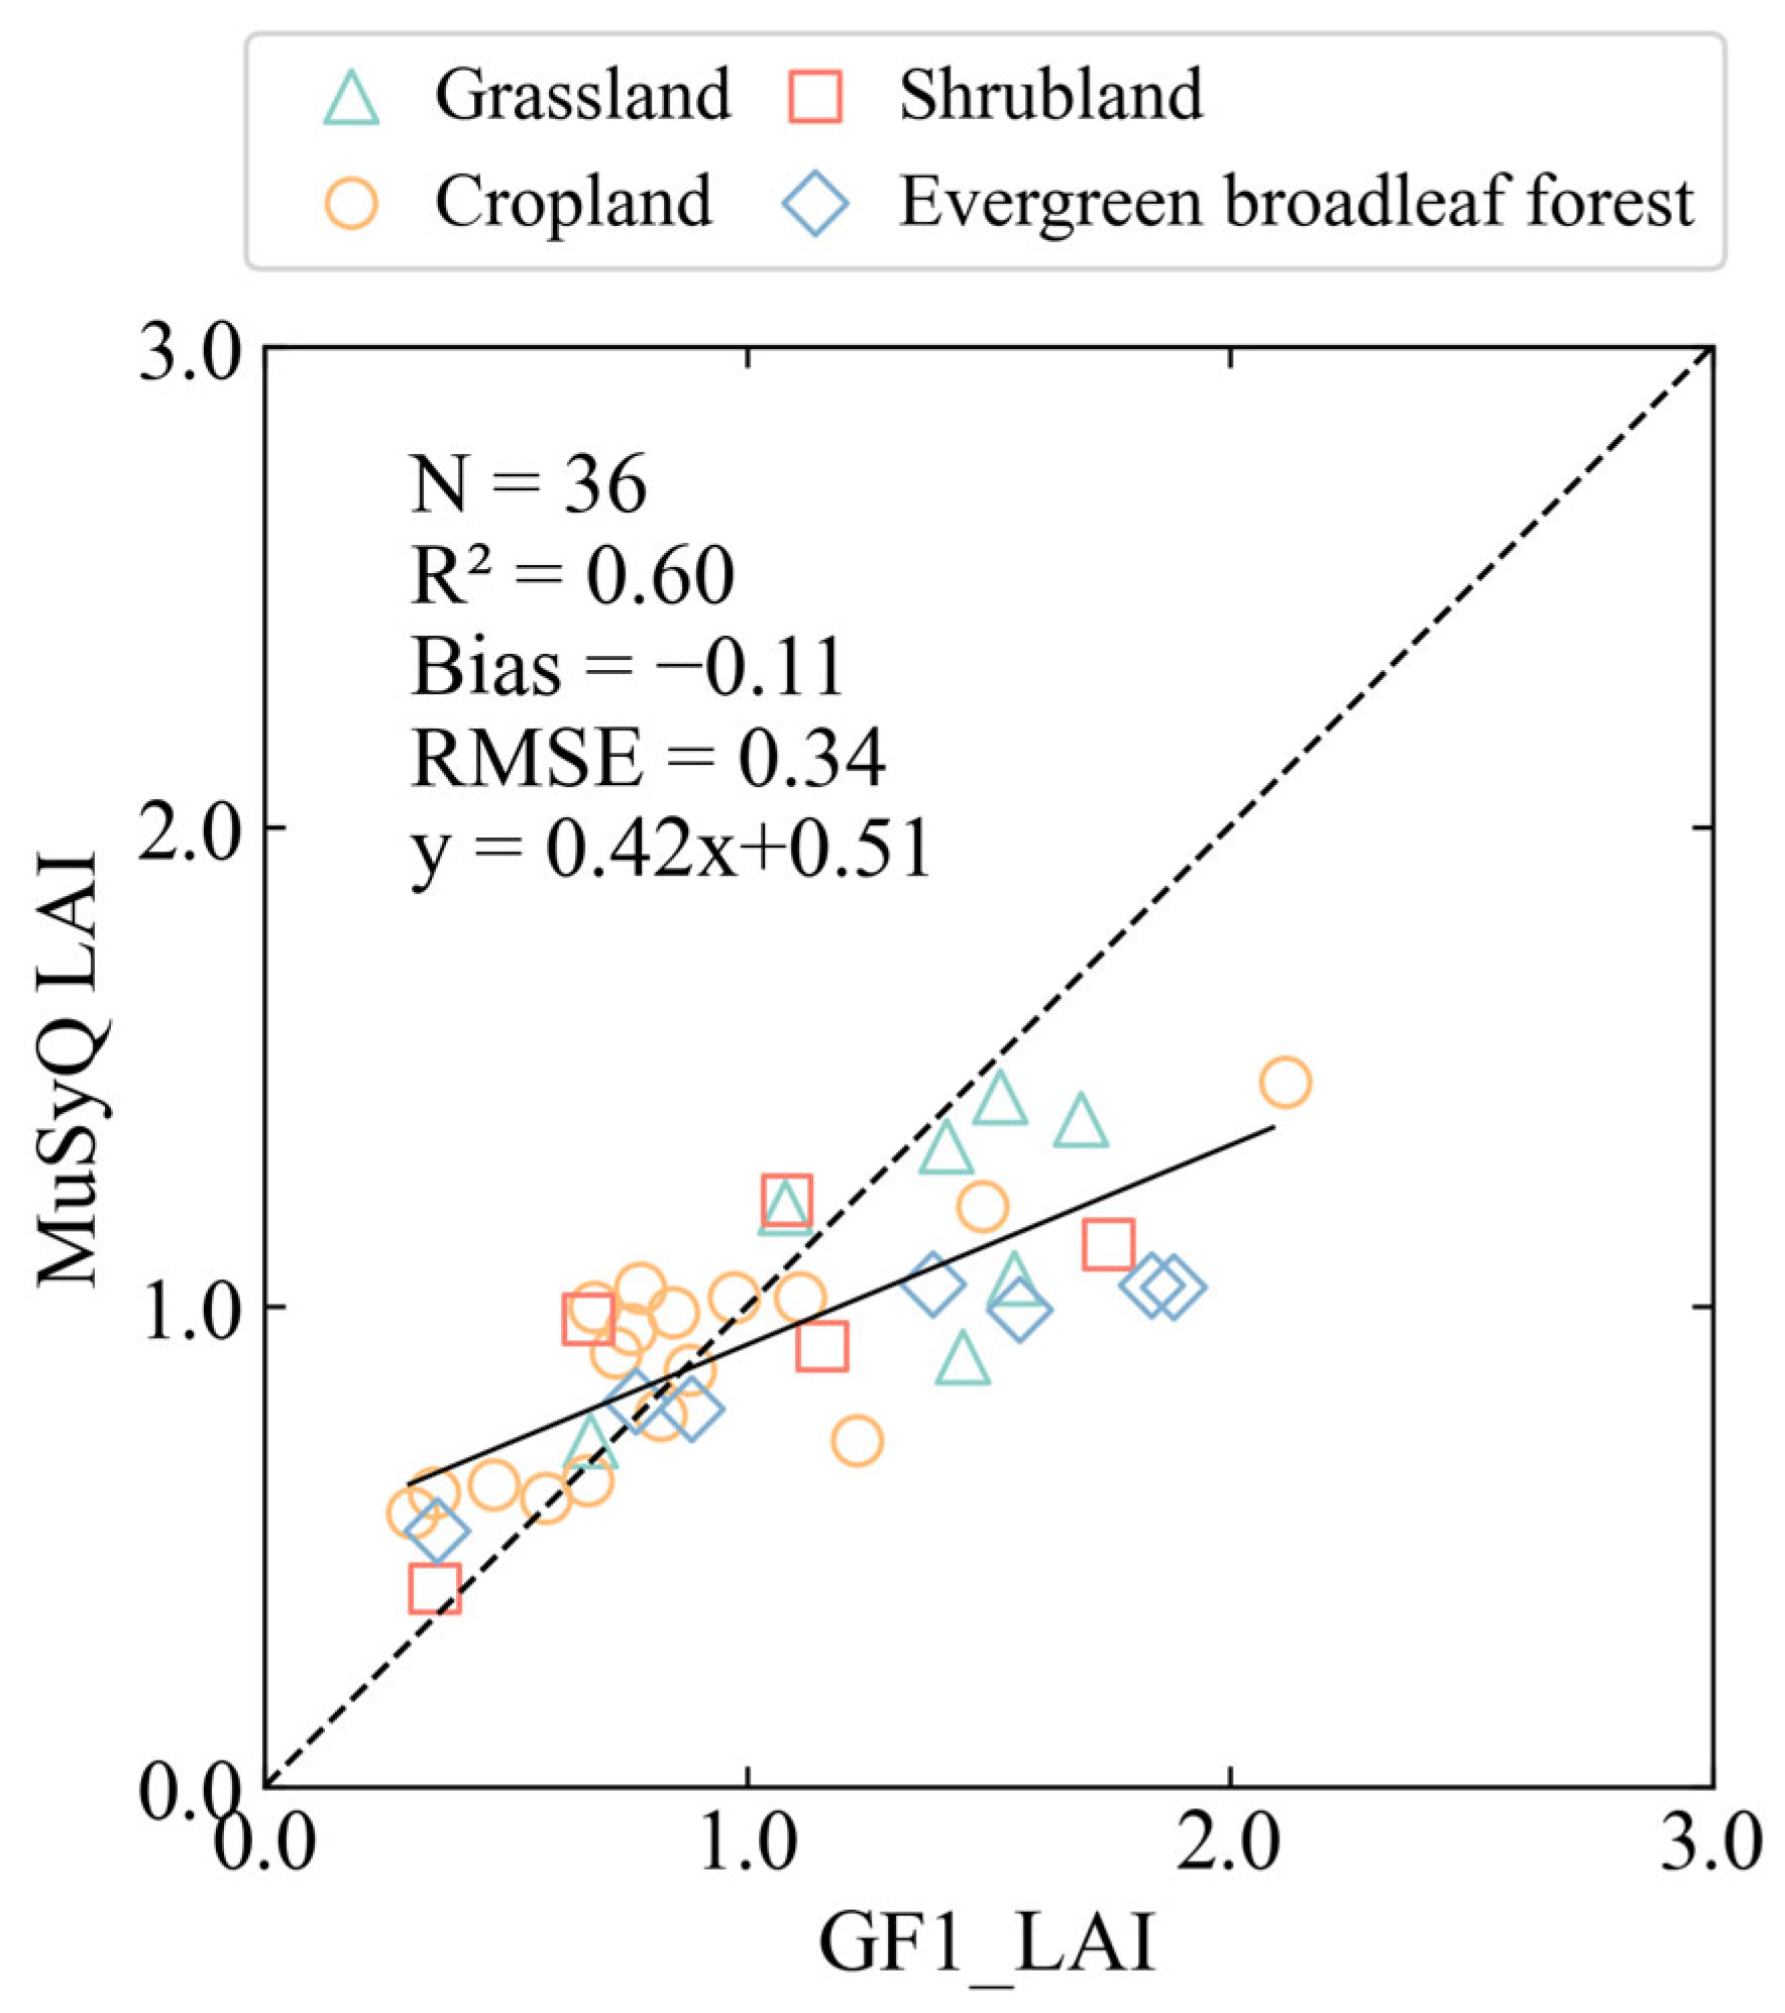
In order to assess the impact of variances among the models employed in LAI retrieval on the validation of LAI, the LAI values were computed in accordance with the validation flowchart illustrated (Figure 8). When the LAI is greater than 1, the results of the MuSyQ LAI model usually exhibit lower values than those of the NDVI-LAI model. The GF1_LAI has a mean value of 1.05, which is 0.11 greater than the average value of MuSyQ LAI (0.94), indicating an underestimation of approximately 10.48% by the model used for the MuSyQ LAI product compared to the empirical NDVI-LAI model. This underestimation accounts for 10.09% of the total bias. From these results, it can be seen that differences between the retrieval models have an impact on validation results and is one of the main sources of uncertainty for the MuSyQ LAI products.
The model of GF1_LAI is based on the measured data. For the study areas, the accuracy of model is relatively high. The MuSyQ LAI product uses the 3D-SRT model with a look-up table method to retrieve LAI. Although the 3D-SRT model used by MuSyQ LAI is supported by rigorous physical theory, it is difficult for the data to be realistic and accurate for different regions, and this regional applicability limitation may impact the accuracy of the model. Using lookup tables makes model retrievals fast, but the reliability of the retrieval results depends on the representativeness of the training data that were used to construct the lookup tables.
4.4. Assessment of Validation Error Attributable to Scale Effects
Tian et al. [40] found that the LAI obtained from coarse-resolution satellite data should match the average of the LAI values obtained from high-resolution satellite data when there were no scaling errors present. The scaling errors in the coarse-resolution LAI product are being investigated by comparing the differences between the reference LAI and UAV_LAI_16m. This comparison will help to partially quantify the errors in the LAI product validation process. A comparison between the LAI values obtained from two distinct up-scaling methods is illustrated in Figure 9. The mean LAI value for UAV_LAI_16m and the reference LAI are 1.72 and 2.03, respectively, indicating a difference of 0.31. The underestimation of the UAV_LAI_16m by approximately 15.27% in comparison to the reference LAI accounts for 28.44% of the total bias, demonstrating that scale effects play a significant role in the uncertainty associated with the MuSyQ LAI products.
Scale effects arise when there is surface heterogeneity and nonlinear retrieval models are used [41]. Surface features at the Caoshang site are fragmented and the composition of the subsurface is slightly more complex, including water bodies, rocks, and residential land in addition to vegetation. The surface heterogeneity here is much greater than at the Citrus Research Institute and Hutou Village sites. The Citrus Research Institute and Hutou Village sites mainly comprise grassland, cultivated land, and forest, with low meta-heterogeneity. The relative error caused by scale effects from the surface heterogeneity is not negligible at these sites. The LAI model used in this study is a nonlinear calculation that treats NDVI as an independent variable, and it will include some scale effects.
The standard deviation (SD) is a commonly used measure for spatial variability, which provides information about the dispersion of data around a mean value [42]. The variability within each 16 m MuSyQ LAI pixel was analyzed. Table 3 shows that the cropland had the highest spatial heterogeneity and the largest scaling difference. It can also be seen in Figure 9 that cropland is the main type underestimated between the UAV_LAI_16m and the reference LAI. From this, it can be concluded that the greater the spatial heterogeneity, the more complex the physical and environmental conditions become, which can lead to a greater scale effect. The Liu et al. [35] and Chen et al. [1] studies showed that the scale effect can cause inaccuracies in the estimation of LAI from coarse-resolution data. The scale effect leads to an underestimation of LAI in pixels that contain both vegetation and soil and overestimation in pixels that contain both vegetation and dark substrates such as water or black soil. The 16-m resolution pixels of cultivated land in the study area often include both crops and bare soil. This leads to an underestimation of the UAV_LAI_16m compared to the reference LAI.
4.5. Inter-Comparison of the GF-1 Reflectance with Sentinel-2 Reflectance
The GF-1 reflectance data were compared with the Sentinel-2 reflectance data to compare their agreement. The L2A atmospherically corrected surface reflectance data synchronized with the UAV image acquisition time from the Sentinel-2 multispectral satellite were obtained from the European Space Agency (ESA) Copernicus Open Access Hub (https://scihub.copernicus.eu/, accessed on 5 October 2022). The temporal resolution of the Sentinel-2 data is 5 days and the acquisition date for the data used in this study is 23 October 2020. Only red-band and near-infrared band data were needed in this study, and they both had a spatial resolution of 10 m. The Sentinel-2 images for the study areas were resampled to 16 m resolution, and the NDVI-LAI model in Section 3.3 was used to estimate LAI.
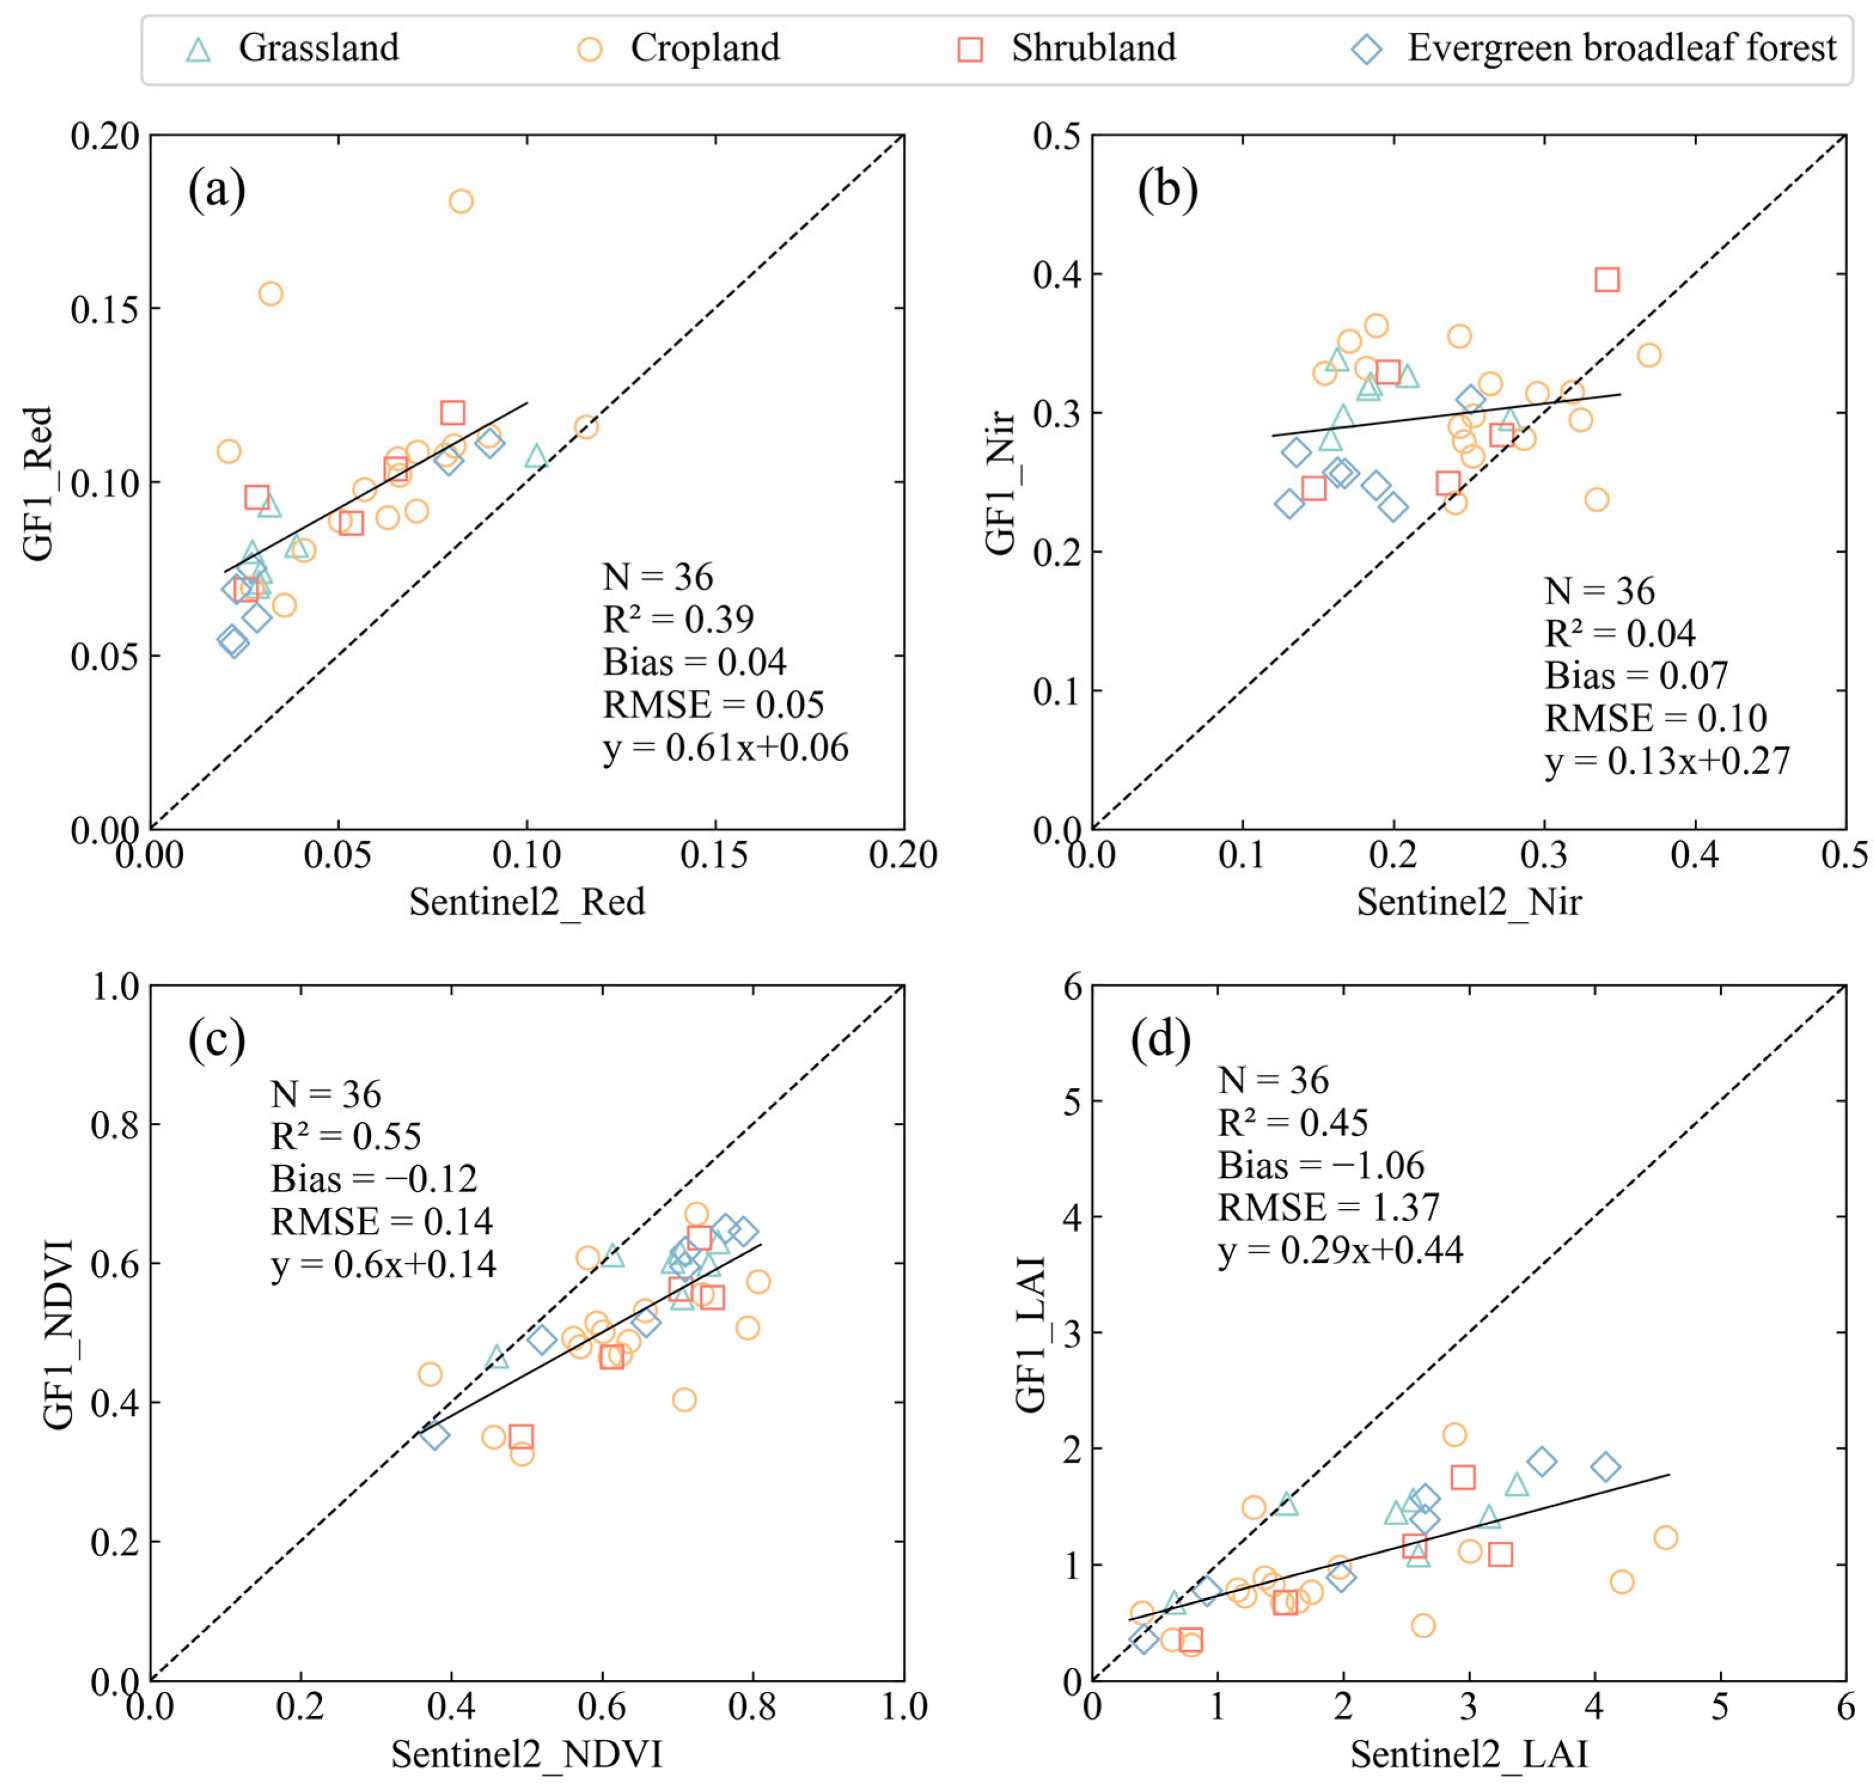
The agreement between the Sentinel-2 surface reflectance and the GF-1 surface reflectance is poor for both the red and near-infrared bands (Figure 10a,b). Although GF-1 shows some overestimation at the red and near-infrared reflectance, good agreement between the NDVI values from GF-1 and Sentinel-2 can be seen. Sentinel-2 NDVI is generally higher than GF-1 NDVI, leading the vegetation information to be captured better (Figure 10c). The comparison presented in Figure 10d reveals that, in general, Sentinel-2 LAI values are higher than GF-1 LAI values. This disparity suggests that the LAI values in the MuSyQ products may be underestimated compared to the UAV images, possibly due to discrepancies in the reflectance data utilized.
Frequent changes in mountain climate and topographic effects contribute to uncertainty in the retrieved surface reflectance [43], which affects the quality of the LAI products. Yang et al. [16] analyzed the effect of shady and sunny slope differences on retrievals of LAI from GEOV1, GLASS, and MODIS and found that the red and near-infrared reflectance retrieved from VGT and MODIS were greater for sunny slopes than for shady slopes, resulting in lower LAI estimates for shady slopes than for sunny slopes.
5. Discussion
5.1. Uncertainties Associated with Land Cover Classification Data
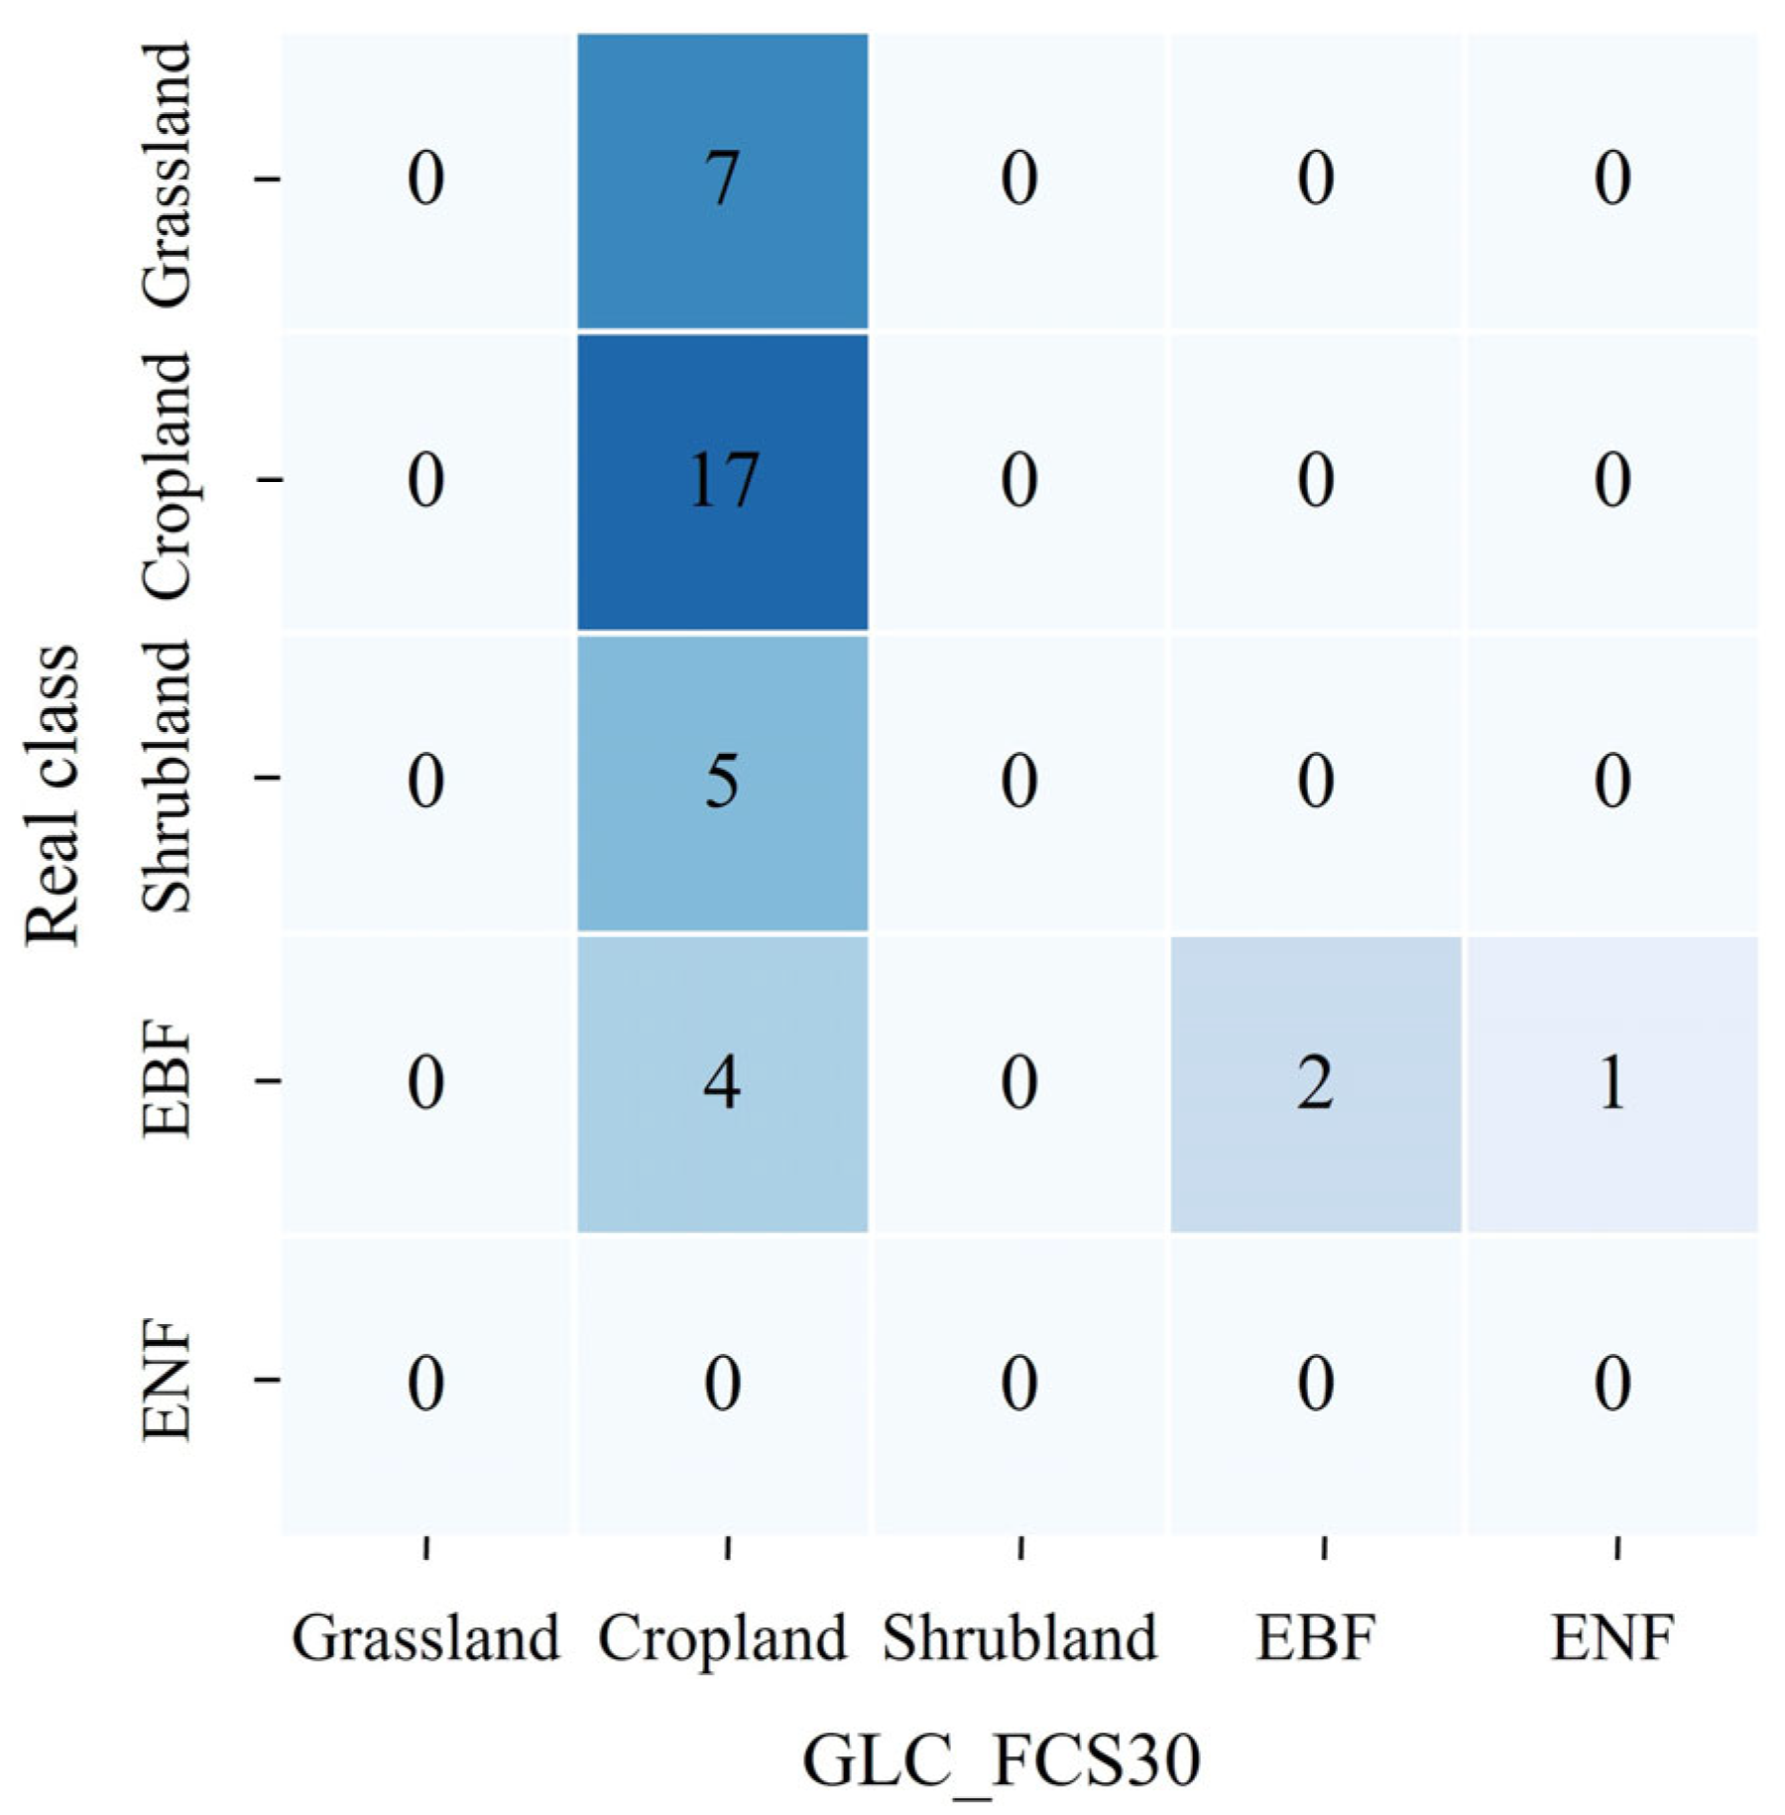
Uncertainties in LAI products are mainly caused by the input parameters (e.g., surface reflectance and land cover classification) and the retrieval algorithm [44]. The impact of surface reflectance and retrieval model on LAI product has been investigated in this work. Note that the error of land cover classification may also introduce uncertainty into LAI retrieval. In this study, the land cover classification data is obtained from the global land-cover product generated by Zhang et al. [45], which has a spatial resolution of 30 m and is retrieved using Landsat time-series imagery (GLC_FCS30). As shown in Figure 11, a confusion matrix is used to estimate the accuracy of GLC_FCS30 land cover classification with the use of 36 real samples. Sixteen pixels are misclassified as cropland, including grassland (7), shrubland (5), and broadleaf evergreen forest (4). The effect of misclassification on shrubland and broadleaf evergreen forest may cause a slight underestimation of LAI in the MuSyQ products.
Influence of fragmentation in mountain and topographic shading can affect the accuracy of land cover classification data in mountain areas [46]. There is a slight spatial inconsistency between land cover classification and MuSyQ LAI product, to make it difficult to obtain the true classification results and, accordingly, reduce the accuracy of the estimated LAI. Meanwhile, the misclassification of forest generally leads to an underestimation of LAI [47]. In future, finer-resolution land cover classification data are needed to accurately quantify the spatial heterogeneity of the land surface, especially in mountainous areas. Furthermore, it could improve the accuracy of LAI retrievals in forest area.
5.2. Validation of the MuSyQ LAI Product against Field Measurements
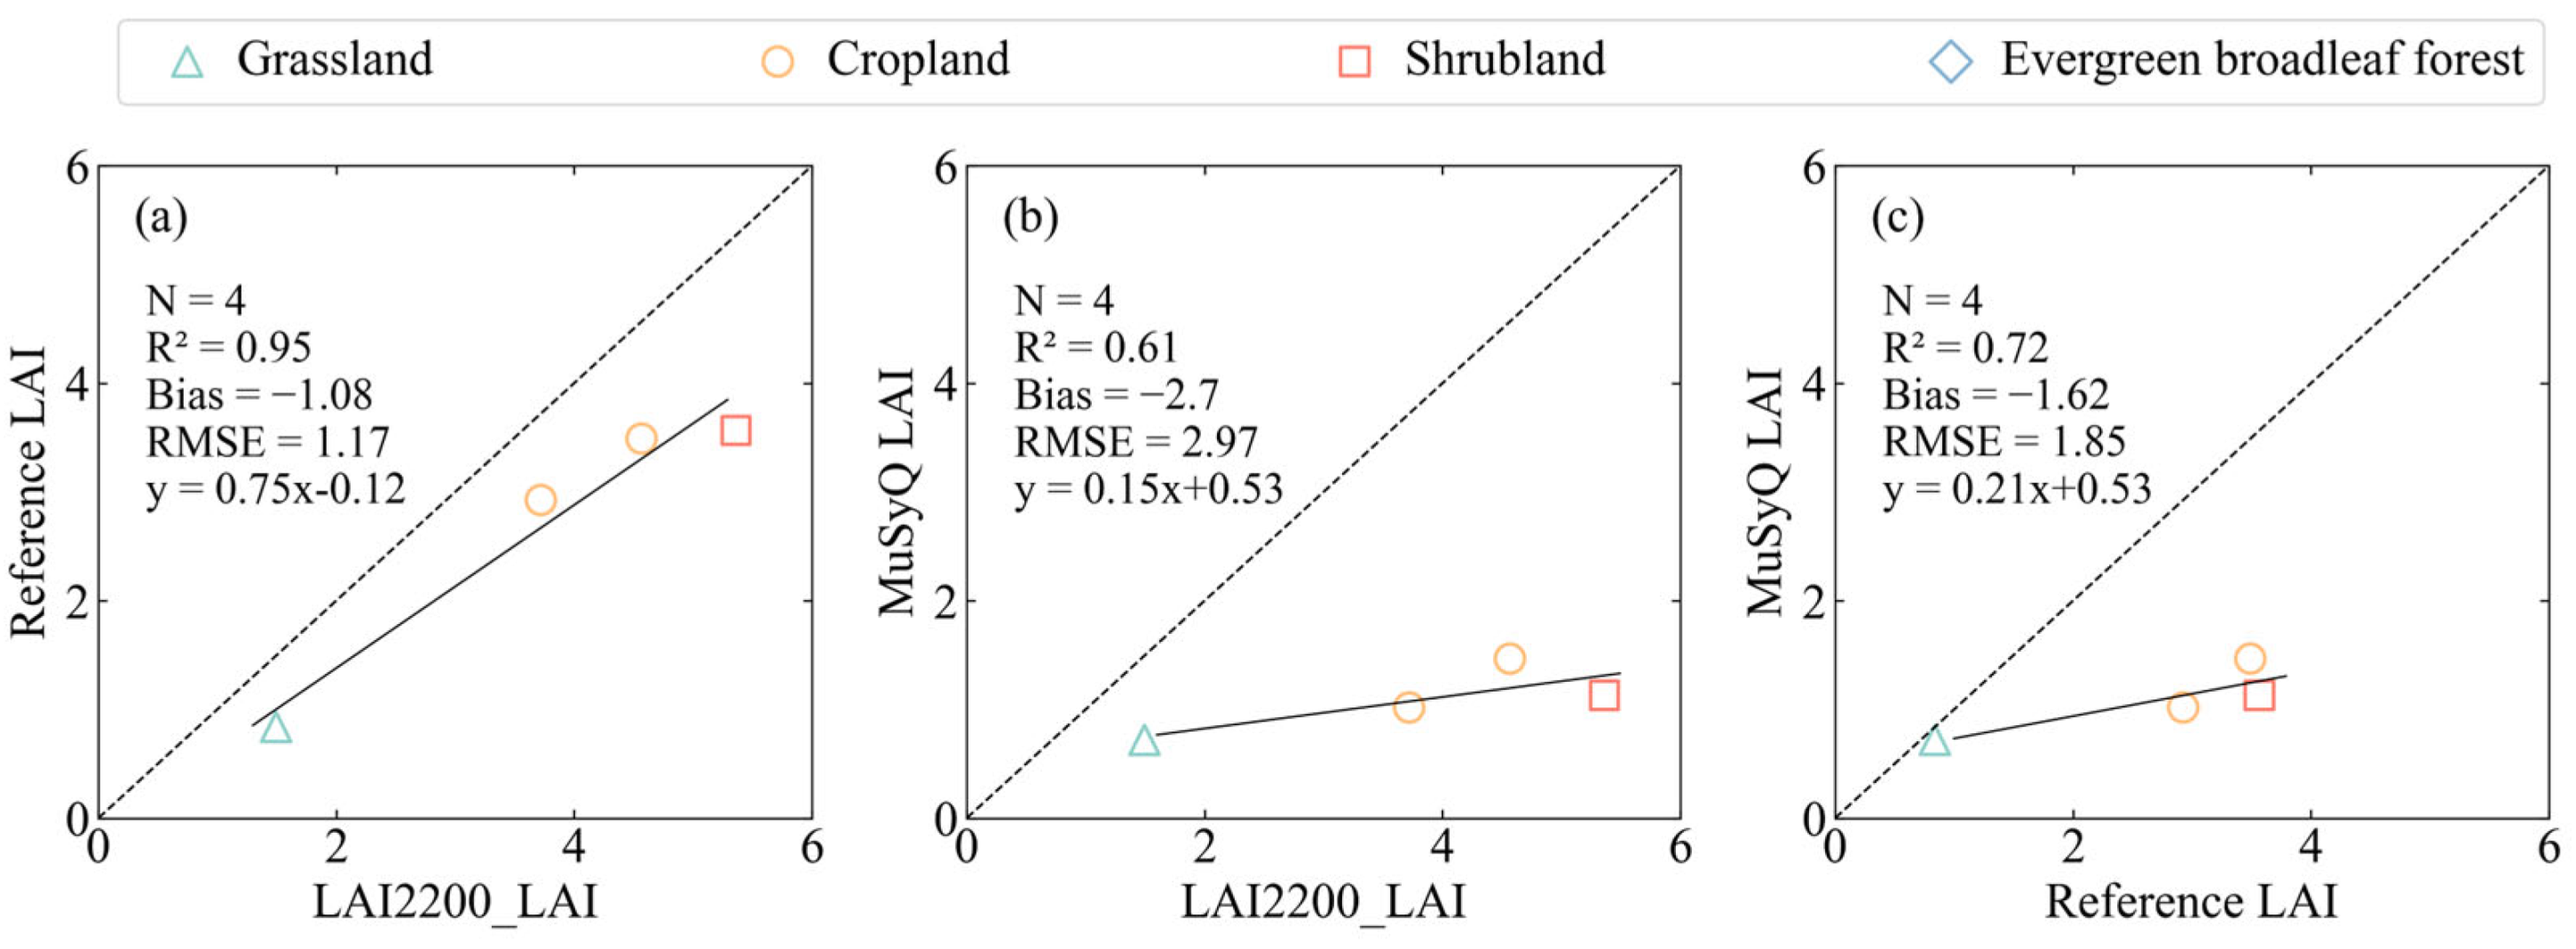
It cannot be neglected that some uncertainties are due to the spatial-mismatch issue between point-based ground observations and the pixel-based LAI products, especial in mountainous areas. To make a fair assessment, the direct validation method needs to be applied in homogeneous areas. In this study, the semivariogram and coefficient of sill were calculated with the spatial representativeness for each measurement site using the method described in Section 3.1. The GF-1 pixel is considered relatively homogeneous with the range of site greater than 16 m and the CS less than 30%. According to these two methods, four GF-1 pixels satisfy this condition, of which the spatial variability within one pixel is considered relatively small. The corresponding reference LAI and MuSyQ LAI were directly compared with the field measurements of the four measurement sites, respectively, as illustrated in Figure 12a,b. In addition, Figure 12c showed that the MuSyQ LAI were compared with the reference LAI in these four measurement sites.
The results illustrated in Figure 12a indicate that the field measurements of LAI have a good agreement with the reference LAI map with a high R2 of 0.95 in a relatively homogeneous area. This means that the reference LAI map is accurate and can be used to validate the MuSyQ LAI product. Compared with the field measurements, MuSyQ LAI has a better agreement with reference LAI (Figure 12b,c). The mean values of field measurements, reference LAI and MuSyQ LAI were 3.79, 2.71 and 1.08, respectively. Compared to field measurements and reference LAI, the MuSyQ LAI exhibited a significant underestimation of 71.50% and 60.15%, respectively. A direct comparison with the field measurements (Figure 12b) presented more uncertainties (Bias = −2.7, RMSE = 2.97), which were more than the upscaled reference LAI dataset.
In the spatially complex and fragmented, it can be challenging to find large and homogeneous plots for field LAI measurements. Thus, the number of field LAI datasets available for direct comparison with the remote sensing LAI products is limited. Moreover, it cannot avoid the uncertainties in field LAI measurements with the use of the LAI-2200. The LAI-2200 instrument underestimates the actual LAI values in the case of leaf aggregation (non-random distribution), and may overestimate in woody material (branches, trunks) [48,49]. Therefore, the direct comparison of the field LAI data and MuSyQ LAI shows considerable uncertainty. In such cases, a multi-scale validation approach that utilizes a combination of field measurements and UAV data can provide a more accurate assessment of the evaluation of LAI products. Furthermore, the fine-resolution reference LAI dataset can help to bridge the gap between the high accuracy of field measurements and the larger spatial coverage of coarse-resolution pixel data [50].
6. Conclusions
This study validates the high-resolution MuSyQ LAI product using field LAI measurements and UAV images over heterogeneous land surfaces in Southwest China. The validation study reveals that MuSyQ LAI products strongly underestimate LAI by about 53.69% in these study areas. Differences in reflectance data, retrieval model, and scale effects influenced the validation results. Differences in reflectance data were the most influential factor in the underestimation of MuSyQ LAI products, accounting for 61.47% of the total bias. Scale effects also had a large impact on the validation results and accounted for 28.44% of the total bias. The utilization of 30 m spatial resolution land cover classification data in the MuSyQ LAI product retrieval algorithm introduces additional uncertainty to the product. The paucity of field measurement datasets for direct validation in regions with pronounced spatial heterogeneity underscores the importance of fine-resolution reference LAI datasets derived from field measurements in validating high-resolution LAI products.
The uncertainties associated with the reflectance and retrieval algorithm and scale effects have been considered in this paper, as well as the errors in ground measurements. The uncertainties of ground measurements can be reduced by multiple measurements and standardized measurement methods. In contrast, it lacks a universal method to increase the spatial representativeness of ground measurements over high heterogeneous areas. Temporal inconsistency also affects the validation results, while the different acquisition time of MuSyQ LAI product (the temporal resolution of 10-day), UAV image, and the GF-1 image used in this study may contribute to uncertainties. The ground surface presents different spectral characteristics at different times, which will affect the validation results. Moreover, scale effects and scale transformation are crucial to validation, and further optimization of scale transformation will reduce the uncertainty in future validation studies.
Author Contributions
D.L. and M.M. were responsible for the main research ideas and for writing the manuscript; Y.L. implemented the field experiments; Y.H., Y.X., M.H. and J.W. contributed to the manuscript organization and analysis of results. All authors thoroughly reviewed and edited this paper. All authors have read and agreed to the published version of the manuscript.
Funding
This research was funded by the National Major Projects on High-Resolution Earth Observation System under Grant 21-Y20B01-9001-19/22 and the National Natural Science Foundation of China projects (grant numbers: U2244216 and 41830648).
Data Availability Statement
The data presented in this study are available on request from the corresponding author.
Acknowledgments
We thank experimentalists Feng Qian, Yuanqing Li and Debing Kong of Southwest University for providing the CPEC310 self-calibrating closed-circuit vorticity correlation system, the automatic weather station observation data, the sample plot observation data, and the wireless sensor network data. We also appreciate the fruitful suggestions from the anonymous reviewers which made the work better.
Conflicts of Interest
The authors declare no conflict of interest.
References
- Chen, J.; Pavlic, G.; Brown, L.; Cihlar, J.; Leblanc, S.G.; White, H.P.; Hall, R.J.; Peddle, D.R.; King, D.J.; Trofymow, J.A.; et al. Derivation and validation of Canada-wide coarse-resolution leaf area index maps using high-resolution satellite imagery and ground measurements. Remote Sens. Environ. 2002, 80, 165–184. [Google Scholar] [CrossRef]
- Asner, G.P.; Braswell, B.H.; Schimel, D.S.; Wessman, C.A. Ecological Research Needs from Multiangle Remote Sensing Data. Remote Sens. Environ. 1998, 63, 155–165. [Google Scholar] [CrossRef]
- Jarlan, L.; Balsamo, G.; Lafont, S.; Beljaars, A.; Calvet, J.C.; Mougin, E. Analysis of leaf area index in the ECMWF land surface model and impact on latent heat and carbon fluxes: Application to West Africa. J. Geophys. Res. 2008, 113, D24117. [Google Scholar] [CrossRef]
- GCOS. The Global Observing System for Climate: Implementation Needs (GCOS-200); World Meteorological Organization: Geneva, Switzerland, 2016. [Google Scholar]
- Yang, W.Z.; Huang, D.; Tan, B.; Stroeve, J.C.; Shabanov, N.V.; Knyazikhin, Y.; Nemani, R.R.; Myneni, R.B. Analysis of leaf area index and fraction of PAR absorbed by vegetation products from the terra MODIS sensor: 2000-2005. IEEE Trans. Geosci. Remote Sens. 2006, 44, 1829–1842. [Google Scholar] [CrossRef]
- Ma, H.; Liang, S.L. Development of the GLASS 250-m leaf area index product (version 6) from MODIS data using the bidirectional LSTM deep learning model. Remote Sens. Environ. 2022, 273, 112985. [Google Scholar] [CrossRef]
- Baret, F.; Hagolle, O.; Geiger, B.; Bicheron, P.; Miras, B.; Huc, M.; Berthelot, B.; Nino, F.; Weiss, M.; Samain, O.; et al. LAI, fAPAR and fCover CYCLOPES global products derived from VEGETATION—Part 1: Principles of the algorithm. Remote Sens. Environ. 2007, 110, 275–286. [Google Scholar] [CrossRef] [Green Version]
- Hu, J.N.; Su, Y.; Tan, B.; Huang, D.; Yang, W.Z.; Schull, M.; Bull, M.A.; Martonchik, J.V.; Diner, D.J.; Knyazikhin, Y.; et al. Analysis of the MISR LA/FPAR product for spatial and temporal coverage, accuracy and consistency. Remote Sens. Environ. 2007, 107, 334–347. [Google Scholar] [CrossRef] [Green Version]
- Justice, C.O.; Roman, M.O.; Csiszar, I.; Vermote, E.F.; Wolfe, R.E.; Hook, S.J.; Friedl, M.; Wang, Z.S.; Schaaf, C.B.; Miura, T.; et al. Land and cryosphere products from Suomi NPP VIIRS: Overview and status. J. Geophys. Res. Atmos. 2013, 118, 9753–9765. [Google Scholar] [CrossRef] [Green Version]
- Dong, G.; Fan, L.; Fensholt, R.; Frappart, F.; Ciais, P.; Xiao, X.; Sitch, S.; Xing, Z.; Yu, L.; Zhou, Z.; et al. Asymmetric response of primary productivity to precipitation anomalies in Southwest China. Agric. For. Meteorol. 2023, 331, 109350. [Google Scholar] [CrossRef]
- Piao, S.L.; Yin, G.D.; Tan, J.G.; Cheng, L.; Huang, M.T.; Li, Y.; Liu, R.G.; Mao, J.F.; Myneni, R.B.; Peng, S.S.; et al. Detection and attribution of vegetation greening trend in China over the last 30 years. Glob. Change Biol. 2015, 21, 1601–1609. [Google Scholar] [CrossRef]
- Chen, X.; Chen, T.X.; Yan, Q.Y.; Cai, J.T.; Guo, R.J.; Gao, M.N.; Wei, X.Q.; Zhou, S.J.; Li, C.F.; Xie, Y. The Ongoing Greening in Southwest China despite Severe Droughts and Drying Trends. Remote Sens. 2021, 13, 3374. [Google Scholar] [CrossRef]
- Pasolli, L.; Asam, S.; Castelli, M.; Bruzzone, L.; Wohlfahrt, G.; Zebisch, M.; Notarnicola, C. Retrieval of Leaf Area Index in mountain grasslands in the Alps from MODIS satellite imagery. Remote Sens. Environ. 2015, 165, 159–174. [Google Scholar] [CrossRef]
- Jensen, J.L.R.; Humes, K.S.; Hudak, A.T.; Vierling, L.A.; Delmelle, E. Evaluation of the MODIS LAI product using independent lidar-derived LAI: A case study in mixed conifer forest. Remote Sens. Environ. 2011, 115, 3625–3639. [Google Scholar] [CrossRef] [Green Version]
- Jin, H.A.; Li, A.N.; Bian, J.H.; Nan, X.; Zhao, W.; Zhang, Z.J.; Yin, G.F. Intercomparison and validation of MODIS and GLASS leaf area index (LAI) products over mountain areas: A case study in southwestern China. Int. J. Appl. Earth Obs. Geoinf. 2017, 55, 52–67. [Google Scholar] [CrossRef]
- Yang, Y.S.; Li, A.N.; Jin, H.A.; Yin, G.F.; Zhao, W.; Lei, G.B.; Bian, J.H. Intercomparison Among GEOV1,GLASS and MODIS LAI Products over Mountainous Area in Southwestern China. Remote Sens. Technol. Appl. 2016, 31, 438–450. [Google Scholar]
- Jing, J.C.; Jin, H.A.; Tang, B.; Li, A.N. Intercomparison and evaluation of influencing factors among different LAl products over mountainous areas. J. Nat. Resour. 2019, 34, 400–411. [Google Scholar]
- Bonan, G.B. Importance of leaf area index and forest type when estimating photosynthesis in boreal forests. Remote Sens. Environ. 1993, 43, 303–314. [Google Scholar] [CrossRef]
- Bai, Z.G. Technical characteristics of GF-1 satellite. Aerosp. China 2013, 8, 5–9. [Google Scholar]
- Zhang, H.; Li, J.; Zhang, Z.X.; Wu, S.L.; Zhong, B.; Liu, Q.H. A dataset of 16m/10-day leaf area indices of MuSyQ GF-series (2018–2020, China, Version 01). Sci. Data Bank 2021. [CrossRef]
- Zou, D.X.; Yan, K.; Pu, J.B.; Gao, S.; Li, W.J.; Mu, X.H.; Knyazikhin, Y.; Myneni, R.B. Revisit the Performance of MODIS and VIIRS Leaf Area Index Products from the Perspective of Time-Series Stability. IEEE J. Sel. Top. Appl. Earth Observ. Remote Sens. 2022, 15, 8958–8973. [Google Scholar] [CrossRef]
- Xiao, Z.Q.; Liang, S.L.; Jiang, B. Evaluation of four long time-series global leaf area index products. Agric. For. Meteorol. 2017, 246, 218–230. [Google Scholar] [CrossRef]
- Fang, H.L.; Wei, S.S.; Liang, S.L. Validation of MODIS and CYCLOPES LAI products using global field measurement data. Remote Sens. Environ. 2012, 119, 43–54. [Google Scholar] [CrossRef]
- Fernandes, R.; Plummer, S.; Nightingale, J.; Frederic, B.; Camacho De Coca, F.; Fang, H.; Garrigues, S.; Gobron, N.; Lang, M.; Lacaze, R.; et al. CEOS Global LAI Product Validation Good Practices. Best Pract. Satell. Deriv. Land Prod. Valid. 2014, 2, 76. [Google Scholar]
- Wu, M.Y. DJI Genie 4 officially released the most intelligent drone is here. Comput. Netw. 2016, 42, 36. [Google Scholar]
- Di Gennaro, S.F.; Toscano, P.; Gatti, M.; Poni, S.; Berton, A.; Matese, A. Spectral Comparison of UAV-Based Hyper and Multispectral Cameras for Precision Viticulture. Remote Sens. 2022, 14, 449. [Google Scholar] [CrossRef]
- Curran, P.J. The semivariogram in remote sensing: An introduction. Remote Sens. Environ. 1988, 24, 493–507. [Google Scholar] [CrossRef]
- Sertel, E.; Kaya, S.; Curran, P.J. Use of semivariograms to identify earthquake damage in an urban area. IEEE Trans. Geosci. Remote Sens. 2007, 45, 1590–1594. [Google Scholar] [CrossRef]
- Roman, M.O.; Schaaf, C.B.; Woodcock, C.E.; Strahler, A.H.; Yang, X.Y.; Braswell, R.H.; Curtis, P.S.; Davis, K.J.; Dragoni, D.; Goulden, M.L.; et al. The MODIS (Collection V005) BRDF/albedo product: Assessment of spatial representativeness over forested landscapes. Remote Sens. Environ. 2009, 113, 2476–2498. [Google Scholar] [CrossRef] [Green Version]
- Garrigues, S.; Allard, D.; Baret, F.; Morisette, J. Multivariate quantification of landscape spatial heterogeneity using variogram models. Remote Sens. Environ. 2008, 112, 216–230. [Google Scholar] [CrossRef]
- Garrigues, S.; Allard, D.; Baret, F.; Weiss, M. Quantifying spatial heterogeneity at the landscape scale using variograrn models. Remote Sens. Environ. 2006, 103, 81–96. [Google Scholar] [CrossRef]
- Cooper, S.D.; Barmuta, L.; Sarnelle, O.; Kratz, K.; Diehl, S. Quantifying spatial heterogeneity in streams. J. North Am. Benthol. Soc. 1997, 16, 174–188. [Google Scholar] [CrossRef]
- Xu, B.D.; Li, J.; Liu, Q.H.; Huete, A.R.; Yu, Q.; Zeng, Y.L.; Yin, G.F.; Zhao, J.; Yang, L. Evaluating Spatial Representativeness of Station Observations for Remotely Sensed Leaf Area Index Products. IEEE J. Sel. Top. Appl. Earth Observ. Remote Sens. 2016, 9, 3267–3282. [Google Scholar] [CrossRef]
- Garrigues, S.; Allard, D.; Baret, F.; Weiss, M. Influence of landscape spatial heterogeneity on the non-linear estimation of leaf area index from moderate spatial resolution remote sensing data. Remote Sens. Environ. 2006, 105, 286–298. [Google Scholar] [CrossRef]
- Liu, L. Simulation and correction of spatialscaling effects for leaf area index. J. Remote Sens. 2014, 18, 1158–1168. [Google Scholar]
- Myneni, R.B.; Hoffman, S.; Knyazikhin, Y.; Privette, J.L.; Glassy, J.; Tian, Y.; Wang, Y.; Song, X.; Zhang, Y.; Smith, G.R.; et al. Global products of vegetation leaf area and fraction absorbed PAR from year one of MODIS data. Remote Sens. Environ. 2002, 83, 214–231. [Google Scholar] [CrossRef] [Green Version]
- Trishchenko, A.P.; Cihlar, J.; Li, Z.Q. Effects of spectral response function on surface reflectance and NDVI measured with moderate resolution satellite sensors. Remote Sens. Environ. 2002, 81, 1–18. [Google Scholar] [CrossRef]
- Zhong, B.; Yang, A.X.; Liu, Q.H.; Wu, S.L.; Shan, X.J.; Mu, X.H.; Hu, L.F.; Wu, J.J. Analysis Ready Data of the Chinese GaoFen Satellite Data. Remote Sens. 2021, 13, 1709. [Google Scholar] [CrossRef]
- Zhong, B.; Wu, S.L.; Yang, A.X.; Liu, Q.H. An Improved Aerosol Optical Depth Retrieval Algorithm for Moderate to High Spatial Resolution Optical Remotely Sensed Imagery. Remote Sens. 2017, 9, 555. [Google Scholar] [CrossRef] [Green Version]
- Tian, Y.H.; Wang, Y.J.; Zhang, Y.; Knyazikhin, Y.; Bogaert, J.; Myneni, R.B. Radiative transfer based scaling of LAI retrievals from reflectance data of different resolutions. Remote Sens. Environ. 2003, 84, 143–159. [Google Scholar] [CrossRef]
- Wu, H.; Jiang, X.G.; Xi, X.H.; Li, C.R.; Li, Z.L. Comparison and analysis of two universal scaling methods. J. Remote Sens. 2009, 13, 183–189. [Google Scholar]
- Wen, J.G.; Wu, X.D.; Wang, J.P.; Tang, R.Q.; Ma, D.J.; Zeng, Q.C.; Gong, B.C.; Xiao, Q. Characterizing the Effect of Spatial Heterogeneity and the Deployment of Sampled Plots on the Uncertainty of Ground “Truth” on a Coarse Grid Scale: Case Study for Near-Infrared (NIR) Surface Reflectance. J. Geophys. Res.-Atmos. 2022, 127, 1–15. [Google Scholar] [CrossRef]
- Zhu, L.; Chen, J.; Tang, S.H.; Li, G.C.; Guo, Z.D. Inter-comparison and validation of the FY-3A/MERSI LAI product over mainland China. IEEE J. Sel. Top. Appl. Earth Observ. Remote Sens. 2014, 7, 458–468. [Google Scholar] [CrossRef]
- Hill, M.J.; Senarath, U.; Lee, A.; Zeppel, M.; Nightingale, J.M.; Williams, R.D.J.; McVicar, T.R. Assessment of the MODIS LAI product for Australian ecosystems. Remote Sens. Environ. 2006, 101, 495–518. [Google Scholar] [CrossRef]
- Zhang, X.; Liu, L.Y.; Wu, C.S.; Chen, X.D.; Gao, Y.; Xie, S.; Zhang, B. Development of a global 30 m impervious surface map using multisource and multitemporal remote sensing datasets with the Google Earth Engine platform. Earth Syst. Sci. Data 2020, 12, 1625–1648. [Google Scholar] [CrossRef]
- Li, A.N.; Jiang, J.G.; Bian, J.H.; Deng, W. Combining the matter element model with the associated function of probability transformation for multi-source remote sensing data classification in mountainous regions. ISPRS J. Photogramm. Remote Sens. 2012, 67, 80–92. [Google Scholar] [CrossRef]
- Fang, H.; Li, W.; Myneni, R.B. The Impact of Potential Land Cover Misclassification on MODIS Leaf Area Index (LAI) Estimation: A Statistical Perspective. Remote Sens. 2013, 5, 830–844. [Google Scholar] [CrossRef] [Green Version]
- Weiss, M.; Baret, F.; Smith, G.J.; Jonckheere, I.; Coppin, P. Review of methods for in situ leaf area index (LAI) determination: Part II. Estimation of LAI, errors and sampling. Agric. For. Meteorol. 2004, 121, 37–53. [Google Scholar] [CrossRef]
- Ariza-Carricondo, C.; Di Mauro, F.; de Beeck, M.O.; Roland, M.; Gielen, B.; Vitale, D.; Ceulemans, R.; Papale, D. A comparison of different methods for assessing leaf area index in four canopy types. Cent. Eur. For. J. 2019, 65, 67–80. [Google Scholar] [CrossRef] [Green Version]
- Song, B.W.; Liu, L.Y.; Du, S.S.; Zhang, X.; Chen, X.D.; Zhang, H.L. ValLAI_Crop, a validation dataset for coarse-resolution satellite LAI products over Chinese cropland. Sci. Data 2021, 8, 1–16. [Google Scholar] [CrossRef]
Figure 1.
Study area and ESU locations. Elevation data were derived from the advanced spaceborne thermal emission and reflection radiometer global digital elevation model (ASTER GDEM) data at 30 m spatial resolution; red points represent the ground ESUs. Base maps came from Google Satellite and Tianditu Satellite.

Figure 2.
Schematic diagram of the calculation of the semivariogram. (A) The window with low spatial heterogeneity. (B) The window with high spatial heterogeneity.
Figure 2.
Schematic diagram of the calculation of the semivariogram. (A) The window with low spatial heterogeneity. (B) The window with high spatial heterogeneity.

Figure 3.
The flowchart of MuSyQ LAI product validation. Path (a): The UAV_NDVI_0.5m was calculated first and the UAV_LAI_0.5m is then retrieved based on the NDVI-LAI model using the UAV_NDVI_0.5m images and field LAI measurements. The UAV_LAI_0.5m maps were then upscaled to generate the coarse-resolution 16 m reference LAI. Path (b): The UAV_NDVI_0.5m map was upscaled to derive the coarse-resolution UAV_NDVI_16m. The NDVI-LAI model was then used to retrieve the coarse-resolution UAV_LAI_16m. Path (c): The GF1_NDVI was calculated first and the GF1_LAI is then retrieved based on the NDVI-LAI model. The MuSyQ LAI was compared with reference LAI to obtain the overall error for the LAI product. ① The differences between path (a) and path (b) can reflect the the uncertainty of scale effects on the validation of the LAI products. ② The differences between path (b) and path (c) can reflect the uncertainty of the reflectance data on the validation of the LAI products. ③ The differences between path (c) and MuSyQ LAI can reflect the uncertainty of the retrieval model on the validation of the LAI products.

Figure 4.
Regression between in-situ measured LAI and NDVI.

Figure 5.
Validation of the LAI derived from UAV imagery using the field-measured LAI. The black dashed line indicates a 1:1 relationship and the solid line shows the linear regression between LAI2200_LAI and LAI_estimate.
Figure 5.
Validation of the LAI derived from UAV imagery using the field-measured LAI. The black dashed line indicates a 1:1 relationship and the solid line shows the linear regression between LAI2200_LAI and LAI_estimate.

Figure 6.
Validation result of MuSyQ LAI with reference LAI. The black dashed line indicates a 1:1 relationship and the solid line shows the linear regression between the reference LAI and MuSyQ LAI.
Figure 6.
Validation result of MuSyQ LAI with reference LAI. The black dashed line indicates a 1:1 relationship and the solid line shows the linear regression between the reference LAI and MuSyQ LAI.

Figure 7.
Differences between UAV and GF1 reflectance. (a) Differences between NDVI from GF-1 reflectance and from UAV reflectance. (b) Scatter between UAV_LAI_16m and GF1_LAI.
Figure 7.
Differences between UAV and GF1 reflectance. (a) Differences between NDVI from GF-1 reflectance and from UAV reflectance. (b) Scatter between UAV_LAI_16m and GF1_LAI.

Figure 8.
Comparison of MuSyQ LAI and GF1_LAI. The black dashed line indicates a 1:1 relationship and the solid line shows the linear regression between GF1_LAI and MuSyQ LAI.
Figure 8.
Comparison of MuSyQ LAI and GF1_LAI. The black dashed line indicates a 1:1 relationship and the solid line shows the linear regression between GF1_LAI and MuSyQ LAI.

Figure 9.
Scale effects analysis. Differences between Reference LAI and UAV_LAI_16m. The black dashed line indicates a 1:1 relationship and the solid line shows the linear regression between Reference LAI and UAV_LAI_16m.
Figure 9.
Scale effects analysis. Differences between Reference LAI and UAV_LAI_16m. The black dashed line indicates a 1:1 relationship and the solid line shows the linear regression between Reference LAI and UAV_LAI_16m.

Figure 10.
Differences between Sentinel-2 and GF1 reflectance. (a) Differences between red reflectance for GF-1 and Sentinel-2 data. (b) Differences between near infrared reflectance for GF-1 and Sentinel-2 data. (c) Differences between NDVI from GF-1 and Sentinel-2 reflectance. (d) Comparison of Sentinel2_LAI and GF1_LAI.

Figure 11.
Confusion matrix: the horizontal is the predicted label (GLC_FCS30) and the vertical direction is the true label. EBF and ENF are evergreen broadleaf forest and evergreen needleleaf forest, respectively.
Figure 11.
Confusion matrix: the horizontal is the predicted label (GLC_FCS30) and the vertical direction is the true label. EBF and ENF are evergreen broadleaf forest and evergreen needleleaf forest, respectively.

Figure 12.
Scatter plots of: (a) reference LAI values, (b) MuSyQ LAI values versus field measurements with high spatial representativeness, and (c) validation results for the MuSyQ LAI products using the reference LAI.
Figure 12.
Scatter plots of: (a) reference LAI values, (b) MuSyQ LAI values versus field measurements with high spatial representativeness, and (c) validation results for the MuSyQ LAI products using the reference LAI.


Table 1.
The acquisition time (day of year, DOY) and spatial resolutions for field LAI measurements, UAV images and MuSyQ LAI products.
Table 1.
The acquisition time (day of year, DOY) and spatial resolutions for field LAI measurements, UAV images and MuSyQ LAI products.
| Raw Data | Parameters | Time | Spatial Resolution/m |
|---|---|---|---|
| Field LAI measurements | LAI | 2020 DOY 292–296 | |
| UAV images | DN | 2020 DOY 294–297 | 0.5 |
| MuSyQ LAI | LAI | 2020 DOY 291–300 | 16 |
Table 2.
MuSyQ LAI validation results for different vegetation types.
| RMSE | Bias | R2 | |
|---|---|---|---|
| Grassland | 0.90 | −0.83 | 0.84 |
| Cropland | 1.66 | −1.23 | 0.28 |
| Shrubland | 1.68 | −1.38 | 0.14 |
| EBF | 0.90 | −0.77 | 0.42 |
Table 3.
Statistical metrics for different vegetation types. The mean LAI is the average LAI for each vegetation type. The standard deviation represents the spatial heterogeneity within the 16 m-resolution pixel. The scaling difference refers to the difference in mean LAI values obtained from two different up-scaling methods.
| Standard Deviation | Mean_LAI_ Reference LAI | Mean_LAI_ UAV_LAI_16m | Scaling Difference | |
|---|---|---|---|---|
| Grassland | 0.75 | 1.98 | 1.79 | −0.19 |
| Cropland | 1.22 | 2.22 | 1.72 | −0.50 |
| Shrubland | 0.83 | 2.02 | 1.80 | −0.22 |
| EBF | 0.83 | 1.86 | 1.62 | −0.24 |
Disclaimer/Publisher’s Note: The statements, opinions and data contained in all publications are solely those of the individual author(s) and contributor(s) and not of MDPI and/or the editor(s). MDPI and/or the editor(s) disclaim responsibility for any injury to people or property resulting from any ideas, methods, instructions or products referred to in the content. |
© 2023 by the authors. Licensee MDPI, Basel, Switzerland. This article is an open access article distributed under the terms and conditions of the Creative Commons Attribution (CC BY) license (https://creativecommons.org/licenses/by/4.0/).
Share and Cite
MDPI and ACS Style
Li, D.; Huang, Y.; Xiao, Y.; He, M.; Wen, J.; Li, Y.; Ma, M. Evaluation of the High-Resolution MuSyQ LAI Product over Heterogeneous Land Surfaces. Remote Sens. 2023, 15, 1238. https://0-doi-org.brum.beds.ac.uk/10.3390/rs15051238
AMA Style
Li D, Huang Y, Xiao Y, He M, Wen J, Li Y, Ma M. Evaluation of the High-Resolution MuSyQ LAI Product over Heterogeneous Land Surfaces. Remote Sensing. 2023; 15(5):1238. https://0-doi-org.brum.beds.ac.uk/10.3390/rs15051238
Chicago/Turabian StyleLi, Dandan, Yajun Huang, Yao Xiao, Min He, Jianguang Wen, Yuanqing Li, and Mingguo Ma. 2023. "Evaluation of the High-Resolution MuSyQ LAI Product over Heterogeneous Land Surfaces" Remote Sensing 15, no. 5: 1238. https://0-doi-org.brum.beds.ac.uk/10.3390/rs15051238
Note that from the first issue of 2016, this journal uses article numbers instead of page numbers. See further details here.