Article

Historical Trend Analysis and Forecasting of Shoreline Change at the Nile Delta Using RS Data and GIS with the DSAS Tool

by
Hany F. Abd-Elhamid
1,2,
Martina Zeleňáková
3,
Jacek Barańczuk
4,*,
Marcela Bindzarova Gergelova
5 and
Mohamed Mahdy
6
1
Department of Water and Water Structures Engineering, Faculty of Engineering, Zagazig University, Zagazig 44519, Egypt
2
Department of Environmental Engineering, Faculty of Civil Engineering, Technical University of Kosice, 040 01 Košice, Slovakia
3
Institute of Sustainable and Circular Construction, Faculty of Civil Engineering, Technical University of Kosice, 040 01 Košice, Slovakia
4
Coastal City Living Lab, University of Gdansk, 80-204 Gdansk, Poland
5
Institute of Geodesy, Cartography and Geographical Information Systems, Faculty of Mining, Ecology, Process Control and Geotechnology, Technical University of Kosice, 042 00 Košice, Slovakia
6
Department of Geography, Faculty of Art, Zagazig University, Zagazig 44519, Egypt
*
Author to whom correspondence should be addressed.
Submission received: 23 February 2023 / Revised: 18 March 2023 / Accepted: 22 March 2023 / Published: 23 March 2023
(This article belongs to the Special Issue Remote Sensing Analysis for Flood Risk)

Abstract

:
Coastal areas are increasingly endangered by climate change and associated sea level rise, which could have serious consequences, such as shoreline erosion and coastal city submergence. The current study aims to conduct a historical trend analysis (HTA) and predict the shoreline changes of the Nile Delta coasts. The Digital Shoreline Analysis System (DSAS) software, with the GIS environment, is used for monitoring the shoreline changes using a number of statistical methods (SCE, NSM, EPR, WLR and LRR). Satellite images from 1974 to 2022 were collected and geometrically corrected using supervised classification to detect the shoreline change of the Nile Delta. The GIS was used for detecting and monitoring changes in the shoreline, as well as forecasting future changes in the shoreline for the next 10 and 20 years (2033–2043). The critical sections of the Nile Delta were identified, and a time series analysis of shoreline changes was conducted. For each section, linear equations were established to predict probable changes in the shoreline. Between 1974 and 2022, the shoreline of the Nile Delta moved inland in different directions due to coastal erosion, and predictions indicate that this erosion will continue until both 2033 and 2043, particularly affecting the Rosetta and Damietta sections. The erosion rate ranged between 30–60 and 10–25 m/year at Rosetta and Damietta, respectively, but at Manzala, it ranged between 8–15 m/year. Continued erosion of the Nile Delta shoreline could have severe consequences that could affect the inhabitants, economy, buildings, roads, railways, and ports. These areas need an integrated coastal management strategy which incorporates increasing consciousness, urban development, and the implementation of rules and adaptation plans. The results of the current study and forecasting the shoreline change could help in protecting such areas.

1. Introduction

Residents in coastal areas may experience a number of challenges as a result of climate change and accompanying sea level rise (SLR). Within the 20th century, the mean sea level has risen by 0.10–0.20 m [1] and is expected to reach 0.20–0.88 m by the end of the 21st century [2]. These changes may have several negative effects on coastal zones, such as flooding, erosion, loss of wetlands, saltwater intrusion, and damage to agricultural lands. The Mediterranean basin is considered to be among the most sensitive areas to climate change. Nicholls and Hoozemans (1996) [3] reported that the Mediterranean basin’s southern regions face more threats than its northern regions. Monitoring and predicting changes occurring in the coastline of these areas is very important in coastal area planning and management [4].
Egypt is among the top ten countries that may be extremely affected by changes in climate and the Mediterranean water levels [5]. Egypt is located on the southern shore of the Mediterranean Sea and is characterized by its low elevation, which increases the possibility of risks to sea level rise. Climate change and SLR effects have been considered in several studies worldwide [6,7,8], which have shown the impact of climate change on different locations throughout the world. Further, some research has been carried out in Egypt on maintaining the coasts [9,10,11], and they have presented the impacts on costs and how the coasts can be protected from imminent climate change. The results of these studies showed that some areas in Egypt have been listed as high-risk areas, including the Nile Delta, Alexandria, Port Said, Rosetta, and Damietta.
The Nile Delta, with its lowlands, is considered the most significant Egyptian area on the Mediterranean coast that will be extremely affected by coastal erosion. Some studies evaluated the effects of rising sea levels on Egypt’s northern coasts [12,13,14,15] and revealed that Egypt will face a number of effects, including the loss of agricultural and fishing land, the inundation and flooding of beaches, and a decline in tourism. Additionally, seawater intrusion causes losses in agricultural output and freshwater aquifer contamination, as well as soil salinity and water logging. Chen et al. (1992) [16] simulated the sea level and climatic oscillation effects on the Delta shoreline modifications over time. Basiouny et al. (2017) [17] used satellite imagery to analyze the shoreline change at Ras El-Hekma in Northwest Egypt that occurred between 1973 and 2015. Abdel Hamid et al. (1992) [18] employed satellite data to track the Nile Delta’s response to climate change.
In addition to climate change impacts on coastal areas, other factors could have apparent effects, including tides, waves, man-made infrastructures, and the construction of dams, which prevent sediment from flowing into the sea and thus protecting such areas. All these parameters should be assessed for monitoring and predicting the changes occurring in the coast. Seasonal waves create longshore currents with speeds of 0.9 m/s and a sediment flux along the shoreline of the Nile Delta, with large storm waves in the winter [19]. During spring and summer, swells could cause sediment transport, depending on the local shoreline orientation [9]. Frihy and Deabes, 2011 [20], collected and analyzed weave climatology data from 1985 to 1990 at Alexandria and Ras El-Bar. The results showed that the wave height was 0.75 m, the wave period was 7 to 8 s during winter and decreased to 5 s in summer. The Nile Delta coasts have a low tidal range, with a mean tidal range at Lake Burullus of 14 cm over the last 20 years [21], with a 60 cm variation in the daily mean sea level at Port Said for the period 1980–1986 [22]. Semi-diurnal tidal waves with a range of less than 30 cm are present along the Egyptian Mediterranean coast. Iskander et al. (2007) [23] observed that the shoreline may have been affected by the increasing trend in sea wave height from 2.6 to 2.9 cm/year along the Nile Delta coasts from 1985 to 2010.
Aside from the natural factors that affect the shoreline, such as waves, tides, and winds, man-made structures also contribute to affecting coasts. Seawalls and breakwaters, among other coastal protection structures, have been created along the Nile Delta beaches to prevent beach erosion and decrease inlet siltation at Rosetta, Damietta, and Ras El Bar Resort [24]. These defense measures assisted in halting coastline erosion and creating sedimentation forms in this region. They also assisted in slowing down the migration of beach sediments, which accelerated erosion in other coastal areas.
The High Dam project is another man-made problem that has a significant impact on the Nile Delta’s shoreline. The yearly discharge of sediment from the Nile River at Aswan was estimated to be 160 × 1012 and m3/year [25]. The Aswan High Dam was completed in 1964 to regulate the Nile’s flow, produce energy, and supply water for irrigation. The amount of sediment transported at the river mouths at Damietta and Rosetta ranges between (100–115) × 106 m3/year [24,26]; however, the dam has affected the sediment flux, making it insufficient to nourish the Nile Delta shoreline and stop coastal erosion [27,28,29,30]. As a result, much effort has gone into constructing coastal defense systems to safeguard portions of the coast that are particularly important from a socio-economic standpoint, such as public beaches [31]. Current coastal erosion poses a significant environmental risk because there is currently no comprehensive plan to protect the entire Nile Delta coast [32].
Monitoring shoreline changes due to the above natural and man-made aspects could be aided by RS and GIS. Satellite data are useful in affording an indication on broad and regional scales. RS and satellite images data can be used in risk monitoring and management [33]. GIS makes it possible to handle, store, analyze, and produce output data that can be saved in a database. GIS can help in processing huge amounts of spatial data and information obtained from measurements and observations. Gergelova et al. (2014) [34] presented a study for building accurate representations of historical locations utilizing cutting-edge methodologies for gathering and processing spatial data in GIS. The integration of GIS in terms of hydrodynamic simulation modeling is resolved for the subject area of interest, providing real beneficial information. The process of modeling floods in urban areas is a priority for hydrodynamic modeling using GIS tools [34]. A combined RS and GIS approach was developed for mapping the historical Rin Mining landscapes in Northwest Iberia [35]. Gergelova et al. (2013) [36] presented the capability of hydrological models with GIS tools for delineating flood events that threaten urbanized areas. Under the assumption of unidentified sources of blurring, a method based on the local binary pattern was created to obtain clear remote sensing images [37]. Tang et al. (2022) [38] employed the capsule-encoder-decoder approach to recover buildings from remote sensing images for the Yellow River, Massachusetts, China.
Satellite data is a powerful tool for providing an indication of large and small scales data. Satellite data were employed for monitoring shoreline changes in the Mediterranean basin [39]. Shoreline change can be tracked using ArcGIS and the Digital Shoreline Analysis System (DSAS) software. A number of researchers employed DSAS as a geoprocessing tool integrated within ArcGIS environment to measure, quantify, compute, and monitor shoreline changes. DSAS is a freely available extension linked to the ArcGIS environment [39]. It has been updated over time, and multiple versions exist, allowing its use with the ArcGIS environment. DSAS is an effective tool that can be utilized in a variety of investigations, including [40]:
-
Monitoring the shoreline changes;
-
Mapping historic changes of shoreline position over a period of time;
-
Assessing the trends of a shoreline;
-
Evaluating coastal behavior and shoreline dynamics;
-
Evaluating time-series of changes at certain places of a shoreline;
-
Historical trend analysis, coastal system dynamics, and cliff geometry modeling;
-
Forecasting the behavior of shorelines utilizing previous rate-of-change trends as an indicator of future trends while assuming consistency in the physical, natural, or human-caused forces that have led to the changes that have been detected at the site.
Based on the measured differences in the shoreline positions associated with different time periods, DSAS can be used to determine how a shoreline has changed. DSAS can provide a variety of statistical measures, including [39]:
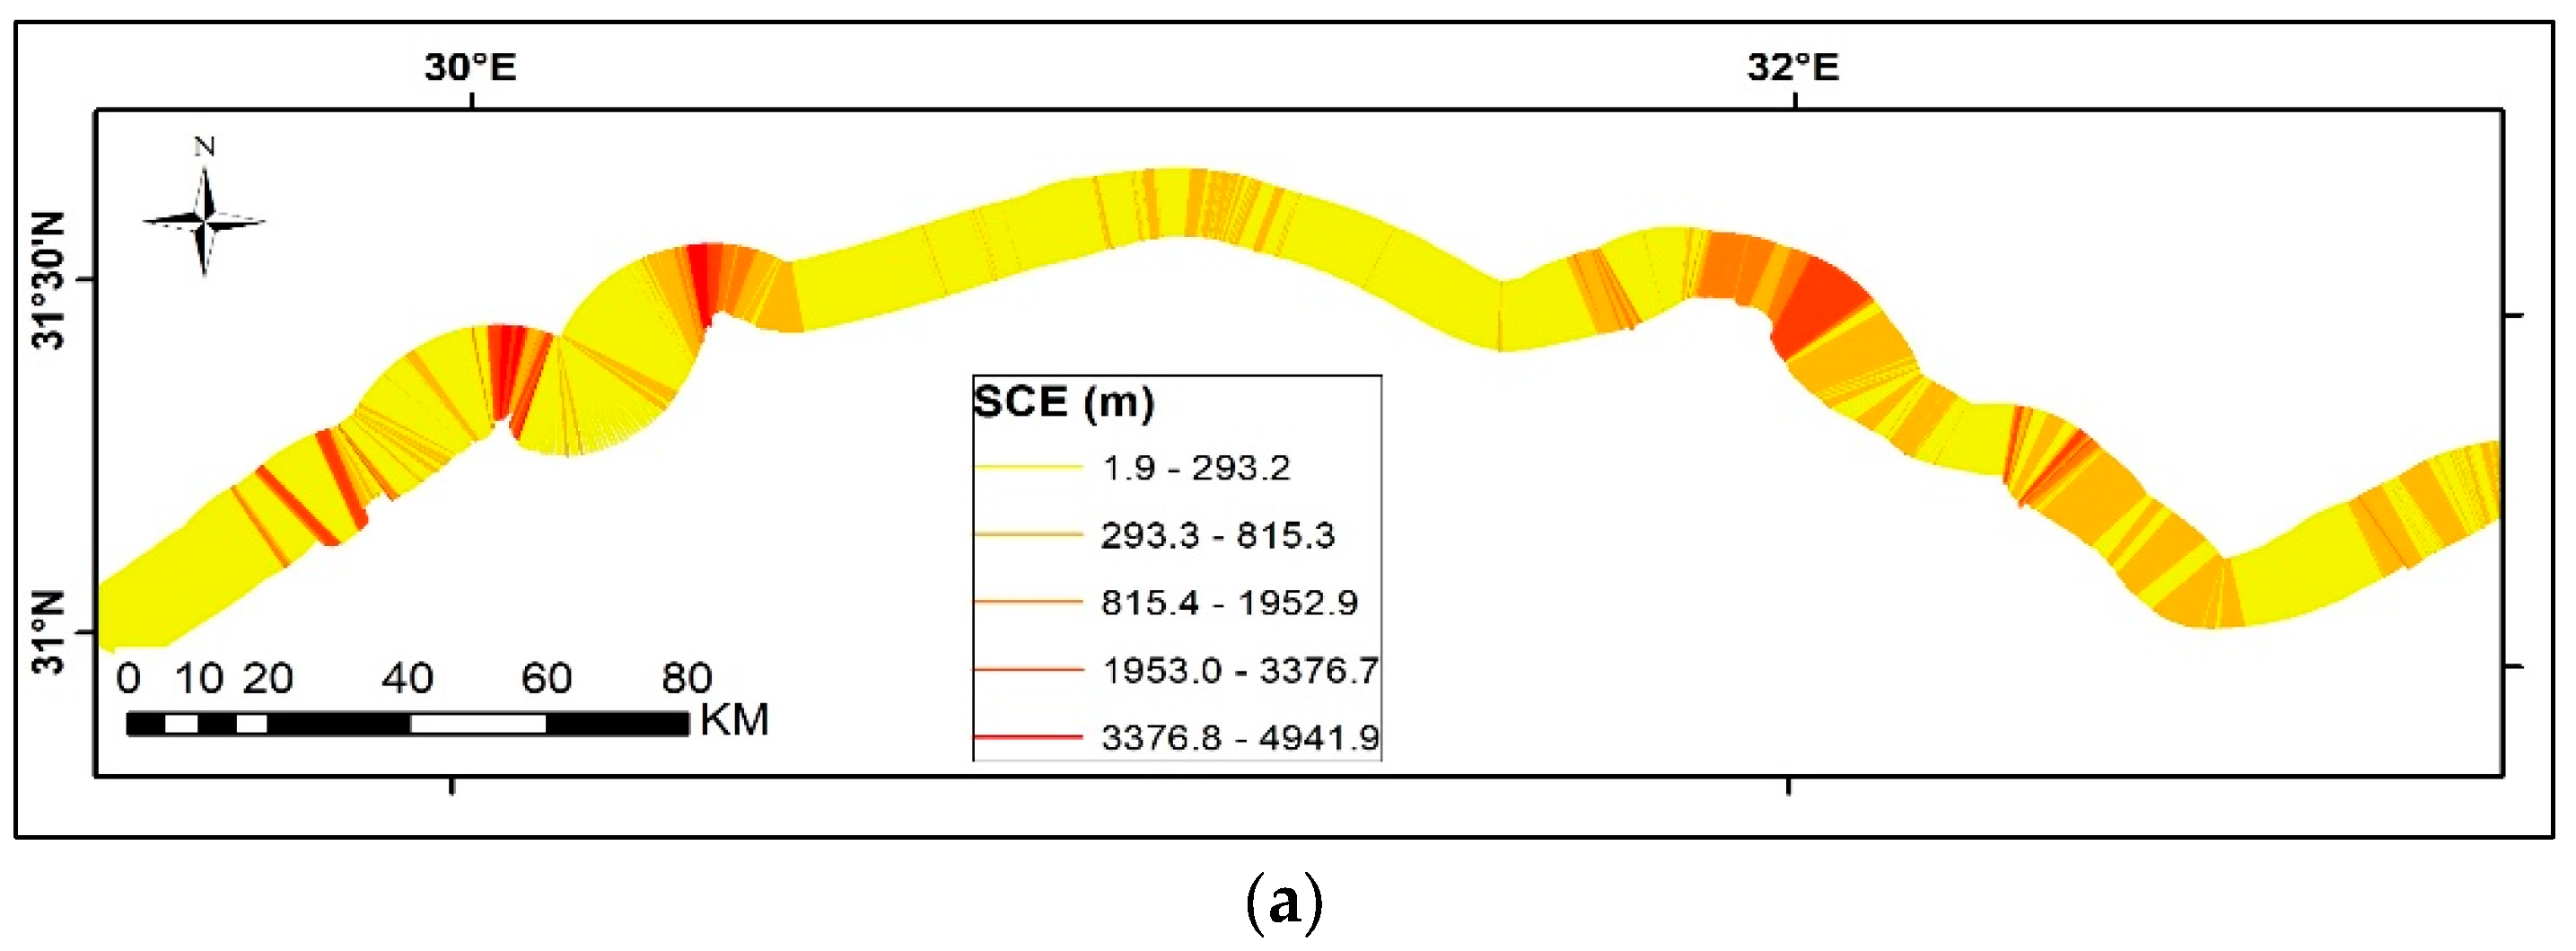
  • SCE: Shoreline change envelope, which represents the total change in shoreline (m);
  • NSM: Net shoreline movement, which represents the distance between the oldest and youngest shorelines (m);
  • EPR: End-point rate, which is determined by dividing the distance between the oldest and youngest coastline points using the time elapsed between them (m/year);
  • LRR: Linear regression rate, which determines the rate of change statistically by fitting a least square regression to all shorelines at specific transects (m/year);
  • WLR: Weighted linear regression.
DSAS has been used in numerous studies for monitoring coastal behavior, shoreline changes, historical trend analysis, coastal system dynamics and cliff geometry estimations. DSAS was used for a historical record of coastline dynamics by a number of researchers [41,42,43,44]. However, DSAS was also applied for shoreline variation, shoreline erosion, and short-time coastal changes [45,46,47,48,49,50,51], and was further used for gully development and evolution by the authors of [52,53,54,55,56,57]. DSAS was used for cliff retreat and erosion, but [58,59] used DSAS for shoreline/cliff measurement and modeling. A number of researchers have used DSAS for monitoring shoreline changes. Gonçalves et al. (2019) [60] used digital surface models (DSM) resulting from airborne LiDAR and low cost UAS (unmanned aerial systems) to monitor shoreline changes from 2011 to 2015 on Furadouro beach in the northern part of Portugal. Shenbagaraj et al. (2021) [61] used an unmanned aerial vehicle (UAV) remote sensing to monitor shoreline changes between 1989 and 2017 for the Cuddalore District, Tamil Nadu, India. Amodio et al. (2022) [62] established a method for using DEMs based on UAV-derived data for assessing the short-term morphological-topographic changes of a coastal system along a stretch of beach affected by erosion, located along the Central Adriatic coast during the summers of 2019 and 2020. Abd-Elhamid et al. (2022) [63] presented a study to assess the impact of climate change and associated SLR on the shoreline of Alexandria using DSAS tool for the period 1985–2021. The study showed that the Alexandria shoreline has been affected by SLR especially in its eastern parts, at Abo Qir Bay.
Only a few studies have been conducted to evaluate the changes in the Nile Delta shoreline, taking natural and man-made aspects into consideration, and focusing on small sites along the shoreline. In this study, RS and GIS with the DSAS tool are used for historical trend analysis (HTA) of the Nile Delta shoreline based on historical data from satellite images collected for 49 years, from 1974 to 2022. In addition, DSAS is used to predict future changes in the shoreline for the next 10 and 20 years (2033 and 2043). Monitoring and forecasting the shoreline change could help in coastal area planning and management.

2. Materials and Methods
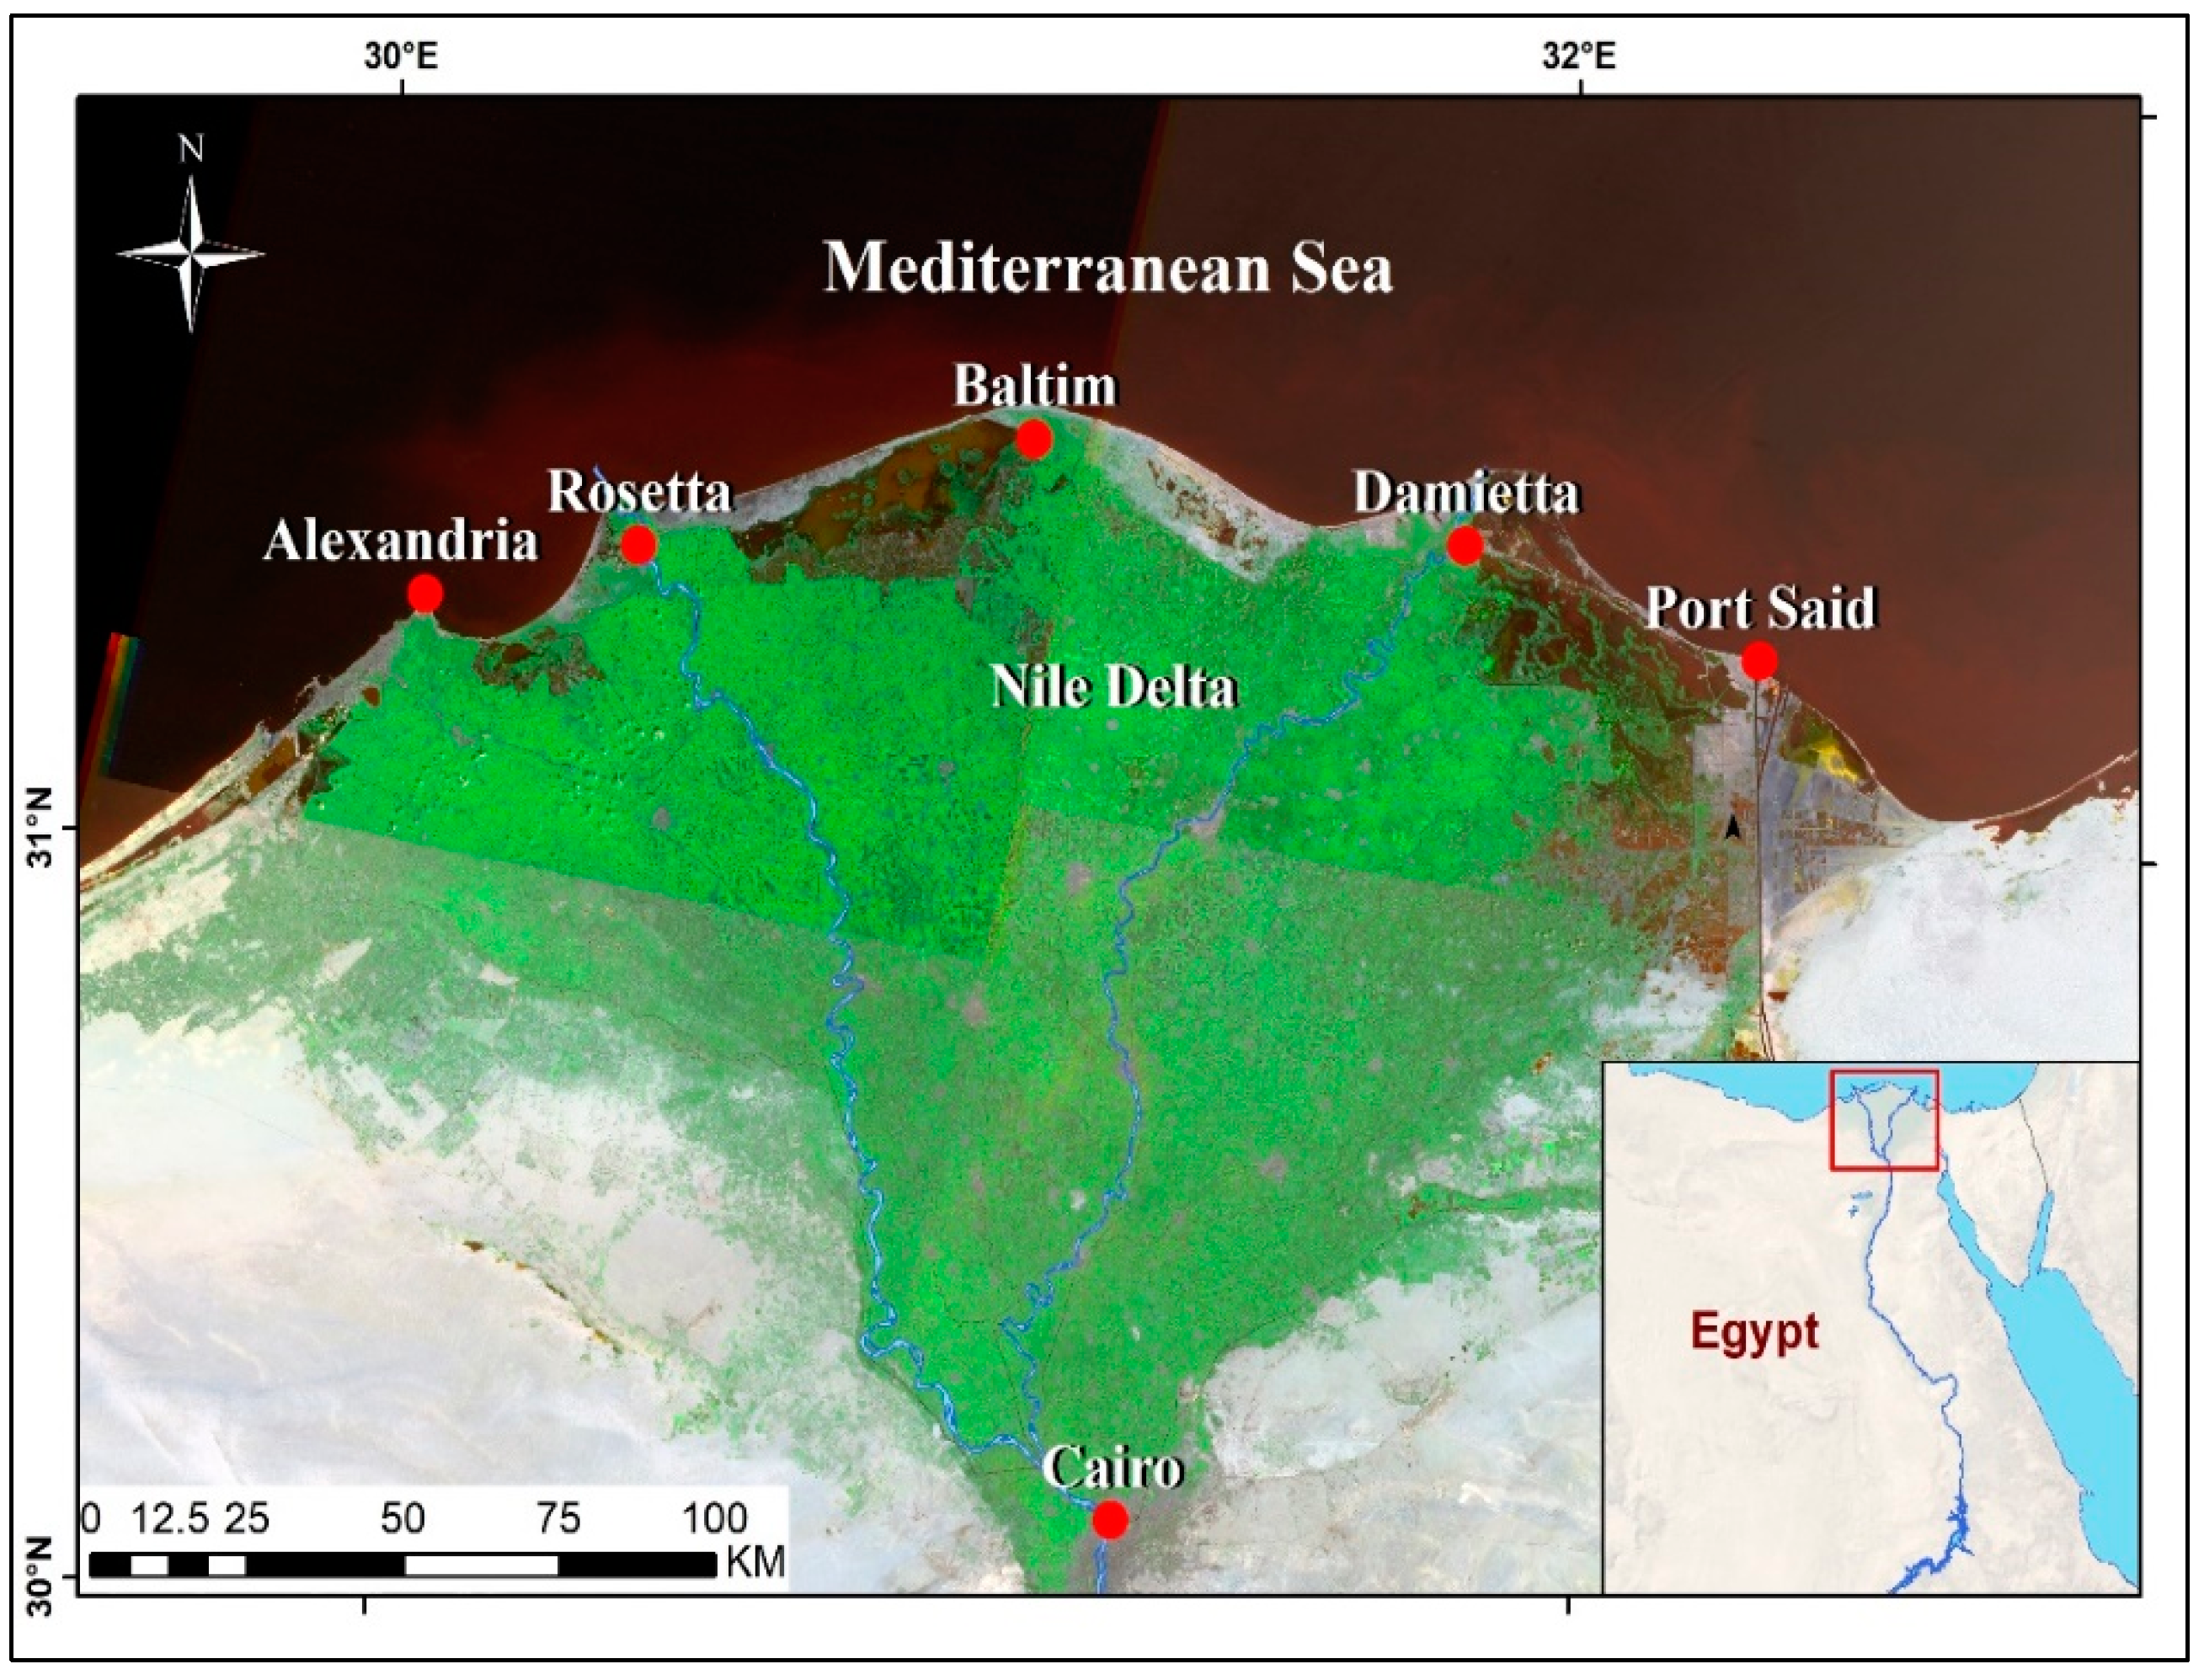
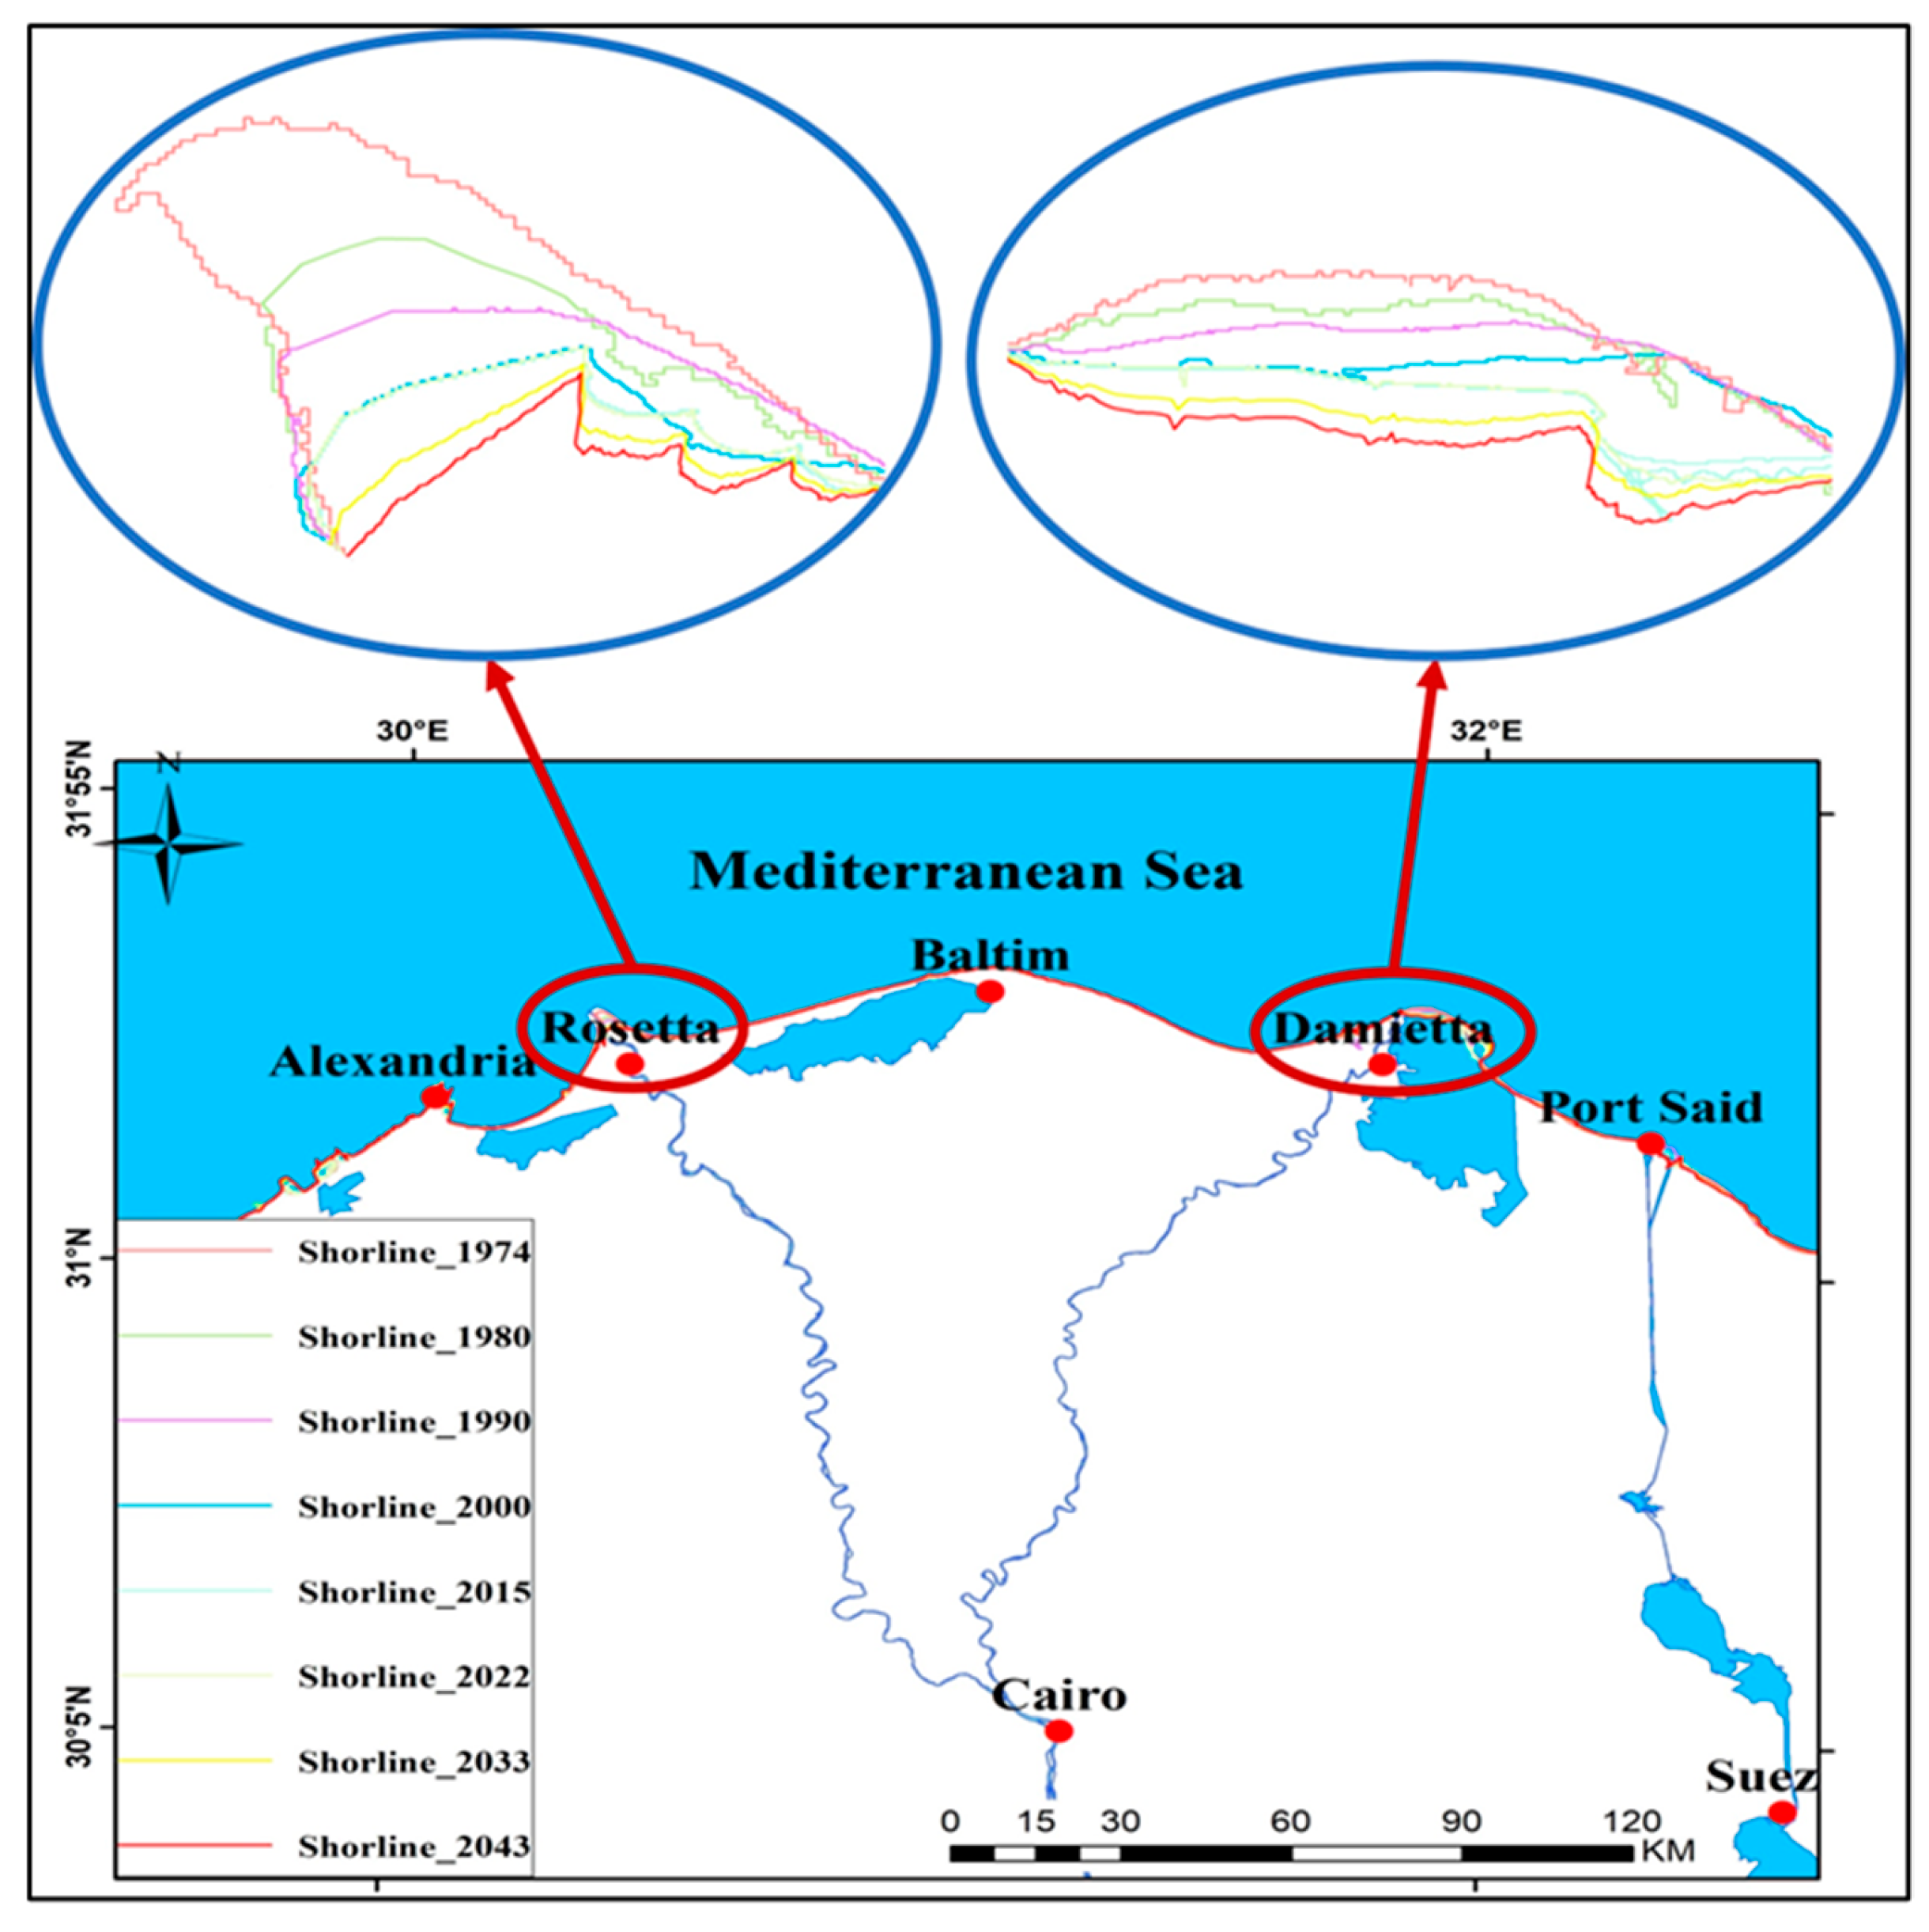
2.1. Study Area

Long parts of the Egyptian Mediterranean coast are exposed to submergence hazards due to its low levels [13]. The Egyptian Mediterranean coastal zone includes several important cities, such as Alexandria, Port Said, Rosetta, and Damietta, that may be affected by climate change and SLR. The Nile Delta is among the largest deltas in the world. It is located in Northern Egypt on the Mediterranean Sea, where the Nile River branches and drains out into the sea (Figure 1). The length of the Delta shoreline on the Mediterranean is 240 km. The Delta begins slightly below Cairo in the south and extends for approximately 160 km to the north, expanding over an area of about 22,000 km2. The Nile Delta is bounded by the Western Desert from the west and the Eastern Desert and Suez Canal from the east. It is located between latitudes 30°25′ and 31°30′ North, and longitudes 29°50′ and 30°15′ East. The population in the Delta region is 39 million. The main activity in the Delta is agriculture, with some industries that are located in the northern cities.
The Nile Delta climate is characterized by hot summers and mild winters. The temperature in winter ranges between 18 and 19 °C, and 33 °C in the summer. January is the coldest month and August is the hottest month. Precipitation is rare excluding along the Mediterranean shores, where the annual rainfall is about 200 mm. The very low precipitation in the inland areas is only 22 mm/year at Cairo. The mean potential evapotranspiration is 570–1140 mm/year in the north and exceeds 1140 mm/year in the south. The Nile Delta belongs to the hyper-aridic climate region [64]. The difference in elevation between Cairo’s and the northern coasts is around 18 m. However, there are coastal strips of lowlands on the western side of the Nile Delta in addition to Mariut and Idku Lakes that are located in low-elevation areas. Manzala Lake and Burullus Lake are also located in the Nile Delta. These areas have been extremely affected by sea level rise.
The Nile Delta includes extensive agricultural areas which represent the main source of agricultural production in Egypt (see Figure 2). In addition, some important industrial and commercial cities are located on the northern coast (e.g., Alexandria, Port Said, Damietta, and Rosetta). Recently, due to climate change and SLR, these cities on the coasts and some other cities in the Delta are facing the danger of subsidence which requires extensive studies for monitoring and forecasting the shoreline dynamics and assessing the appropriate methods of protection.

2.2. Methodology

RS and GIS are among the advanced tools that link climate data with its spatial-temporal framework to demonstrate changes that may occur due to climate change. DSAS is an important tool that can be used for monitoring and forecasting shoreline changes. In this study, RS and GIS with the DSAS tool are used to monitor changes in the Nile Delta shoreline during the period 1974–2022. Figure 3 shows a flow chart that illustrates the methodology used in this study. The work was completed in the following four key steps:
  • Data collection represents the assembly of satellite images for the Nile Delta from 1974 to 2022 for six periods (1974–1980–1990–2000–2015–2022). LANDSAT satellite images with a resolution of 30 and 60 m were downloaded from USGS using Landsat Collection 2 Level-1 (C2L1), (http://www.earthexplorer.usgs.gov, 23 September 2022). Table 1 presents the specification of the satellite data.
  • Data processing represents mosaicking that involves combining multiple images into a single composite image for each period to cover the study area. The geometric and radiometric corrections were then conducted. Radiometric correction was important to reduce atmospheric effects. Short-wave infrared (SWIR) light was applied to delineate the shoreline boundary. The ENVI 5.3 software provided the color slice algorithms that were applied to differentiate between land and water surfaces. The export color slice to shapefile and the shoreline changes were examined using ArcGIS by creating an overlap of the shoreline layers. A baseline was then created from an offset baseline continued from the existing shoreline by buffering; the polygon buffer was converted to a polyline, and the unwanted segments were split and removed. One of the most crucial steps in the shoreline change analysis was the baseline, which served as the starting point for all transects.
  • Mapping and forecasting of the shoreline change represents mapping the shoreline change from numerous historical shoreline positions and using it to forecast future shoreline features. DSAS is a free ArcGIS tool created by the USGS that can be applied for mapping and forecasting a shoreline in the long-term of 10 and 20 years.
  • Data presentation is when the database is represented and given to decision-makers in the form of maps, tables, graphs, photographs, and reports.

3. Results

3.1. Historical Trend Analysis of the Nile Delta Shoreline for the Period 1974–2022

GIS with DSAS was used to inspect the historical trend of the Nile Delta shoreline from 1974 to 2022. DSAS was used to digitize the shoreline changes from the historical maps that were accessible as georeferenced GeoTiffs from Digimap. DSAS is a tool used for monitoring the shoreline changes using a number of statistical methods that were calculated to determine the oldest (1974) and the latest (2022) shorelines to show the overall change in shoreline position for the 49-year period.
Figure 4a–f show the historical trend of the shoreline in the Nile Delta for the evaluated six periods (1974–1980–1990–2000–2015–2022). The use of using six historical maps in the case study emphasizes the importance of the archival datasets accessibility for historical trend analysis (HTA). The maps utilized in this study are the six historical datasets available at the Ordnance Survey. The Nile Delta shoreline was divided by DSAS into 8382 transects from Alexandria to Port Said. For a HTA of the Nile Delta shoreline, 11 transects were selected at critical sites: 1 at Alexandria (ID:1100), Idku (ID:1800), Lake Burullus (ID:3000), Baltim (ID:3800), Gamasa (ID:4745), Lake Manzala (ID:6000), and Port Said (ID:6400), and 2 sections at Rosetta (ID:2360, 2400) and Damietta (ID:5400, 5450). It was observed that the shoreline along the Nile Delta coasts has changed, but three areas have been extremely affected by the coastal erosion, and the shoreline has further moved inland at Rosetta, Damietta, and Lake Manzala. The maximum net shoreline movement (NSM) is 4941.95 m, in addition to the maximum erosion rate (end-point rate, EPR), which is 106.96 m/year. Specific sections are selected and will be discussed in more detail in Section 3.4.

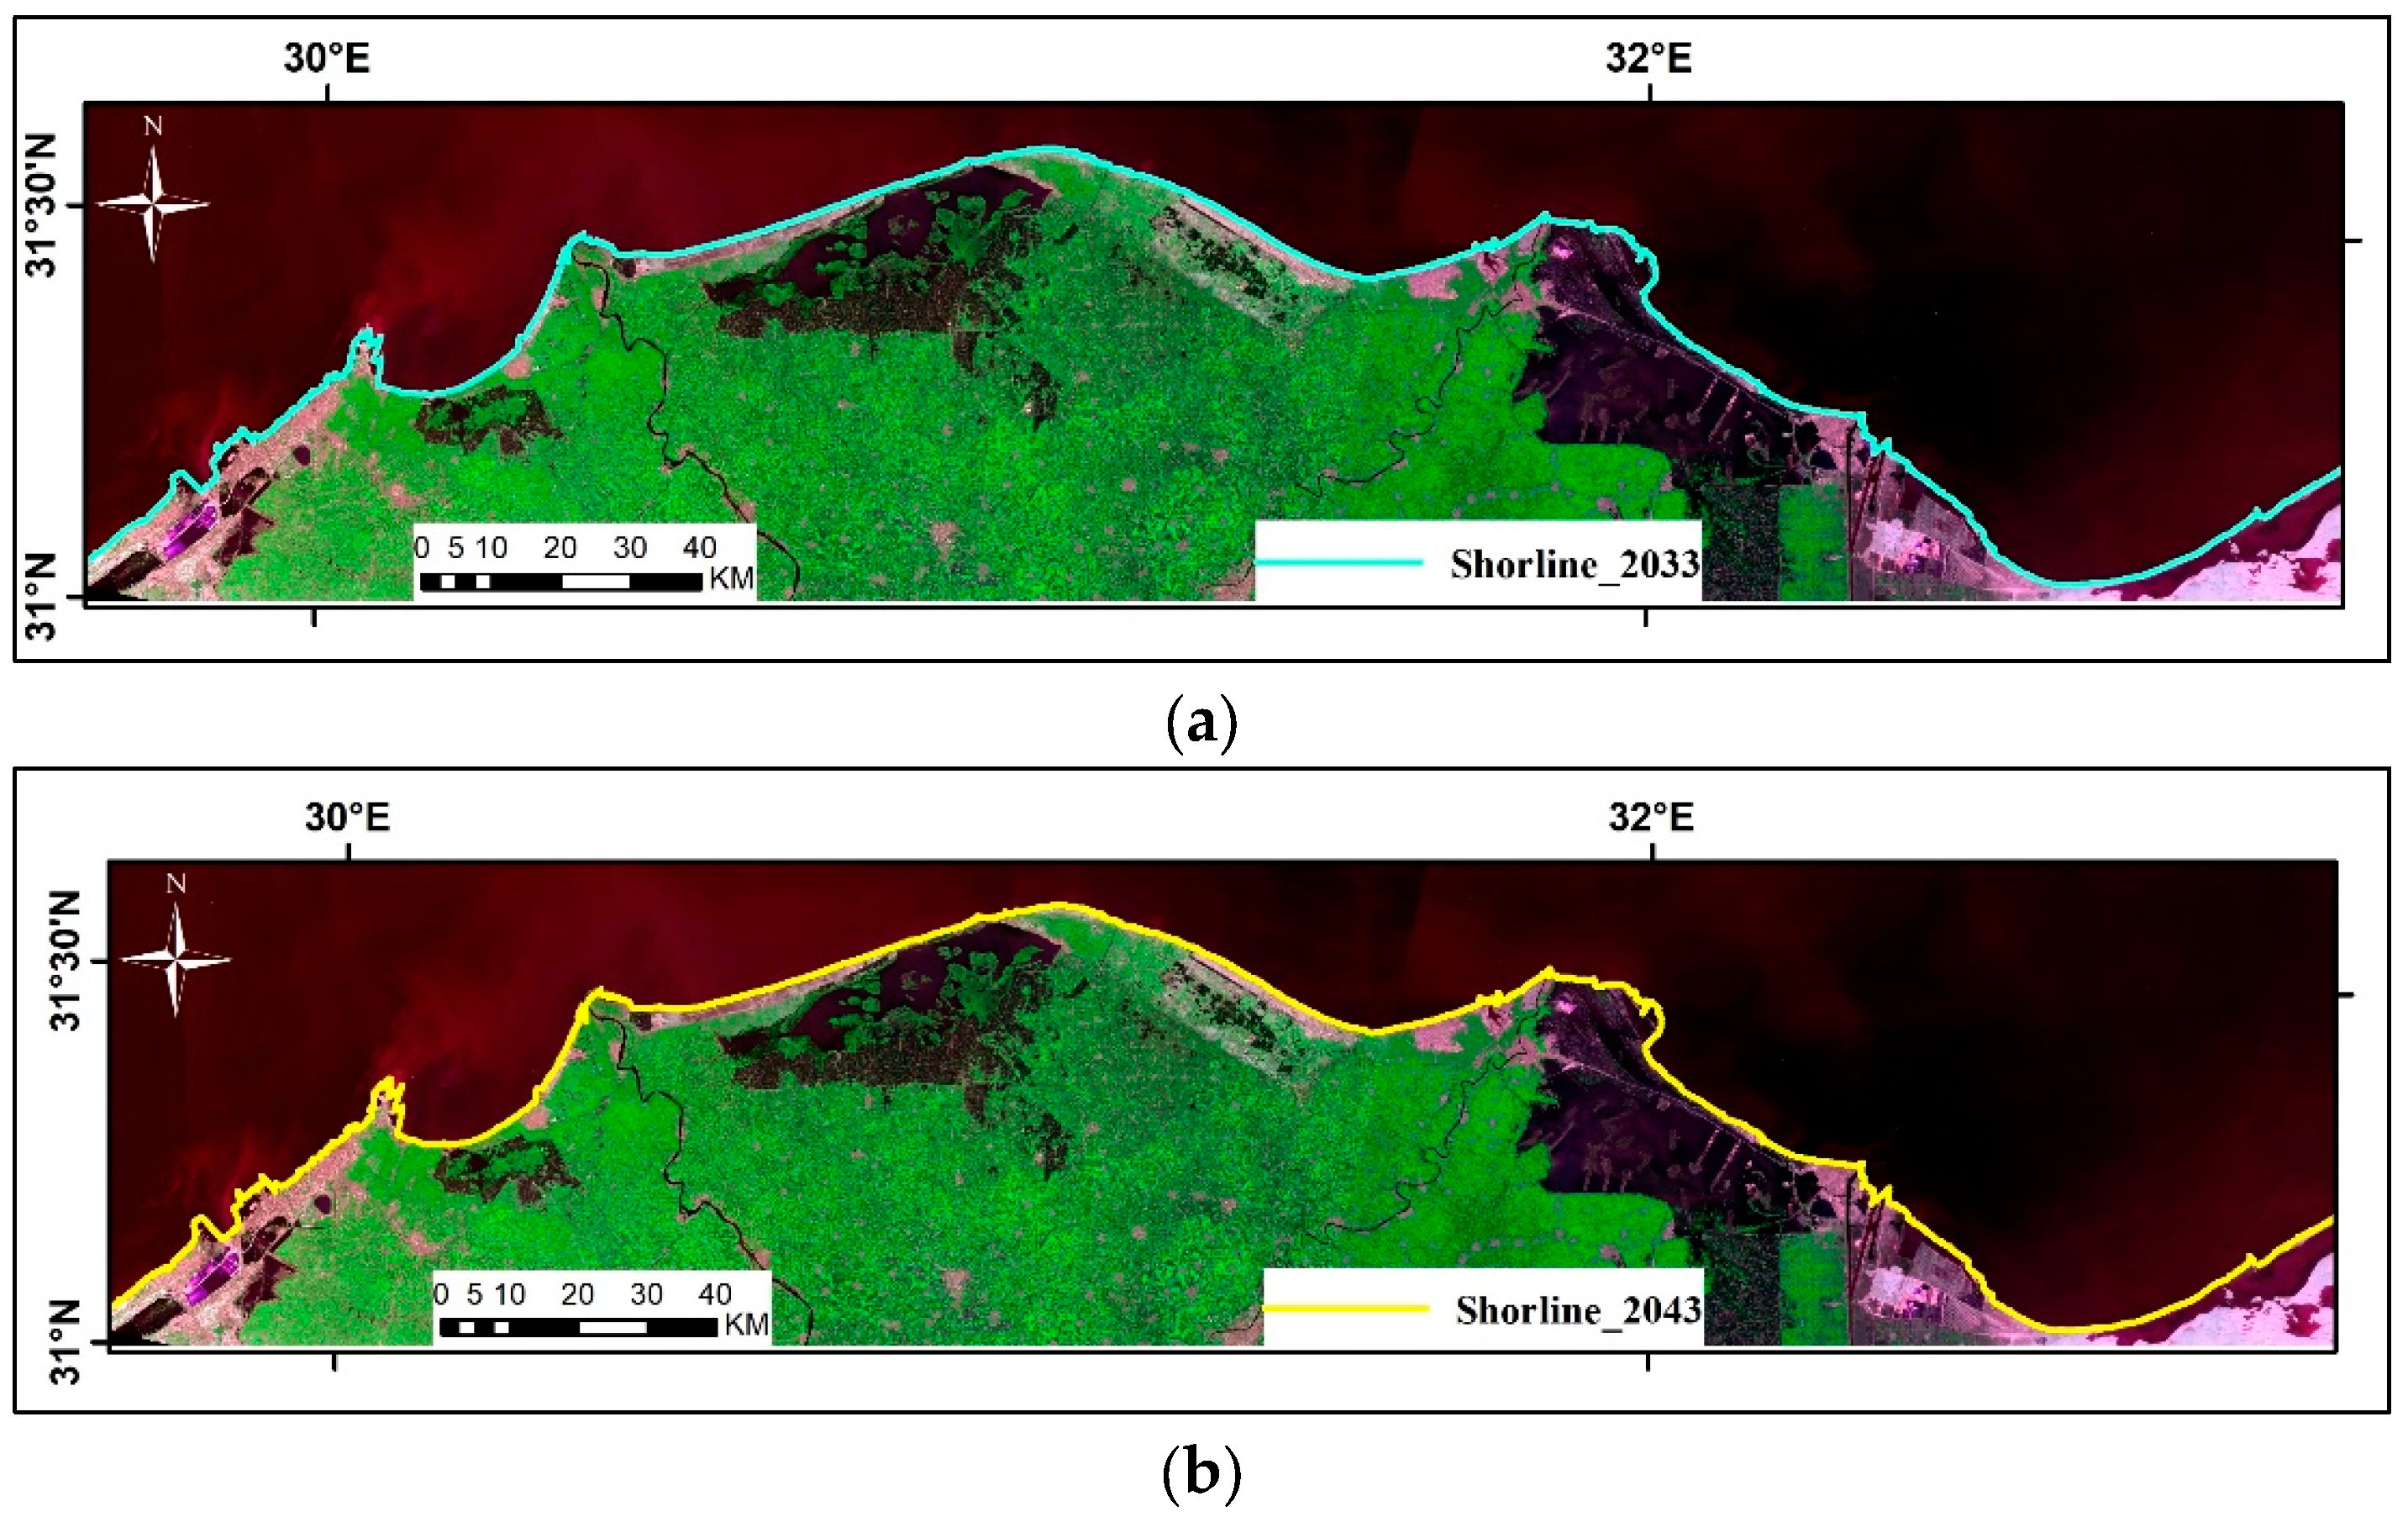
3.2. Prediction of Shoreline Changes in the Nile Delta for 10 and 20 Years

After the analysis of the historical trend of the Nile Delta shoreline, DSAS and GIS were used to forecast shoreline changes in the Nile Delta after 10 and 20 years. DSAS includes Kalman filtering-based approach that can be employed for shoreline prediction. Based on the historical shoreline location data, this tool enables future estimates to be created for the next 10 and 20 years. This process was thus carried out using the Kalman filter [65] developed by Long and Plant (2012) [66]. The Kalman filter is a filter that makes future predictions based on historical data from a modeled system. Instead of being referred to as a filter, this approach might be thought of as a prediction tool. The forecasting of the Nile Delta shoreline after 10 and 20 years is shown in Figure 5a,b. The results showed that maximum shoreline movement will occur at Damietta for 891.65 m and 455.93 m in 2033 and 2043, respectively. More details for the selected specific sections will be discussed in Section 3.4.

3.3. Statistical Analysis of Parameters Using DSAS from 1974 to 2043

One of the commonly used methods for detecting shoreline changes is DSAS, where the shoreline changes can be investigated using statistical methods. In the current study, DSAS with the ArcGIS environment are applied for monitoring shoreline changes using a number of statistical methods, including (SCE, NSM, EPR, WLR and LRR). DSAS can explore the temporal and spatial dynamics of shoreline change and the geomorphic variability along the coast due to its capacity to utilize all shoreline positions (SCE), cumulative shoreline movement (NSM), and time variations (EPR), which capture the rate-range of the historical dataset.
The shoreline changes statistics (SCE, NSM EPR, WLR and LRR) can show the patterns of the Nile Delta shorelines. The pattern of spatial and temporal movements can also be determined using other statistical methods. However, SCE is the only measure that takes into account all shorelines, and it was thus chosen because it has the capacity to provide a wide range of variability. The difference between the earliest and most recent surveys is reflected by NSM and EPR. The distance between the earliest shorelines (1974) and the recent shorelines (2022) is described by NSM, which shows the general change in shoreline position over the study period from 1974 to 2022 (49 years). EPR converts this net shoreline movement into an annual rate of shoreline change by dividing the distance of the shoreline movement from the earliest to the most recent shorelines by the time period passed.
Table 2 shows the different statistics calculated at the selected 11 transects. The shoreline of the Nile Delta was analyzed and predicted using SCE, NSM, EPR, LRR, and WLR methodologies. In the EPR approach, a shoreline of two periods is sufficient for a shoreline change study, whereas the LRR and WLR methods require a shoreline of at least three periods for the shoreline change analysis. In shoreline prediction, at least four coastline periods are used (DSAS, Kalman filter-based prediction method). One of the most popular techniques in shoreline change analysis studies conducted in various parts of the world is EPR. In this method, the distance of shoreline movement is divided by the time that has passed between the oldest and most recent shorelines [67]. The obtained results for the Nile Delta are shown in Table 2. Furthermore, 10 and 20 years projections were made in the analyses for the study area.
Figure 6 shows the scales and rates of shoreline change at the Nile Delta for the period 1974–2043. The results of the SCE with NSM show major changes in the shoreline between the earliest (1974) and most recent (2022) shorelines. The maximum SCE is 4941.95 m, which receded at Damietta for the period 1974–2043, followed by Rosetta and Lake Manzala. At Lake Burullus, the change in the shoreline is minor because the lake is very close to the sea and the water level is the same. However, some transects, such as Alexandria, Idko, Baltim, Gamasa, and Port Said, recorded minor changes in the shoreline due to the level and protection measures implemented by the government. The maximum EPR of 102.96 m/year is observed at Damietta. Analysis of the critical sections is presented in the following section.

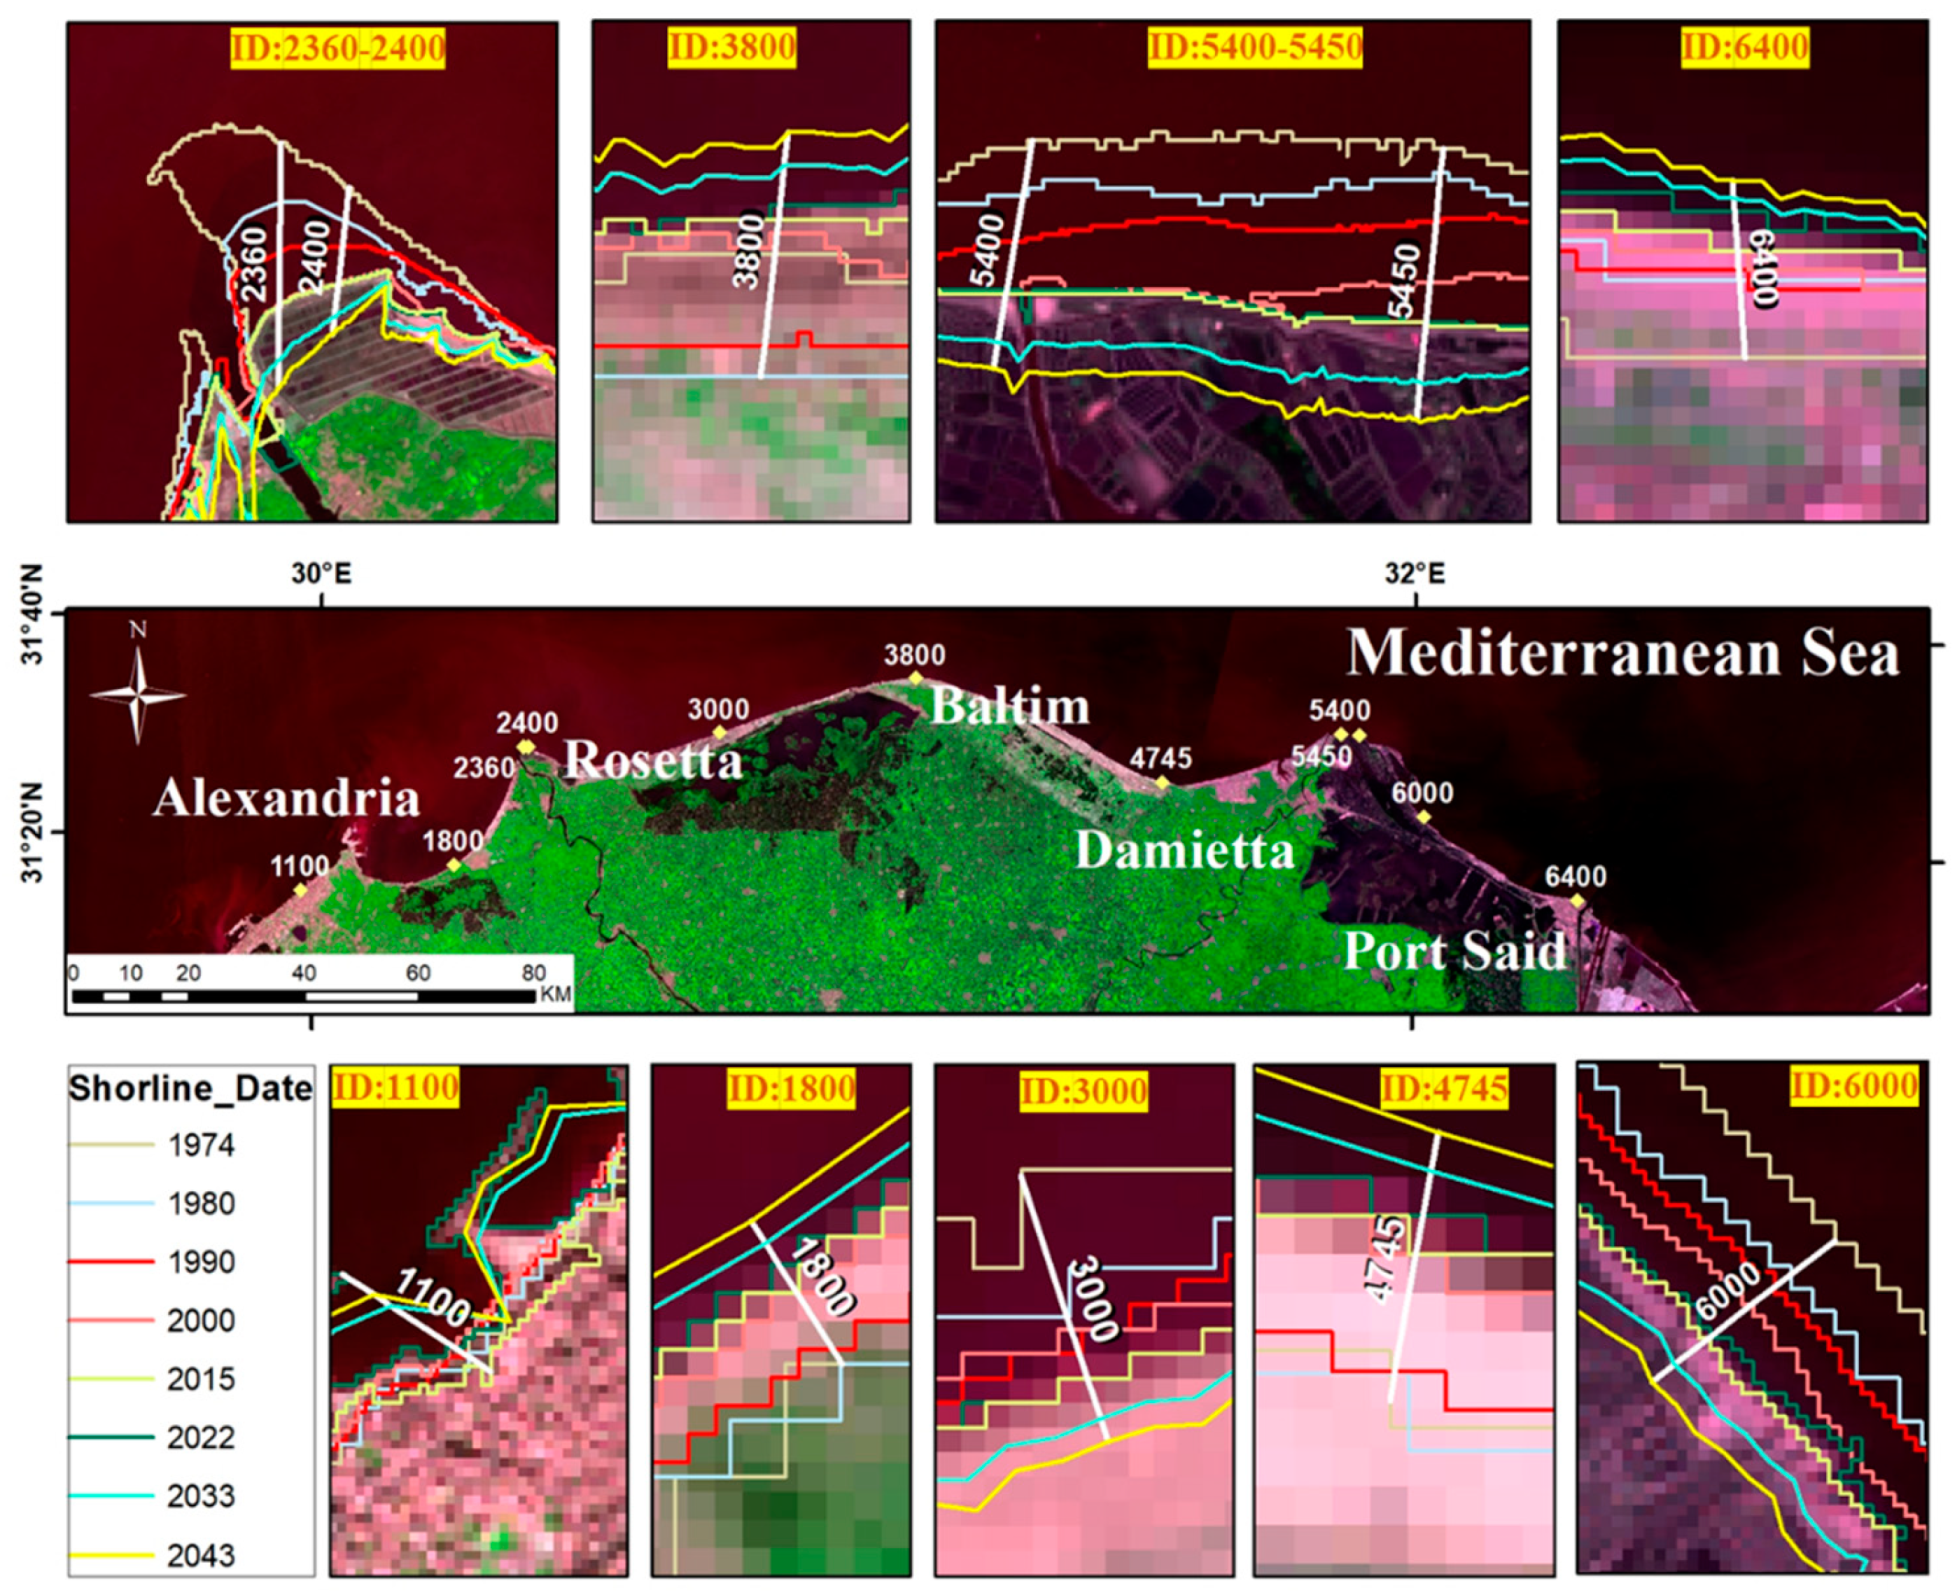
3.4. Analysis of Shoreline Changes in the Nile Delta at Critical Sections from 1974 to 2043
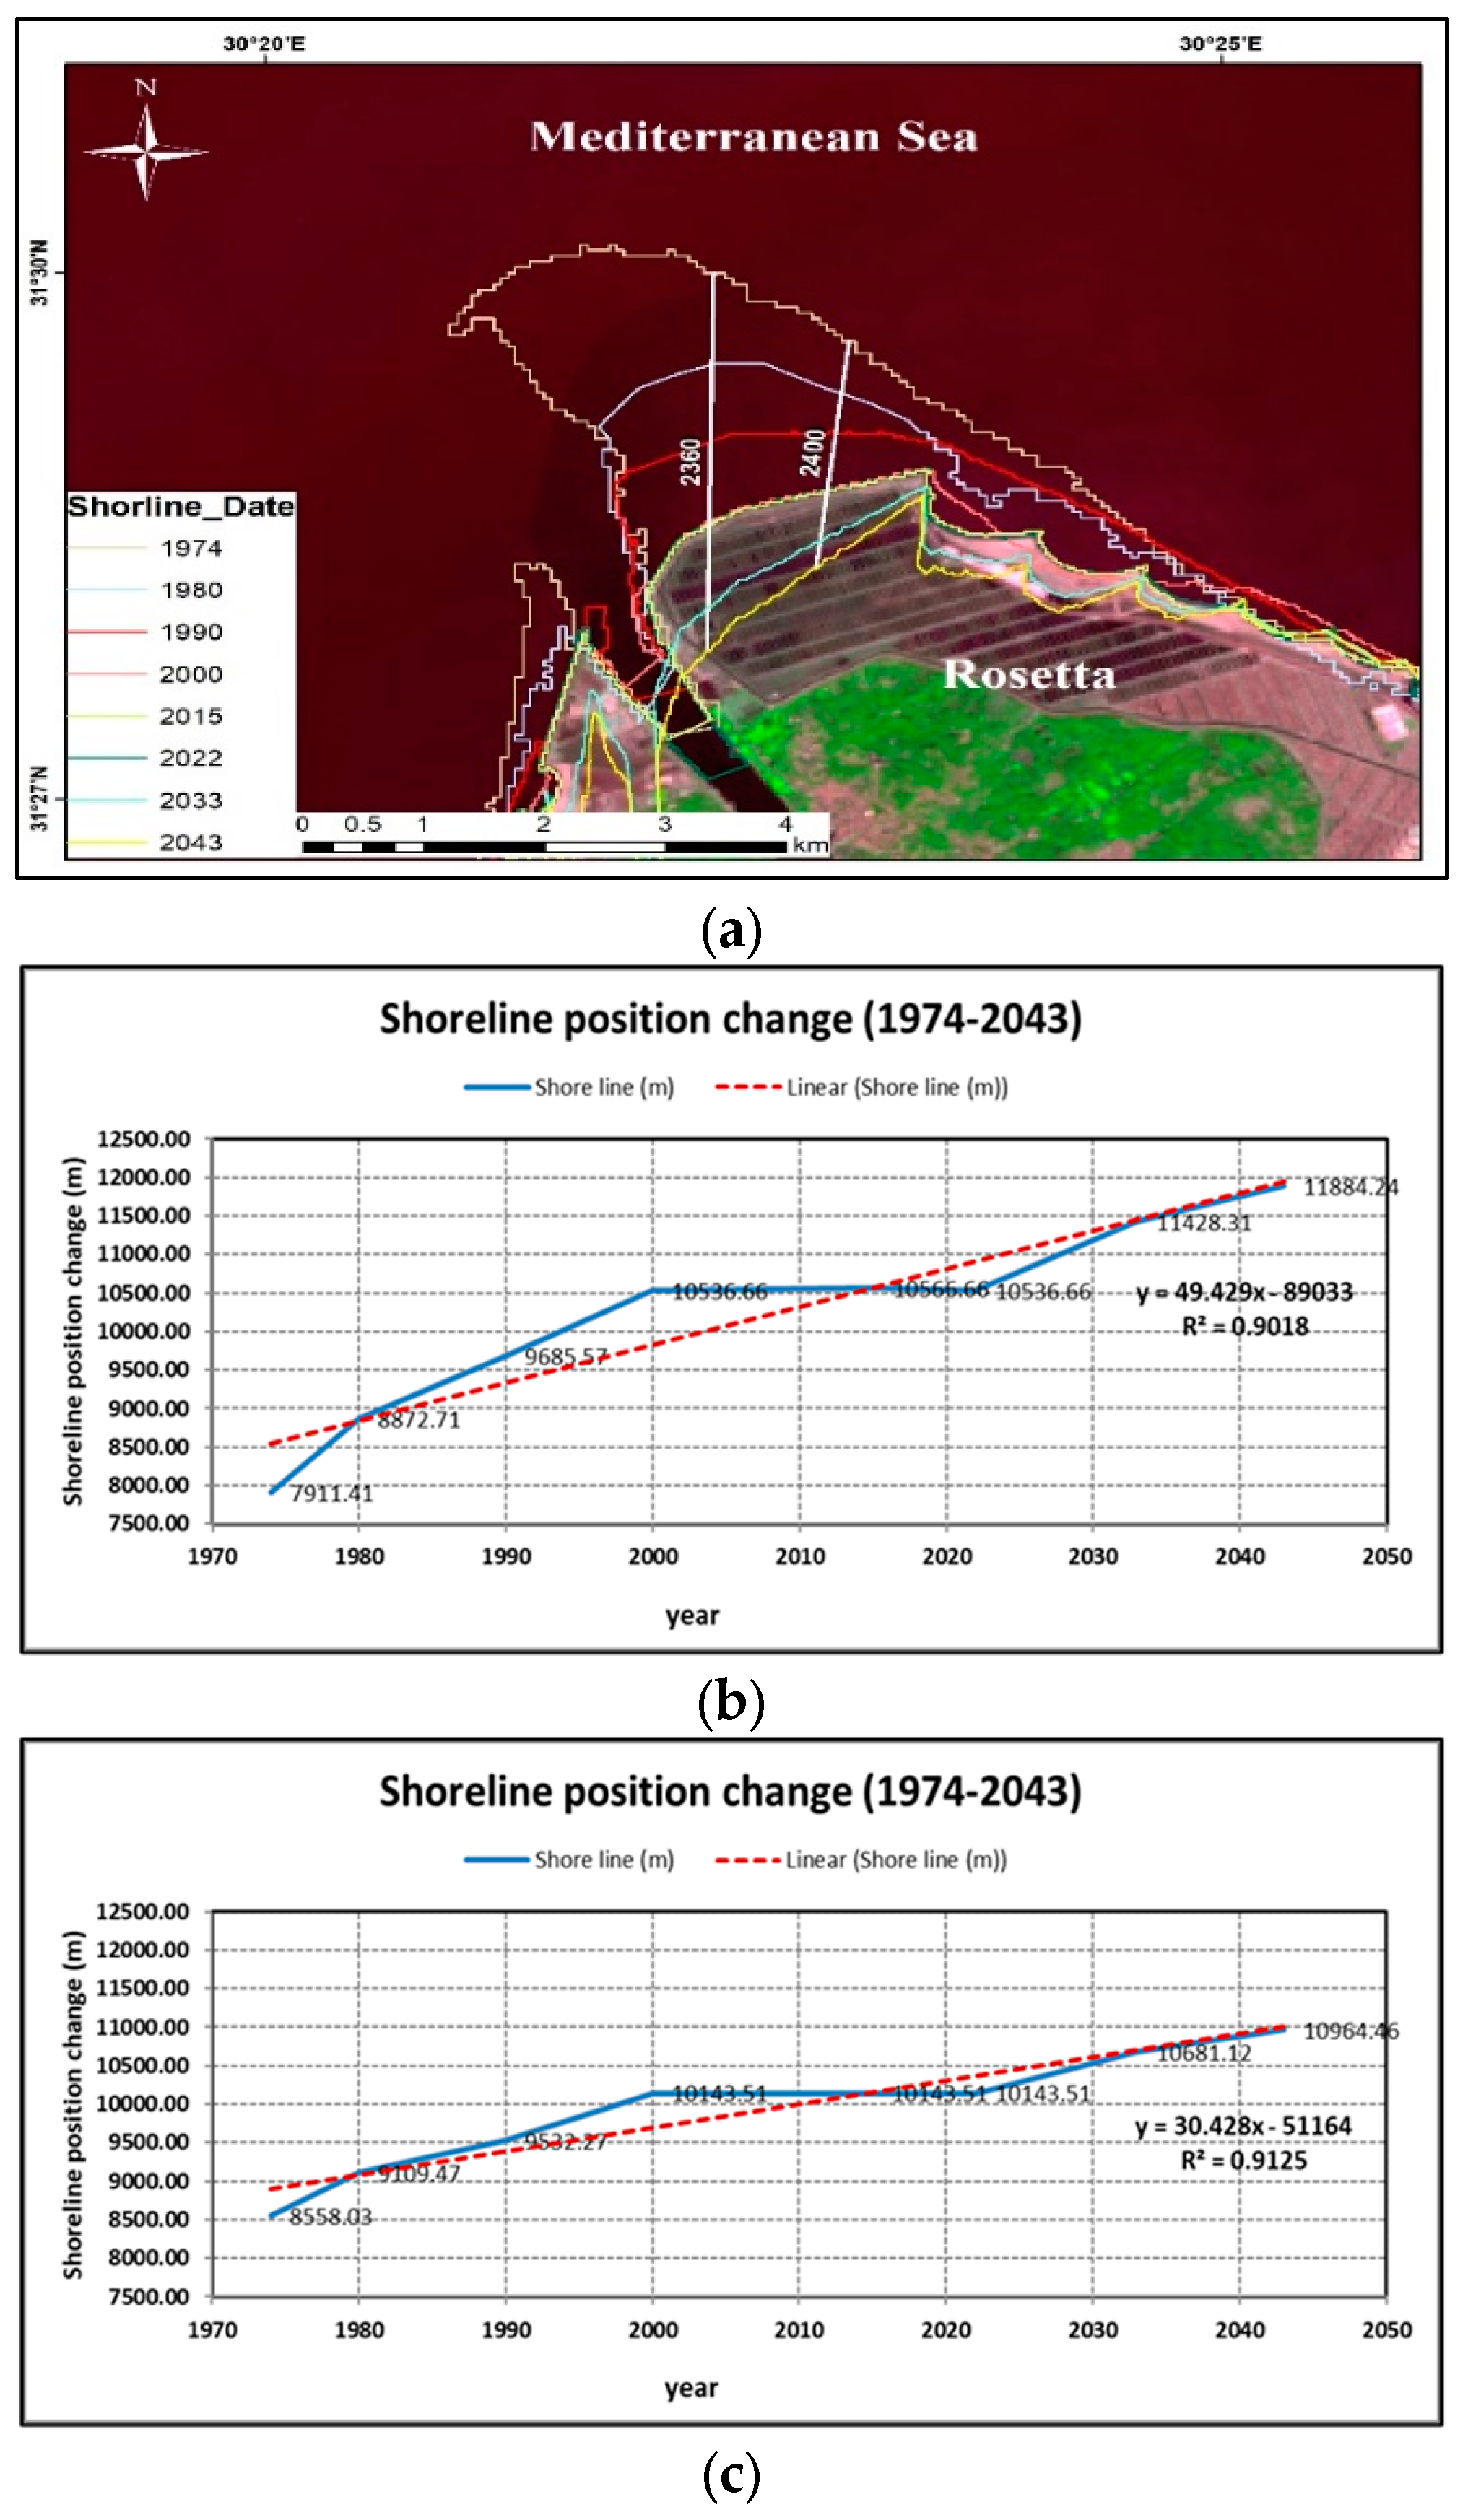
Sites of critical changes in the shoreline can be discovered in more detail through the investigation of separate transect data. A comparison of changing shoreline position time series demonstrates the importance of considering both the envelope of variability (SCE) and the net change (NSM and EPR). Figure 7 shows the projected shoreline at the Nile Delta from Alexandria to Port Said for the 70 years from 1974 to 2043. The figure shows the shoreline change at the selected 11 transects. The maximum shoreline shift 4941.95 m has occurred at Damietta and the maximum EPR is 102.96 m/year.
Transects at Alexandria, Idku, Lake Burullus, Baltim, Gamasa, and Port Said show steadiness in the shoreline positions because they represent high levels of land. Furthermore, the government has implemented some protection in these areas. These transects show a minimum change in the shoreline. However, the shoreline has advanced substantially during the whole period (70 years). During the late 20th century, the results revealed an increased erosion. In most cases, changes between 1974 and 2000 is greater than changes at any other time. It has been observed that the shoreline changed along the Nile Delta in the period 1974–2022, but three areas, including Rosetta, Damietta, and Lake Manzala, are extremely affected by coastal erosion where the shoreline has shifted more inland. Five transects at these three areas have been analyzed in the following subsections: at Rosetta (ID:2360, 2400), Damietta (ID:5400, 5450), and Lake Manzala (ID:6000).

3.4.1. Rosetta

At Rosetta, two profiles (2360 and 2400) were selected to highlight the rate of change in the shoreline, as shown in Figure 8a. The time series of changing the shoreline position at Rosetta measured from the baseline for the two transects 2360 and 2400 is shown in Figure 8b,c. The figure shows the shoreline for six time periods between 1974 and 2022, as well as the estimated shoreline after ten and twenty years (2033 and 2043).
At the first transect (2360), the shoreline has moved inland by 2625.25 m in the period 1974–2022, and the forecast by DSAS showed that the shoreline will shift inland by 891.65 m by 2033 and 455.93 m by 2043. The time series shown in Figure 8b resulted in Equation (1), which can be used to predict the shoreline position at any time with (R2 = 0.9018).
y = 49.429x − 89,033
where, y is the shoreline change (m) and x is the time (year).
At the second transect (2400), the shoreline has moved inland by 1585.48 m in the period 1974–2022, and the forecast by DSAS showed that it will move inland by 537.61 m by 2033 and 283.35 m by 2043. The time series shown in Figure 8b resulted in Equation (2), which can be used to predict the shoreline position at any year with (R2 = 0.9125).
y = 30.428x − 51,164

3.4.2. Damietta

Two profiles (5400 and 5450) were selected at Damietta to highlight the rate of change in the shoreline (see Figure 9a). The time series of the changing shoreline position at Damietta measured from the baseline for the two transects 5400 and 5450 is shown in Figure 9b,c. The figure shows the shoreline for six time periods between 1974 and 2022, as well as the estimated shoreline after ten and twenty years (2033 and 2043).
At transect 5400, the shoreline has moved inland by 1142.07 m in the period 1974–2022, and the forecast by DSAS showed that it will shift inland by 395.01 m by 2033 and 198.69 by 2043. The time series shown in Figure 9b resulted in Equation (3), which can be used to predict the shoreline position at any year with (R2 = 0.9017).
y = 21.566x − 33,473
At transect 5450, the shoreline has moved inland by 1311.50 m in the period 1974–2022, and the forecast by DSAS showed that it will shift inland another 454.79 m by 2033 and 284.66 m by 2043. The time series shown in Figure 9b resulted in Equation (4), which can be used to predict the shoreline position at any year with (R2 = 0.9814).
y = 28.856x − 48,316

3.4.3. Lake Manzala

One profile (ID: 6000) was chosen to demonstrate the rate of change in the shoreline at Lake Manzala, as seen in Figure 10a. Figure 10b depicts the relationship between the predicted coastline after 10 and 20 years (2033 and 2043) and the shoreline change assessed from the baseline during six time periods from 1974 to 2022. At transect (6000), the shoreline has moved inland by 431.76 m in the period 1974–2022, and the forecast by DSAS showed that it will shift inland by 120.34 m by 2033 and 80.52 m by 2043. The time series shown in Figure 10b resulted in Equation (5), which can be used to predict the shoreline position at any year with (R2 = 0.9767).
y = 8.42x − 1425.7

4. Discussion

The DSAS tool with GIS is used to investigate the historical trend and the changes in the Nile Delta shoreline based on historical data from 1974 to 2022. Then, DSAS is used to predict the shoreline for 10 and 20 years (2033 and 2043). The incorporation of DSAS into the ArcGIS environment not only improves the software’s functionality, but also makes it possible to compute scales and rates of change statistics using a variety of historical shoreline positions and sources. The DSAS tool is effective in mapping and identifying coastline erosion and accretion on the coastal environment, as well as measuring historical shoreline geometry movement. The DSAS extension in the ArcGIS environment makes it simple and easy to measure changes in the coastal environment on yearly, decadal, and historical time scales. The case study presented here shows how DSAS can offer insightful information on the morphodynamical shoreline behavior, including shifting the position and changes in geometry, the detection of erosion and deposition areas, and variation in planimetric properties of the coastal environment.
The profiles at five critical sections were analyzed, and linear equations were developed for each profile that can be used to calculate the shoreline position in the future. The shoreline movement for 70 years from 1974 to 2043 is plotted in Figure 11. The figure shows a comparison between the results for the shoreline at five critical sections at Rosetta and Damietta. As shown in the figure, the maximum inland movement was observed at transect 2360 at Rosetta and the minimum was observed at transect 6000 at Lake Manzala.
The results showed that Rosseta and Damietta are the areas most affected by changes in the shoreline. Figure 12 shows the shoreline change in the Nile Delta from 1974 to 2022 (six periods) in addition to two forecasted years in 2033 and 2043, focusing on Rosetta and Damietta. In general, the results of shoreline change for 70 years reveal that the shoreline has changed dramatically in the study period at Rosetta and Damietta, which requires more assessment and protection measures.
Limited studies have been conducted on the shoreline change in the Nile Delta. The shoreline kinematics response due to the existence of protection measures at Damietta using satellite images was assessed by Esmail et al. (2019) [68]. Their study focused on the shoreline change during the period from 1990 to 2015 (25 years) based on four Landsat images from 1990, 1999, 2003, and 2015. They focused on three zones in the western, central and eastern portions of Damietta. The first zone is at Damietta port, where the results showed that the shoreline has advanced west of the port with an average rate of +10.87 m/year and an erosion of the shoreline has occurred east of the port, with an average rate of −4.80 m/year. The second zone is Ras El Bar resort beach, which was protected, and the results showed that the shoreline behind the structure has progressed with an average rate of +7.0 m/year. A highly affected zone was the third zone is the eastern part of Damietta promontory, where the results showed that the erosion rate was assessed to be from −45.60 to −61.10 m/year during the period 1990 to 1999 and from −31.6 to −77.0 m/year during the period from 1999 to 2015, with an average rate of −45.3 to −70.5 m/year.
The coastal area at Rosetta was assessed by Balbaa et al. (2020) [69], who analyzed the shoreline change pattern from 1985 to 2015 to estimate the relation between the coastal changes and the physical properties of the coastal sediments using remote sensing imagery by the MNDWI index. The results revealed that Rosetta suffered from erosion during the study period (30 years). On the eastern side of Rosetta, the average erosion rate reached −50 m/year and on the western side, the average erosion rate reached −15.5 m/year during the whole period (30 years). GIS was applied by Deabes (2017) [70] to assess the shoreline change rates due to constructing marine structures, including a seawall and detached breakwaters and groins. The analysis was based on the beach-nearshore profile surveys between 1970 and 2010. The results showed that main erosion occurred along the Delta promontories. The shoreline of Rosetta retreated (1.6 km) with an average rate of 60 m/year. The coastline of Burullus bulge recessed with average rate of 6 m/year, and at Damietta (Ras El-Bar), the shoreline receded (6 m/year). El-Quilish et al. (2022) [71] built a model using GIS and a local digital elevation model (LDEM) to find the low-lying areas sensitive to inundation from future SLR in 2050 and to find the land-use types and percentages that were affected in the Nile Delta; they also produced a hazard index map (HIM). The results showed that the area inundated due to SLR in 2050 totals to about 50 km2, and the flooded areas represent 38.40 km2 for urban areas, 3.80 km2 for agricultural lands, 5.20 km2 for fishing farms, and 2.60 km2 for bare areas.
The three abovementioned studies [68,69,70] used different tools for assessing the shoreline change in the Nile Delta for different periods and, to some extent, provided different results due to the application of different methods for different periods. Esmail et al.’s (2019) [68] study focused on Damietta for 25 years (1990–2015); the Balbaa et al. (2020) [69] study focused on Rosetta for 30 years (1985–2015), and Deabes (2017) [70] used data from beach-nearshore profile surveys for 40 years (1970–2010).
The current study results are similar to the results of the above studies, but the results of the current study are slightly different from other studies because the transect are not exactly in the same places as those from previous studies. This means that the study confirms the erosion hotspots identified in previous works and complements those studies by assessing areas not previously assessed. Furthermore, the differences in shoreline trends observed from those studies may be justified by the fact that the current study used different methods and a different shoreline time series, as ours was a longer time series. In addition, the results showed that the erosion rate ranged between 30–60 and 10–25 m/year at Rosetta and Damietta, respectively. The current study used a DSAS based on data for 49 years (1974–2022), which is more recent and up to date. Then, DSAS is used to forecast the change in the shoreline after 10 and 20 years (2033 and 2043), which thus resulted in a longer period of 70 years (1974–2043) that was used for the time series of changing the shoreline at different transects and for extracting a linear equation for each transect, which can help in predicting the shoreline change.
This methodology can be applied in different areas, as mentioned in the review, but the application of this methodology has some limitations, such as predicting the pattern of coastline behavior based on the historical rate of change trends as an indicator of future trends by DSAS, assuming the steadiness in physical, natural, or anthropogenic forces that caused the detected changes. We also recommend conducting a deep study that depends on field measurements in order to include the effect of instantaneous water levels on monitoring the shoreline position, which was provided by Castelle et al. (2022) [72] to assess the shoreline change in Truc Vert, France.

5. Conclusions

Coastal areas are among those most impacted by sea level rise and climate change. Egypt’s coastal regions are anticipated to have large direct impacts due to the expected sea level rise (0.20–0.88 m) by the end of the 21st century. Egypt’s Mediterranean coastline, especially the Nile Delta, is below the mean sea level that will be most affected by sea level rise. In this study, the change in the shoreline of the Nile Delta was investigated for the period 1974–2022 using the Digital Shoreline Analysis System (DSAS) with the ArcGIS environment. Then, GIS was utilized to identify changes in the shoreline and forecast future changes for the next 10 and 20 years (2033 and 2043). The results revealed that the shoreline of the Nile Delta was extremely affected and the predictions showed continuous erosion in 2033 and 2043, especially at the Rosetta and Damietta sites. In this study, the most critical sections were selected and more focus was placed on these sections. Five critical sections were selected and analyzed at Rosetta, Damietta, and Lake Manzala, and linear equations were developed for each profile that can be used to calculate the shoreline change. The calculated erosion rate ranged from 30–60 m/year at Rosetta, 10–25 m/year at Damietta and 8–15 m/year at Lake Manzala. Continued erosion of the Nile Delta shoreline could have severe consequences on different segments, including ports, buildings, roads, railways, and inhabitants, which in turn affects the economy. The findings of this study may aid in protecting the Nile Delta from SLR using appropriate strategies to stop coastal erosion. The results of this research could be used by decision-makers to implement strategies for integrated coastal zone management that incorporates an increased awareness and urban growth management to protect the affected areas.

Author Contributions

Conceptualization, H.F.A.-E., M.M. and M.Z.; methodology, H.F.A.-E. and M.M.; software, M.Z.; validation, J.B. and M.B.G.; formal analysis, H.F.A.-E.; investigation, M.Z.; resources, M.M.; data curation, M.B.G.; writing—original draft preparation, H.F.A.-E. and M.M.; writing—review and editing, M.Z., J.B. and M.B.G.; visualization, M.B.G. and J.B.; supervision, H.F.A.-E. and M.Z.; project administration, H.F.A.-E. and M.Z.; funding acquisition, J.B. All authors have read and agreed to the published version of the manuscript.

Funding

This research received no external funding.

Data Availability Statement

Not applicable.

Acknowledgments

This work was supported by the SCORE (Smart Control of the Climate Resilience in European Coastal Cities) project, funded by the European Union’s Horizon 2020 research and innovation program under grant agreement No. 101003534.

Conflicts of Interest

The authors declare no conflict of interest. The funders had no role in the design of the study; in the collection, analyses, or interpretation of data; in the writing of the manuscript; or in the decision to publish the results.

References

  1. IPCC. Climate Change: The Science of Climate Change: Contribution of Working Group I to the Second Assessment Report of the Intergovernmental Panel on Climate Change; Houghton, J.T., Meira Fihlo, L.G., Callander, B.A., Harris, N., Kattenberg, A., Maskell, K., Eds.; Cambridge University Press: Cambridge, UK; New York, NY, USA, 1996. [Google Scholar]
  2. IPCC. Climate Change Impacts, Adaptations, and Vulnerability: Contribution of Working Group II to the Third Assessment Report of the Intergovernmental Panel on Climate Change; McCarthy, J.J., Canziani, O.F., Leary, N.A., Dokken, D.J., White, K.S., Eds.; Cambridge University Press: Cambridge, UK; New York, NY, USA, 2001. [Google Scholar]
  3. Nicholls, R.J.; Hoozemans, F.M.J. The Mediterranean: Vulnerability to coastal implications of climate change. J. Ocean Coast. Manag. 1996, 31, 105–132. [Google Scholar] [CrossRef]
  4. Ciritci, D.; Türk, T. Assessment of the Kalman filter-based future shoreline prediction method. Int. J. Environ. Sci. Technol. 2020, 17, 3801–3816. [Google Scholar] [CrossRef]
  5. Dasgupta, S.; Laplante, B.; Meisner, C.; Wheeler, D.; Yan, J. The impact of sea level rise on developing countries: A comparative analysis. J. Clim. Chang. 2009, 93, 379–388. [Google Scholar] [CrossRef]
  6. Baric, A.; Grbec, B.; Bogner, D. Potential Implications of Sea-Level Rise for Croatia. J. Coast. Res. 2008, 24, 299–305. [Google Scholar] [CrossRef] [Green Version]
  7. Fenger, J.; Buch, E.; Jakobsen, P.R.; Vestergaard, P. Danish Attitudes and Reactions to the Threat of Sea-Level Rise. J. Coast. Res. 2008, 24, 394–402. [Google Scholar] [CrossRef]
  8. Taormina, R.; Chau, K. Neural Network River Forecasting with Multi-Objective Fully Informed Particle Swarm Optimization. J. Hydroinform. 2015, 17, 99–113. [Google Scholar] [CrossRef] [Green Version]
  9. Fanos, A.M.; Khafagy, A.A.; Dean, R.G. Protective works on the Nile Delta. J. Coast. Res. 1995, 11, 516–528. [Google Scholar]
  10. El-Raey, M.; Dewidar, K.; El Hattab, M. Adaptation to the impact of sea level rise in Egypt. J. Clim. Res. 1999, 12, 117–128. [Google Scholar] [CrossRef] [Green Version]
  11. Heikal, E.M.; Koraim, A.S.; Abozaid, A.A. Protecting coasts from probable sea level rise by using porous vertical seawall. Egypt. Int. J. Eng. Sci. Technol. 2012, 15, 1233–1243. [Google Scholar]
  12. El-Raey, M.; Nasr, S.; Frihy, O.; Desouk, S.; Dowidar, K. Potential impacts of accelerated sea-level rise on Alexandria Governorate, Egypt. J. Coast. Res. 1995, 51, 190–204. [Google Scholar]
  13. El-Raey, M. Impacts and Implications of Climate Change for the Coastal Zones of Egypt. Coast. Zones Clim. Chang. 2010, 7, 31–50. [Google Scholar]
  14. Frihy, O.F.; Deabes, M.; Shereet, S.M.; Abdalla, F.A. Alexandria-Nile Delta coast, Egypt: Update and future projection of relative sea-level rise. Environ. Earth Sci. 2010, 61, 253–273. [Google Scholar] [CrossRef]
  15. Abou-Mahmoud, M.M.E. Assessing coastal susceptibility to sea-level rise in Alexandria, Egypt. Egypt. J. Aquat. Res. 2021, 47, 133–141. [Google Scholar] [CrossRef]
  16. Chen, Z.; Warne, A.G.; Stanley, D.J. Late Quaternary evolution of the Northern Nile Delta between Rosetta Promontory and Alexandria, Egypt. J. Coast. Res. 1992, 3, 527–561. [Google Scholar]
  17. Basiouny, M.E.; El Kafrawy, S.B.; Ghanem, E.A.; Taha, A. Shoreline change rate detection and future prediction using remote sensing and GIS techniques: A case study of Ras EL-Hekma, Northwestern Coast, Egypt. J. Geogr. Environ. Earth Sci. Int. 2017, 9, 1–14. [Google Scholar]
  18. Abdel Hamid, M.A.; Shreshta, D.; Valenzuela, C. Delineating, mapping and monitoring of soil salinity in the Northern Nile Delta (Egypt) using Landsat data and a geographic information system. Egypt. J. Soil Sci. 1992, 32, 463–481. [Google Scholar]
  19. Tetra, T. Shoreline Master Plan for the Nile Delta Coast: Progress Report 1; Tetra Tech: Pasadena, CA, USA, 1984. [Google Scholar]
  20. Frihy, O.E.; Deabes, E.A. Beach and nearshore morpho dynamics of the central bulge of the Nile Delta Coast, Egypt. Int. J. Environ. Prot. 2011, 1, 33–46. [Google Scholar]
  21. El-Fishawi, N. Relative changes in sea level from tide gauge records at Burrulus, central part of the Nile Delta coast. INQUA MBSS Newsl. 1994, 16, 53–61. [Google Scholar]
  22. Eid, F.M.; Sharaf El-Din, S.H.; El-Din, K.A.A. Sea level variation along the Suez Canal. Estuar. Coast. Shelf Sci. 1997, 44, 613–619. [Google Scholar] [CrossRef]
  23. Iskander, M.M.; Frihy, O.E.; El Ansary, A.E.; Abd El Mooty, M.M.; Nagy, H.M. Beach impacts of shore parallel breakwaters backing ofshore submerged ridges, western Mediterranean coast of Egypt. J. Environ. Manag. 2007, 85, 1109–1119. [Google Scholar] [CrossRef]
  24. Frihy, O.E.; Lawrence, D. Evolution of the modern Nile Delta promontories: Development of accretional features during shoreline retreat. Environ. Geol. 2004, 46, 914–931. [Google Scholar] [CrossRef]
  25. Sestini, G. Nile Delta: A review of depositional environments and geological history. Geol. Soc. Lond. Spec. Publ. 2007, 41, 99–127. [Google Scholar] [CrossRef]
  26. El-Dardir, M. Sedimentation in Nile High Dam reservoir, 1987–1992, and sedimentary futurologic aspects. Sediment. Egypt 1994, 2, 23–39. [Google Scholar]
  27. Orlova, G.; Zenkovich, V. Erosion of the shores of the Nile Delta. Geoforum 1974, 18, 68–72. [Google Scholar] [CrossRef]
  28. Smith, S.E.; Abdel-Kader, A. Coastal erosion along the Egyptian delta. J. Coast. Res. 1988, 4, 245–255. [Google Scholar]
  29. Lotfy, M.F.; Frihy, O.E. Sediment balance in the nearshore zone of the Nile Delta coast. Egypt. J. Coast. Res. 1993, 9, 654–662. [Google Scholar]
  30. Stanley, D.J. Nile delta: Extreme case of sediment entrapment on a delta plain and consequent coastal land loss. Mar. Geol. 1996, 129, 189–195. [Google Scholar] [CrossRef]
  31. El-Asmar, H.; Ehite, K. Changes in coastal sediment transport processes due to construction of New Damietta Harbour, Nile Delta. Egypt Coast. Eng. 2002, 46, 127–138. [Google Scholar] [CrossRef]
  32. White, K.; El-Asmar, H.M. Monitoring changing position of coastlines using thematic mapper imagery, an example from the nile delta. Geomorphology 1999, 29, 93–105. [Google Scholar] [CrossRef]
  33. Kafrawy, S.; Ahmed, M. Monitoring and protection of Egyptian Northern Lakes using remote sensing technology, environmental remote sensing in Egypt. In Environmental Remote Sensing in Egypt; Springer Geophysics; Springer: Berlin/Heidelberg, Germany, 2020; pp. 231–284. [Google Scholar]
  34. Gergelova, M.; Kuzevicová, Ž.; Kovanic, L.; Kuzevic, Š. Automation of spatial model creation in GIS environment. J. Pol. Miner. Eng. Soc. 2014, 15, 15–22. [Google Scholar]
  35. Fonte, J.; Meunier, E.; Gonçalves, J.; Dias, F.; Lima, A.; Gonçalves-Seco, L.; Figueiredo, E. An Integrated Remote-Sensing and GIS Approach for Mapping Past Tin Mining Landscapes in Northwest Iberia. Remote Sens. 2021, 13, 3434. [Google Scholar] [CrossRef]
  36. Gergelova, M.; Kuzevičová, Ž.; Kuzevič, Š.; Sabolová, J. Hydrodynamic modeling and GIS tools applied in urban areas. Acta Montan. Slovaca 2013, 18, 226–233. [Google Scholar]
  37. Zhang, Z.; Zheng, L.; Piao, Y.; Tao, S.; Xu, W.; Gao, T.; Wu, X. Blind Remote Sensing Image Deblurring Using Local Binary Pattern Prior. Remote Sens. 2022, 14, 1276. [Google Scholar] [CrossRef]
  38. Tang, Z.; Chen, C.; Jiang, C.; Zhang, D.; Luo, W.; Hong, Z.; Sun, H. Capsule–Encoder–Decoder: A Method for Generalizable Building Extraction from Remote Sensing Images. Remote Sens. 2022, 14, 1235. [Google Scholar] [CrossRef]
  39. Thieler, E.R.; Himmelstoss, E.A.; Zichichi, J.L.; Ergul, A. The Digital Shoreline Analysis System (DSAS) Version 4.0—An ArcGIS Extension for Calculating Shoreline Change; Open-File Report; US Geological Survey Report No. 2008-1278; USGS: Reston, VA, USA, 2009. [Google Scholar]
  40. Temitope, D.; Oyedotun, T. Shoreline Geometry: DSAS as a Tool for Historical Trend Analysis, British Society for Geomorphology. Geomorph. Techn. 2014, 3, 12. [Google Scholar]
  41. Carrasco, A.R.; Ferreira, Ó.; Matias, A.; Freire, P. Natural and human-induced coastal dynamics at a back-barrier beach. Geomorphology 2012, 159, 30–36. [Google Scholar] [CrossRef] [Green Version]
  42. Montreuil, A.-L.; Bullard, J.E. A 150-year record of coastline dynamics within a sediment cell: Eastern England. Geomorphology 2012, 179, 168–185. [Google Scholar] [CrossRef] [Green Version]
  43. González-Villanueva, R.; Costas, S.; PérezArlucea, M.; Jerez, S.; Trigo, R.M. Impact of atmospheric circulation patterns on coastal dune dynamics, NW Spain. Geomorphology 2013, 185, 96–109. [Google Scholar] [CrossRef] [Green Version]
  44. Jabaloy-Sánchez, A.; Lobo, F.J.; Azor, A.; Martín, R.W.; Pérez-Peña, J.V.; Bárcenas, P.; Macías, J.M.; Fernández-Salas, L.M.; Vázquez Vílchez, M. Six thousand years of coastline evolution in the Guadalfeo deltaic system (southern Iberian Peninsula). Geomorphology 2014, 206, 374–391. [Google Scholar] [CrossRef]
  45. Houser, C.; Hapke, C.; Hamilton, S. Controls on coastal dune morphology, shoreline erosion and barrier island response to extreme storms. Geomorphology 2008, 100, 223–240. [Google Scholar] [CrossRef]
  46. Houser, C.; Mathew, S. Alongshore variation in foredune height in response to transport potential and sediment supply: South Padre Island, Texas. Geomorphology 2011, 125, 62–72. [Google Scholar] [CrossRef]
  47. Brooks, S.M.; Spencer, T. Temporal and spatial variation in recession rates and sediment release from soft rock cliffs, Suffolk coast, UK. Geomorphology 2010, 124, 26–41. [Google Scholar] [CrossRef] [Green Version]
  48. Restrepo, A.J.D. Assessing the effect of sea-level and human activities on a major delta on the Pacific coast of northern South America: The Patía River. Geomorphology 2012, 151, 207–223. [Google Scholar] [CrossRef]
  49. Beetham, E.P.; Kench, P.S. Wave energy gradients and shoreline change on Vabbinfaru platform, Maldives. Geomorphology 2014, 209, 98–110. [Google Scholar] [CrossRef]
  50. Hapke, C.J.; Kratzmann, M.G.; Himmelstoss, E.A. Geomorphic and human influence on large-scale coastal change. Geomorphology 2013, 199, 160–170. [Google Scholar] [CrossRef]
  51. Rio, L.D.; Gracia, J.F. Erosion risk assessment of active coastal cliffs in temperate environments. Geomorphology 2009, 112, 82–95. [Google Scholar]
  52. Leyland, J.; Darby, S.E. An empirical conceptual gully evolution model for channelled sea cliffs. Geomorphology 2008, 102, 419–434. [Google Scholar] [CrossRef] [Green Version]
  53. Draut, A.E.; Logan, J.B.; Mastin, M.C. Channel evolution on the dammed Elwha River, Washington, USA. Geomorphology 2011, 127, 71–87. [Google Scholar] [CrossRef]
  54. Rio, L.D.; Gracia, J.F.; Benavente, J. Shoreline change patterns in sandy coasts. A case study in SW Spain. Geomorphology 2013, 196, 252–266. [Google Scholar]
  55. Brooks, S.M.; Spencer, T.; Boreham, S. Deriving mechanisms and thresholds for cliff retreat in soft-rock cliffs under changing climates: Rapidly retreating cliffs of the Suffolk coast, UK. Geomorphology 2012, 153, 48–60. [Google Scholar] [CrossRef]
  56. Katz, O.; Mushkin, A. Characteristics of sea-cliff erosion induced by a strong winter storm in the eastern Mediterranean. Quat. Res. 2013, 80, 20–32. [Google Scholar] [CrossRef]
  57. Young, A.P.; Flick, R.E.; O’Reilly, W.C.; Chadwicj, D.B.; Crampton, W.C.; Helly, J.J. Estimating cliff retreat in southern California considering sea level rise using a sand balance approach. Mar. Geol. 2014, 348, 15–26. [Google Scholar] [CrossRef]
  58. Hackney, C.; Darby, S.E.; Leyland, J. Modelling the response of soft cliffs to climate change: A statistical, process-response model using accumulated excess energy. Geomorphology 2013, 187, 108–121. [Google Scholar] [CrossRef]
  59. Thébaudeau, B.; Trenhaile, A.S.; Edwards, R.J. Modelling the development of rocky shoreline profiles along the northern coast of Ireland. Geomorphology 2013, 203, 66–78. [Google Scholar] [CrossRef] [Green Version]
  60. Gonçalves, G.; Santos, S.; Duarte, D.; Gomes, J. Monitoring Local Shoreline Changes by Integrating UASs, Airborne LiDAR, Historical Images and Orthophotos. In Proceedings of the 5th International Conference on Geographical Information Systems Theory, Applications and Management GISTAM, Heraklion, Greece, 3–5 May 2019. [Google Scholar]
  61. Shenbagaraj, N.; Senthil, K.; Mohamed, R.A.; Leostalin, J.; Naresh, K.M. Mapping and Electronic Publishing of Shoreline Changes using UAV Remote Sensing and GIS. J. Indian Soc. Remote Sens. 2021, 49, 1769–1777. [Google Scholar] [CrossRef]
  62. Amodio, A.M.; Paola, G.D.; Rosskopf, C.M. Monitoring Coastal Vulnerability by Using DEMs Based on UAV Spatial Data. ISPRS Int. J. Geo-Inf. 2022, 11, 155. [Google Scholar] [CrossRef]
  63. Abd-Elhamid, H.F.; Zeleňáková, M.; Mahdy, M. Assessing the impact of climate change and sea level rise on the shoreline of Alexandria city—Recreation area. In Proceedings of the Public Recreation and Landscape Protection-with the Environment Hand in Hand, Brno, Czech Republic, 9–11 May 2022. [Google Scholar]
  64. Stanley, D.; Warne, A. Nile Delta: Recent geological evolution and human impact. Science 1993, 260, 628–634. [Google Scholar] [CrossRef]
  65. Kalman, R.E. A new approach to linear filtering and prediction problems. J. Fluids Eng. 1960, 82, 35–45. [Google Scholar] [CrossRef] [Green Version]
  66. Long, J.W.; Plant, N.G. Extended Kalman Filter framework for forecasting shoreline evolution. Geophys. Res. Lett. 2012, 39, 13. [Google Scholar] [CrossRef]
  67. Himmelstoss, E.A.; Farris, A.S.; Henderson, R.E.; Kratzmann, M.G.; Ergul, A.; Zhang, O.; Zichichi, J.L.; Thieler, E.R. Digital Shoreline Analysis System, Version 5.0; USGS: Reston, VA, USA, 2018. [Google Scholar]
  68. Esmail, M.; Mahmod, W.E.; Fath, H. Assessment and prediction of shoreline change using multi-temporal satellite images and statistics: Case study of Damietta coast, Egypt. Appl. Ocean Res. 2019, 82, 274–282. [Google Scholar] [CrossRef]
  69. Balbaa, S.H.; El-Gamal, A.A.; Mansour, A.S.; Rashed, M.A. Mapping and Monitoring of Rosetta Promontory Shoreline Pattern Change, Egypt. J. Oceanogr. Mar. Environ. Syst. 2020, 4, 29–42. [Google Scholar]
  70. Deabes, E.A.M. Applying ArcGIS to Estimate the Rates of Shoreline and Back-Shore Area Changes along the Nile Delta Coast, Egypt. Int. J. Geosci. 2017, 8, 332–348. [Google Scholar] [CrossRef] [Green Version]
  71. El-Quilish, M.; El-Ashquer, M.; Dawod, G.; El Fiky, G. Development of an Inundation Model for the Northern Coastal Zone of the Nile Delta Region, Egypt Using High-Resolution DEM. Arab. J. Sci. Eng. 2023, 48, 601–614. [Google Scholar] [CrossRef]
  72. Castelle, B.; Masselink, G.; Scott, T.; Stokes, C.; Konstantinou, A.; Marieu, V.; Bujan, S. Satellite-derived shoreline detection at a high-energy meso-macrotidal beach. Geomorphology 2021, 383, 107707. [Google Scholar] [CrossRef]
Figure 1. Location map of the study area.
Remotesensing 15 01737 g001
Figure 2. Land use of the study area.
Remotesensing 15 01737 g002
Figure 3. Methodological flow chart of satellite image collection and processing.
Remotesensing 15 01737 g003
Figure 4. The historical trend of the Nile Delta shoreline for the period 1974–2022: (a) 1974, (b) 1980, (c) 1990, (d) 2000, (e) 2015, (f) 2022.
Remotesensing 15 01737 g004
Figure 5. The predicted shoreline at the Nile Delta for the years (a) 2033 and (b) 2043.
Remotesensing 15 01737 g005
Figure 6. The results of SCE, NSM, EPR, LRR, and WLR at the Nile Delta for the period 1974–2043: (a) SCE, (b) NSM, (c) EPR, (d) LRR, (e) WLR.
Remotesensing 15 01737 g006aRemotesensing 15 01737 g006b
Figure 7. The projected shoreline at different transects in the Nile Delta for the period 1974–2043.
Remotesensing 15 01737 g007
Figure 8. Shoreline changes over time at Rosetta (1974–2043): (a) shoreline change at Rosetta, (b) time series of changing the shoreline position at transect 2360, (c) time series of changing the shoreline position at transect 2400.
Remotesensing 15 01737 g008
Figure 9. Shoreline changes over time at Damietta (1974–2043): (a) shoreline change at Damietta, (b) time series of changing the shoreline position at transect 5400, (c) time series of changing the shoreline position at transect 5450.
Remotesensing 15 01737 g009
Figure 10. Shoreline changes over time at Lake Manzala (1974–2043): (a) shoreline change at Lake Manzala, (b) time series of changing the shoreline position at transect 6000.
Remotesensing 15 01737 g010
Figure 11. Comparison between shoreline changes at critical sections in the period 1974–2043.
Remotesensing 15 01737 g011
Figure 12. Shoreline changes at Rosetta and Damietta in the period 1974–2043.
Remotesensing 15 01737 g012
Table 1. The specification of the satellite data.
Satellite/SensorDatePathRowSpatial Resolution
Pixel Size (m)
Satellite/Sensor
Landsat-1/MSS09/05/19741893860Landsat-1/MSS
Landsat-1/MSS15/05/19741903860Landsat-1/MSS
Landsat-1/MSS22/07/19741913860Landsat-1/MSS
Landsat-2/MSS28/07/19801893860Landsat-2/MSS
Landsat-2/MSS29/07/19801903860Landsat-2/MSS
Landsat-3/MSS03/07/19801913860Landsat-3/MSS
Landsat-5/TM03/07/19901763830Landsat-5/TM
Landsat-5/TM08/06/19901773830Landsat-5/TM
Landsat-7/ETM+06/07/20001763830Landsat-7/ETM+
Landsat-7/ETM+13/07/20001773830Landsat-7/ETM+
Landsat-8/OLI/TIRS24/07/20151763830Landsat-8/OLI/TIRS
Landsat-8/OLI/TIRS15/07/20151773830Landsat-8/OLI/TIRS
Landsat-9/OLI/TIRS19/07/20221763830Landsat-9/OLI/TIRS
Landsat-8/OLI/TIRS18/07/20221773830Landsat-8/OLI/TIRS
Table 2. The results of statistical measures in the Nile Delta.
TransectSCE
(m)
NSM
(m)
EPR
(m/Year)
LRR
(m/Year)
WLR
(m/Year)
IDLocation
1100Alexandria585.21495.9610.335.985.98
1800Idko125.07125.072.612.72.7
2360Rosseta2655.25−2625.25−54.69−51.68−51.68
24001585.48−1585.48−33.03−31.67−31.67
3000Lake Burullus260.34−260.34−5.42−4−4
3800Baltim365.18105.692.25.425.42
4745Gamasa145.93145.933.043.083.08
5400Damietta1172.52−1142.07−23.79−22.56−22.56
54501311.5−1311.5−27.32−29.14−29.14
6000Lake Manzala436.77−431.76−8.99−8.64−8.64
6400Port Said225.62225.624.73.433.43
Disclaimer/Publisher’s Note: The statements, opinions and data contained in all publications are solely those of the individual author(s) and contributor(s) and not of MDPI and/or the editor(s). MDPI and/or the editor(s) disclaim responsibility for any injury to people or property resulting from any ideas, methods, instructions or products referred to in the content.

