

MUREN: MUltistage Recursive Enhanced Network for Coal-Fired Power Plant Detection
by
 , , ,
, , ,
Shuai Yuan
1,
Juepeng Zheng
2,3,
Lixian Zhang
2,3,
Runmin Dong
2,3,
Ray C. C. Cheung
1,* and
Haohuan Fu
2,3 1
Department of Electrical Engineering, City University of Hong Kong, Hong Kong 999077, China
2
Ministry of Education Key Laboratory for Earth System Modeling, Department of Earth System Science, Tsinghua University, Beijing 100084, China
3
Department of Earth System Science, Tsinghua University—Xi’an Institute of Surveying and Mapping Joint Research Center for Next-Generation Smart Mapping, Beijing 100084, China
*
Author to whom correspondence should be addressed.
Remote Sens. 2023, 15(8), 2200; https://0-doi-org.brum.beds.ac.uk/10.3390/rs15082200
Submission received: 29 March 2023
/
Revised: 13 April 2023
/
Accepted: 15 April 2023
/
Published: 21 April 2023
(This article belongs to the Special Issue Artificial Intelligence-Driven Methods for Remote Sensing Target and Object Detection)
Abstract
:The accurate detection of coal-fired power plants (CFPPs) is meaningful for environmental protection, while challenging. The CFPP is a complex combination of multiple components with varying layouts, unlike clearly defined single objects, such as vehicles. CFPPs are typically located in industrial districts with similar backgrounds, further complicating the detection task. To address this issue, we propose a MUltistage Recursive Enhanced Detection Network (MUREN) for accurate and efficient CFPP detection. The effectiveness of MUREN lies in the following: First, we design a symmetrically enhanced module, including a spatial-enhanced subnetwork (SEN) and a channel-enhanced subnetwork (CEN). SEN learns the spatial relationships to obtain spatial context information. CEN provides adaptive channel recalibration, restraining noise disturbance and highlighting CFPP features. Second, we use a recursive construction set on top of feature pyramid networks to receive features more than once, strengthening feature learning for relatively small CFPPs. We conduct comparative and ablation experiments in two datasets and apply MUREN to the Pearl River Delta region in Guangdong province for CFPP detection. The comparative experiment results show that MUREN improves the mAP by 5.98% compared with the baseline method and outperforms by 4.57–21.38% the existing cutting-edge detection methods, which indicates the promising potential of MUREN in large-scale CFPP detection scenarios.
1. Introduction
China has emerged as a key force in anthropogenic carbon emissions and reduction as a result of the incredible development of China’s economy and society in recent decades [1,2,3]. During this process, the surge in electrical power consumption has contributed to the result that the burning of fossil fuels (coal) has played the main part in anthropogenic carbon emissions [4].
The Pearl River Delta (PRD) region has had the fastest pace of development [5], while its ever-increasing energy consumption has led to a significant surge in air pollutant emissions [6]. Since a coal-fired power plant (CFPP) is the primary source of carbon dioxide emissions in thermal power, awareness of the precise location of CFPPs and their working status is important for carbon dioxide emissions monitoring and air pollution management. Identifying a combined complex with multiple objects and a nonrigid layout, compounded by the challenges posed by complicated backgrounds and blurred boundaries of CFPPs, is an exceedingly difficult research problem [7,8,9,10].
High-resolution satellite images (HRSI) can offer us an orthographic image of CFPPs, which could provide their location and working status from their latitude, longitude, and whether they are smoking or not. However, manual manipulation for searching and distinguishing in enormous pixels is time- and labor-consuming. Deep learning methods are naturally adapted to this issue because of their high efficiency and accuracy. In recent years, with the availability of many well-labeled datasets, such as ImageNet [11] and PASCAL VOC [12], there now exist outstanding deep-learning-based object detection methods such as SSD [13], RetinaNet [14], YOLO [15], Fast R-CNN [16], Faster R-CNN [17], Dynamic R-CNN [18], Libra R-CNN, [19] and Cascade R-CNN [20]. Specifically, SSD adopts multiscale feature maps and prior boxes with different sizes to conduct multiscale object detection. RetinaNet with Focal Loss can effectively handle sample imbalance in training. Faster R-CNN adds a Region Proposal Network (RPN) into the structure to realize true real-time object detection. Dynamic R-CNN points out the strategy of dynamically adjusting training based on the change in sample distribution based on the training characteristics of target detection. Cascade R-CNN consists of a sequence of detectors to avoid problems of overfitting. These methods have been widely used in many applications such as cancer detection [21,22], animal detection [23,24], traffic light detection [25,26], and face detection [27,28,29], as well as many regular remote sensing applications, such as tree detection [30,31,32], ship detection [33,34], car detection [35,36], building detection [37,38], etc.
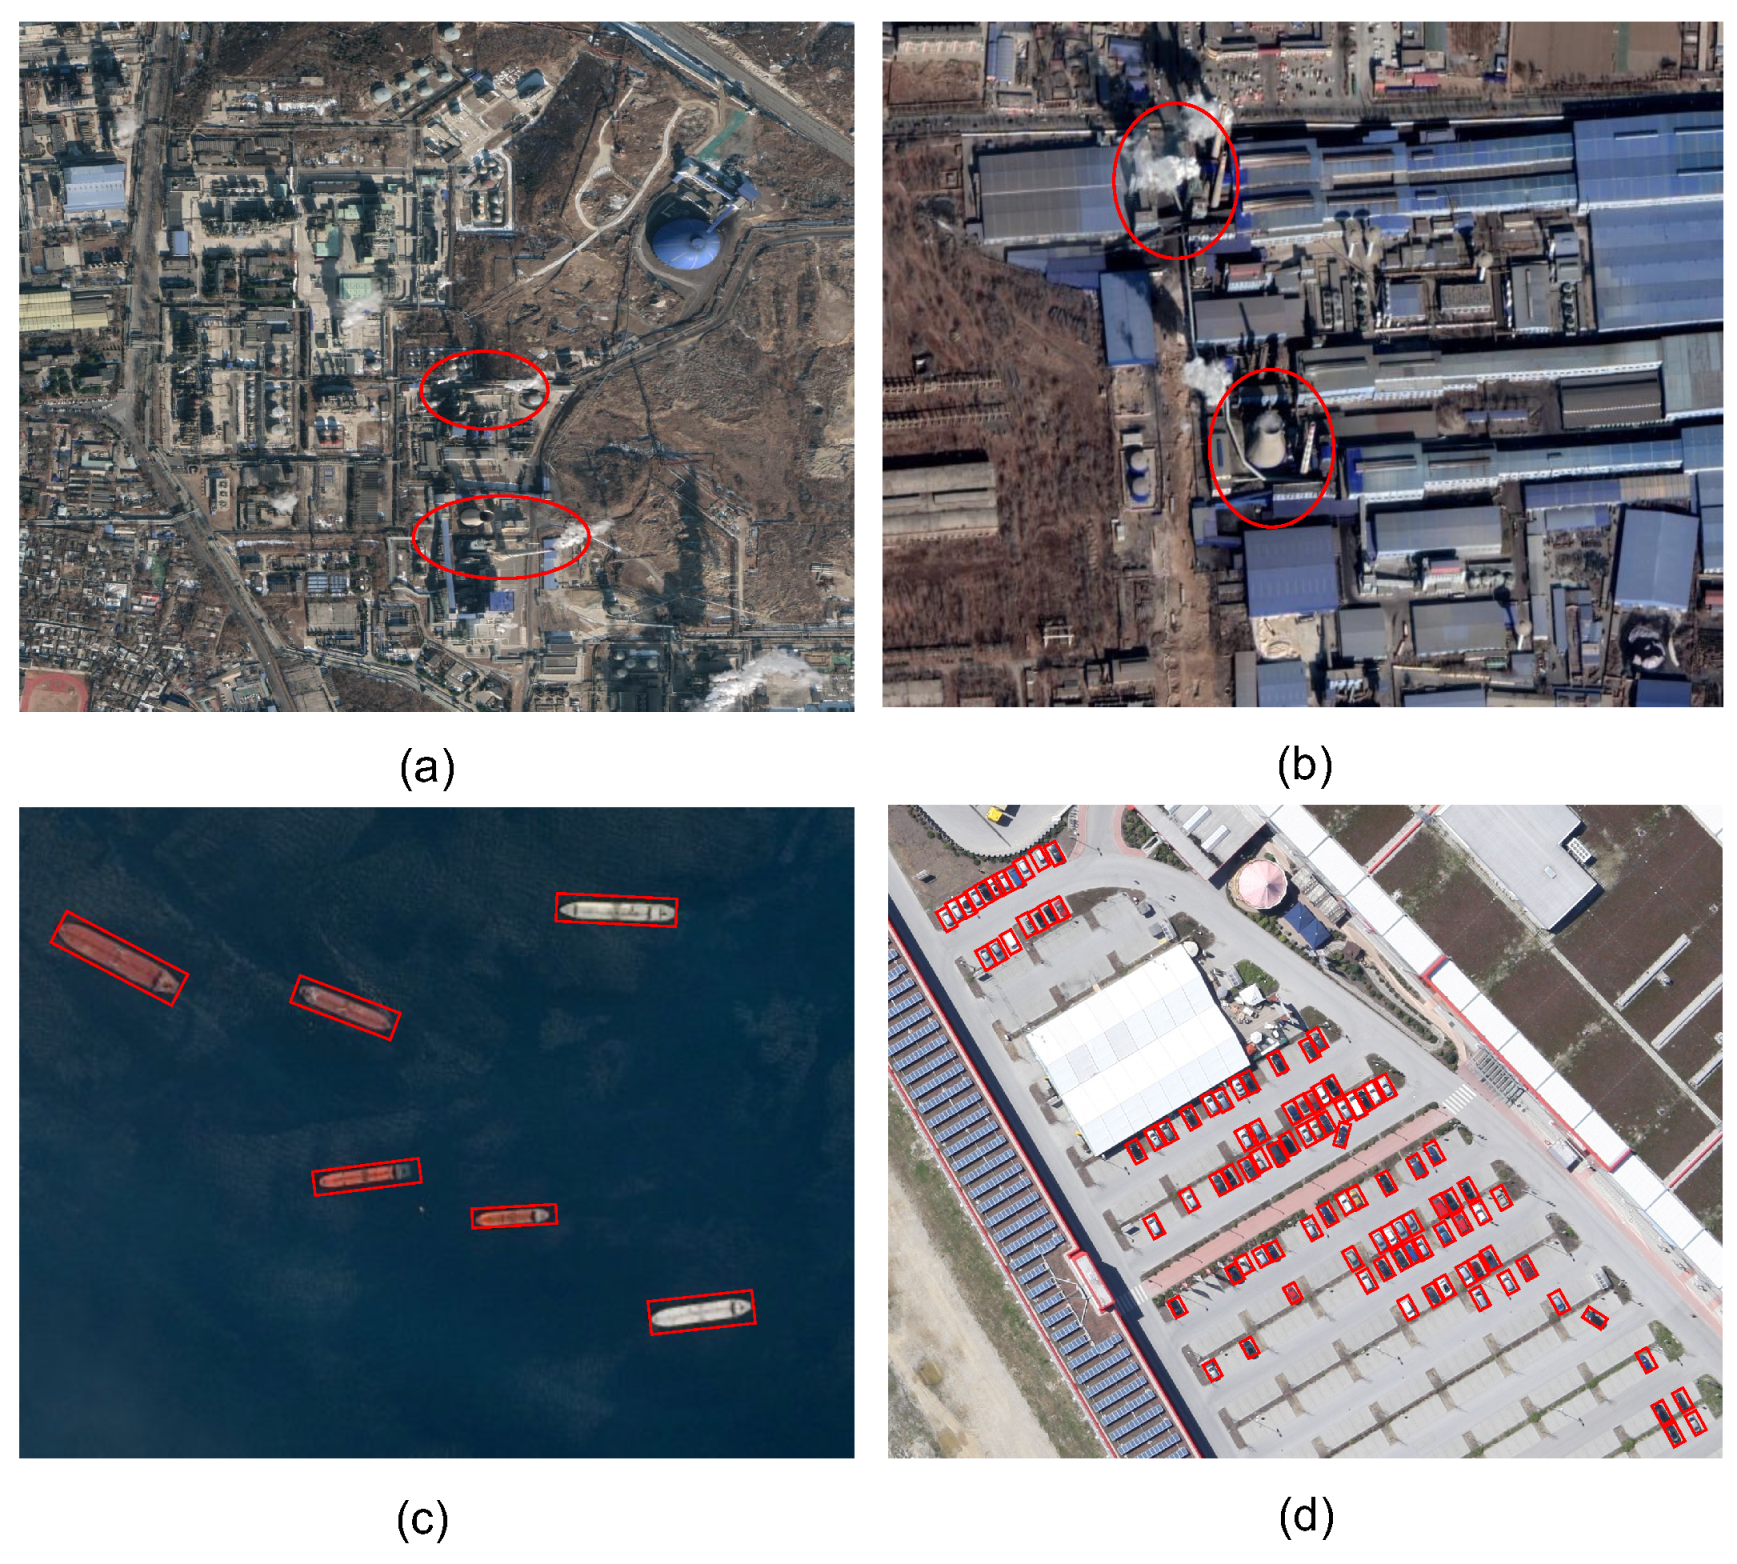
Nevertheless, using existing vanilla object detection methods for CFPP detection remains challenging. First, the complex nature of the target, which consists of different nonrigid components with blurred boundaries and complex composite spatial relationships, leads to inaccurate detection and imprecise location. Compared with cars and ships, CFPP is more challenging to detect due to similar and complex texture surroundings, resulting in false positives. Figure 1a,b illustrates a CFPP’s blurred boundaries and the spatial interrelationship of components, in contrast with the clear boundaries and lack of spatial relationship between cars and ships in Figure 1c,d. The strong contrasts between cars and ships make them easier to detect, while the similar or complex backgrounds of CFPPs hinder accurate detection. Identifying the working status of CFPPs requires correct identification of smoke, further complicating the task.
To address these problems in CFPP detection, we propose a (MUltistage Recursive Enhanced Detection Network) to improve CFPP detection performance and apply it in large-scale scenarios. Our contributions can be summarized as follows:
- (a)
- We construct a new dataset of CFPPs, including the location and working status of over 300 CFPPs collected from Google Earth at 1-meter resolution. The dataset is published in https://github.com/yuanshuai0914/MUREN (accessed on: 14 April 2023).
- (b)
- We design two enhancement mechanisms, i.e., a channel-enhanced subnetwork and a spatial-enhanced subnetwork embedded into the backbone of our detection method. CEN enhances feature representation for CFPPs and restrains the effects of noise for better training and testing performance. SEN learns the spatial relationship of components in CFPP and enriches the semantic and context information for better localization.
- (c)
- We integrate the recursive connections and improved Atrous Spatial Pyramid Pooling (ASPP) module into the Feature Pyramid Network (FPN). FPN fuses multilevel semantic and spatial information for small object detection. Recursive connections and the ASPP module make FPN receive features twice, boosting feature learning for small and irregular CFPPs.
The remainder of this paper is organized as follows. First, we briefly introduce the related work on object detection methods applied to remote sensing and coal-fired power plant detection in Section 2. After that, we explain our MUREN in detail in Section 3, then show the datasets and study area in Section 4. In Section 5 and Section 6, we analyze and discuss the CFPP detection performance of MUREN, including a comparative study and ablation experiments. Finally, we conclude this paper and present future work.
2. Related Works
This section briefly introduces CFPP detection-related works. We introduce object detection in remote sensing from dataset and algorithm aspects and introduce the recent progress in CFPP detection.
2.1. Object Detection in Remote Sensing
Object detection has always been a crucial issue in remote sensing because of its valuable and irreplaceable interpretation on optical images [39,40]. However, object detection in remote sensing images (RSIs) often faces many difficulties, such as the variations of sensors on satellites, different application scenarios, complex backgrounds, etc. [41]. To handle these problems, a lot of effort has been made to develop compatible methods for object detection in RSIs, including algorithms and datasets.
2.1.1. Algorithms in Related Works
In the last one or two decades, considerable work has been conducted to develop compatible algorithms for object detection in RSIs. We briefly divide them into two parts: traditional algorithms and machine learning algorithms. In traditional methods, for example, Peng and Liu [42] developed a shadow–context model to extract buildings in 229 dense urban aerial images by combining shadow information with context to verify building regions. Chaudhuri et al. [43] proposed a semiautomatic approach for road detection, whose customized operators include directional morphological enhancement, segmentation, and thinning. Eikvil et al. [44] proposed an automatic approach for vehicle detection consisting of a segmentation step followed by two stages of object classification that utilized multispectral images, panchromatic images, and road networks. In the machine learning field, for example, Yao et al. [45] proposed a computational model to detect airports in optical RSIs, which contained a target-oriented saliency model and a learned conditional random field (CRF) model. earned condition random field Zhu et al. [46] focused on ship detection and proposed a novel hierarchical complete and operational SDSOI approach based on shape and texture features, which is considered a sequential coarse-to-fine elimination process of false alarms. However, the aforementioned algorithms all utilize low-feature or middle-feature representation for object detection [47], which only achieve low accuracy or limited application scenarios.
As a part of machine learning, deep learning has made remarkable progress recently. With its development, the accuracy and efficiency of object detection has made significant improvement. Compared with traditional methods, deep-learning-based object detection algorithms can be quicker, more robust, and more generalized when encountering a huge amount of data, complex backgrounds, and scenarios. Since these advantages of deep learning methods are in accordance with the needs of remote sensing scenarios, remote sensing images based object detection applications using deep learning methods have also increased quickly [30,31,39,41,48,49,50]. For example, Li et al. [51] presented a rotation-insensitive Region Proposal Network (RPN) by introducing multiangle anchors into the existing RPN based on the Faster R-CNN pipeline, which can effectively handle the problem of geospatial object rotation variations. Liu et al. [52] designed a framework-based YOLOv2 for detecting arbitrarily oriented ships, which can directly predict rotationally oriented bounding boxes. Li et al. [53] designed a feature-attentioned end-to-end framework for object detection in remote sensing imagery, which performed well on the DOTA and UCAS-AOD datasets. Sun et al. [54] proposed a unified part-based convolutional neural network called PBNet for composite object detection in remote sensing imagery, containing a part localization module and a context refinement module.
2.1.2. Datasets in Related Works
Unlike natural scene images, optical RSIs usually provide overlook, sight, and profile information, with larger scales and more spatial information. As a result, it is difficult to directly translate trained recognition from natural scenes to RSIs. With the efforts in research in object detection in RSIs, several object detection datasets of optical RSIs have been collected and constructed. For example, Cheng and Han [39] developed a dataset named NWPU-VHR10, which contains ten geospatial object classes, including airplane, basketball court, baseball diamond, bridge, harbor, ground track field, ship, storage tank, tennis court, and vehicle. It consists of 715 RGB images and 85 pan-sharpened color infrared images, of which the resolution varies from 0.08 m to 2 m. Zhu et al. [55] collected a typical dataset for airplane and vehicle detection, i.e., UCAS-AOD, which consists of 600 images with 3210 airplanes and 310 images with 2819 vehicles. Zhang and Deng [7] constructed a CFPP dataset named BUAA-FFPP60, which contains over 60 CFPPs, including not only locations and class labels but also working status labels. The aforementioned datasets are widely used in object detection in remote sensing research [53,56,57,58,59] and make outstanding contributions to the Earth observation community.
2.2. Coal-Fired Power Plant Detection
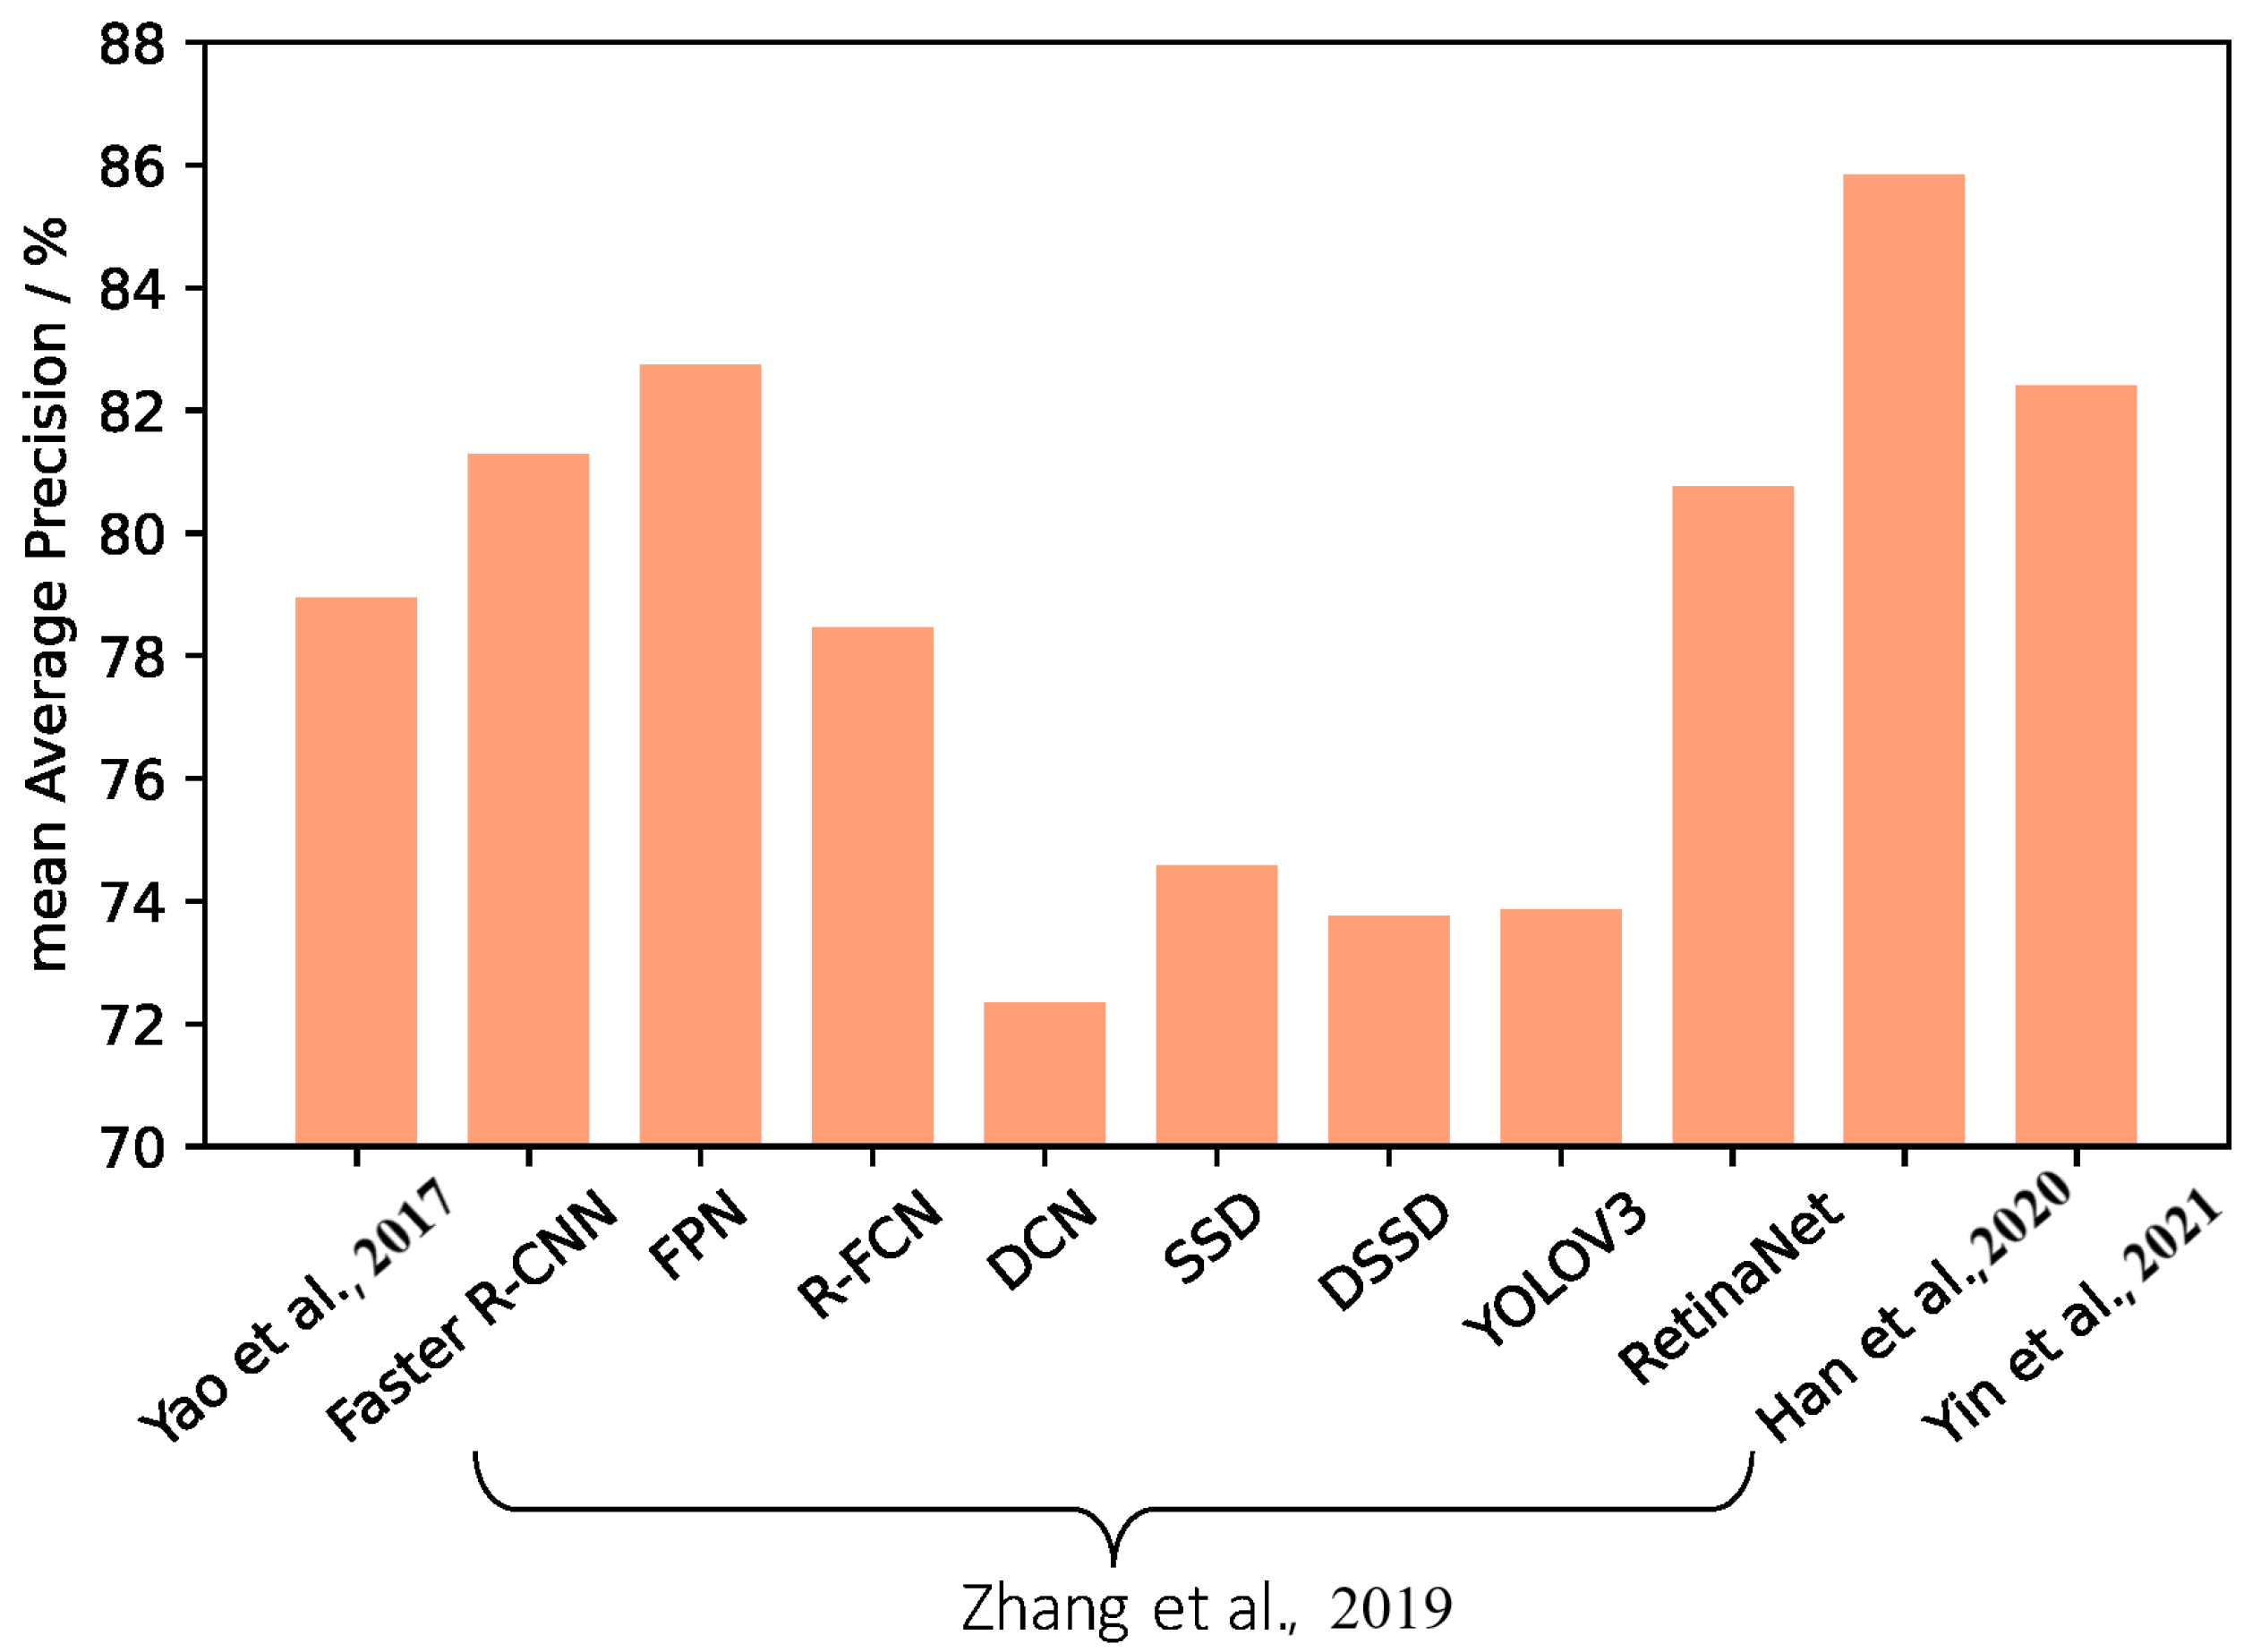
CFPP monitoring has always been a crucial issue in emission estimates and air pollution management. However, precise CFPP detection has just received attention for a half decade. Before the emergence of deep learning algorithms and the availability of HRSI datasets, related work could only focus on qualitative and experiential analysis [60,61,62]. Along with the development of algorithms and HRSI datasets, progress has been made on the issue of precise CFPP detection. For instance, Zhang and Deng [7] collected a dataset named BUAA-FFPP60 and compared eight deep learning models in CFPP detection, comprehensively analyzing their performance on accuracy, speed, and hardware cost. Yao et al. [10] presented a Faster-R-CNN-based network to reap chimney and condensing tower integrated detection. Han et al. [8] firstly trained a Faster R-CNN model to detect CFPP, and then used two spatial analysis methods, the digital terrain model (DTM) filtering and main direction test, to remove the false results and add missed targets. Deng and Zhang [9] further increased the scale and level of feature pyramids based on the vanilla Feature Pyramid Network (FPN) to improve the performance in CFPP detection. Yin et al. [63] proposed a CFPP detection network designed for nonrigid components, including a one-stage detector, a context attention multiscale feature extraction subnetwork, and a part-based attention module. The comparative detection results evaluated by the average precision are shown in Figure 2.
Deep learning algorithms are widely used for CFPP detection, but efficiency and accuracy are limited due to the complex nature of CFPPs, including multiple objects with variable layouts and similar background patterns, as well as a lack of a generalized end-to-end workflow for practical applications. To address these issues, we propose MUREN, a multistage end-to-end CFPP detection algorithm that enhances accuracy and efficiency for large-scale RSIs.
3. MUREN
3.1. Overview of Our Method
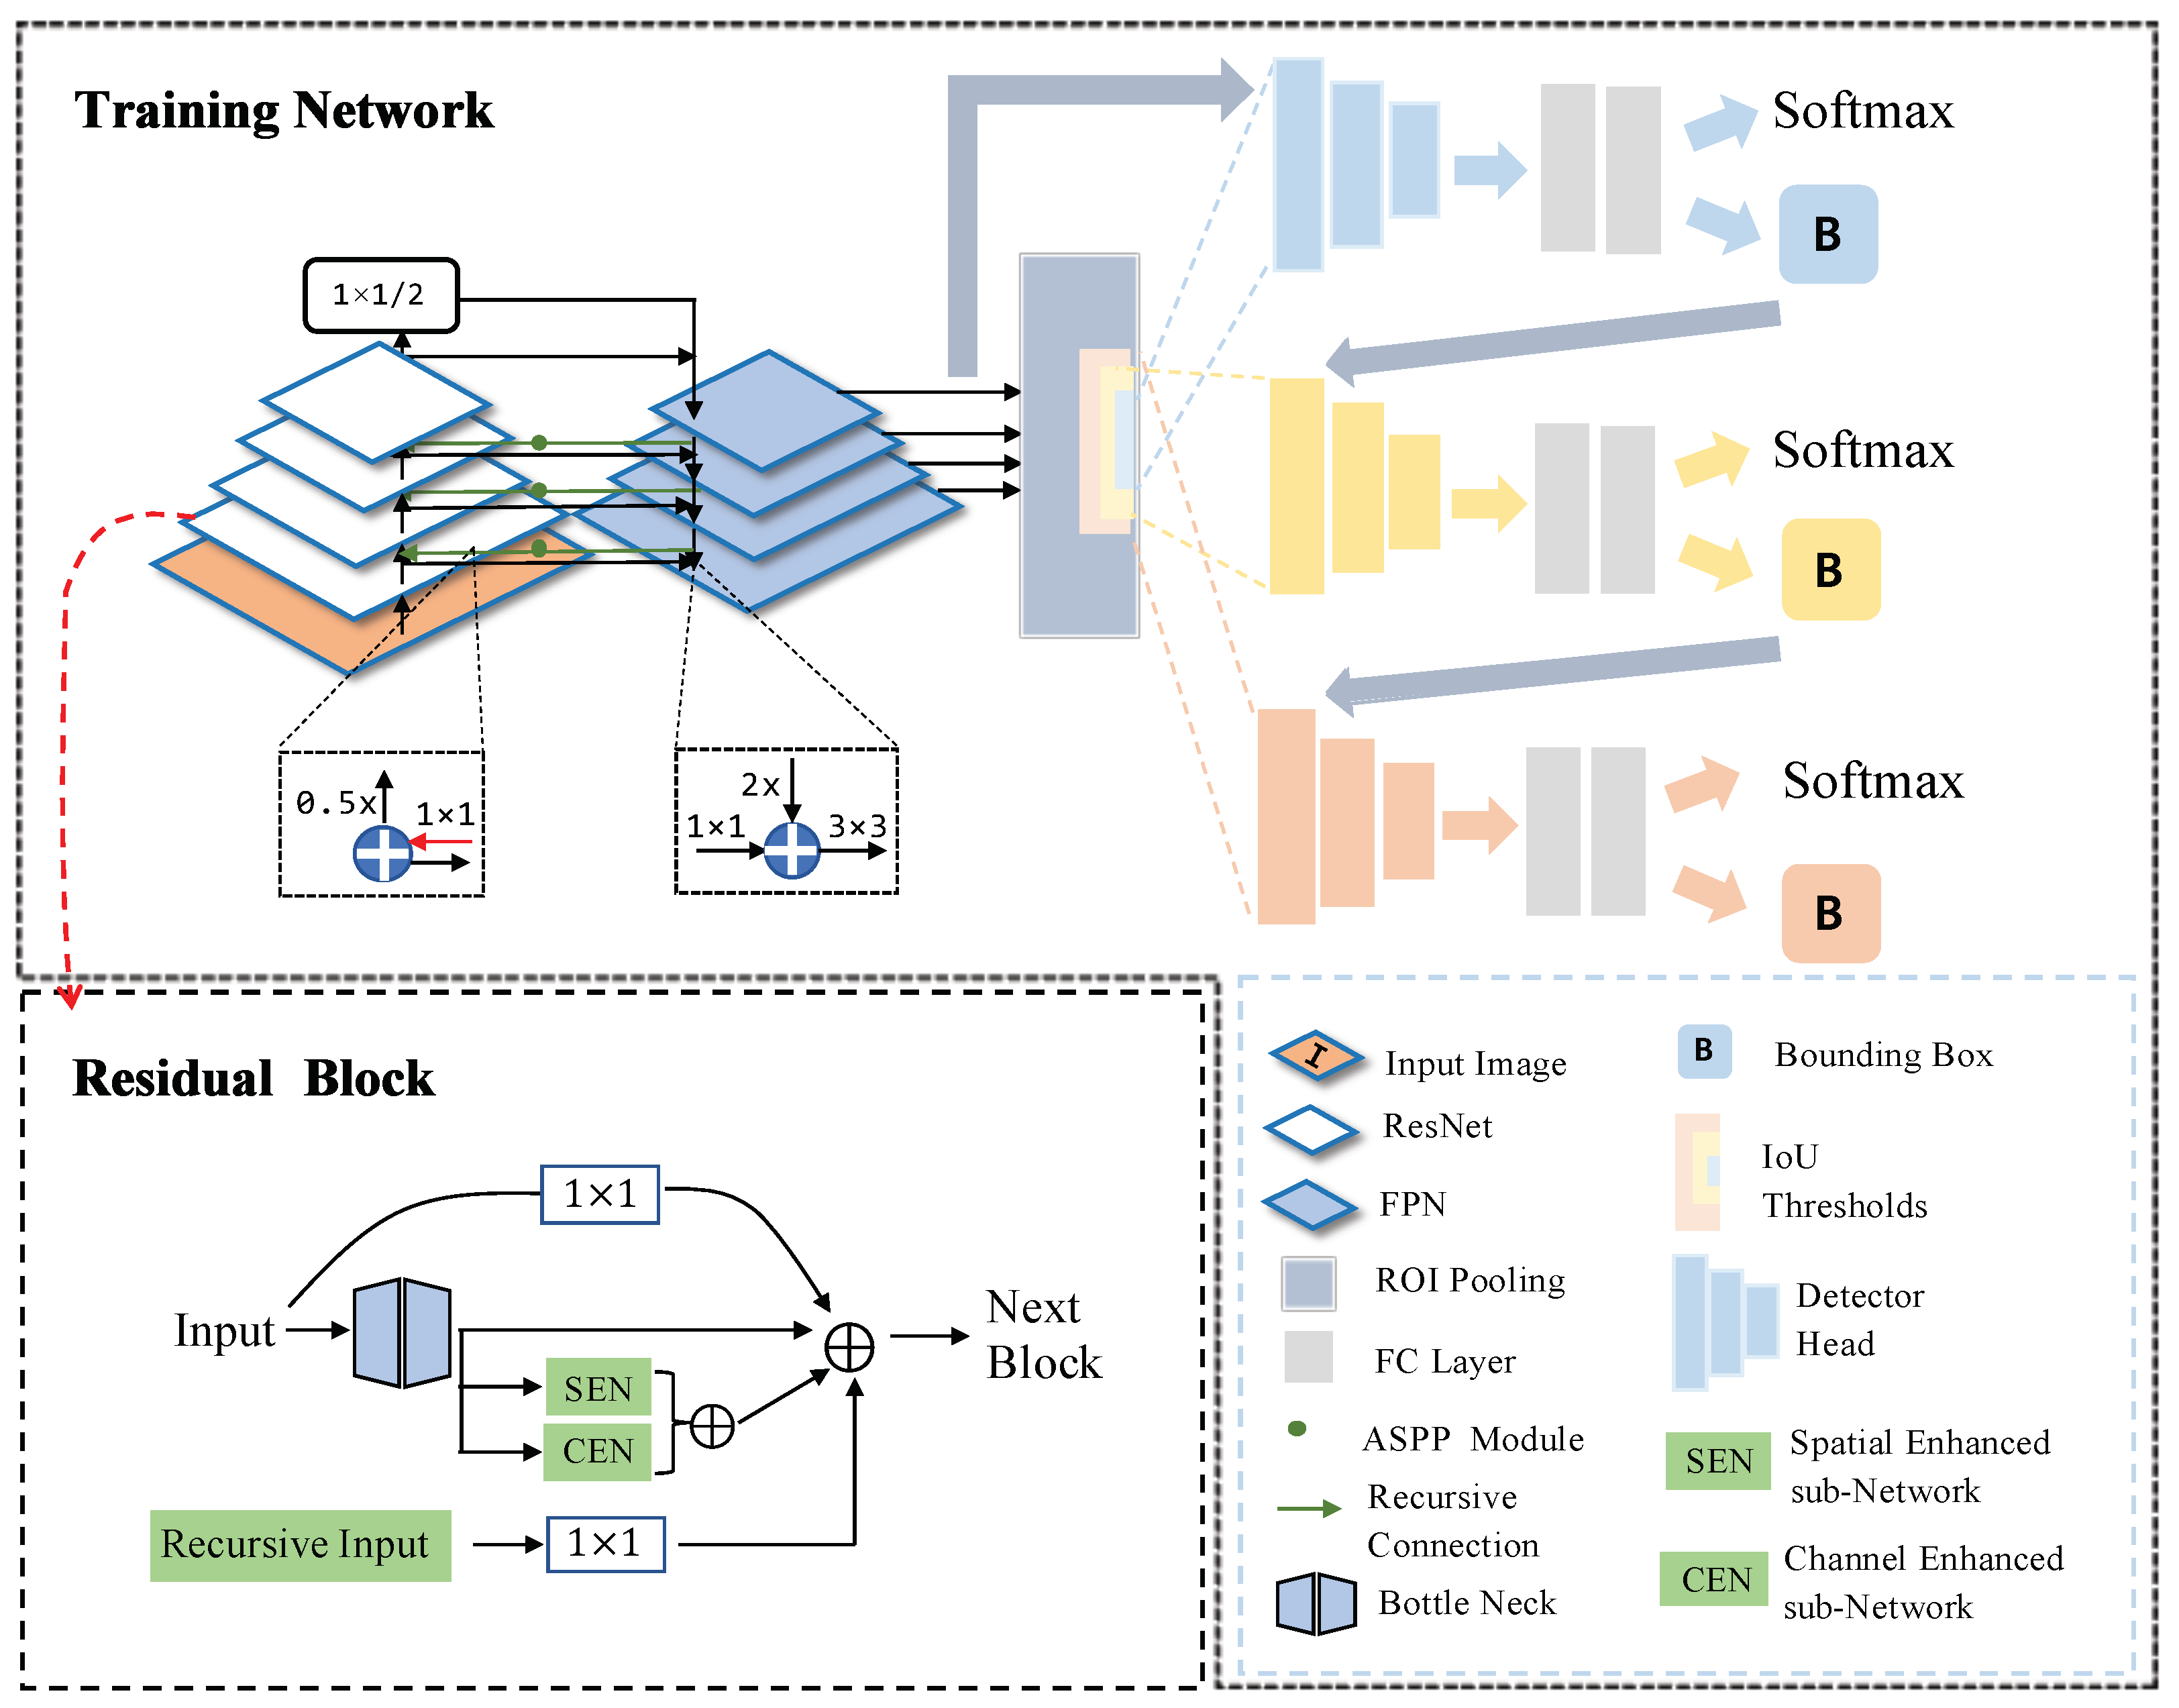
MUREN is a multistage detection network that functions in an end-to-end manner. Designed for large-scale CFPP detection, MUREN first handles the enormous input pixels. The massive input images are first cropped from 8000 × 8000 pixels to a much smaller size, e.g., 600 × 600 pixels, with 20% overlap of each slice to reduce time and computation consumption, and in the meantime, to save complete individual object information. Our goal is to achieve accurate large-scale composite CFPP detection. Because a typical CFPP consists of various components with nonrigid spatial relationships and blurred boundaries, as well as similar complex textures surrounding it, it is necessary to enhance the feature representation and channel–spatial relationships of these objects and cripple the noise disturbance. As a result, our proposed detection framework includes (as shown in Figure 3) a channel-enhanced sub-network, a spatial-enhanced sub-network, a recursive connection added in the Feature Pyramid Network, and a multistage detector-based Cascade R-CNN.
- (1)
- A channel-enhanced subnetwork (CEN) for tackling the similarity of background patterns. In parallel with ResNet-50 [64], we add a channel-enhanced subnetwork consisting of a global average pooling layer, a global max pooling layer, two fully connected layers, and a batch normalization layer followed by an activation layer, which reaps adaptive channel recalibration and improves the object feature representation.
- (2)
- A spatial-enhanced subnetwork (SEN) for tackling the spatial interrelationship of CFPPs’ complex components. In addition to CEN and ResNet-50, we propose a symmetrical spatial-enhanced subnetwork consisting of a global average pooling layer, a global max pooling layer, and a convolutional layer followed by an activation layer.
- (3)
- A recursive connection is added in FPN to strengthen the global feature and receptive field. FPN constructs the feature pyramid to gain different scale features and build connections between the same-scale feature map. We use a recursive connection from the FPN layers to the backbone layers. This connection gives feedback received from the FPN to the previous backbone to strengthen the object feature extraction.
- (4)
- A multistage detector after Region of Interests (RoI) Pooling. We adopt a Cascade R-CNN-based multistage detector in the end, containing three detectors with different Intersection of Union (IoU) thresholds trained sequentially, using the output of a detector as the training set for the next.
3.2. Symmetrically Enhanced Network
As a composite target, CFPP owns various components with a nonrigid spatial relationship and blurred boundaries. In addition, the complex backgrounds can create massive obstructions when extracting features and generating RoIs, as well as increase false positives and decrease accuracy. To address this problem, it is essential to strengthen the features of every part and weaken noise disturbance. Here, we propose a symmetrically enhanced network, containing both a channel-enhanced subnetwork and a spatial-enhanced subnetwork, symmetrically located beside the backbone. The structure is shown in the Residual Module in Figure 3.
3.2.1. Channel-Enhanced Subnetwork
As we can see, the channel-enhanced subnetwork has a squeeze-and-excitation block [65]. This subnetwork learns the relationship and importance of each input channel and represents the level of importance as different weights. Then, the weights are applied to matched channels to achieve adaptive channel recalibration by strengthening the object feature and constraining the noise.
In the squeeze section, we first need to separate each channel and perform feature compression on each channel, switching each two-dimensional channel feature information into a real number, representing a global context to some extent. This procedure can be achieved by a global average pooling layer (GAP) and a global max pooling layer (GMP) [66]. GAP computes one real number to represent the global feature in one channel, at the cost of blurred feature information after the average operation. GMP preserves the most prominent information, with the possibility of noise rather than the object feature. As a result, we maintain both GAP and GMP to keep both the global feature and the most prominent signal. Specifically, the input feature map represents features with C channels. The output feature map after global average pooling represents the global average context information. The output feature map after global maximum pooling represents the global maximum context information. represents the GAP output of the feature map in channel dimension. represents the GMP output of the feature map in channel dimension. presents the addition of and . identify the element located at in the feature map. represents the output queued up in channel order. Then, we can define the squeeze operation as follows:
The can be identified as the typical representative of the entire feature map and can also be used to extract global context information, which serves as a guide to further enhance network performance. The global average pooling output may eliminate some specific information by averaging; so, we also employ the global max pooling layer and combine it in an addition manner, resulting in .
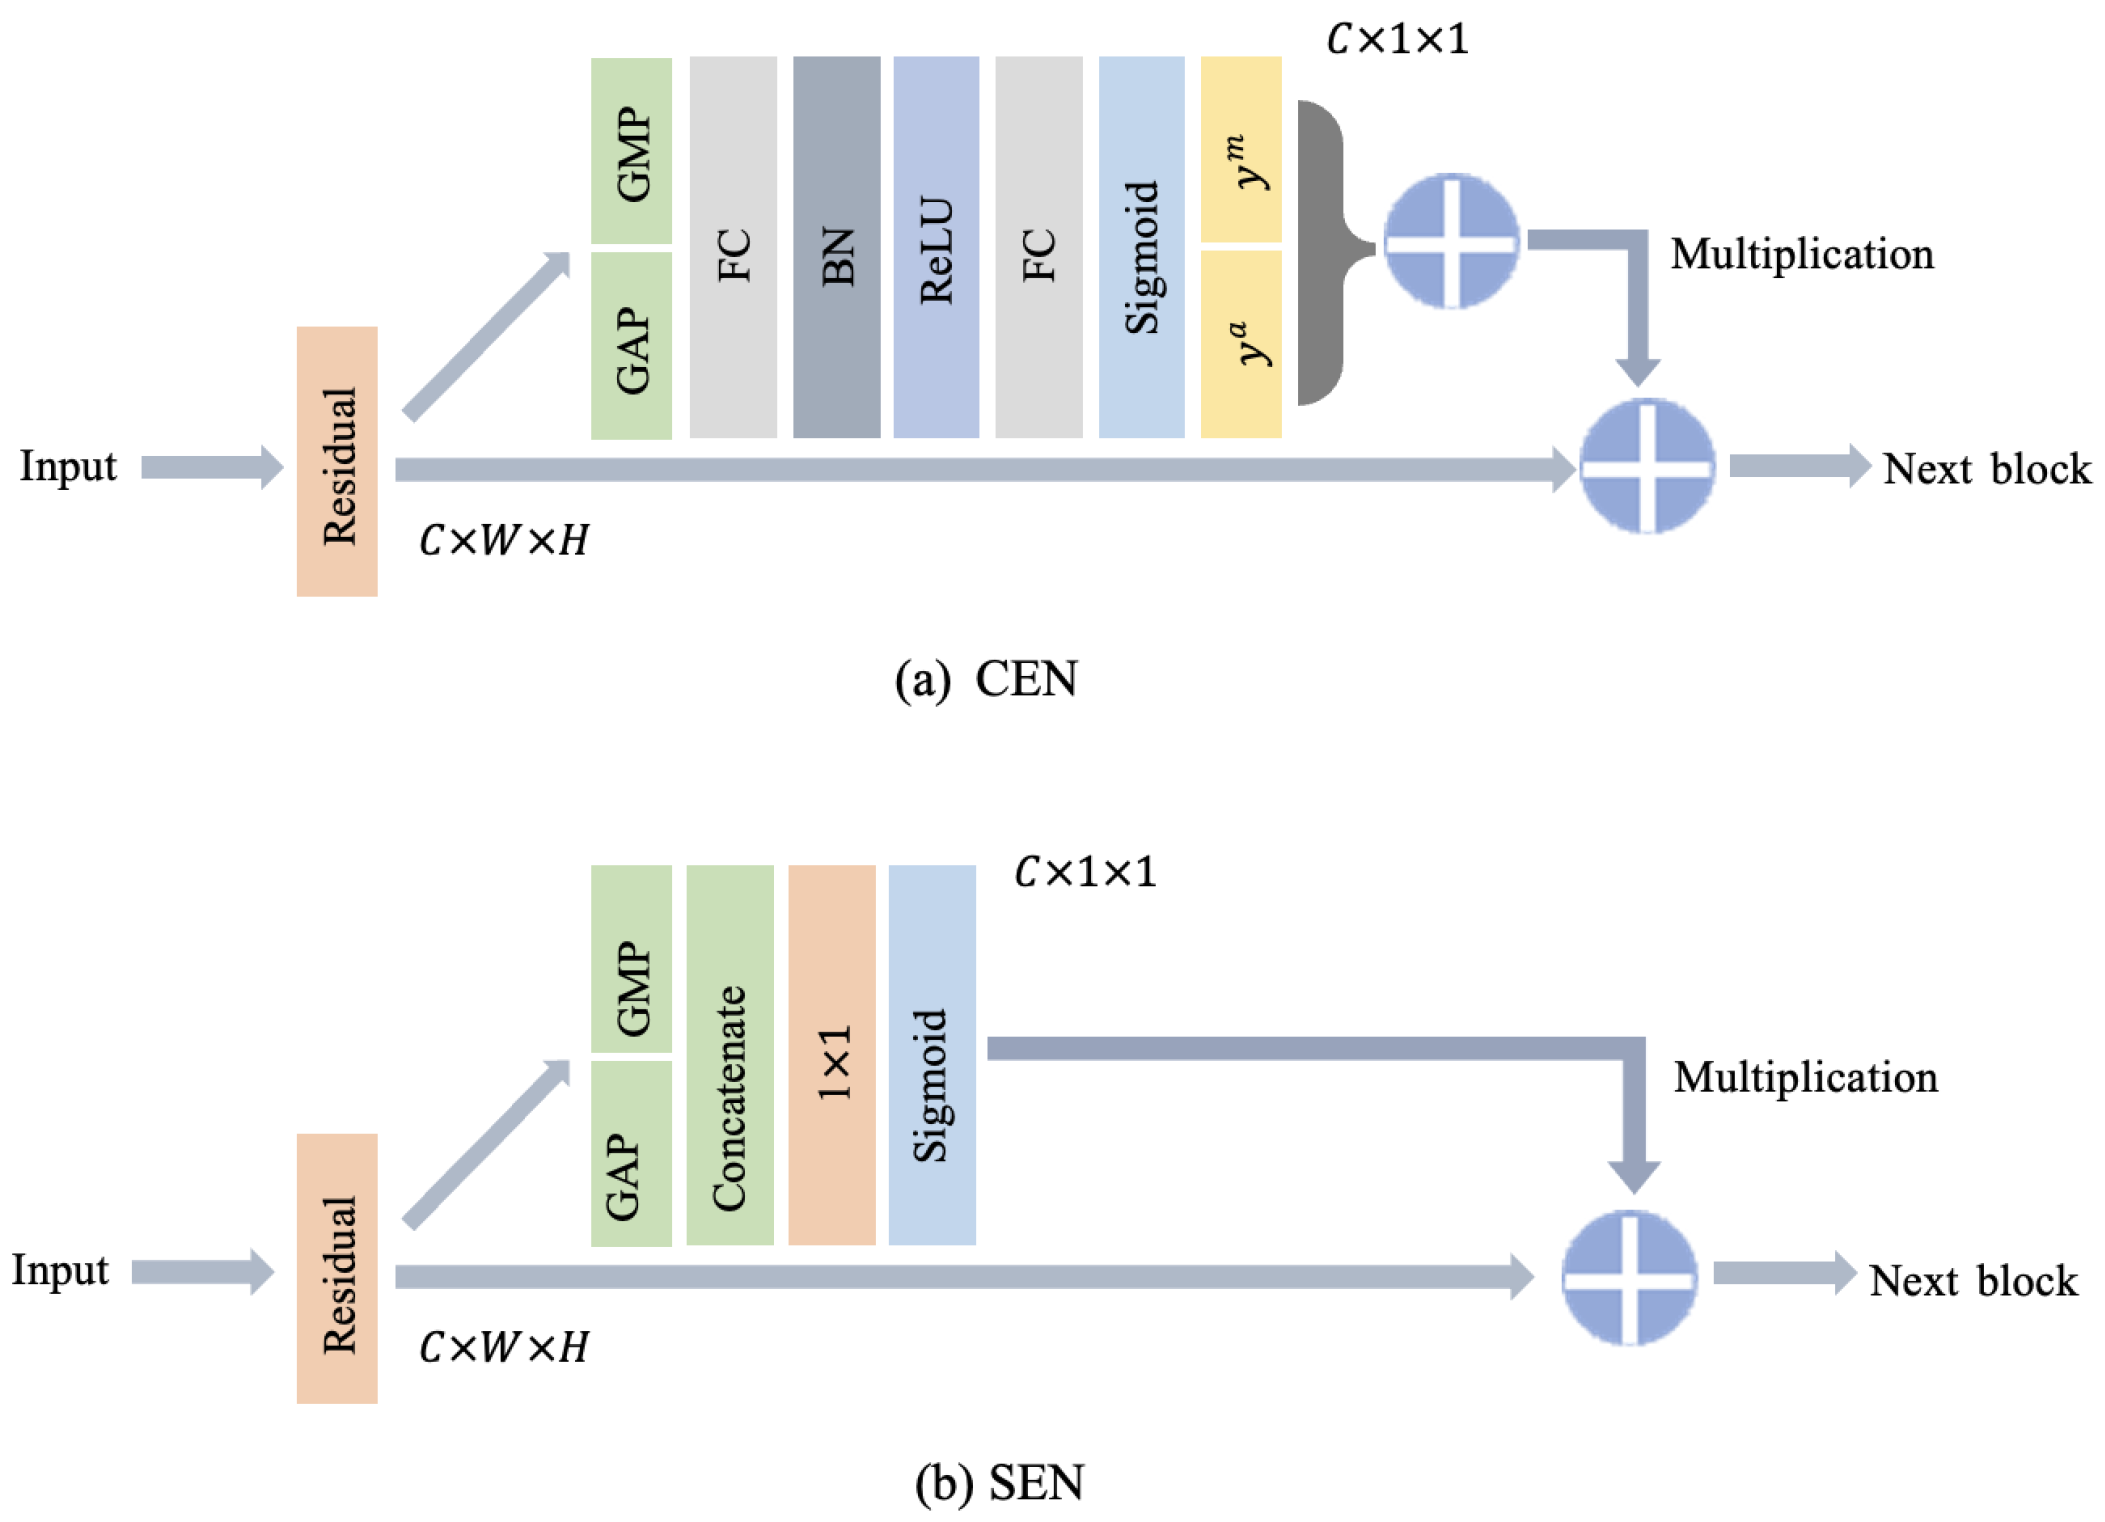
After the squeeze operation, we need to learn the relationship and importance in a channel-wise manner, gain the weights of each channel, and match these weights with the global average pooling output of the squeeze operation. In the excitation section, we employ a bottleneck-like construction consisting of two fully connected layers, a batch normalization layer followed by a ReLU activation layer, and a Sigmoid activation layer, as shown in Figure 4. Two fully connected layers construct channel weights by two convolutions via input feature map fusion and generate a same-sized output as input . The batch normalization layer is a feature normalization technique that is inserted into deep learning architectures as a trainable process to reduce internal covariant shift [67], in which the distribution of features often continuously changes over the training iterations. The ReLU activation layer is used because of its capability of preventing gradient vanishing [68]. After the second fully connected layer, we set a Sigmoid activation layer to obtain a normalization value in a range [0,1].
We define as a real number queue in (0,1) in channel order. is the Sigmoid function. and refer to 2 fully connected layers. B is the BN layer. represents the ReLU activation function, and ∗ is the convolution operation. The whole procedure can be described as follows:
where indicates the importance of each channel, learned from the fully connected and nonlinear layers before. Then, we conduct a channel-wise multiplication to achieve the end-to-end adaptive channel recalibration.
3.2.2. Spatial-Enhanced Subnetwork
Symmetric with the CEN, the spatial-enhanced subnetwork lies beside the identity shortcut in the backbone. Different from the CEN, this subnetwork focuses on the interobject spatial relationships of features. Different components of CFPPs in satellite images contribute to the CFPP detection task differently, and each component has special spatial interrelationships with one another. As a result, we still use GAP and GMP, but replace the fully connected layers with convolutional layers. As shown in Figure 4, we first employ GAP and GMP to obtain the global context from the average and the maximum perspectives. Then, we concatenate both of them to generate a new spatial information descriptor. This concatenation can use information from both the average and the maximum perspectives, which has been proven to be efficient in previous efforts [69]. Afterward, we adopt a convolutional layer to extract the feature map from the concatenation descriptor, and the output can indicate the “whereabouts” of the object. Finally, three feature maps, the feature map from the backbone, new feature map from CEN, and new feature map from SEN, are aggregated together by multiplication.
Similarly, we can describe the SEN procedure as follows:
represents the output feature map of SEN. is the Sigmoid function, and f refers to the convolutional layer. represent the output features of GAP and GMP, respectively.
3.3. Recursive Connection in FPN
The recursive connection in FPN is designed for enhancing feature representations in the feature extraction step. There is a reasonable assumption that human visual perception does not process the entire image at once and needs feedback to capture more details in one image [70]. Similarly, it is likely to miss important information in one shot when processing images in neural networks. Therefore, designing a feedback mechanism in neural networks can be efficient in object classification and location. Here, we follow Qiao et al. [71] to employ a Recursive Feature Pyramid (RFP)-based structure, boosting training speed and performance. This structure contains FPN, recursive connections, and an improved Atrous Spatial Pyramid Pooling (ASPP) module.
3.3.1. Feature Pyramid Network
FPN brings significant progress to multiscale object detection performance [72]. This top-down, bottom-up structure with lateral connections can fuse features from different levels to obtain abundant semantic information, achieving good performance in small object detection. In the same way as Lin et al. [72], we define as the ith feature level in the bottom-up pathway, as the feature level in the top-down pathway, and as the output feature map. f is the convolution operation. We can describe FPN as follows in Formulas (7)–(9):
3.3.2. Recursive Connection
As shown in Figure 3, the recursive connections are added into FPN. These connections bring feedback received from FPN to the backbone, enhancing the FPN representation capability. Here, we denote as the feature transformation before transmitting from FPN to the backbone, and we can obtain the recursive connection Formula (10):
In order to be compatible with the recursive connections, we redesign the backbone, i.e., ResNet50, on the basis of the two aforementioned enhanced subnetworks. We additionally design a branch road for recursive features in the first residual block in each stage, as shown in Figure 3. To use the feature , we add a convolutional layer before the merge.
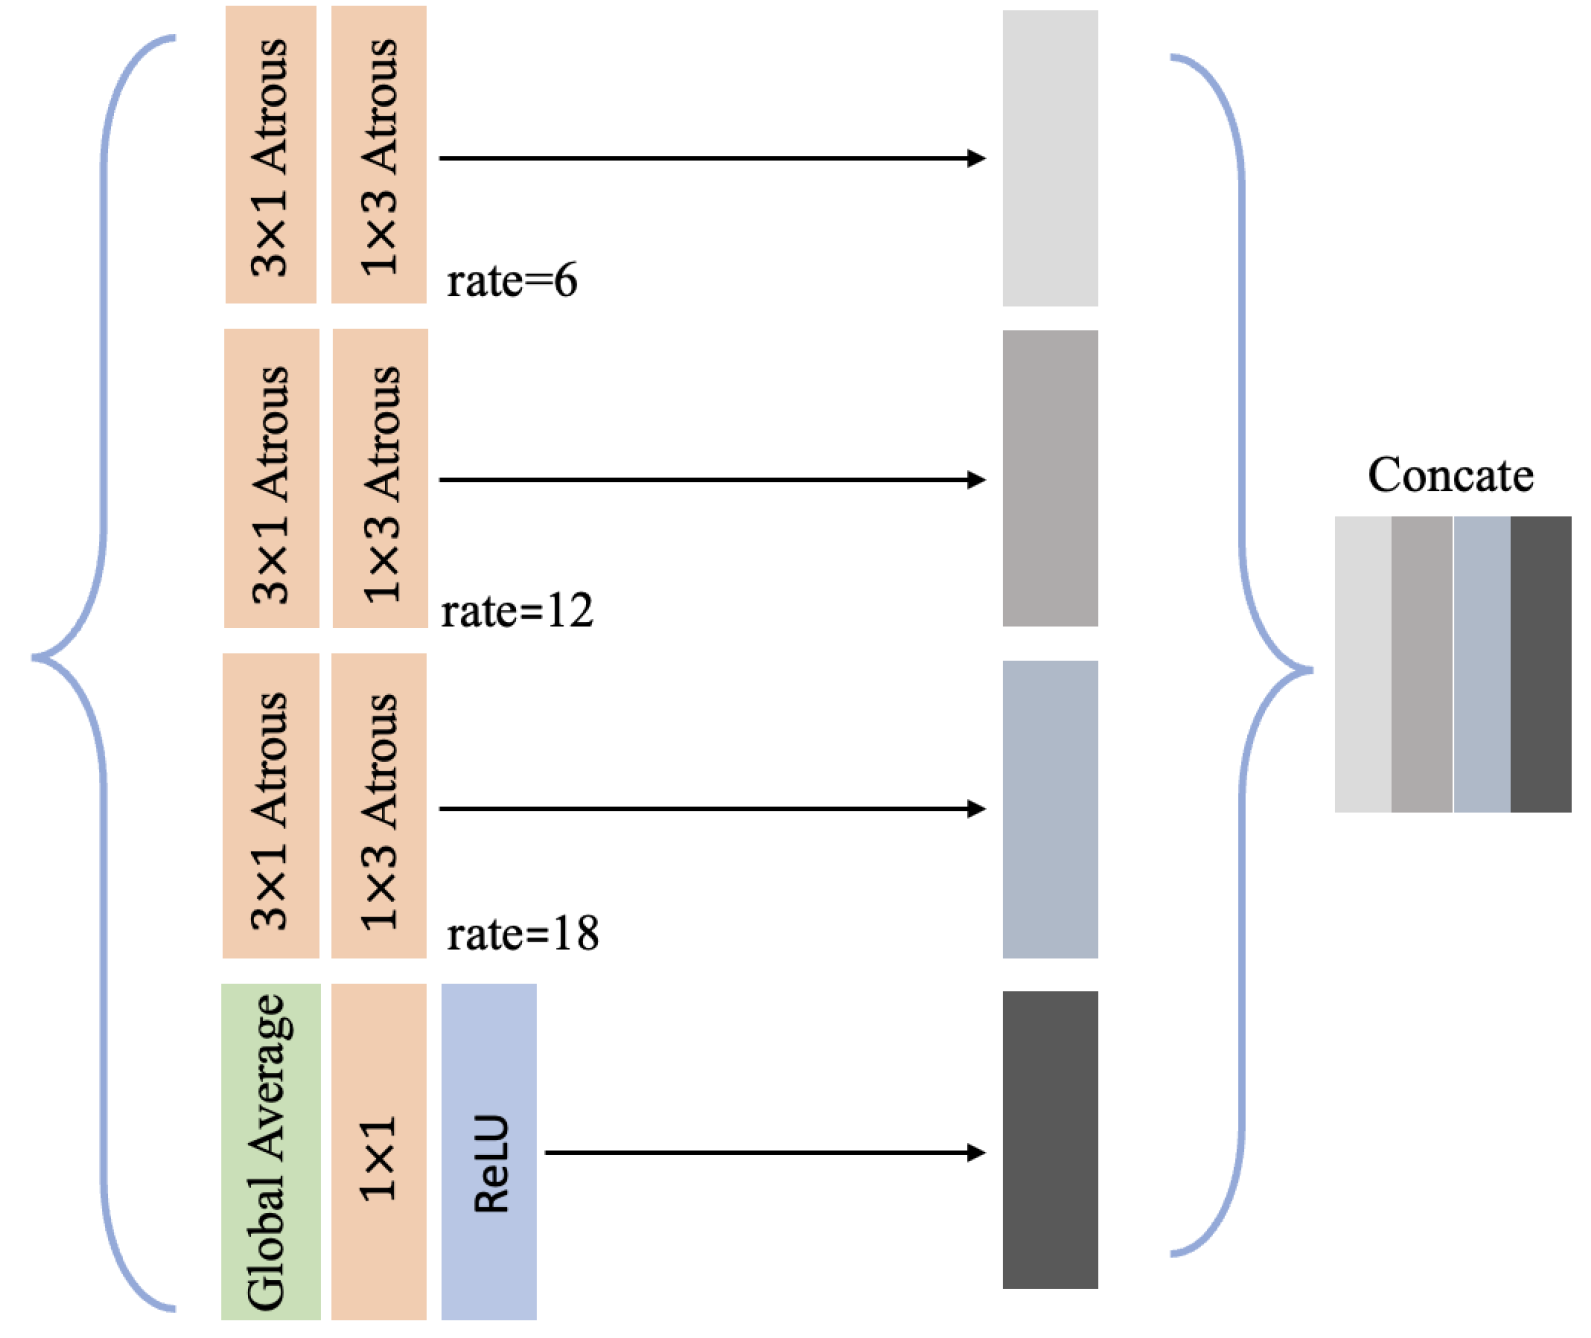
3.3.3. Improved ASPP Module
As stated in Qiao et al. [71], ASPP [73] is used for the implementation of connections between the FPN and backbone, in which there are four parallel branches taking as their inputs. Outputs denoted as are the concatenation of four feature maps generated from four branches, respectively. Since the convolution in the ASPP module will learn some redundant information, the number of parameters is large, so it will take a long time to train. Here, we decompose the atrous convolutional layers in ASPP into a and a layer to maintain its atrous rate [74]. This improved ASPP module can efficiently reduce the parameter amount and boost training speed. Figure 5 shows the improved ASPP module architecture.
3.4. Multistage Detector
Cascade R-CNN has proved its effectiveness in object detection, addressing the overfitting and inference–time mismatch problems and improving the bbox quality significantly [20]. Here, we employ this cascade architecture as our detector. There are three R-CNN stages using outputs from the current stage to train the next. The three stages are performed in a sequential manner and have their own IoU thresholds, i.e., (0.5, 0.6, and 0.7).
4. Datasets and Study Area
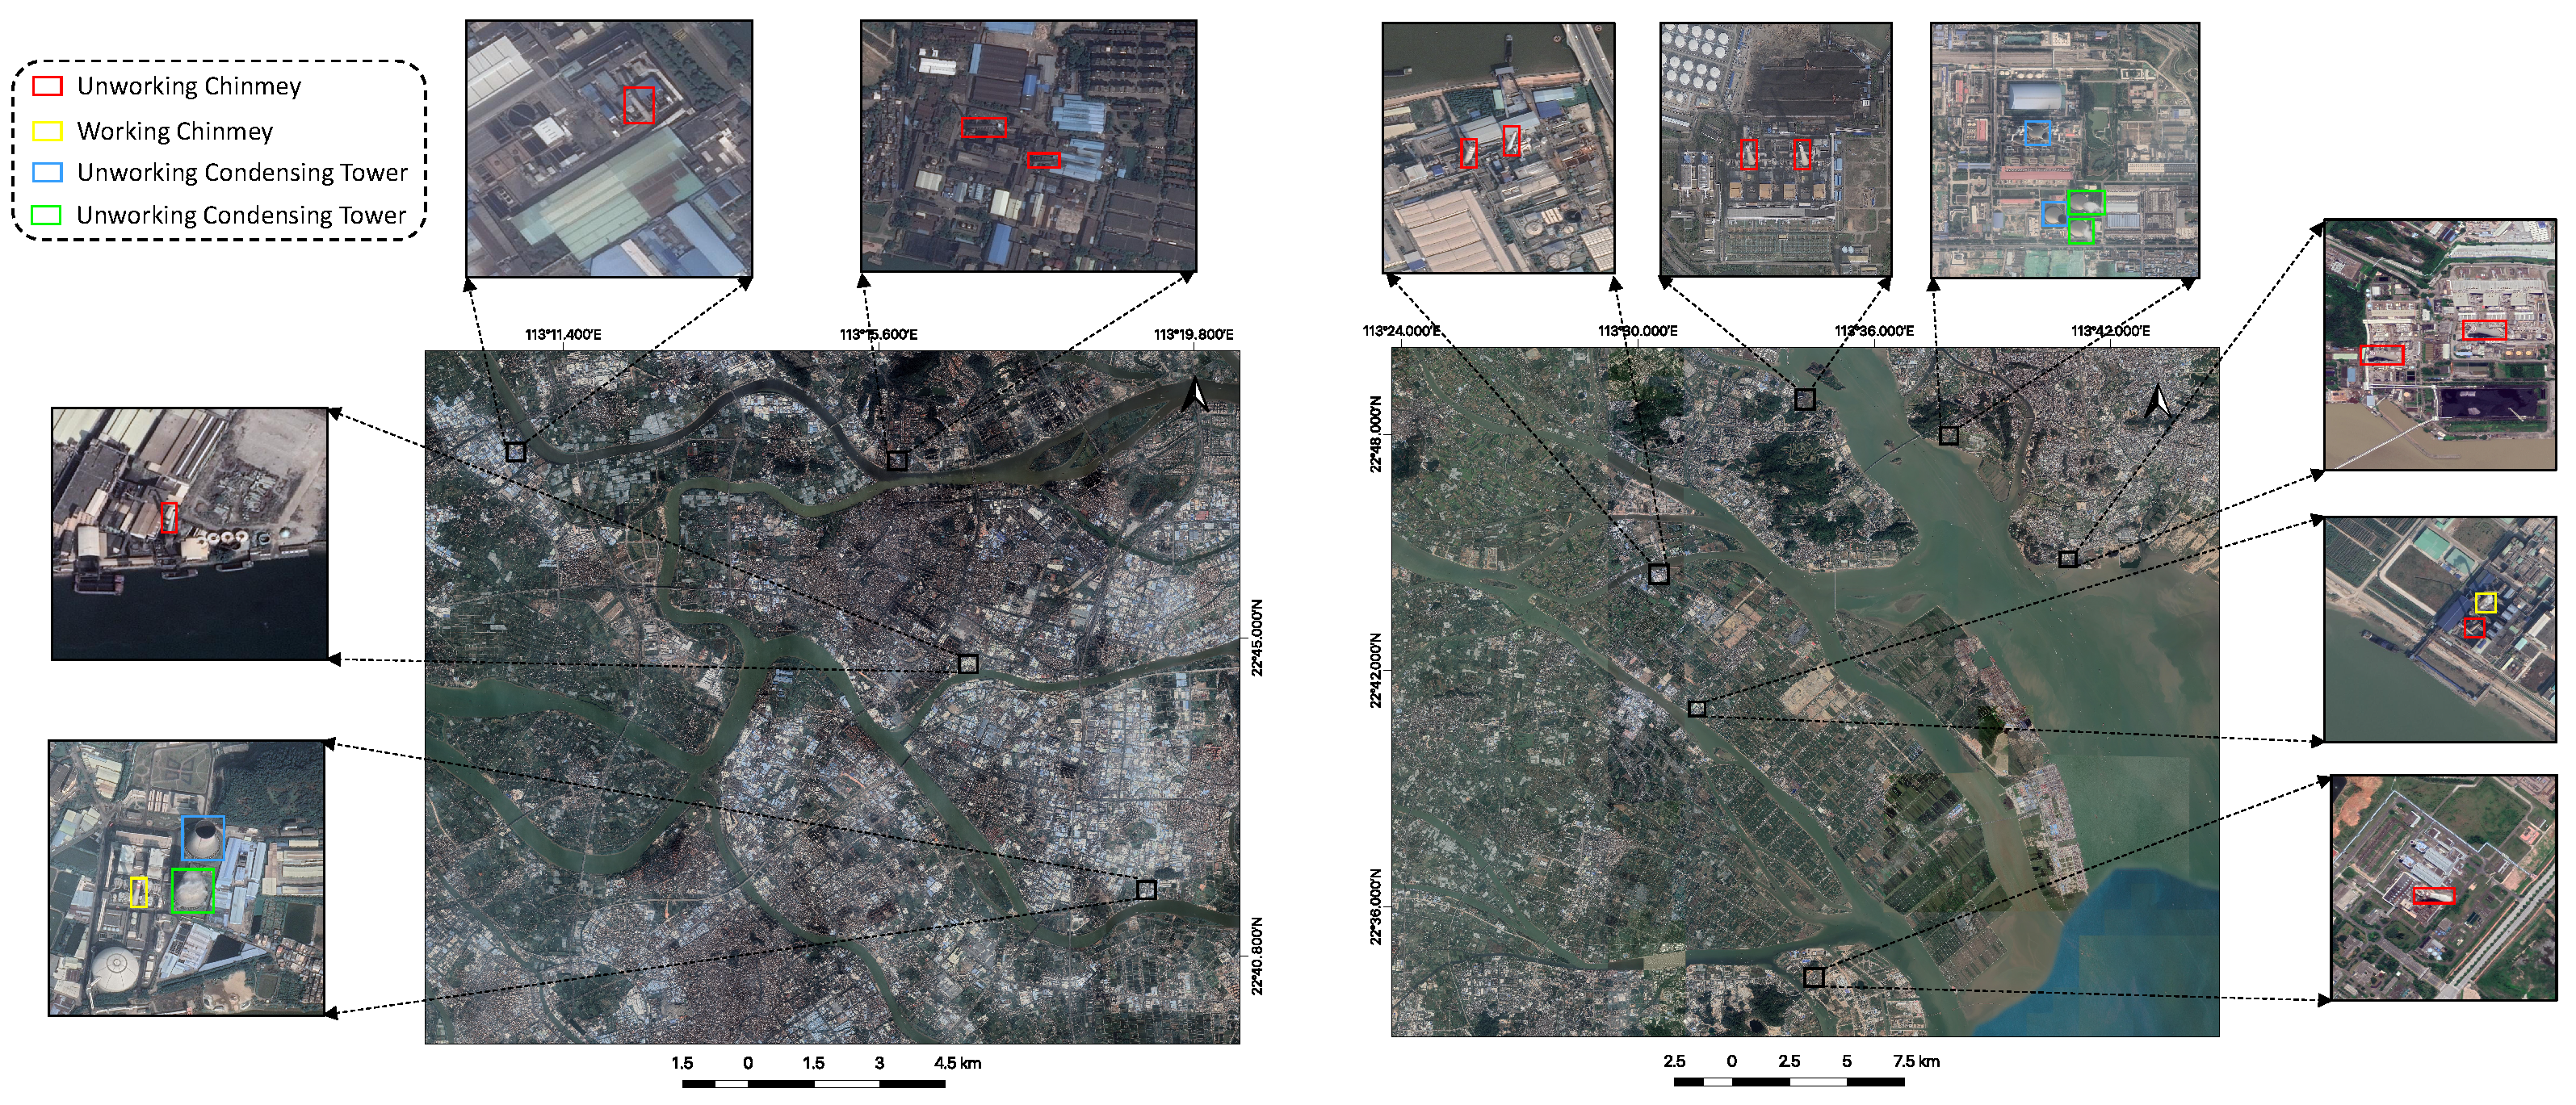
To the best of our knowledge, Yao et al. [10] collected the first dataset for CFPP detection. Zhang and Deng [7] added 101 images to this dataset and named it BUAA-FFPP60. This dataset is so far the most comprehensive and most popular dataset for CFPP detection. However, this dataset is collected in the Beijing–Tianjin–Hebei Region and only contains 318 original pictures, which is still not enough for large-scale applications in other locations for both training and testing. To improve the diversity of dataset resources, we collected and constructed a new dataset called HPGC-CFPP, which contains 300 original CFPP HRSIs collected in the Guangzhou–Foshan–Zhaoqing region from 2015 to 2019, covering over 25,000 km. These 300 images contain over 70 CFPPs with 1 m resolution in Google Earth, ranging in size from to pixels. We manually labeled and interpreted four types of CFPPs, including two types of objects, i.e., chimney and condensing tower, and tower working status, i.e., working and nonworking. By pairing one type of object and one status, there are four labels in our datasets, i.e., working chimney, nonworking chimney, working condensing tower, and nonworking condensing tower. As Figure 6 shows, a CFPP’s location may contain several different components, including chimneys and condensing towers with different working statuses. Different constructions belonging to one CFPP are included in one labeled image. In this paper, we use both BUAA-FFPP60 and HPGC-CFPP to realize robustness and avoid overfitting. After rotation, mirroring, and blur operations, we obtained 1200 images as our training dataset and 400 images as our test dataset, of which 200 images are for model evaluation, and the 200 images collected in the Guangzhou–Foshan–Zhaoqing region are for large-scale application evaluation.
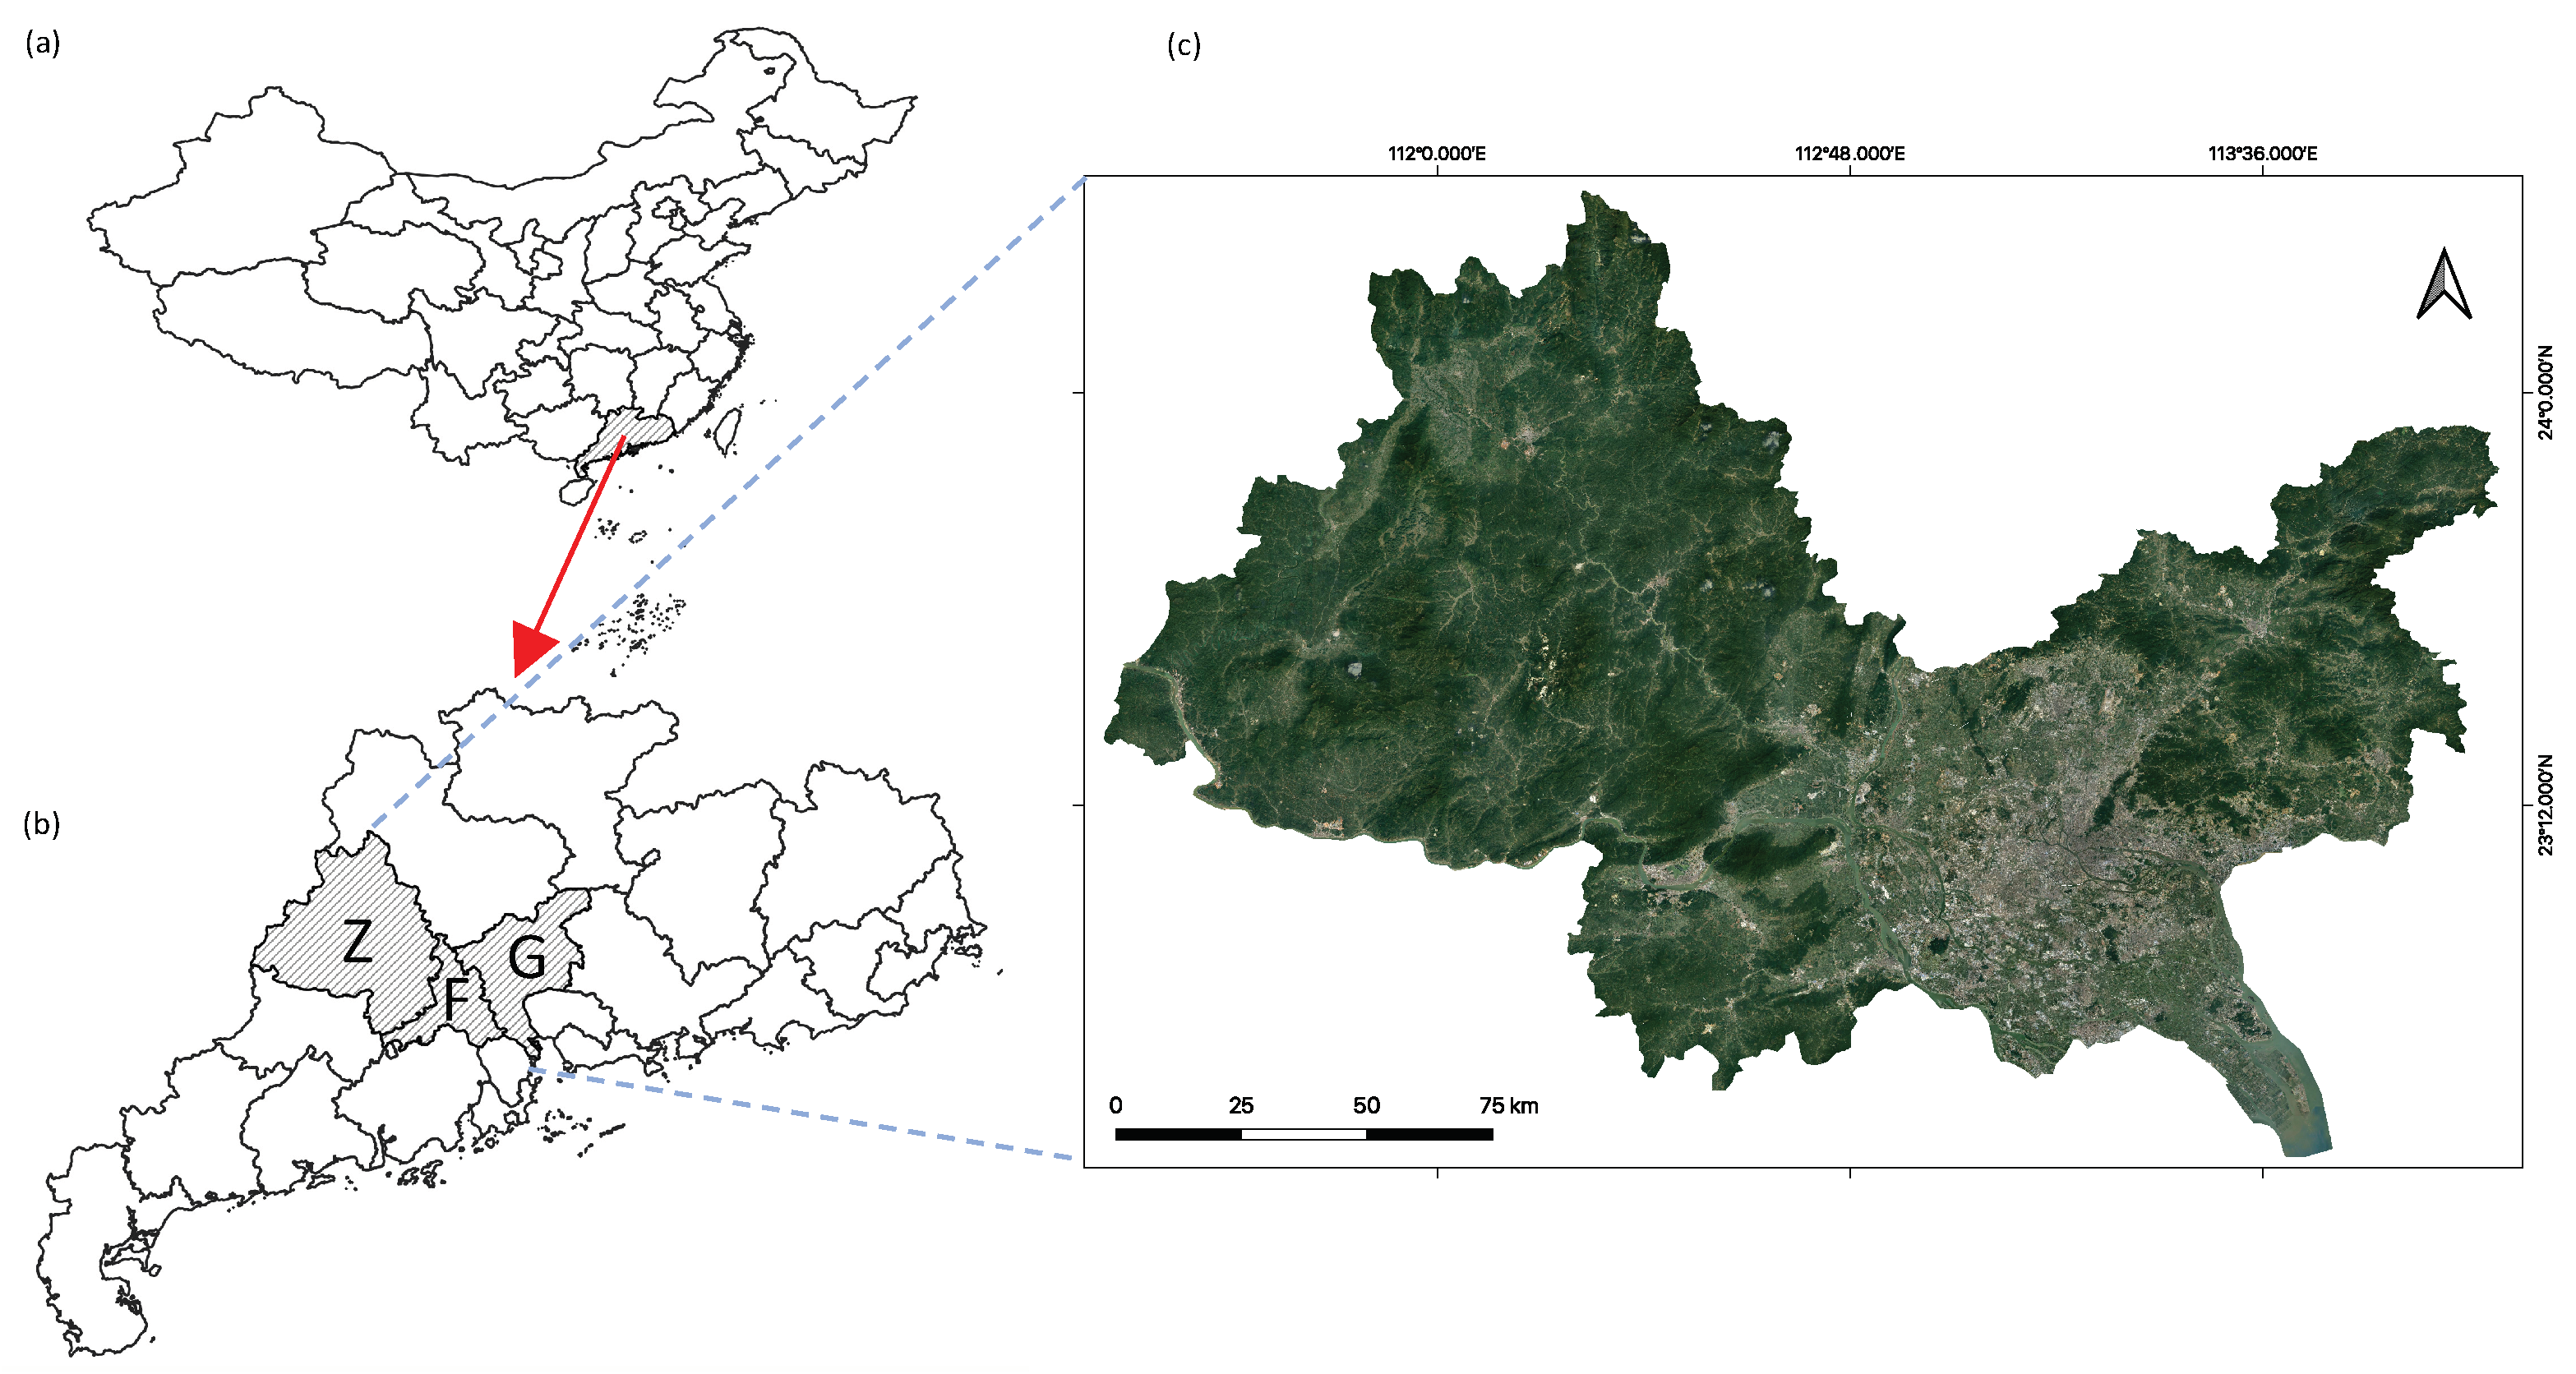
Our study area is the Guangzhou–Foshan–Zhaoqing region, located in the Pearl River Delta (PRD) region, Guangdong province, China, consisting of Guangzhou and Foshan, and Zhaoqing (See Figure 7). Images for large-scale detection are Google Earth’s smallest outsourcing rectangles, containing the Guangzhou city, Foshan city, and Zhaoqing city boundaries, with 1-meter resolution. The 200 images collected in this region are used for the evaluation of this large-scale application.
In this section, we discuss our experiment details and results. First, we introduce our experiment parameter settings, platform, and evaluation metric in Section 5.1. Then, we elaborate on the experimental results of MUREN in Section 5.2 and Section 5.3. Section 5.4 is for discussion of the comparative study.
5. Experimental Results
5.1. Parameter Settings and Evaluation Metric
We conducted our experiment with the PyTorch deep learning framework [75] and MMDetection framework [76], with four NVIDIA GeForce RTX 2080 Ti GPUs. The batch size is set as 4 and the learning rate is 0.005. We use mini-batch stochastic gradient descent (SGD) [77] as the optimizer for classifier training and set a momentum of 0.9 and a weight decay of 0.0005. For the anchor scale, we set 8, and the ratio we set is [0.1, 0.2, 0.5, 1, 2, 5, 10], considering the shape of the chimney and condensing tower. Additionally, we also use multiscale training with the long edge set to 2000 and the short edge randomly sampled from [400, 1400], as well as online hard example mining (OHEM) [78] to handle hard example learning. The loss function for the classifier is CrossEntropy Loss and the loss function for bbox is SmoothL1 Loss. Additionally, we adopt CLAHE and IAASharpen in Albumentations [79] to conduct online image augmentation, with a possibility of 0.5. Soft-NMS (Soft Nonmaximum Suppression) is also used [80] to eliminate overlapping proposals.
There are four parts in the evaluation metric: recall, precision, average precision (AP), and mAP. Recall indicates the model’s capability of detecting ground-truth CFPPs. Precision represents the model’s capability of detecting CFPPs correctly. AP (average precision) represents the average precision in the Precision–Recall (PR) curve, measuring model performance more comprehensively. mAP is the mean AP, averaging all APs for corresponding label types. They can be calculated from the following formulas:
means true positives, denoting the number of CFPP detected correctly; means false positives, denoting the number of others detected as CFPPs by mistake; and means false negatives, denoting the number of ground truths that are missing in detection results. means the point on the PR curve. N means the total number of label types. represents that when the IoU metric value between the detected CFPP and a ground-truth CFPP is greater than or equal to 0.5, a CFPP construction will be called as correctly detected.
5.2. MUREN Detection Results
We conduct our experiments on the datasets mentioned above, 1200 images for training and 400 images for testing, and three cities’ Google Earth images for prediction. Table 1 shows the detection results of our MUREN, concerning , precision, recall, AP, and mAP. We found that our MUREN achieved an mAP of 92.46%, with APs of 88.92%, 86.32%, 98.1%, and 96.49%, respectively, for working chimney, nonworking chimney, working condensing tower, and nonworking condensing tower. Among these, the values of the indexes of the “chimney” category are basically lower than those of the“condensing tower” category; the values of the indexes of the “nonworking” category are basically lower than those of the “working” one. The reasons for these two phenomenons are that first, chimneys have much smaller features than condensing towers, and there is more similarity confusion with chimneys than condensing towers, and second, the “working” status uses smoke, which presents more features than the “nonworking” status, meaning it is easier to detect. Appendix A displays some examples of detection results. We can figure out that our MUREN displays strong ability in CFPP detection, both in dispersed and densely clustered scenarios.
5.3. Large-Scale Applications
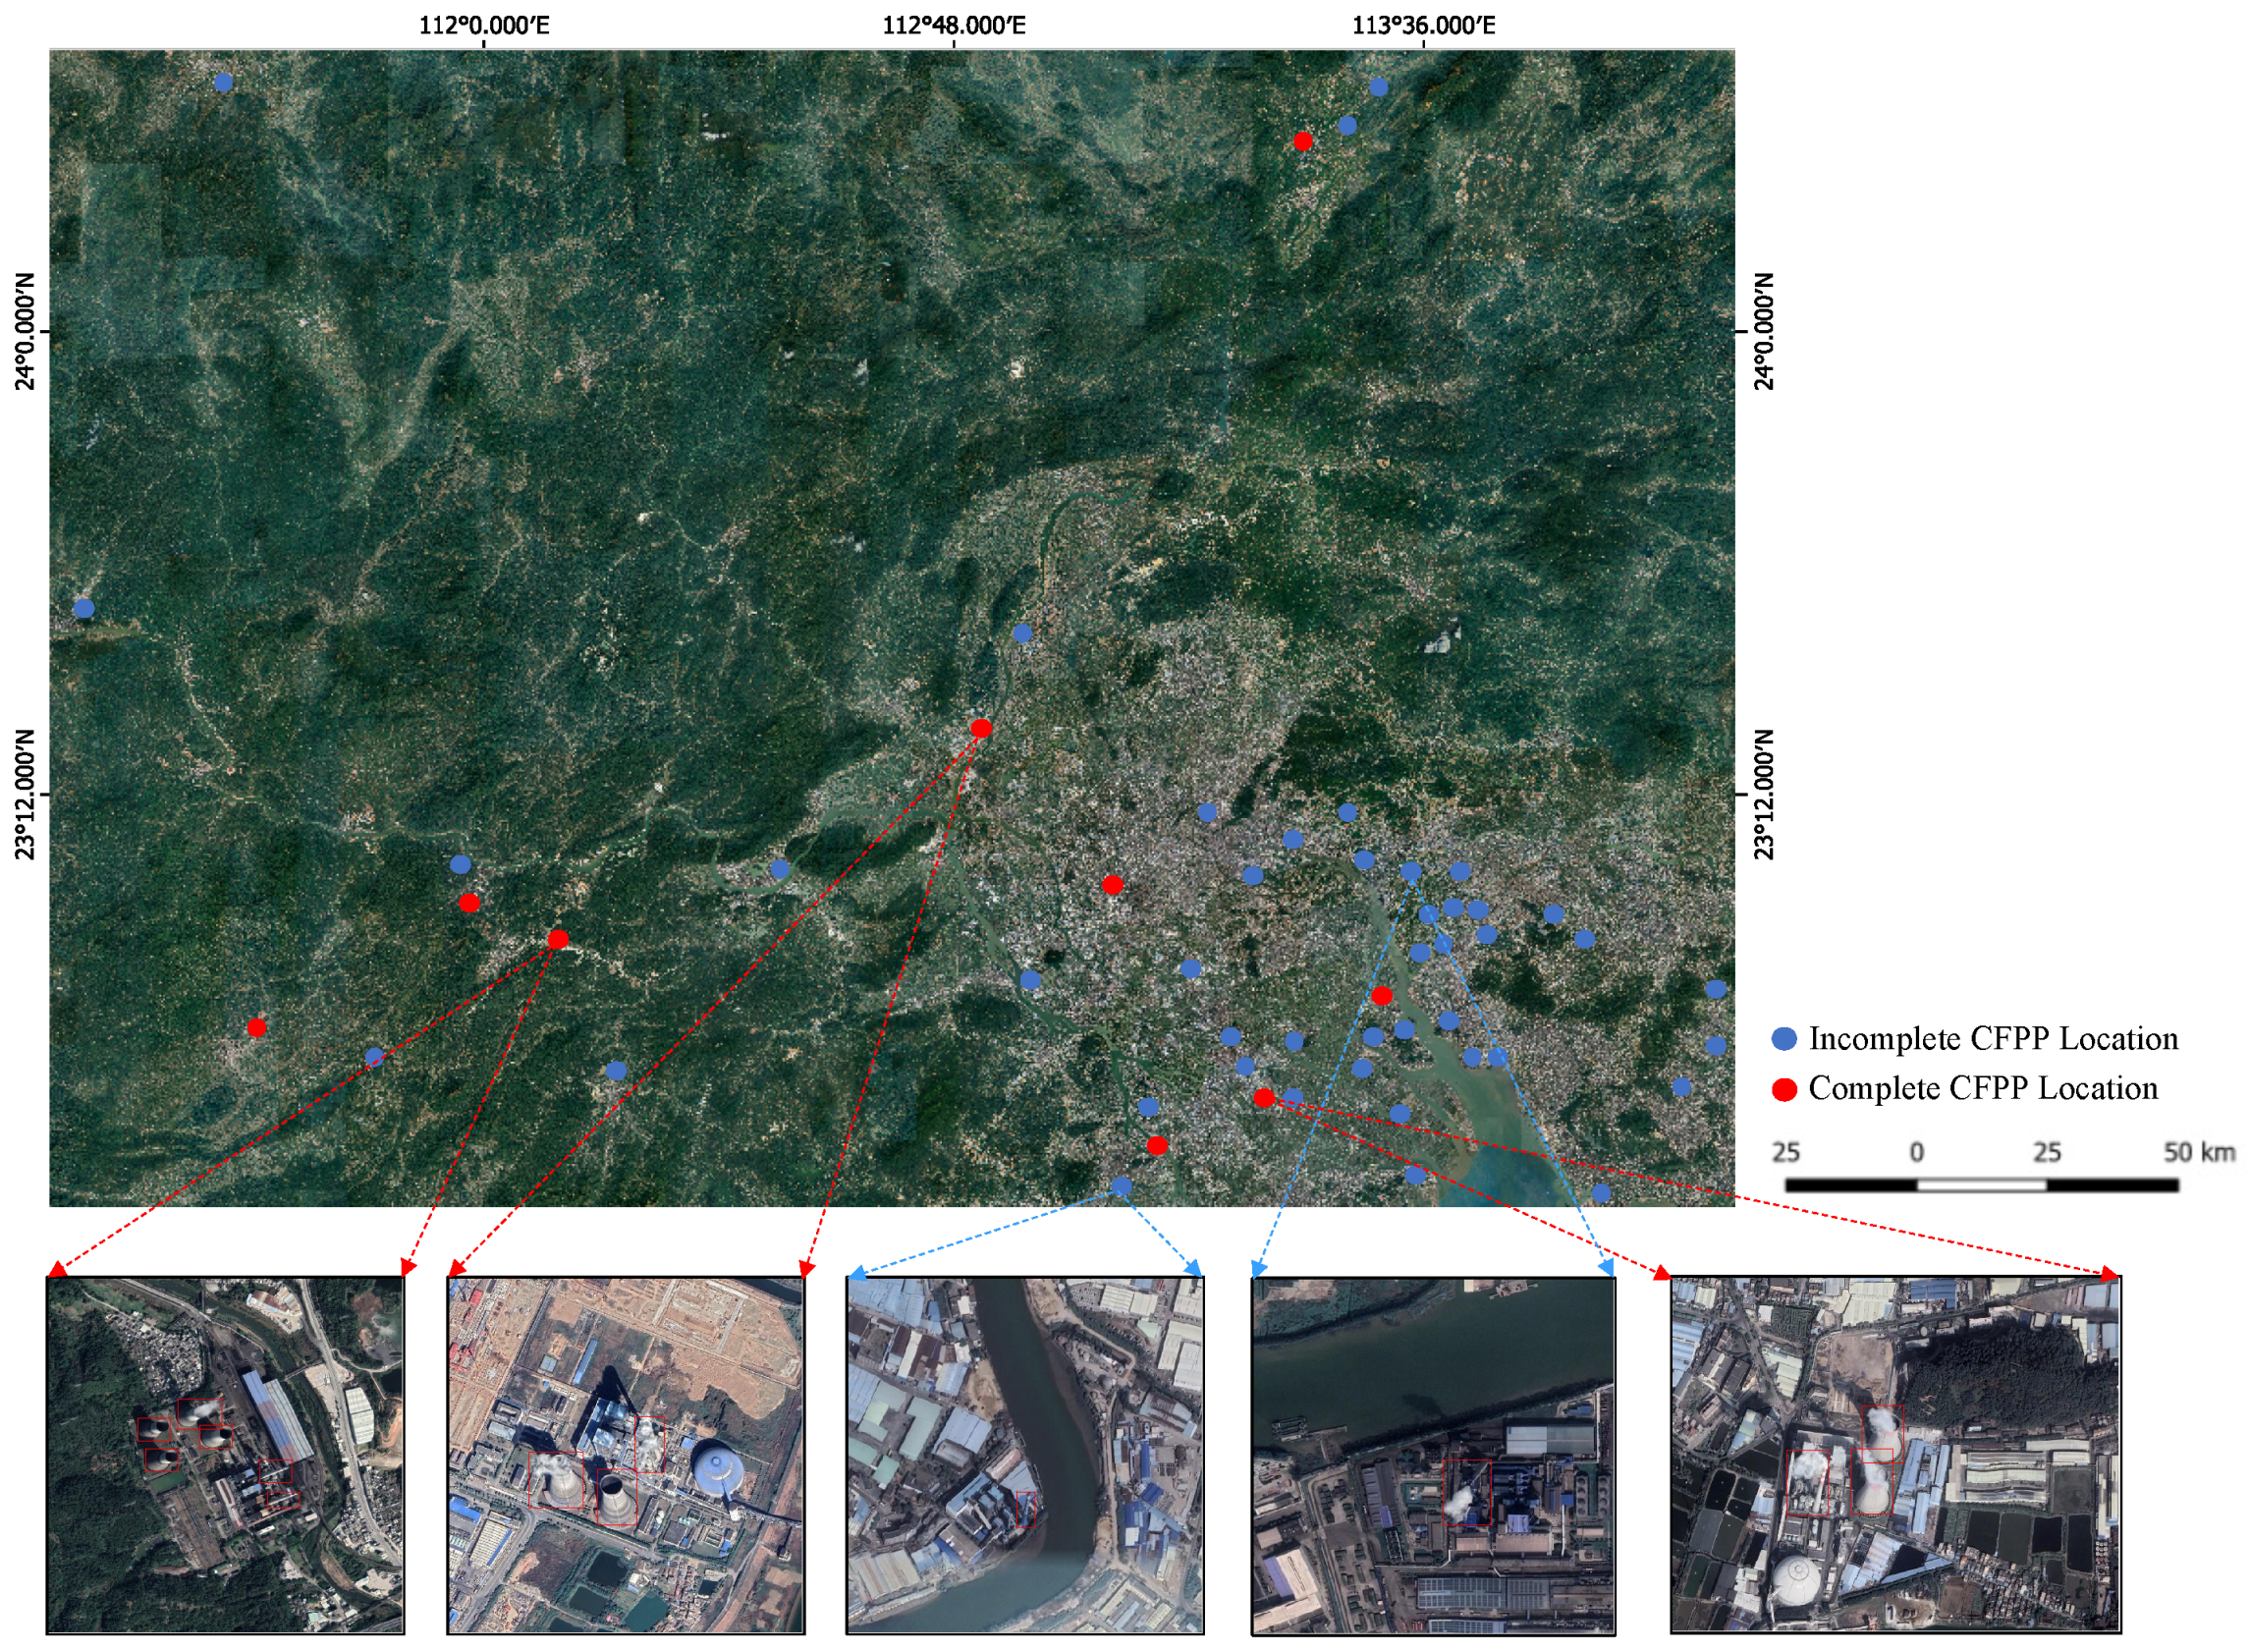
We applied MUREN on a large-scale application in three cities, Guangzhou, Foshan, and Zhaoqing, with 1-meter Google Earth satellite images, and evaluated the detection performance on the 200 labeled images collected in this region. We can find from Table 2 that MUREN had good performance in the large-scale application, achieving an mAP of 87.58%. However, all APs have some decrease compared with Table 1. We discuss this decrease in Section 6.3. Figure 8 shows the visualization of the large-scale application. As we can see, there are fifty-two CFPPs detected by MUREN in total. Additionally, considering that a complete CFPP location must consist of chimneys and condensing towers, we set a distance threshold of 100 m—which is 100 pixels in this image—between a chimney and a condensing tower to identify whether this is a CFPP location. If the distance between a chimney and a condensing tower is less than 100 pixels, we recognize it as a complete CFPP location, denoted by a red point; otherwise, it is an incomplete CFPP location, denoted by a blue point. It turns out that there are nine complete CFPPs and forty-three incomplete CFPPs in this region. Additionally, CFPPs tend to be located in more urbanized areas with more industries and rivers. The time required for this investigation is about five hours, which is very fast and efficient in large-scale applications. This efficiency guarantees our future work on time series large-scale CFPP detection.
5.4. Comparative Study between MUREN and Other Object Detection Methods
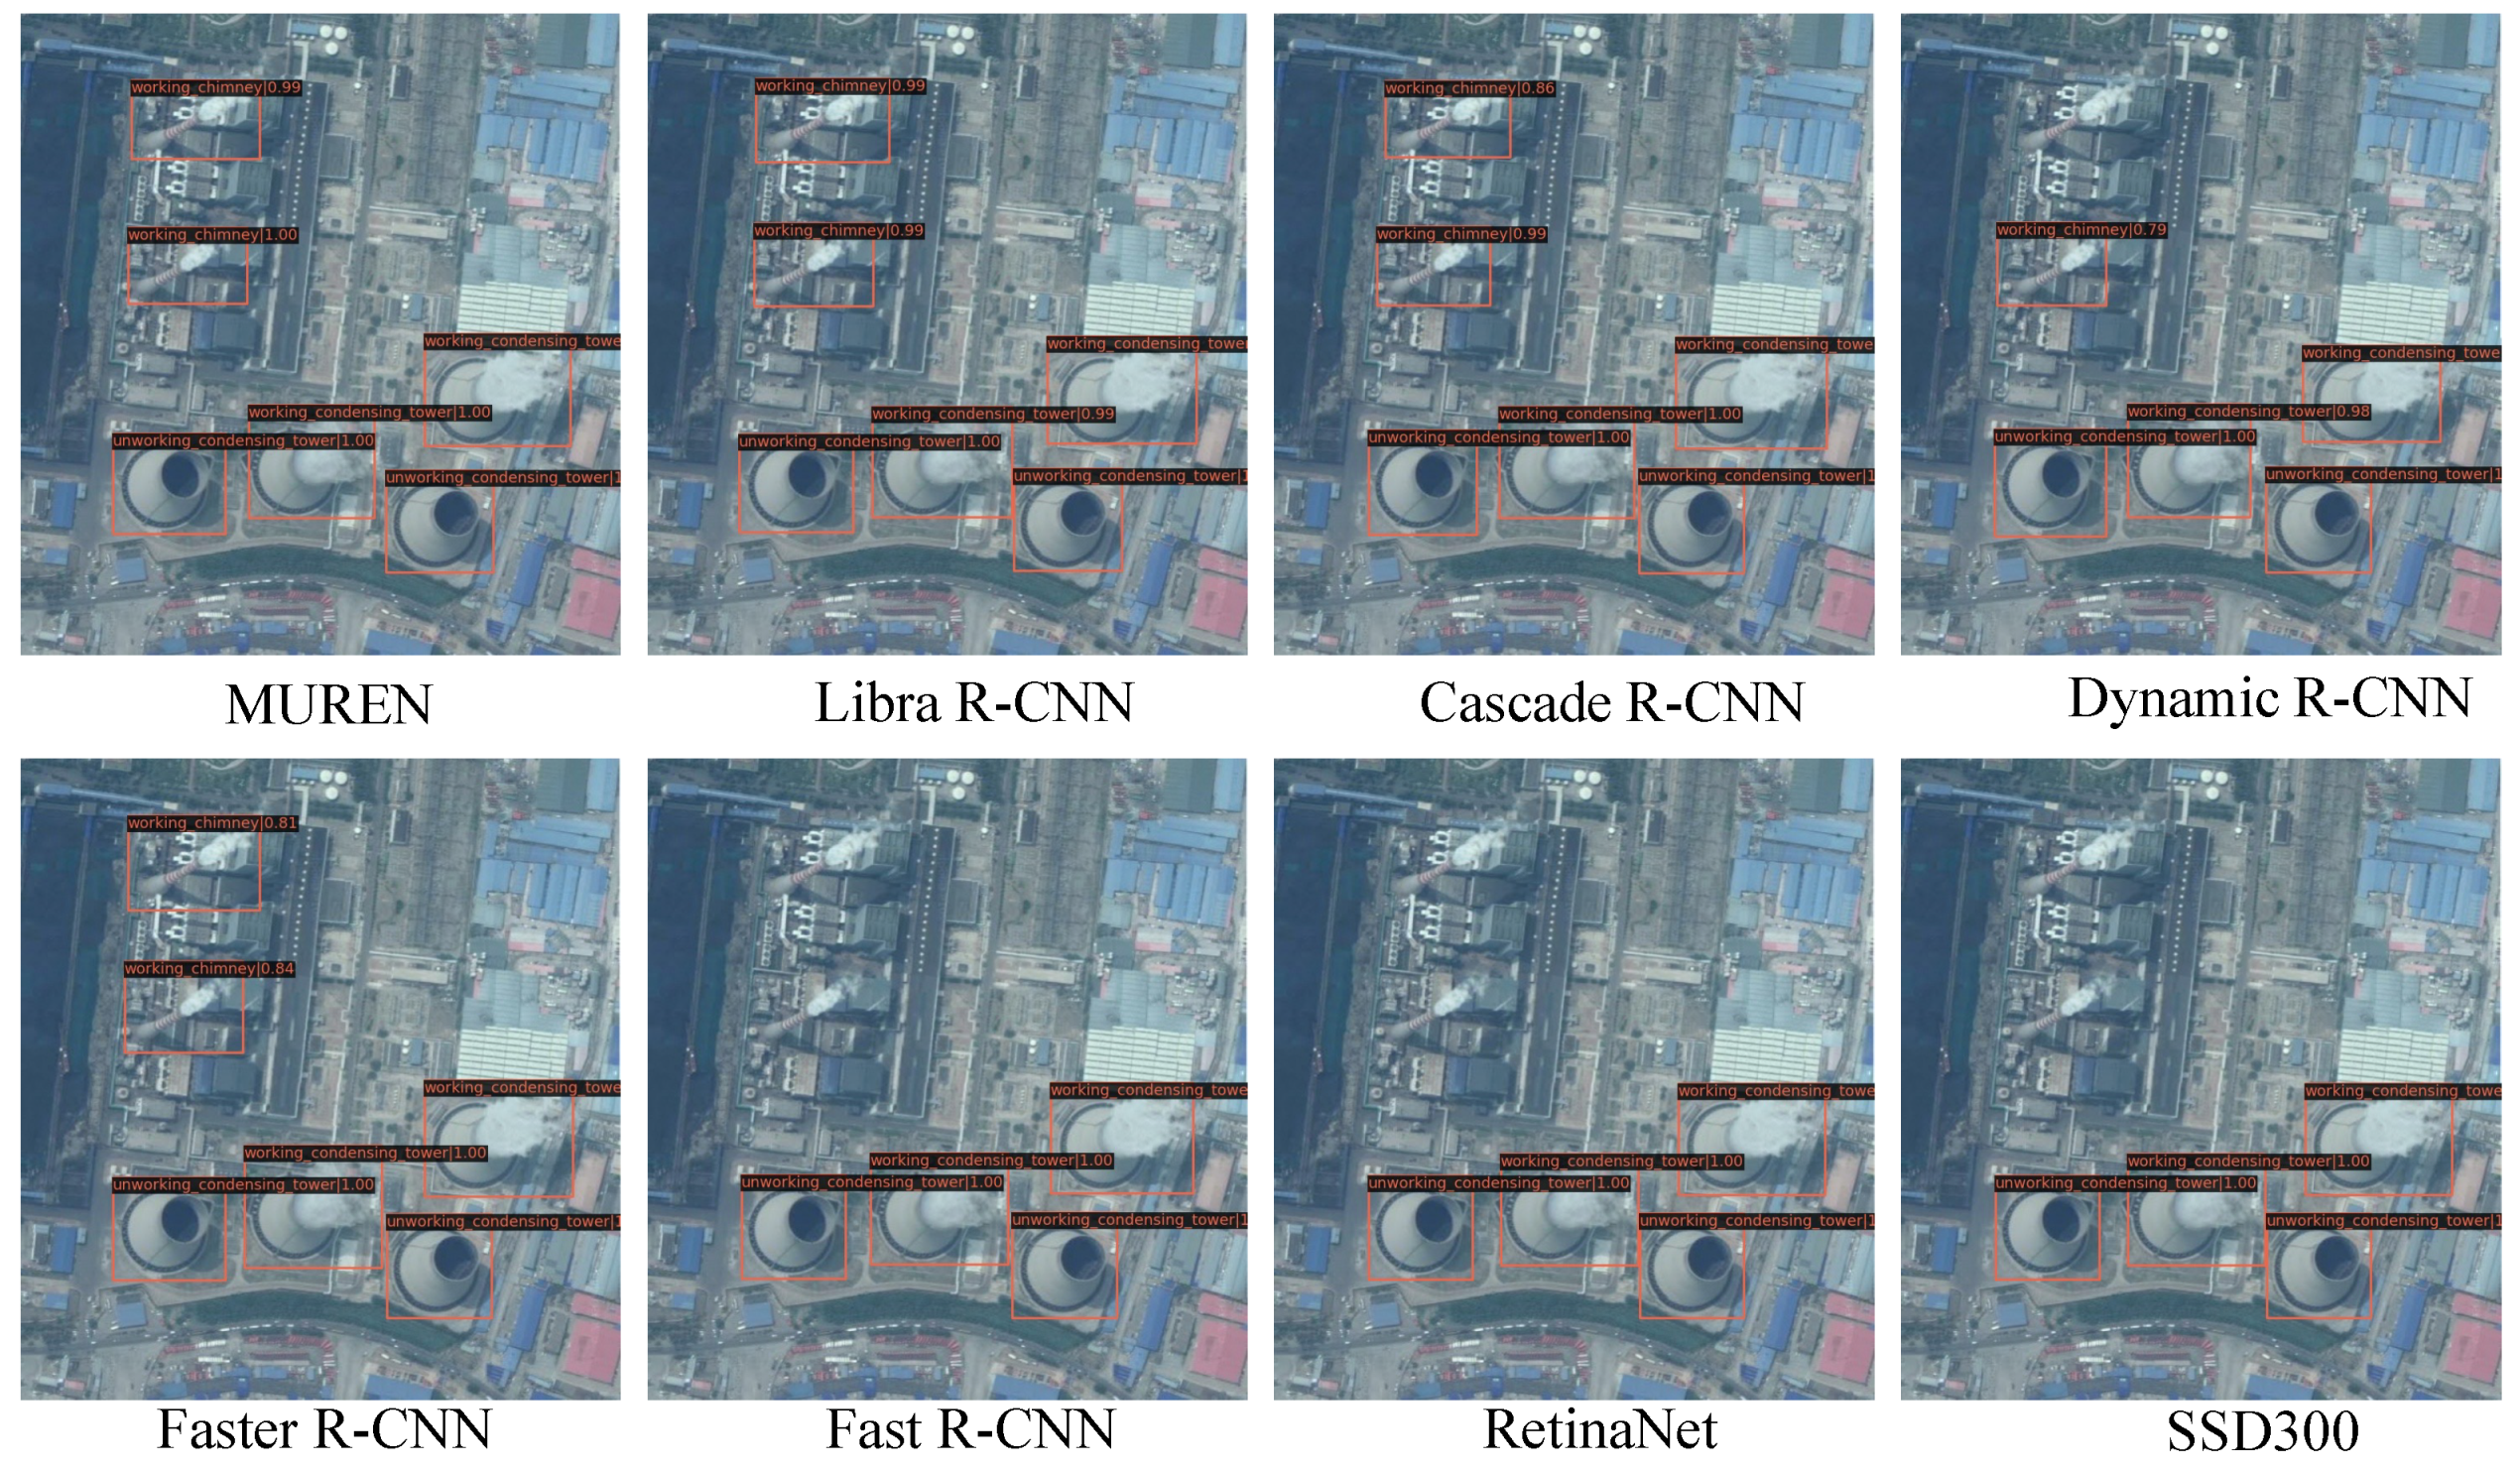
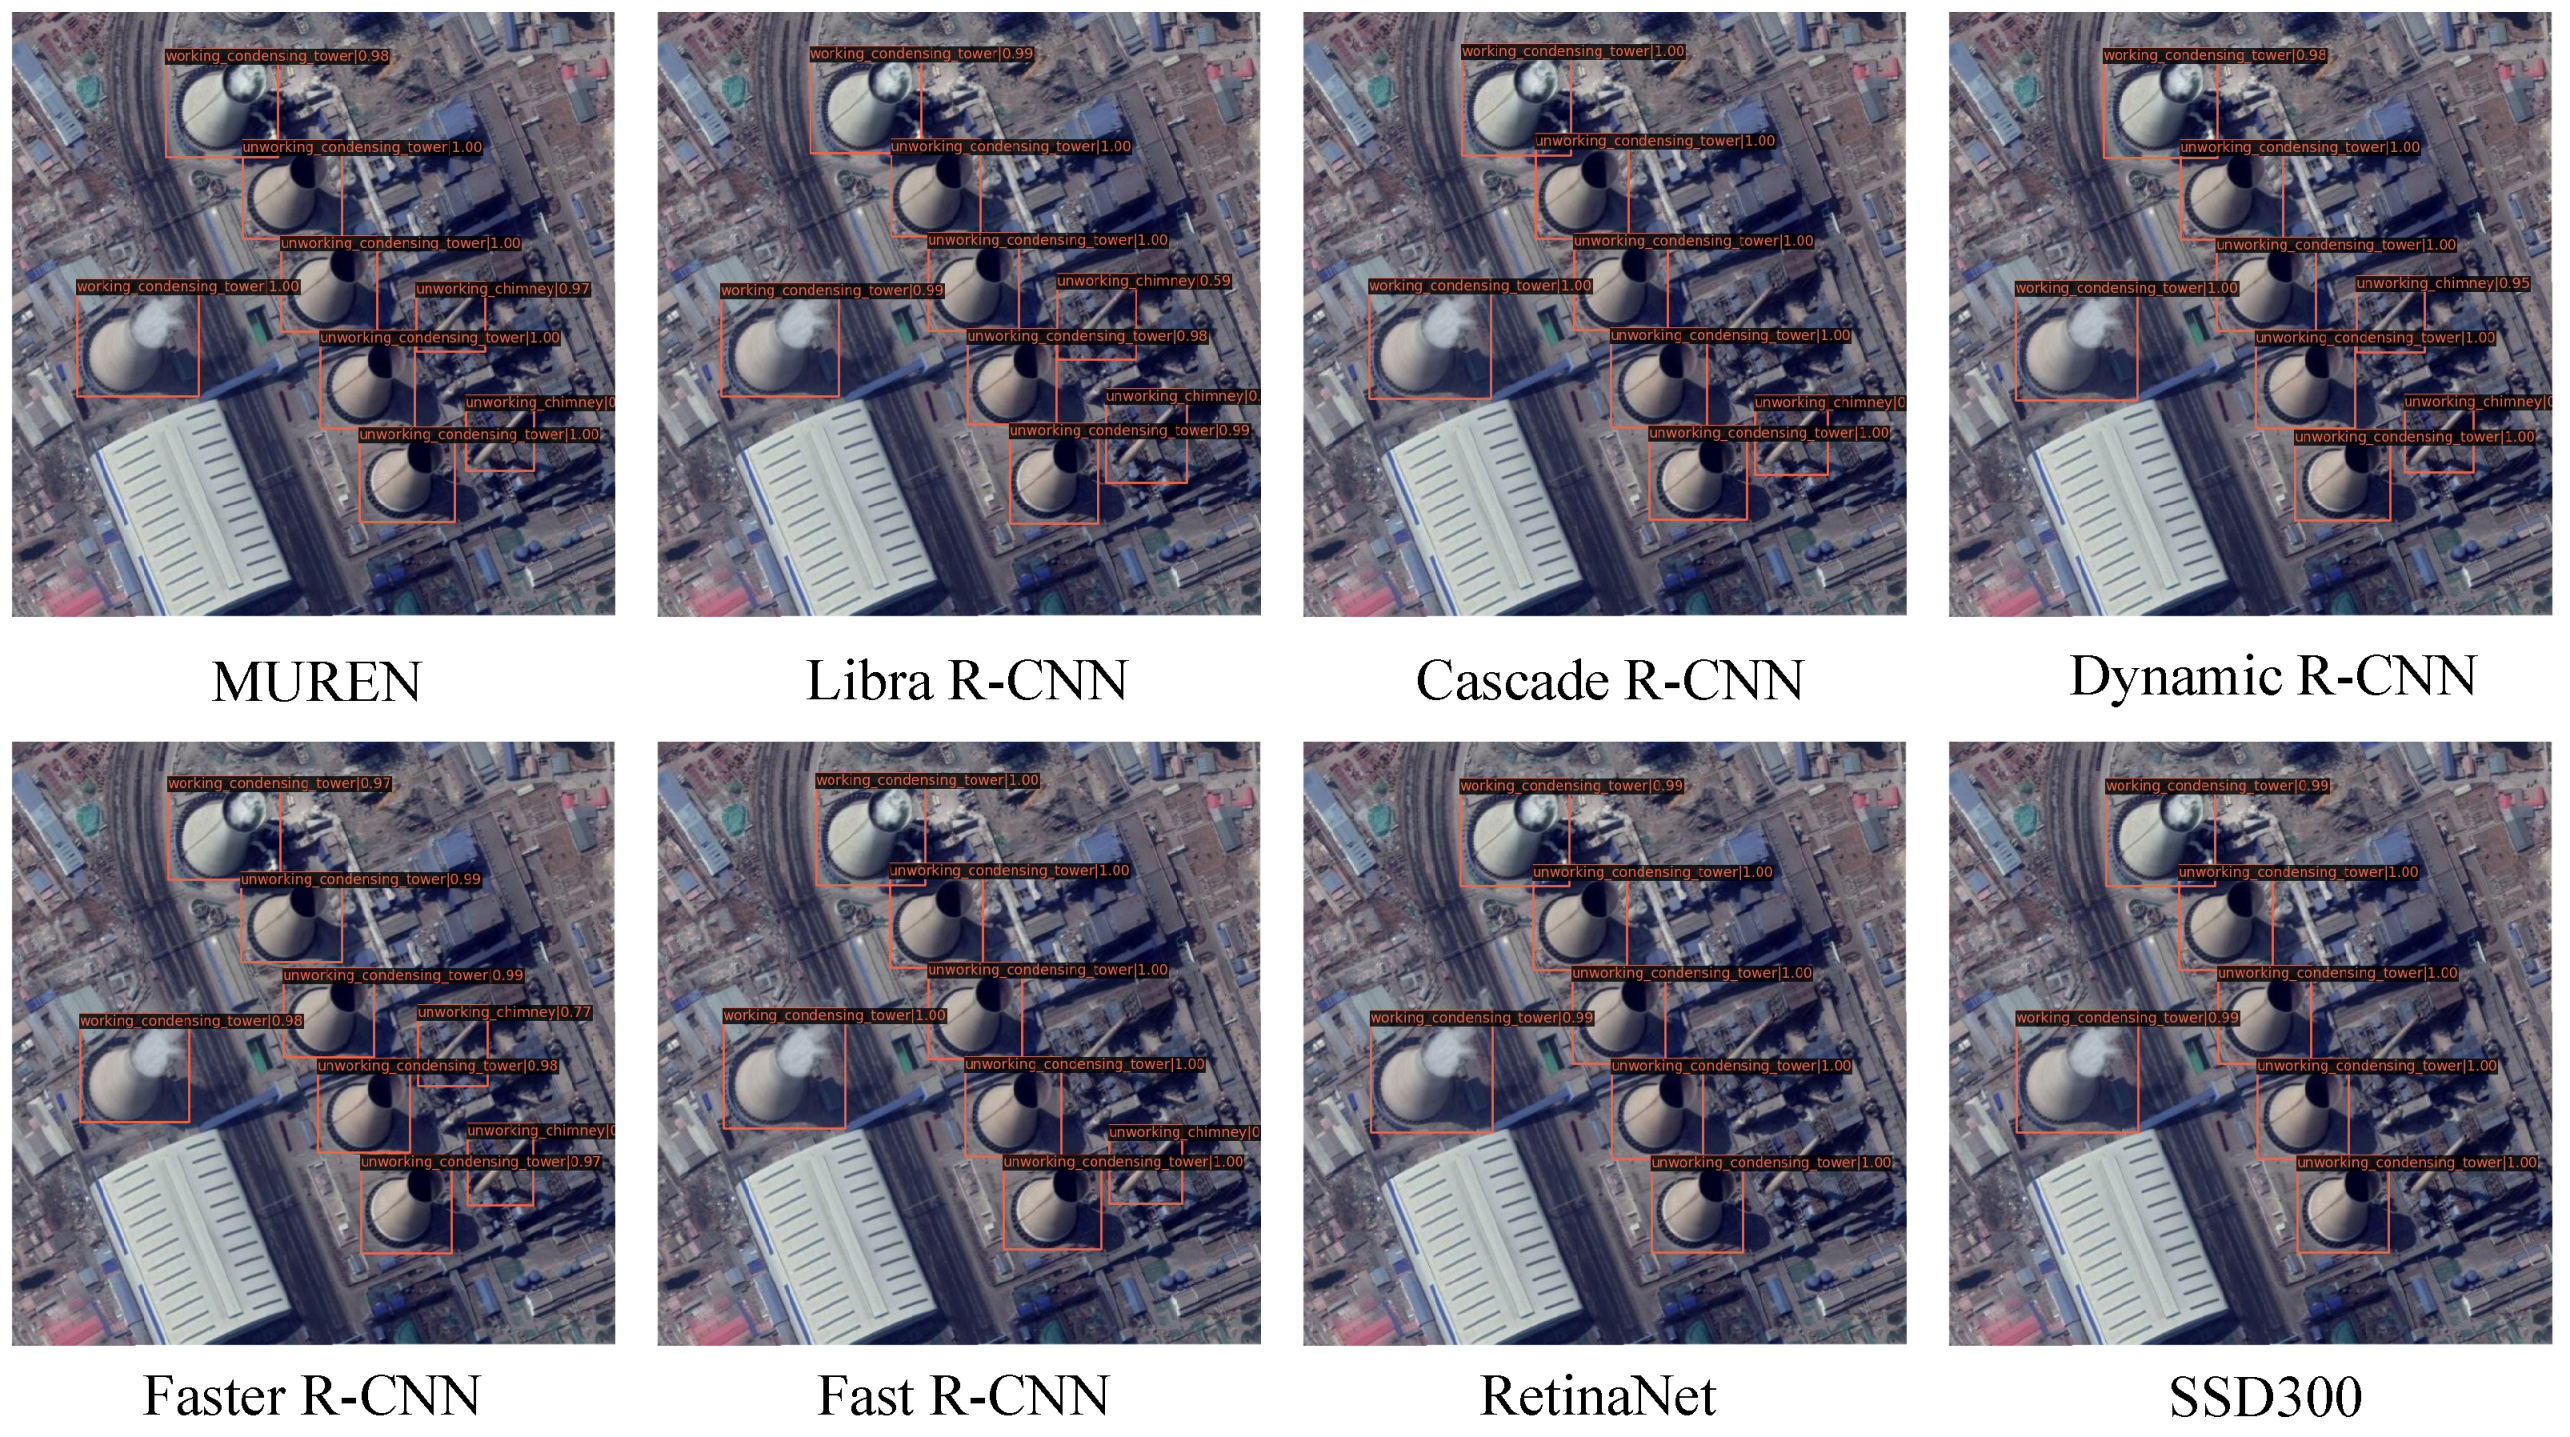
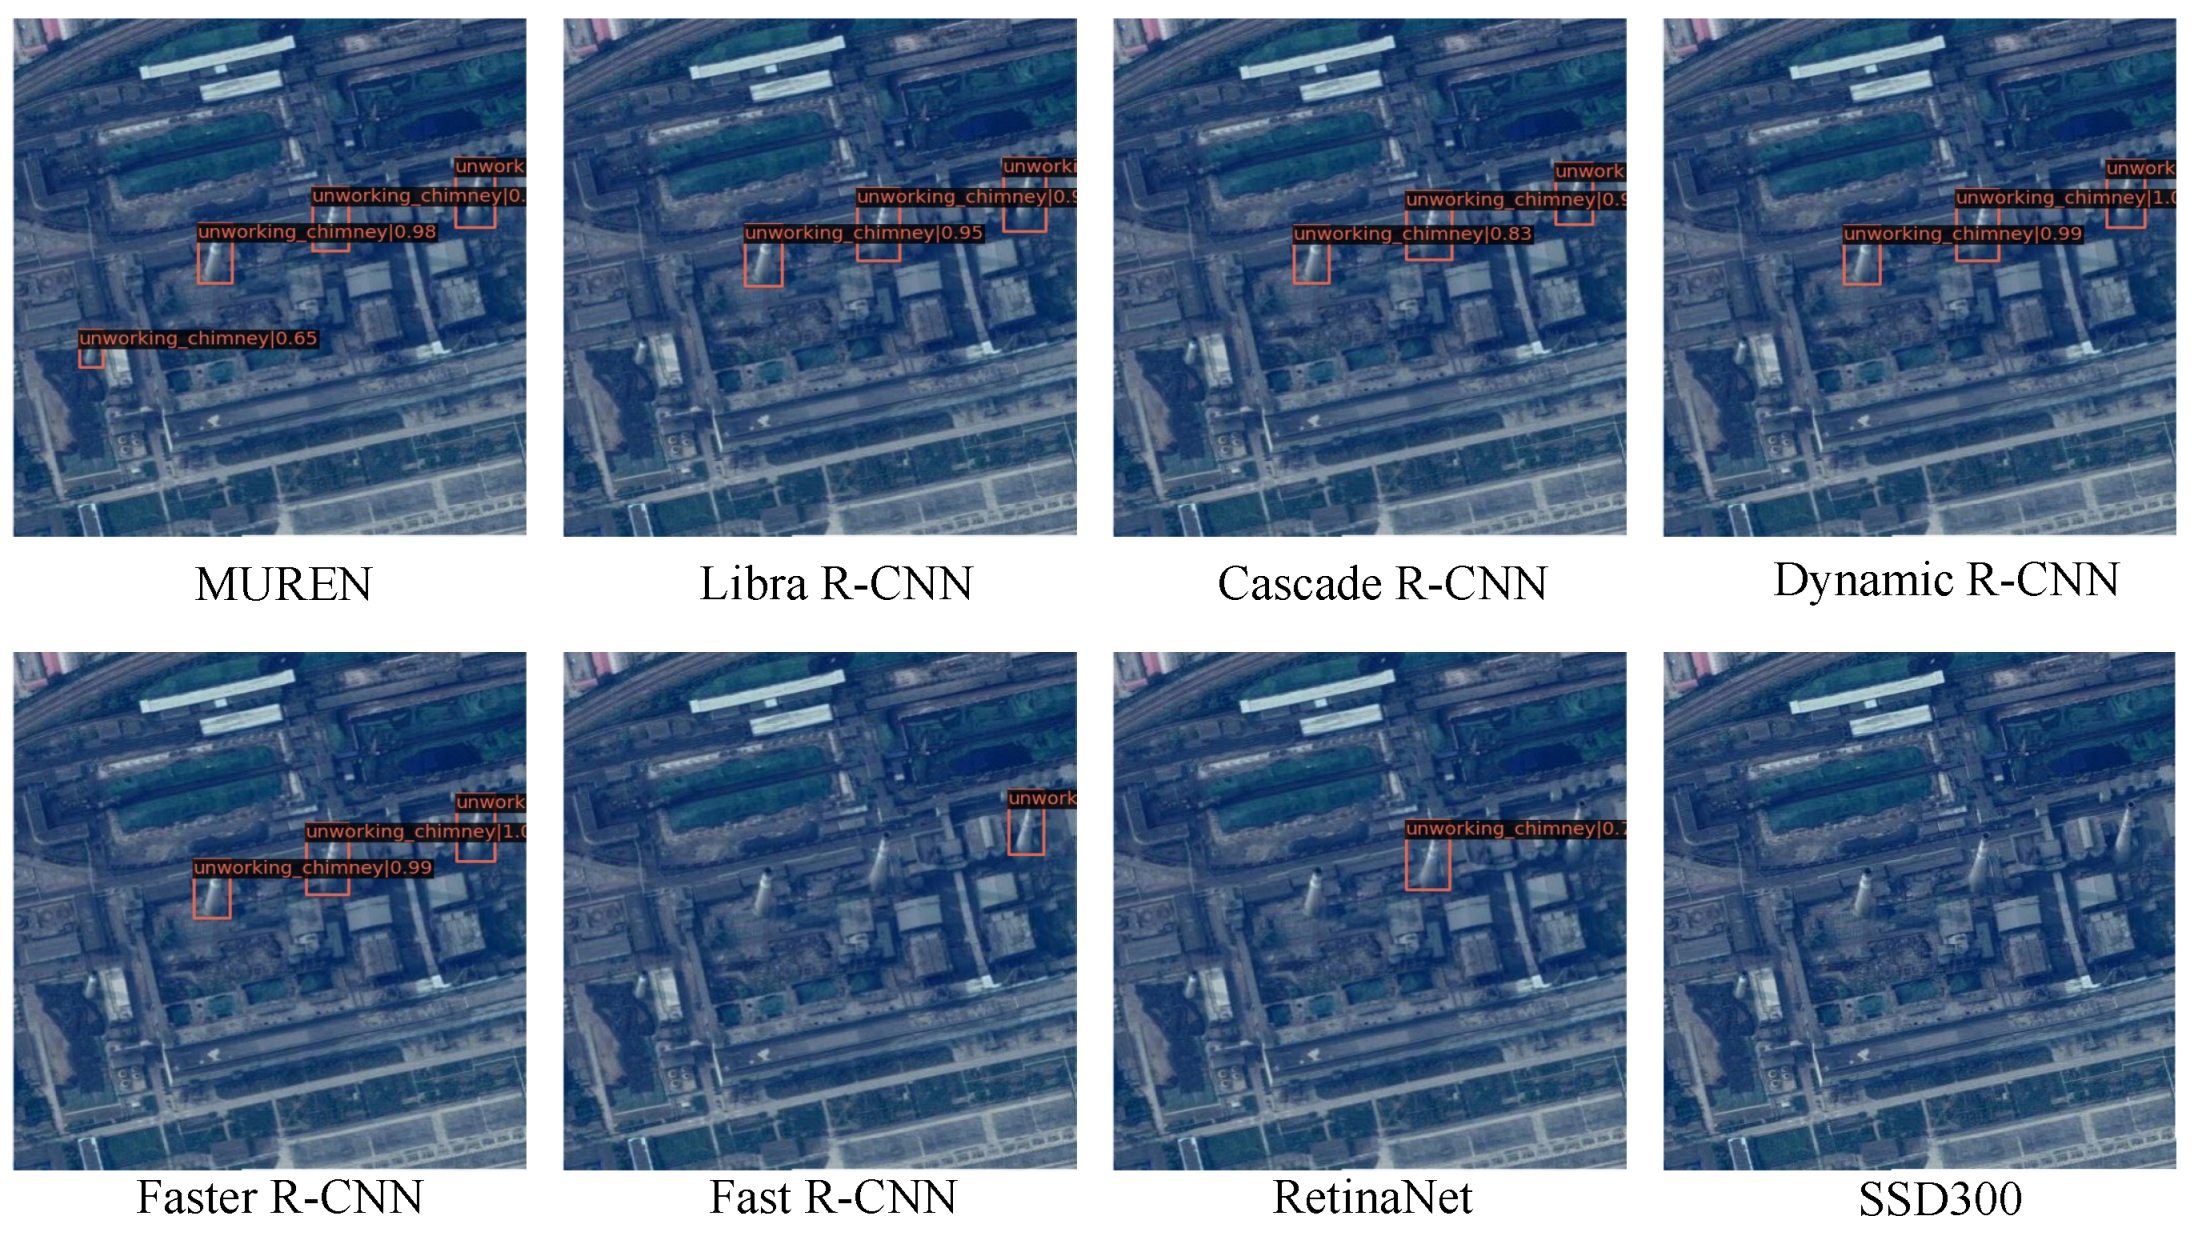
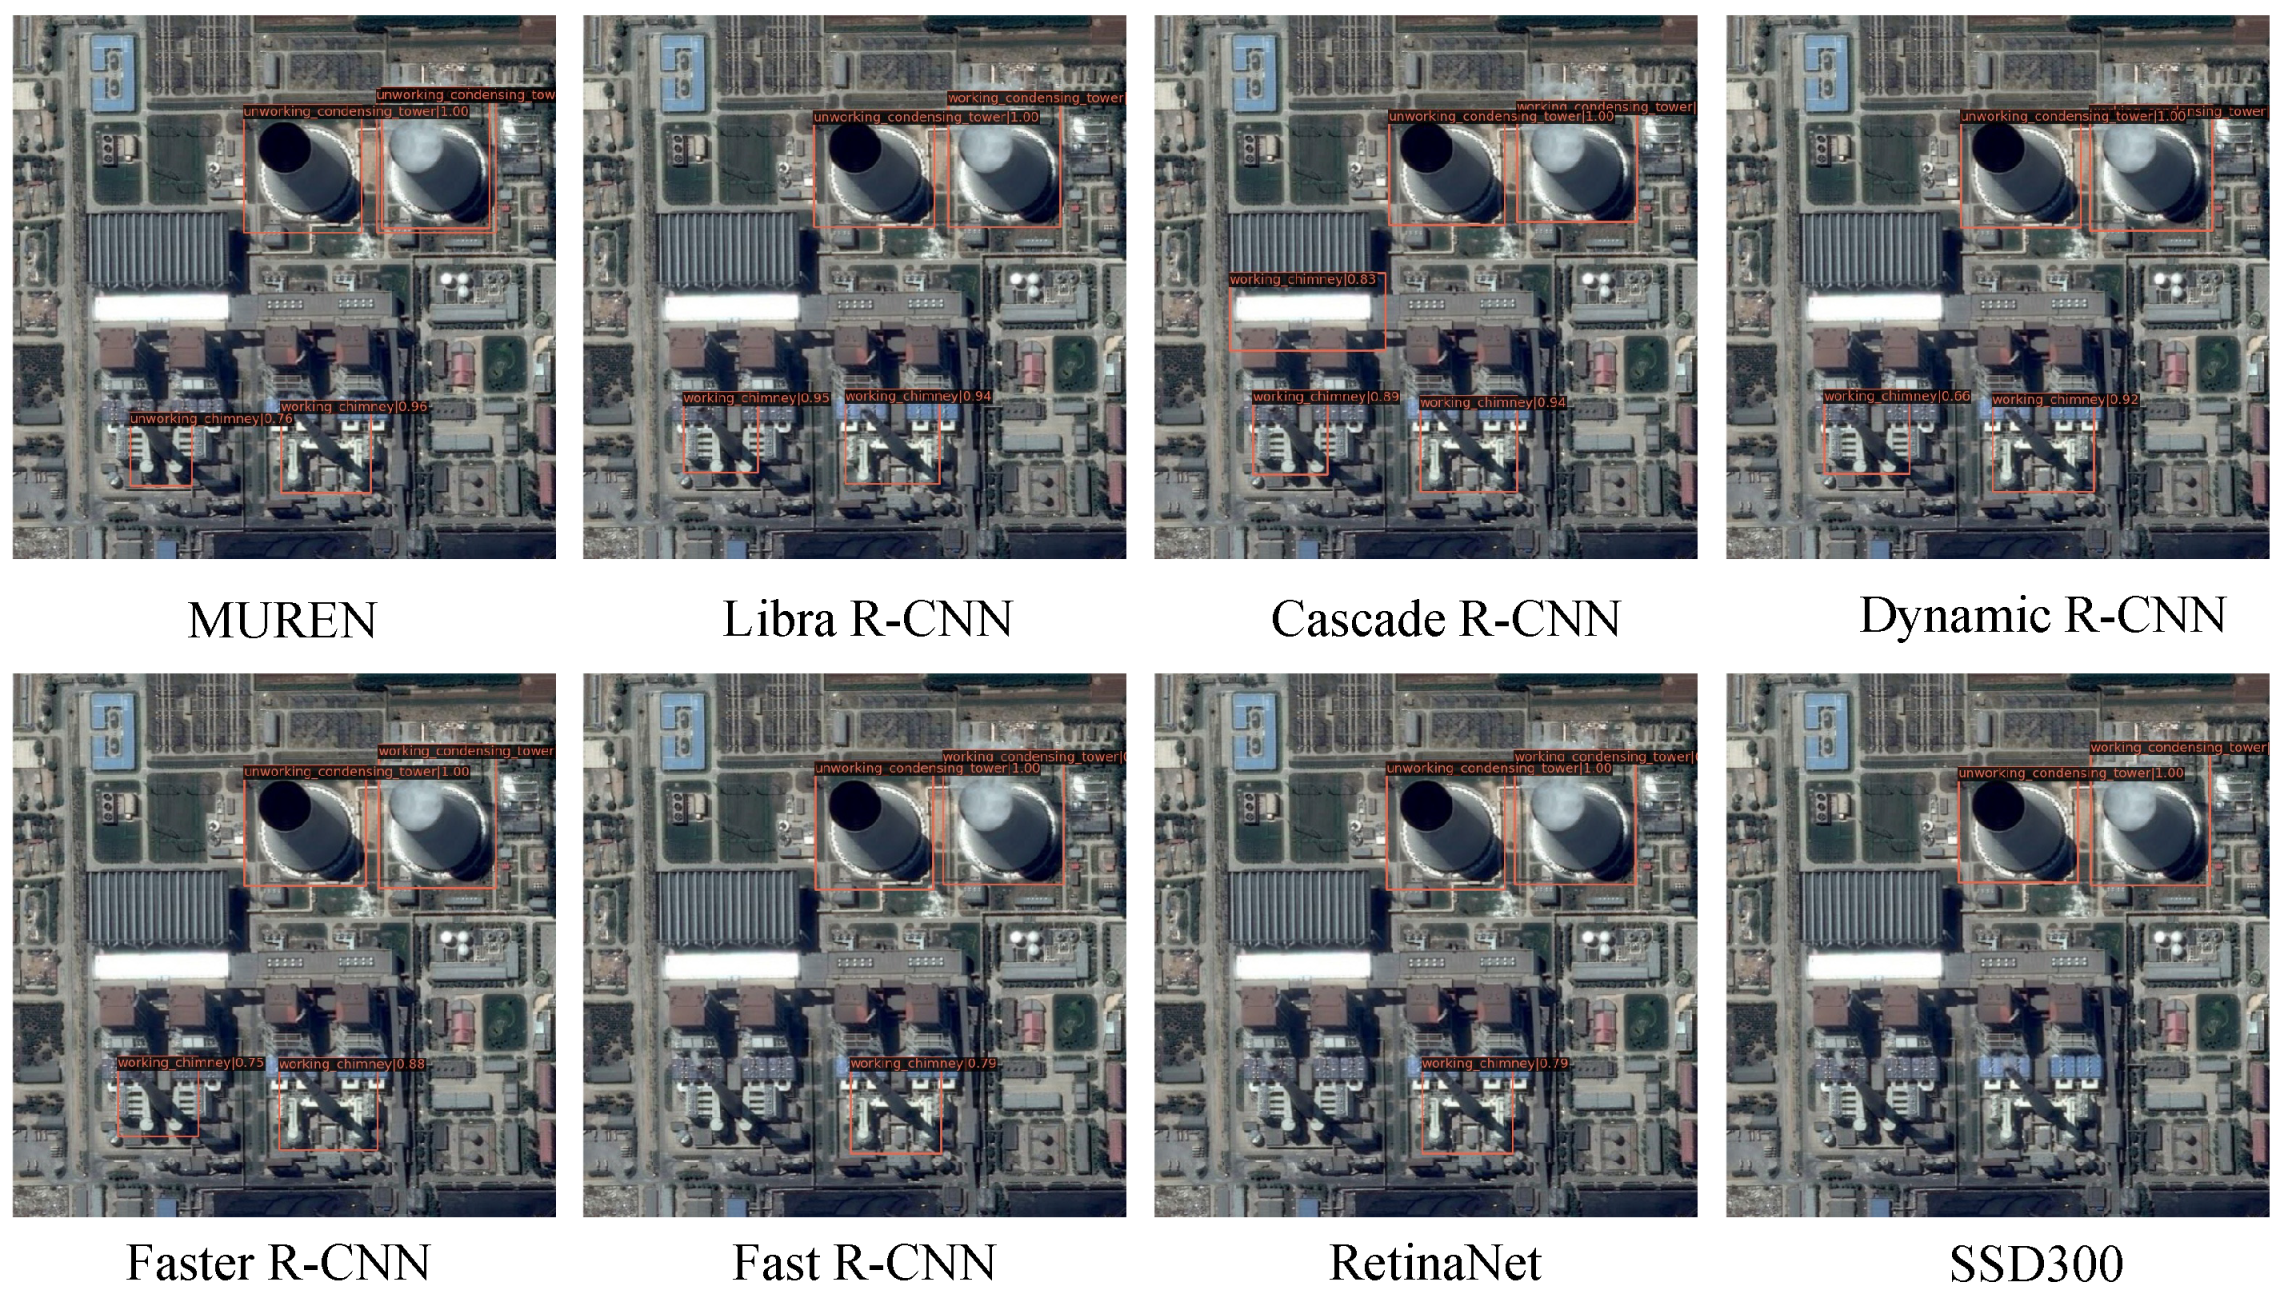
Precision comparison. We conducted comparative studies between our MUREN and other state-of-the-art object detection methods, including Fast R-CNN, Faster R-CNN [16], Cascade R-CNN [20], Dynamic R-CNN [18], Libra Faster R-CNN [19], SSD [13], and RetinaNet [14]. We list the comparative results in Table 3 with respect to AP and mAP. More detection results can be found in Appendix A. We find that our MUREN reaches an mAP of 92.5%, which improves the mAP by 5.98% compared with the baseline (Cascade R-CNN) and outperforms by 4.57–21.38% the other six deep-learning-based object detection methods in respect to mAP. Specifically, MUREN takes the lead for the working chimney, nonworking chimney, and working condensing tower, yet it is a little behind Libra Faster R-CNN in the nonworking condensing tower. Our MUREN improves the most on chimney detection performance, which presents with fewer pixels in RSIs and is more difficult to detect. This indicates MUREN has good capabilities in small and dense object detection in RSIs. SSD, RetinaNet, and Fast R-CNN perform similarly, with an mAP lower than 75%. Dynamic R-CNN and Faster R-CNN achieve improvements compared with the last three algorithms, with an mAP of around 80%. Cascade R-CNN and Libra Faster R-CNN displayed great performance, achieving an mAP of about 87%. Figure 9 and Figure 10 show the detection results of this comparative study between seven deep-learning-based object detection methods and our MUREN, showing the better performance of MUREN compated with other state-of-the-art methods. We can observe that MUREN stands out mainly in chimney detection and nonworking condensing tower detection. More detection results are listed in Appendix A.
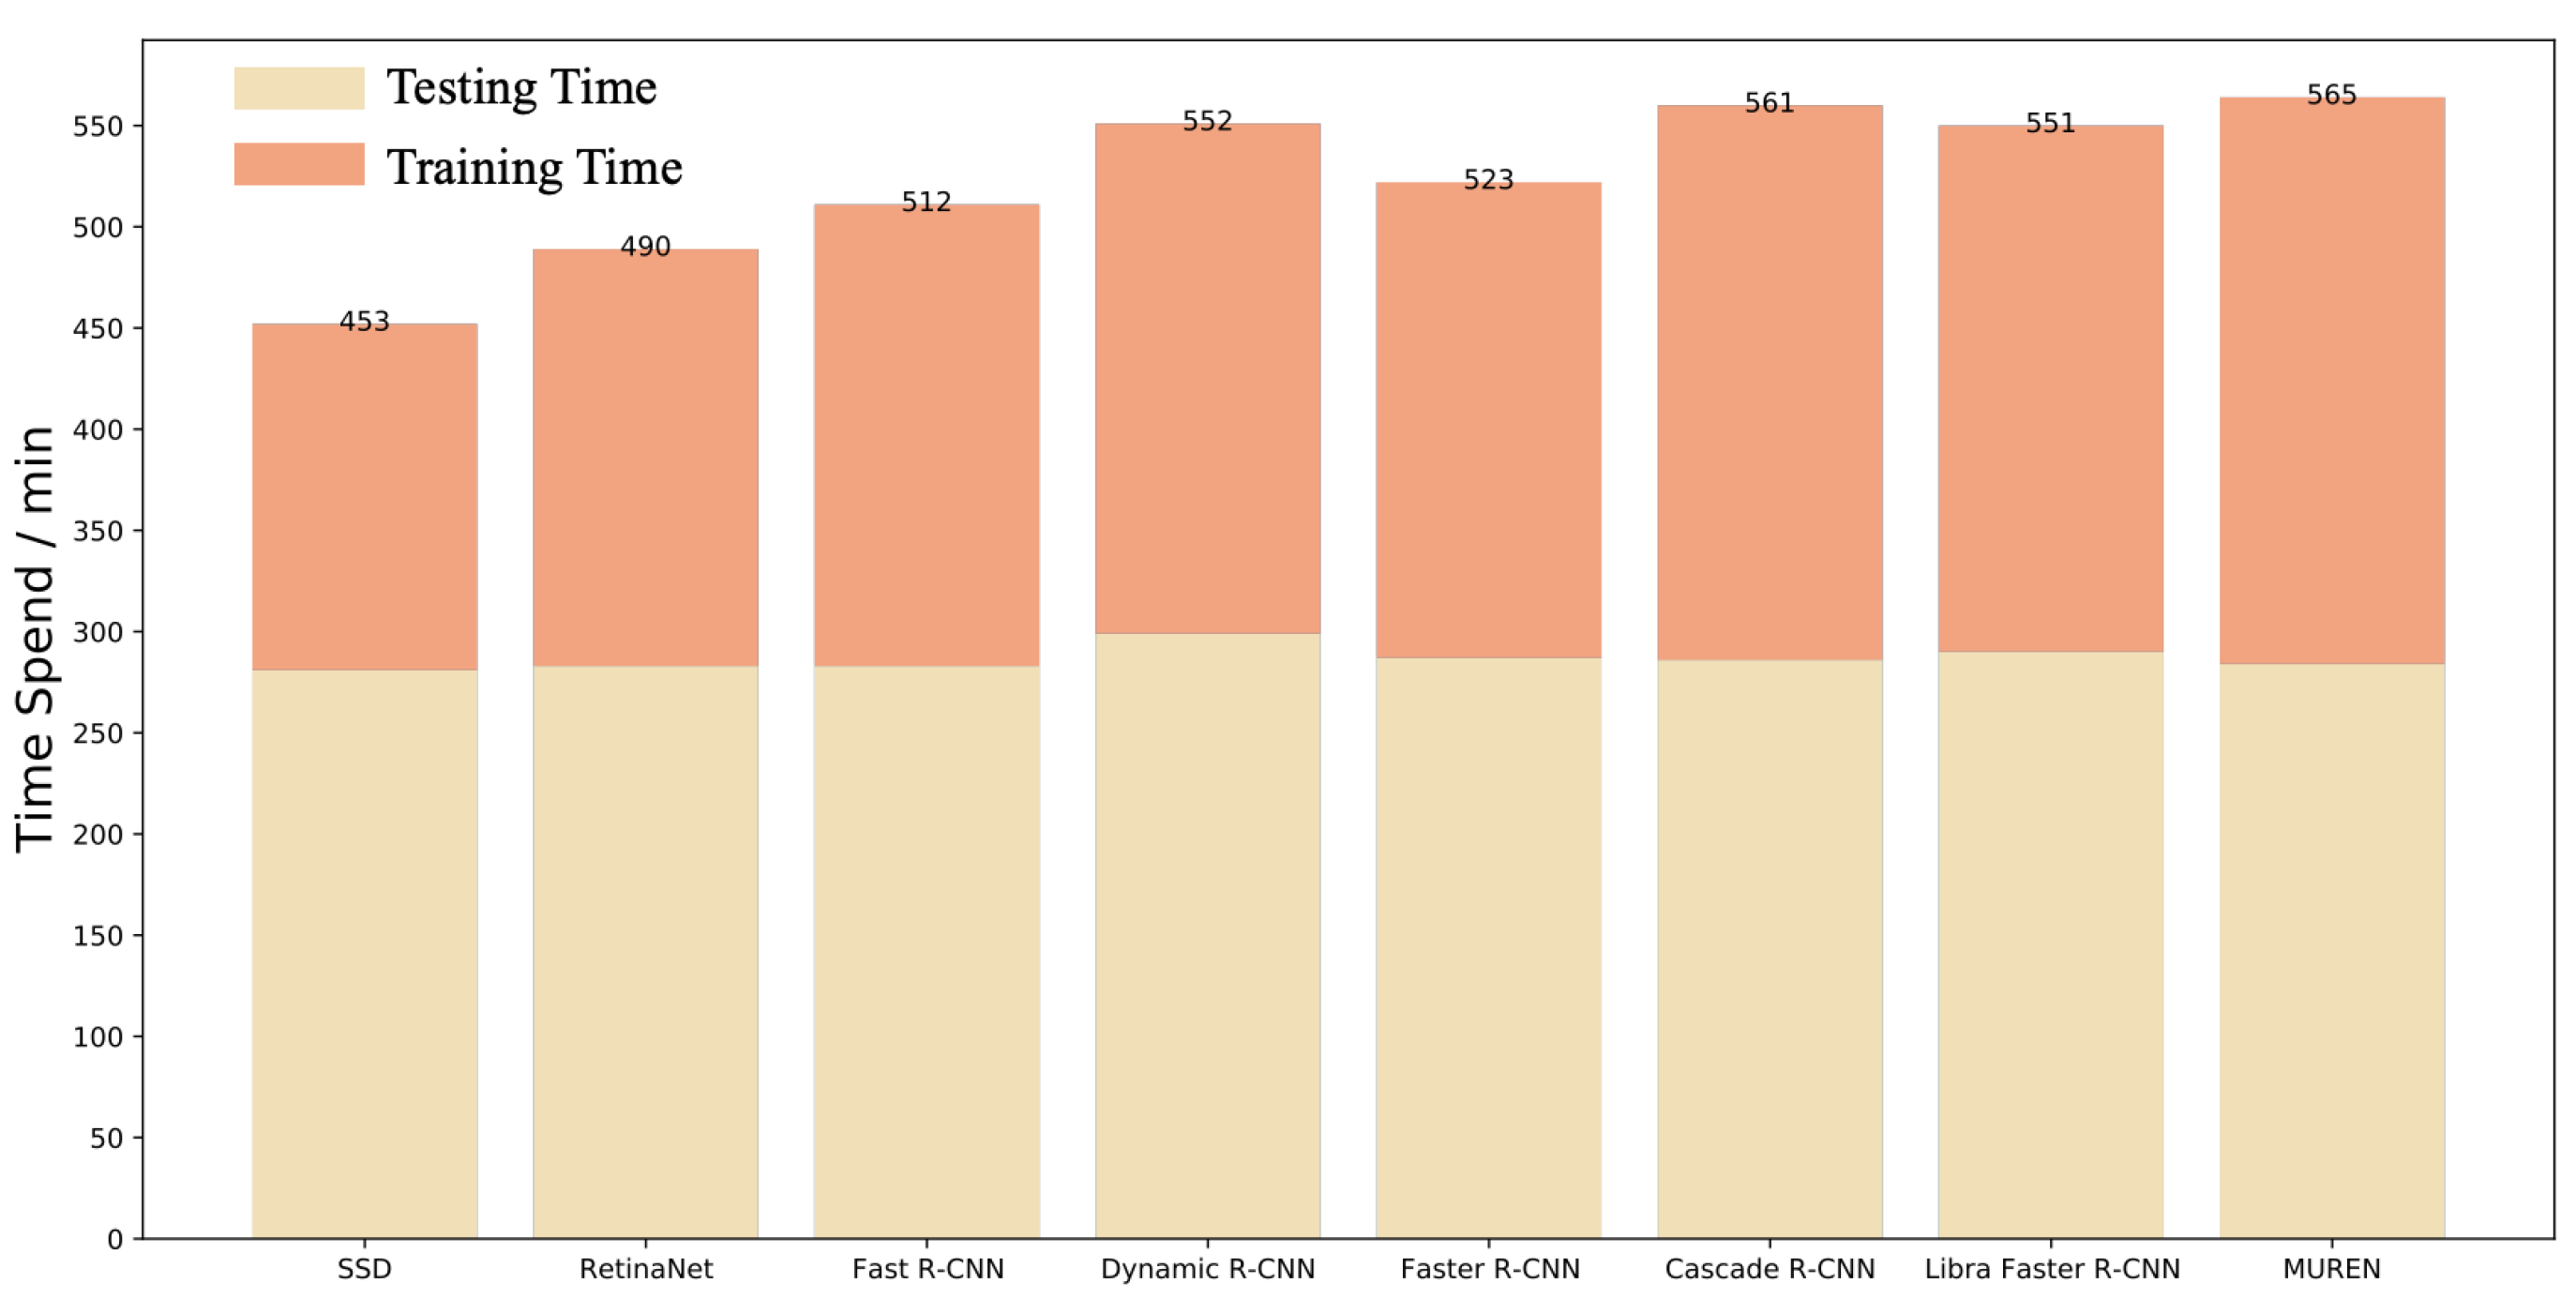
Complexity comparison. We also compare the computational complexity regarding the parameter amount, space occupancy, and training/testing time. These variables can reflect the computational complexity of trained models. As can be seen in Table 4, SSD has a comparatively small parameter amount and space occupancy. The two-stage methods, i.e., Fast R-CNN, Faster R-CNN, Dynamic R-CNN, Cascade R-CNN, and Libra Faster R-CNN, have more parameter amounts and space occupancy. Among these, Dynamic R-CNN has the most amount of parameters and space occupancy. Compared with these methods, our MUREN has a comparatively average parameter amount and space occupancy, with a slight increase compared with the baseline (Cascade R-CNN). The training and testing time are compared in Figure A2. MUREN has one of the longest training times, but the testing time is comparatively short.
6. Discussion
In this part, we reap ablation studies for MUREN, discussing the effectiveness of each strategy in our proposed MUREN, and discuss the limitations of MUREN by offering missed and false detections. Typically, we first assessed the effect of the symmetrically enhanced network in Section 6.1. Then, we evaluated the contributions of recursive connections in Section 6.2, with the improved ASPP module. These ablation studies explain the effectiveness of every single strategy in our proposed MUREN and offer a deeper sight into it. After that, we discuss the limitations of MUREN and offer some examples of error detection, misdetection, and corresponding illustrations.
6.1. Ablation Study of the Symmetrically Enhanced Network
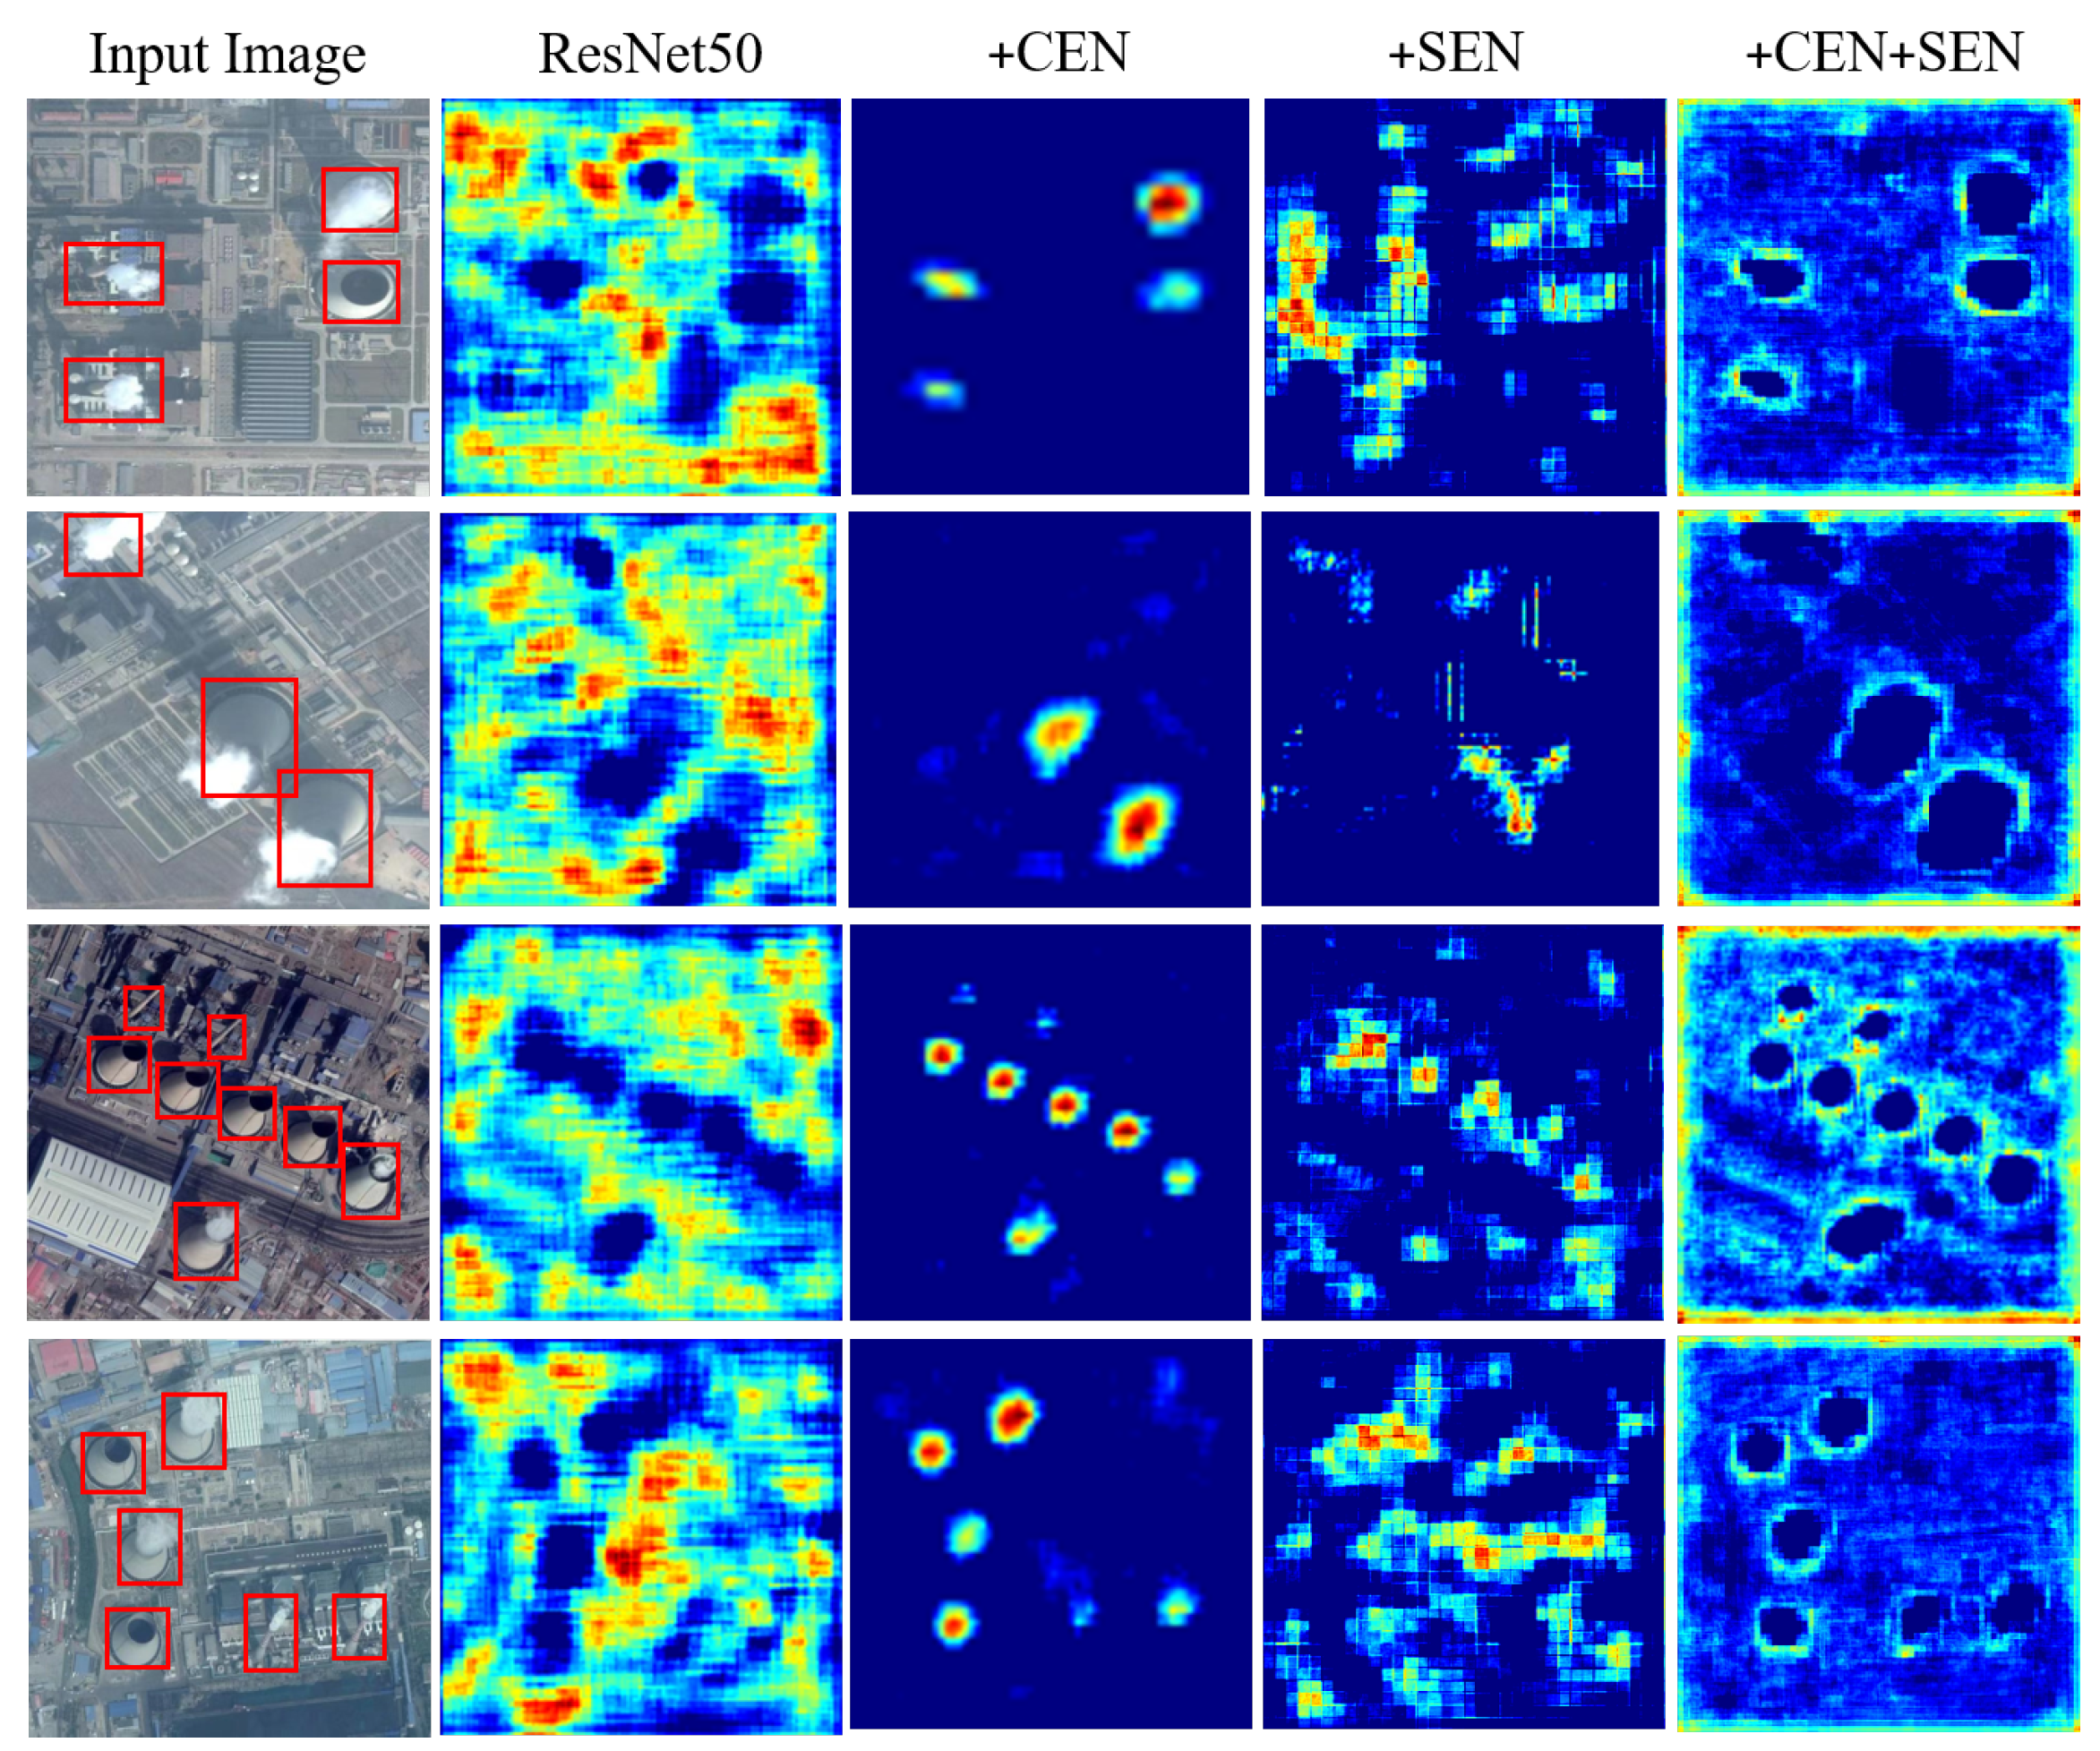
In this section, we evaluate the effectiveness of the symmetrically enhanced network from two aspects: detection results and feature map visualization. As can be seen from Figure 11, we visualize the feature map extracted from the backbone and ResNet50, with and without CEN and SEN. It is clear that ResNet50 with CEN can filter most noise disturbance, but in the meantime, CEN can filter target features falsely to some extent.
Detection results.Table 5 displays the detection results’ evaluation. ResNet50 with CEN outperformed ResNet50 without CEN by 1.35% in mAP. Especially, ResNet50 with CEN achieved great improvements in chimney detection. The APs of working chimney detection and nonworking chimney detection increased by 1.96% and 2.23%, respectively, compared with those detected by ResNet50 without CEN.
SEN contributes to the improvement in mAP by 0.4% against the baseline, with APs of 0.99% on working chimneys and 0.52% on nonworking chimneys, respectively. When combining the two enhanced networks, the mAP achieves a number of 89.27%, which outperforms Libra Faster R-CNN. this indicates that both enhanced spatial and channel networks can bring benefits to small object detection. Additionally, this confirms that the richer and more accurate the semantic information, the better the detection performance.
Feature map visualization. As can be seen from Figure 11, we visualized the feature map extracted from the backbone and ResNet50, with and without CEN and SEN. It is clear that ResNet50 with CEN can filter most noise disturbance, but in the meantime, CEN can filter target features falsely to some extent. Moreover, it is clear to see from the SEN column of Figure 11 that by adding SEN into the backbone, the spatial interrelationship between components in CFPPs shows up, and more semantic information with richer and accurate location details from the complex remote sensing scenario is extracted. CEN with SEN makes the boundaries of components clear and the location accurate.
6.2. Ablation Study of Recursive Connections
In the section, we show the ablation study of the recursive connections we propose in Section 3.3. Table 6 shows the results. First, we tested the performance of the baseline (Cascade R-CNN) with ResNet50 and vanilla FPN as its backbone. Then, we added recursive connections and an improved ASPP module in the backbone, evaluating their contributions to the improvements. As we can see, recursive connections can bring >2% improvements in mAP compared with the baseline. The improved ASPP module outperforms the vanilla ASPP module by about 0.5% mAP. Specifically, the APs of working and nonworking chimneys increased by 3.86% and 2.69%, which is higher than those of working and nonworking condensing towers—1.56% and 2.4%, respectively. We can find that recursive connections with the improved ASPP module boost the model ability of small and densely clustered object detection.
6.3. Limitations
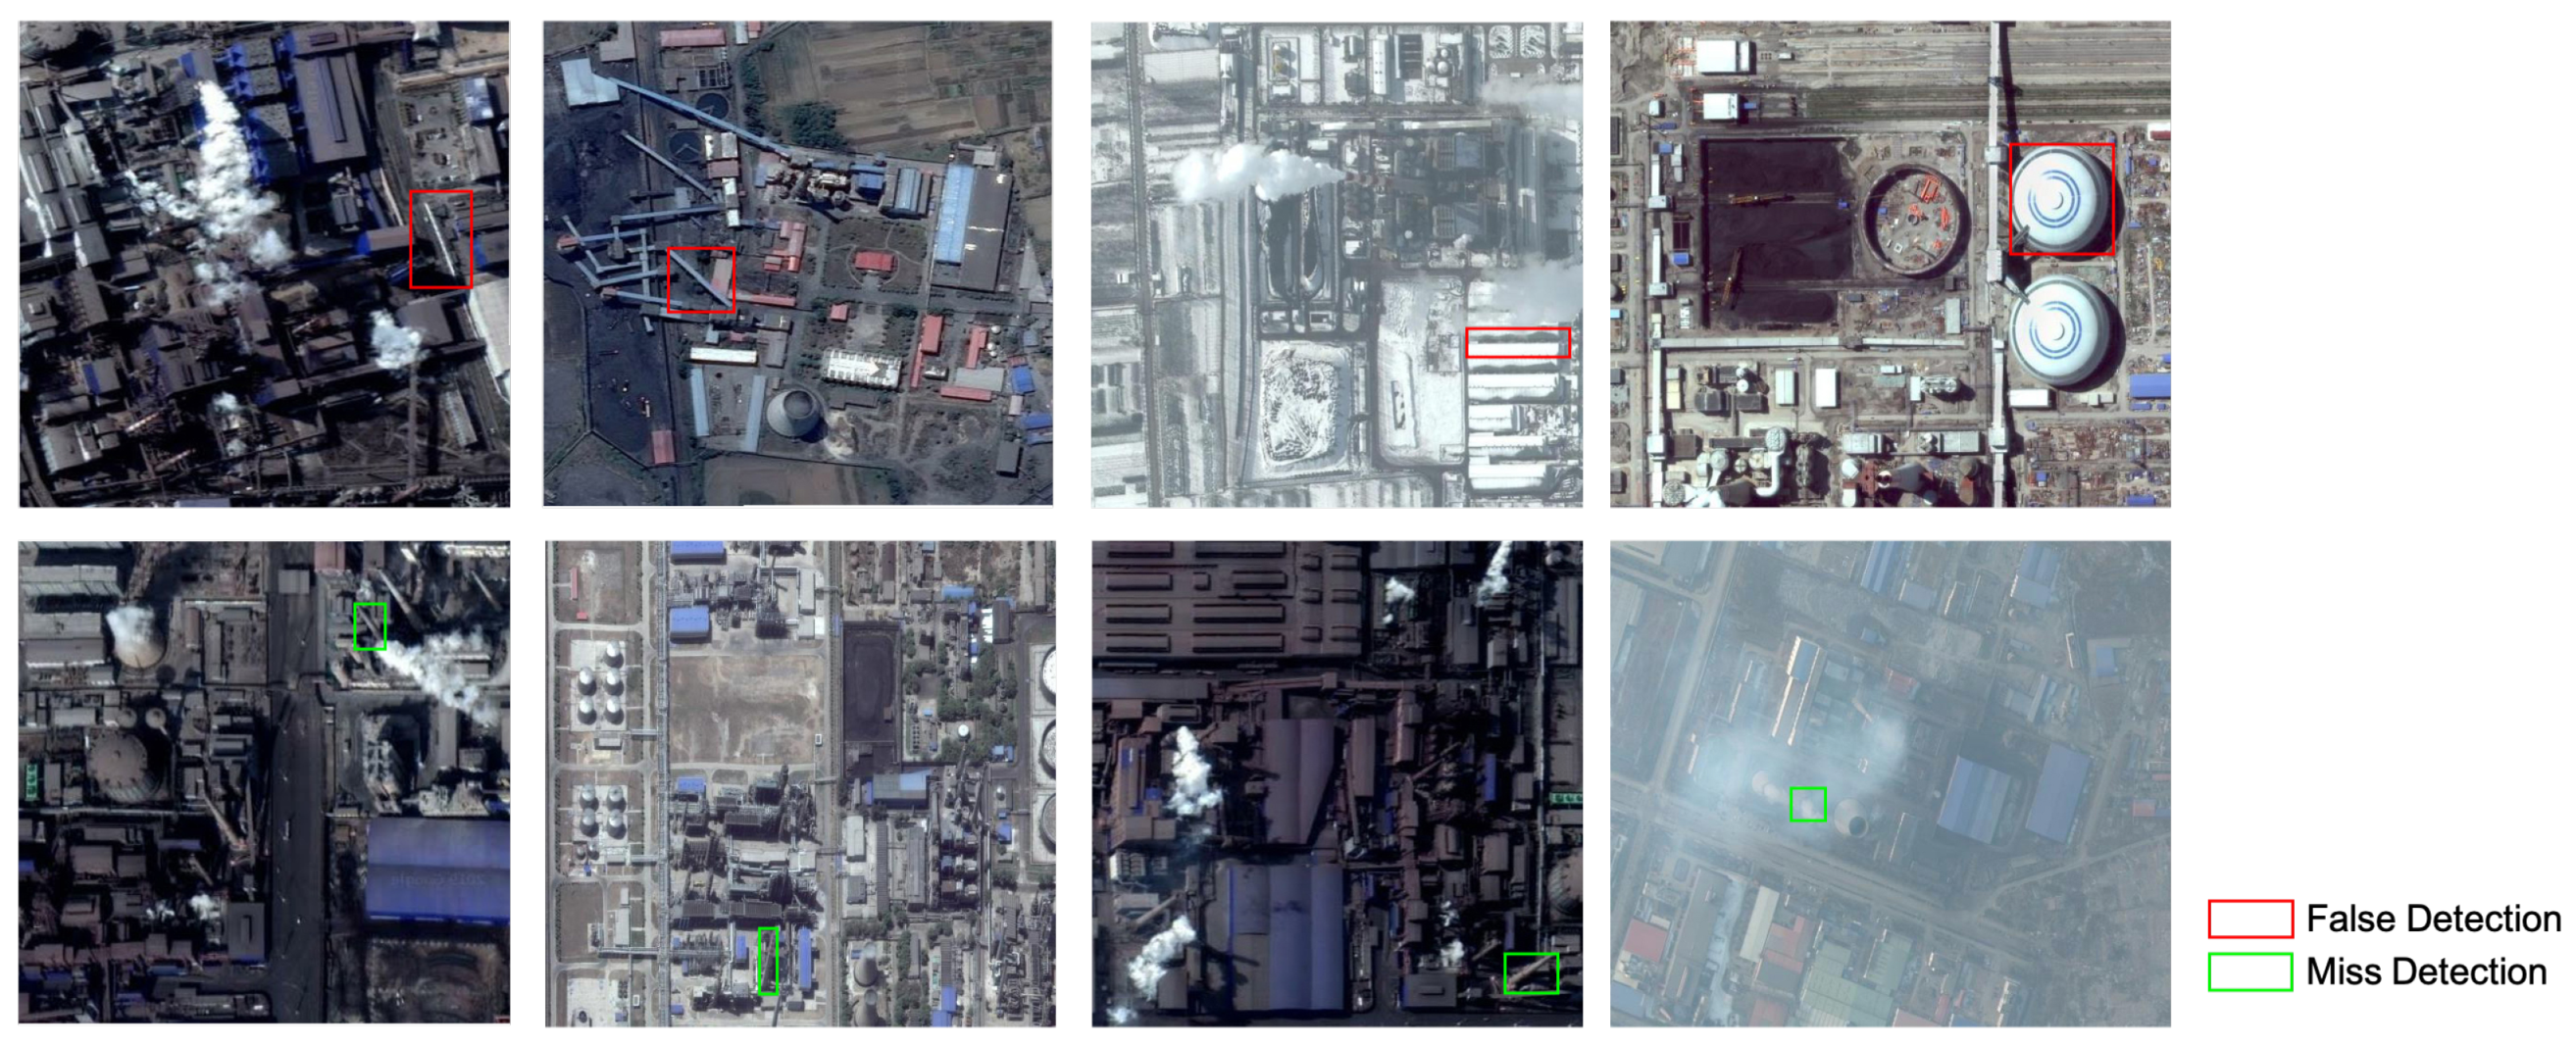
Even though the superiority of MUREN has been validated through comparative studies and ablation studies, there exist limitations. First, as shown in Section 5.3, the APs all decrease compared with the local evaluation, which indicates the generalization ability of MUREN should be strengthened. We recognize the training data are not that sufficient to support good generalization ability, and this may lead to overfitting to a certain extent. Because the number of CFPPs in specific regions is not as great as other objects, such as trees and vehicles, there is a limit to collecting the same amount of data. Additionally, some the training data were collected in the Beijing–Tianjin–Hebei region, where the different scenarios, backgrounds, and features from the Guangzhou–Foshan–Zhaoqing region may harm the generalization ability. Second, in Figure 12, we show some examples of false detection and misdetection in MUREN results. The red rectangles denote the false detection, and the green rectangles denote the misdetection. As we can see, the main factors of misdetection and false detection are complex backgrounds and similar textures, including pipes, snow, clouds, etc. These factors indicate that although MUREN is designed for CFPP detection in complex scenarios, severe obstructions and similar surroundings can still affect performance.
7. Conclusions
In this paper, we propose a MUltistage Recursive Enhanced Network (MUREN) to tackle composite CFPP detection, which consists of three procedures: the symmetrically enhanced networks embedded into a residual block, including a channel-enhanced subnetwork (CEN) and a spatial-enhanced subnetwork (SEN), recursive connections in FPN, and multistage detectors. We assess the MUREN method using the test datasets collected from the Beijing–Tianjin–Hebei region and Guangzhou–Foshan–Zhaoqing region. Compared with the other seven deep-learning-based object detection methods, MUREN achieved the best performance with an mAP of 92.46%, which improves this index by 4.57–21.38%. Moreover, we conducted a large-scale application in the Guangzhou–Foshan–Zhaoqing region, which resulted in nine complete CFPPs and forty-three incomplete CFPPs. The results indicate MUREN has great ability and potential in composite CFPP detection and counting. MUREN could bring effectiveness to large-scale composite CFPP detection and support carbon neutrality to the extent of CFPP monitoring. In the future, we will explore domain adaptation methods in remote sensing to employ MUREN in more large-scale and complex applications. We will also explore rotational object detection methods, continually boosting performance in real large-scale applications.
Author Contributions
Conceptualization, S.Y.; Methodology, S.Y.; Validation, J.Z.; Data curation, L.Z. and R.D.; Writing—original draft, S.Y.; Writing—review & editing, J.Z., L.Z., R.D., R.C.C.C. and H.F.; Visualization, S.Y. and J.Z.; Supervision, R.C.C.C. and H.F.; Project administration, R.C.C.C. and H.F.; Funding acquisition, R.C.C.C. and H.F. All authors have read and agreed to the published version of the manuscript.
Funding
This research was supported in part by CityU Research Grant No. 9239059, the National Key Research and Development Plan of China (Grant No. 2020YFB0204800), the National Natural Science Foundation of China (Grant No. T2125006), the Jiangsu Innovation Capacity Building Program (Grant No. BM2022028).
Institutional Review Board Statement
Not applicable.
Informed Consent Statement
Not applicable.
Data Availability Statement
Code and data are published on: https://github.com/yuanshuai0914/MUREN (accessed on: 14 April 2023).
Conflicts of Interest
The authors declare that they have no known competing financial interest or personal relationships that could have appeared to influence the work reported in this paper.
Appendix A
Some examples of detection results and comparisons by eight methods.
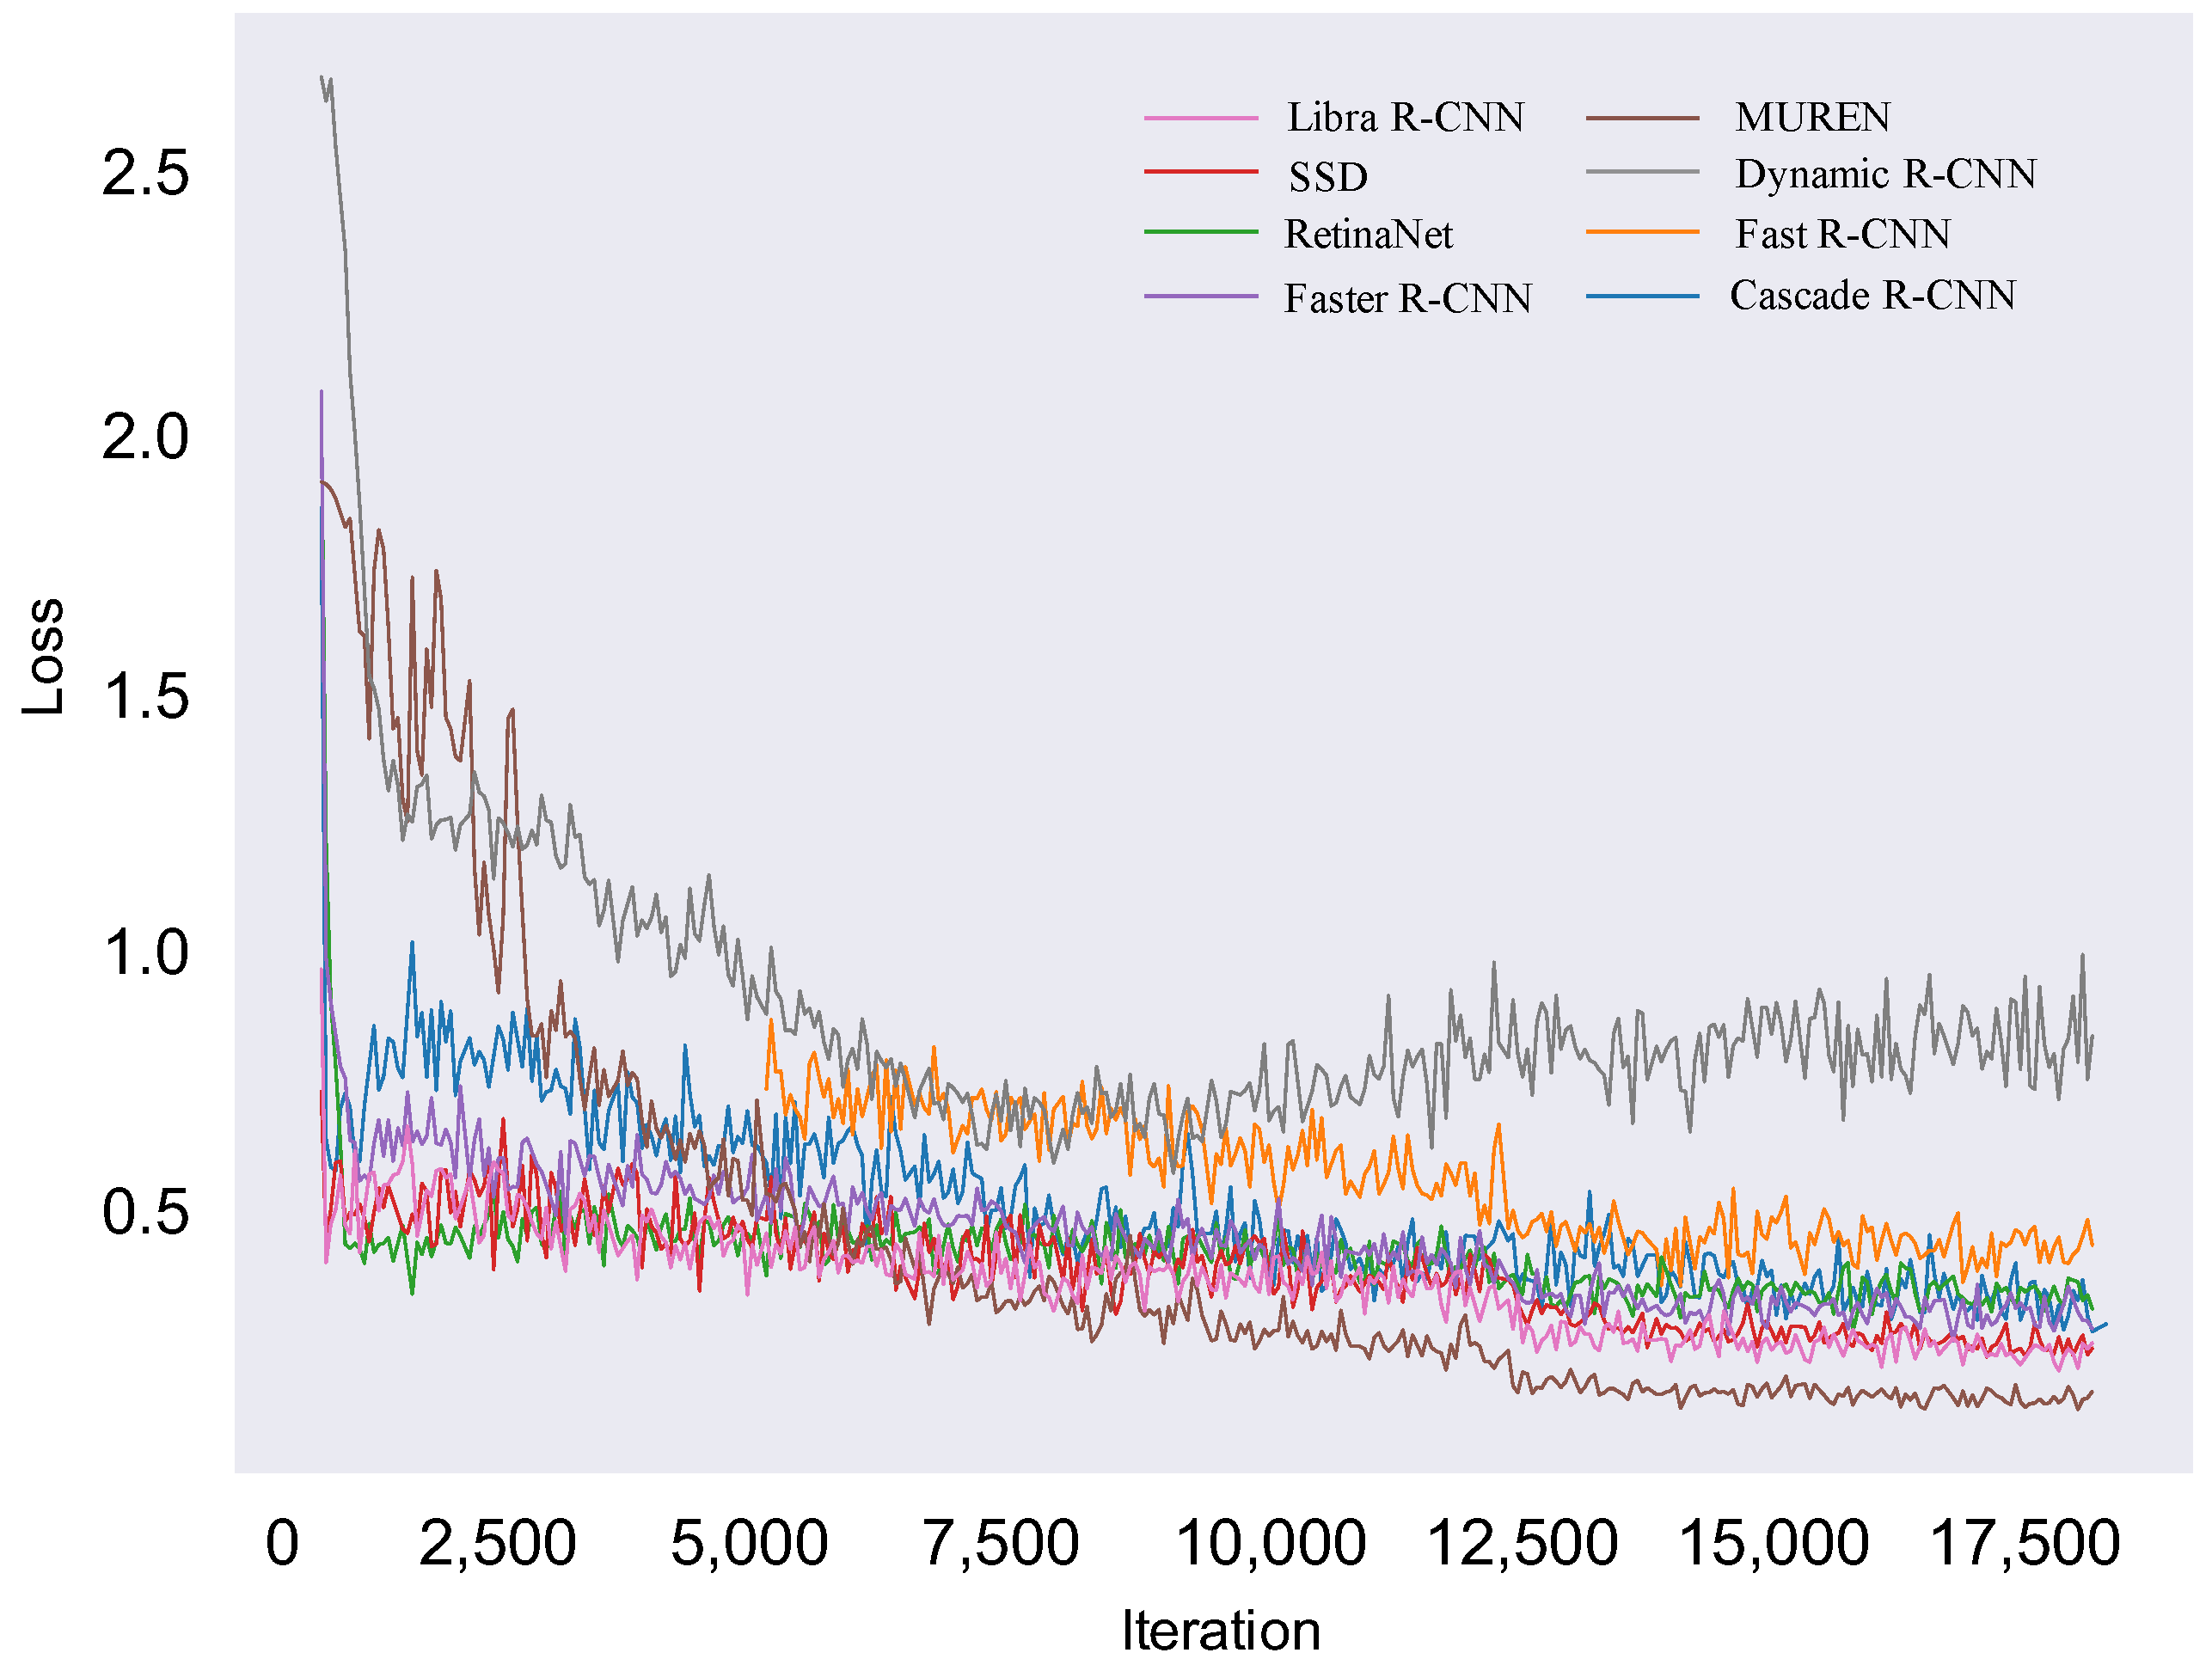
Figure A1.
The training loss comparison of eight methods. Our MUREN achieves the best loss convergence of about 0.15.
Figure A1.
The training loss comparison of eight methods. Our MUREN achieves the best loss convergence of about 0.15.

Figure A2.
The time required by the eight methods in training and testing. Though MUREN has the maximum total time spending, the testing time of each method is almost the same, which is the real time consumption in large-scale applications.
Figure A2.
The time required by the eight methods in training and testing. Though MUREN has the maximum total time spending, the testing time of each method is almost the same, which is the real time consumption in large-scale applications.

Figure A3.
The detection results of the eight methods. The box denotes the location, and the text denotes the category and working status. The number denotes the confidence value.
Figure A3.
The detection results of the eight methods. The box denotes the location, and the text denotes the category and working status. The number denotes the confidence value.

Figure A4.
The detection results of the eight methods. The box denotes, the location and the text denotes the category and working status. The number denotes the confidence value.
Figure A4.
The detection results of the eight methods. The box denotes, the location and the text denotes the category and working status. The number denotes the confidence value.

References
- Liu, Z.; Guan, D.; Crawford-Brown, D.; Zhang, Q.; He, K.; Liu, J. A low-carbon road map for China. Nature 2013, 500, 143–145. [Google Scholar] [CrossRef]
- Li, Z.Z.; Li, R.Y.M.; Malik, M.Y.; Murshed, M.; Khan, Z.; Umar, M. Determinants of carbon emission in China: How good is green investment? Sustain. Prod. Consum. 2021, 27, 392–401. [Google Scholar] [CrossRef]
- He, K.; Huo, H.; Zhang, Q.; He, D.; An, F.; Wang, M.; Walsh, M.P. Oil consumption and CO2 emissions in China’s road transport: Current status, future trends, and policy implications. Energy Policy 2005, 33, 1499–1507. [Google Scholar] [CrossRef]
- Zhou, S.; Wei, W.; Chen, L.; Zhang, Z.; Liu, Z.; Wang, Y.; Kong, J.; Li, J. Impact of a coal-fired power plant shutdown campaign on heavy metal emissions in China. Environ. Sci. Technol. 2019, 53, 14063–14069. [Google Scholar] [CrossRef] [PubMed]
- Gao, H.; Yang, W.; Yang, Y.; Yuan, G. Analysis of the air quality and the effect of governance policies in China’s Pearl River Delta, 2015–2018. Atmosphere 2019, 10, 412. [Google Scholar] [CrossRef]
- Zhong, L.; Louie, P.K.; Zheng, J.; Yuan, Z.; Yue, D.; Ho, J.W.; Lau, A.K. Science–policy interplay: Air quality management in the Pearl River Delta region and Hong Kong. Atmos. Environ. 2013, 76, 3–10. [Google Scholar] [CrossRef]
- Zhang, H.; Deng, Q. Deep learning based fossil-fuel power plant monitoring in high resolution remote sensing images: A comparative study. Remote. Sens. 2019, 11, 1117. [Google Scholar] [CrossRef]
- Han, C.; Li, G.; Ding, Y.; Yan, F.; Bai, L. Chimney detection based on faster R-CNN and spatial analysis methods in high resolution remote sensing images. Sensors 2020, 20, 4353. [Google Scholar] [CrossRef]
- Deng, Q.; Zhang, H. Chimney and condensing tower detection based on FPN in high resolution remote sensing images. In Proceedings of the Image and Signal Processing for Remote Sensing XXV, International Society for Optics and Photonics, Strasbourg, France, 9–12 September 2019; Volume 11155, p. 111552B. [Google Scholar]
- Yao, Y.; Jiang, Z.; Zhang, H.; Cai, B.; Meng, G.; Zuo, D. Chimney and condensing tower detection based on faster R-CNN in high resolution remote sensing images. In Proceedings of the 2017 IEEE International Geoscience and Remote Sensing Symposium (IGARSS), Fort Worth, TX, USA, 23–28 July 2017; pp. 3329–3332. [Google Scholar]
- Deng, J.; Dong, W.; Socher, R.; Li, L.J.; Li, K.; Fei-Fei, L. Imagenet: A large-scale hierarchical image database. In Proceedings of the 2009 IEEE Conference on Computer Vision and Pattern Recognition, Miami, FL, USA, 20–25 June 2009; pp. 248–255. [Google Scholar]
- Everingham, M.; Van Gool, L.; Williams, C.K.; Winn, J.; Zisserman, A. The pascal visual object classes (voc) challenge. Int. J. Comput. Vis. 2010, 88, 303–338. [Google Scholar] [CrossRef]
- Liu, W.; Anguelov, D.; Erhan, D.; Szegedy, C.; Reed, S.; Fu, C.Y.; Berg, A.C. Ssd: Single shot multibox detector. In Proceedings of the European Conference on Computer Vision, Amsterdam, The Netherlands, 11–14 October 2016; Springer: Berlin/Heidelberg, Germany, 2016; pp. 21–37. [Google Scholar]
- Lin, T.Y.; Goyal, P.; Girshick, R.; He, K.; Dollár, P. Focal loss for dense object detection. In Proceedings of the IEEE International Conference on Computer Vision, Venice, Italy, 22–29 October 2017; pp. 2980–2988. [Google Scholar]
- Redmon, J.; Divvala, S.; Girshick, R.; Farhadi, A. You only look once: Unified, real-time object detection. In Proceedings of the IEEE Conference on Computer Vision and Pattern Recognition, Las Vegas, NV, USA, 27–30 June 2016; pp. 779–788. [Google Scholar]
- Girshick, R. Fast r-cnn. In Proceedings of the IEEE International Conference on Computer Vision, Santiago, Chile, 7–13 December 2015; pp. 1440–1448. [Google Scholar]
- Ren, S.; He, K.; Girshick, R.; Sun, J. Faster r-cnn: Towards real-time object detection with region proposal networks. Adv. Neural Inf. Process. Syst. 2015, 28, 91–99. [Google Scholar] [CrossRef] [PubMed]
- Zhang, H.; Chang, H.; Ma, B.; Wang, N.; Chen, X. Dynamic R-CNN: Towards high quality object detection via dynamic training. In Proceedings of the European Conference on Computer Vision, Glasgow, UK, 23–28 August 2020; Springer: Berlin/Heidelberg, Germany, 2020; pp. 260–275. [Google Scholar]
- Pang, J.; Chen, K.; Shi, J.; Feng, H.; Ouyang, W.; Lin, D. Libra r-cnn: Towards balanced learning for object detection. In Proceedings of the IEEE/CVF Conference on Computer Vision and Pattern Recognition, Long Beach, CA, USA, 15–20 June 2019; pp. 821–830. [Google Scholar]
- Cai, Z.; Vasconcelos, N. Cascade r-cnn: Delving into high quality object detection. In Proceedings of the IEEE Conference on Computer Vision and Pattern Recognition, Salt Lake City, UT, USA, 18–23 June 2018; pp. 6154–6162. [Google Scholar]
- Shen, L.; Margolies, L.R.; Rothstein, J.H.; Fluder, E.; McBride, R.; Sieh, W. Deep learning to improve breast cancer detection on screening mammography. Sci. Rep. 2019, 9, 12495. [Google Scholar] [CrossRef]
- Danaee, P.; Ghaeini, R.; Hendrix, D.A. A deep learning approach for cancer detection and relevant gene identification. In Proceedings of the Pacific Symposium on Biocomputing, Kohala Coast, Hawaii, 4–8 January 2017; pp. 219–229. [Google Scholar]
- Barbedo, J.G.A.; Koenigkan, L.V.; Santos, T.T.; Santos, P.M. A study on the detection of cattle in UAV images using deep learning. Sensors 2019, 19, 5436. [Google Scholar] [CrossRef]
- Duporge, I.; Isupova, O.; Reece, S.; Macdonald, D.W.; Wang, T. Using very-high-resolution satellite imagery and deep learning to detect and count African elephants in heterogeneous landscapes. Remote Sens. Ecol. Conserv. 2020, 7, 369–381. [Google Scholar] [CrossRef]
- Kulkarni, R.; Dhavalikar, S.; Bangar, S. Traffic light detection and recognition for self driving cars using deep learning. In Proceedings of the 2018 Fourth International Conference on Computing Communication Control and Automation (ICCUBEA), Pune, India, 16–18 August 2018; pp. 1–4. [Google Scholar]
- Wang, J.G.; Zhou, L.B. Traffic light recognition with high dynamic range imaging and deep learning. IEEE Trans. Intell. Transp. Syst. 2018, 20, 1341–1352. [Google Scholar] [CrossRef]
- Najibi, M.; Singh, B.; Davis, L.S. Fa-rpn: Floating region proposals for face detection. In Proceedings of the IEEE/CVF Conference on Computer Vision and Pattern Recognition, Long Beach, CA, USA, 16–20 June 2019; pp. 7723–7732. [Google Scholar]
- Sun, X.; Wu, P.; Hoi, S.C. Face detection using deep learning: An improved faster RCNN approach. Neurocomputing 2018, 299, 42–50. [Google Scholar] [CrossRef]
- Li, C.; Wang, R.; Li, J.; Fei, L. Face detection based on YOLOv3. In Recent Trends in Intelligent Computing, Communication and Devices; Springer: Singapore, 2020; pp. 277–284. [Google Scholar]
- Zheng, J.; Fu, H.; Li, W.; Wu, W.; Zhao, Y.; Dong, R.; Yu, L. Cross-regional oil palm tree counting and detection via a multi-level attention domain adaptation network. ISPRS J. Photogramm. Remote Sens. 2020, 167, 154–177. [Google Scholar] [CrossRef]
- Zheng, J.; Fu, H.; Li, W.; Wu, W.; Yu, L.; Yuan, S.; Tao, W.Y.W.; Pang, T.K.; Kanniah, K.D. Growing status observation for oil palm trees using Unmanned Aerial Vehicle (UAV) images. ISPRS J. Photogramm. Remote Sens. 2021, 173, 95–121. [Google Scholar] [CrossRef]
- Li, W.; Dong, R.; Fu, H.; Yu, L. Large-scale oil palm tree detection from high-resolution satellite images using two-stage convolutional neural networks. Remote. Sens. 2019, 11, 11. [Google Scholar] [CrossRef]
- Chen, Z.; Chen, D.; Zhang, Y.; Cheng, X.; Zhang, M.; Wu, C. Deep learning for autonomous ship-oriented small ship detection. Saf. Sci. 2020, 130, 104812. [Google Scholar] [CrossRef]
- Cui, Z.; Li, Q.; Cao, Z.; Liu, N. Dense attention pyramid networks for multi-scale ship detection in SAR images. IEEE Trans. Geosci. Remote Sens. 2019, 57, 8983–8997. [Google Scholar] [CrossRef]
- Ammour, N.; Alhichri, H.; Bazi, Y.; Benjdira, B.; Alajlan, N.; Zuair, M. Deep learning approach for car detection in UAV imagery. Remote. Sens. 2017, 9, 312. [Google Scholar] [CrossRef]
- Xu, Y.; Yu, G.; Wang, Y.; Wu, X.; Ma, Y. Car detection from low-altitude UAV imagery with the faster R-CNN. J. Adv. Transp. 2017, 2017, 2823617. [Google Scholar] [CrossRef]
- Hamaguchi, R.; Hikosaka, S. Building detection from satellite imagery using ensemble of size-specific detectors. In Proceedings of the IEEE Conference on Computer Vision and Pattern Recognition Workshops, Salt Lake City, UT, USA, 18–23 June 2018; pp. 187–191. [Google Scholar]
- Zhang, L.; Dong, R.; Yuan, S.; Li, W.; Zheng, J.; Fu, H. Making low-resolution satellite images reborn: A deep learning approach for super-resolution building extraction. Remote Sens. 2021, 13, 2872. [Google Scholar] [CrossRef]
- Cheng, G.; Han, J. A survey on object detection in optical remote sensing images. ISPRS J. Photogramm. Remote Sens. 2016, 117, 11–28. [Google Scholar] [CrossRef]
- Zhu, X.X.; Tuia, D.; Mou, L.; Xia, G.S.; Zhang, L.; Xu, F.; Fraundorfer, F. Deep learning in remote sensing: A comprehensive review and list of resources. IEEE Geosci. Remote Sens. Mag. 2017, 5, 8–36. [Google Scholar] [CrossRef]
- Li, K.; Wan, G.; Cheng, G.; Meng, L.; Han, J. Object detection in optical remote sensing images: A survey and a new benchmark. ISPRS J. Photogramm. Remote Sens. 2020, 159, 296–307. [Google Scholar] [CrossRef]
- Peng, J.; Liu, Y. Model and context-driven building extraction in dense urban aerial images. Int. J. Remote Sens. 2005, 26, 1289–1307. [Google Scholar] [CrossRef]
- Chaudhuri, D.; Kushwaha, N.K.; Samal, A. Semi-automated road detection from high resolution satellite images by directional morphological enhancement and segmentation techniques. IEEE J. Sel. Top. Appl. Earth Obs. Remote Sens. 2012, 5, 1538–1544. [Google Scholar] [CrossRef]
- Eikvil, L.; Aurdal, L.; Koren, H. Classification-based vehicle detection in high-resolution satellite images. ISPRS J. Photogramm. Remote Sens. 2009, 64, 65–72. [Google Scholar] [CrossRef]
- Yao, X.; Han, J.; Guo, L.; Bu, S.; Liu, Z. A coarse-to-fine model for airport detection from remote sensing images using target-oriented visual saliency and CRF. Neurocomputing 2015, 164, 162–172. [Google Scholar] [CrossRef]
- Zhu, C.; Zhou, H.; Wang, R.; Guo, J. A novel hierarchical method of ship detection from spaceborne optical image based on shape and texture features. IEEE Trans. Geosci. Remote Sens. 2010, 48, 3446–3456. [Google Scholar] [CrossRef]
- Pang, J.; Li, C.; Shi, J.; Xu, Z.; Feng, H. R2-CNN: Fast Tiny Object Detection in Large-scale Remote Sensing Images. IEEE Trans. Geosci. Remote Sens. 2019, 57, 5512–5524. [Google Scholar] [CrossRef]
- Li, W.; Fu, H.; Yu, L.; Cracknell, A. Deep learning based oil palm tree detection and counting for high-resolution remote sensing images. Remote. Sens. 2017, 9, 22. [Google Scholar] [CrossRef]
- Deng, Z.; Sun, H.; Zhou, S.; Zhao, J.; Lei, L.; Zou, H. Multi-scale object detection in remote sensing imagery with convolutional neural networks. ISPRS J. Photogramm. Remote Sens. 2018, 145, 3–22. [Google Scholar] [CrossRef]
- Fu, K.; Chang, Z.; Zhang, Y.; Xu, G.; Zhang, K.; Sun, X. Rotation-aware and multi-scale convolutional neural network for object detection in remote sensing images. ISPRS J. Photogramm. Remote Sens. 2020, 161, 294–308. [Google Scholar] [CrossRef]
- Li, K.; Cheng, G.; Bu, S.; You, X. Rotation-insensitive and context-augmented object detection in remote sensing images. IEEE Trans. Geosci. Remote Sens. 2017, 56, 2337–2348. [Google Scholar] [CrossRef]
- Liu, W.; Ma, L.; Chen, H. Arbitrary-oriented ship detection framework in optical remote-sensing images. IEEE Geosci. Remote Sens. Lett. 2018, 15, 937–941. [Google Scholar] [CrossRef]
- Li, C.; Xu, C.; Cui, Z.; Wang, D.; Zhang, T.; Yang, J. Feature-attentioned object detection in remote sensing imagery. In Proceedings of the 2019 IEEE International Conference on Image Processing (ICIP), Taipei, Taiwan, China, 22–25 September 2019; pp. 3886–3890. [Google Scholar]
- Sun, X.; Wang, P.; Wang, C.; Liu, Y.; Fu, K. PBNet: Part-based convolutional neural network for complex composite object detection in remote sensing imagery. ISPRS J. Photogramm. Remote Sens. 2021, 173, 50–65. [Google Scholar] [CrossRef]
- Zhu, H.; Chen, X.; Dai, W.; Fu, K.; Ye, Q.; Jiao, J. Orientation robust object detection in aerial images using deep convolutional neural network. In Proceedings of the 2015 IEEE International Conference on Image Processing (ICIP), Quebec City, QC, Canada, 27–30 September 2015; pp. 3735–3739. [Google Scholar]
- Farooq, A.; Hu, J.; Jia, X. Efficient object proposals extraction for target detection in VHR remote sensing images. In Proceedings of the 2017 IEEE International Geoscience and Remote Sensing Symposium (IGARSS), Fort Worth, TX, USA, 23–28 July 2017; pp. 3337–3340. [Google Scholar]
- Qian, W.; Yang, X.; Peng, S.; Guo, Y.; Yan, J. Learning modulated loss for rotated object detection. arXiv 2019, arXiv:1911.08299. [Google Scholar] [CrossRef]
- Zhao, P.; Qu, Z.; Bu, Y.; Tan, W.; Guan, Q. Polardet: A fast, more precise detector for rotated target in aerial images. Int. J. Remote Sens. 2021, 42, 5821–5851. [Google Scholar] [CrossRef]
- Bao, S.; Zhong, X.; Zhu, R.; Zhang, X.; Li, Z.; Li, M. Single shot anchor refinement network for oriented object detection in optical remote sensing imagery. IEEE Access 2019, 7, 87150–87161. [Google Scholar] [CrossRef]
- Tian, H.; Wang, Y.; Xue, Z.; Qu, Y.; Chai, F.; Hao, J. Atmospheric emissions estimation of Hg, As, and Se from coal-fired power plants in China, 2007. Sci. Total Environ. 2011, 409, 3078–3081. [Google Scholar] [CrossRef] [PubMed]
- Büke, T.; Köne, A.Ç. Estimation of the health benefits of controlling air pollution from the Yatağan coal-fired power plant. Environ. Sci. Policy 2011, 14, 1113–1120. [Google Scholar] [CrossRef]
- Mittal, M.L.; Sharma, C.; Singh, R. Estimates of emissions from coal fired thermal power plants in India. In Proceedings of the 2012 International Emission Inventory Conference, Tampa, FL, USA, 13–16 August 2012; pp. 13–16. [Google Scholar]
- Yin, W.; Diao, W.; Wang, P.; Gao, X.; Li, Y.; Sun, X. PCAN—Part-Based Context Attention Network for Thermal Power Plant Detection in Remote Sensing Imagery. Remote Sens. 2021, 13, 1243. [Google Scholar] [CrossRef]
- He, K.; Zhang, X.; Ren, S.; Sun, J. Deep residual learning for image recognition. In Proceedings of the IEEE Conference on Computer Vision and Pattern Recognition, Las Vegas, NV, USA, 27–30 June 2016; pp. 770–778. [Google Scholar]
- Hu, J.; Shen, L.; Sun, G. Squeeze-and-excitation networks. In Proceedings of the IEEE Conference on Computer Vision and Pattern Recognition, Salt Lake City, UT, USA, 18–23 June 2018; pp. 7132–7141. [Google Scholar]
- Lin, M.; Chen, Q.; Yan, S. Network in network. arXiv 2013, arXiv:1312.4400. [Google Scholar]
- Ioffe, S.; Szegedy, C. Batch normalization: Accelerating deep network training by reducing internal covariate shift. In Proceedings of the International Conference on Machine Learning (PMLR), Lille, France, 7–9 July 2015; pp. 448–456. [Google Scholar]
- Nair, V.; Hinton, G.E. Rectified linear units improve restricted boltzmann machines. In Proceedings of the Icml, Haifa, Israel, 21–24 June 2010. [Google Scholar]
- Woo, S.; Park, J.; Lee, J.Y.; Kweon, I.S. Cbam: Convolutional block attention module. In Proceedings of the European Conference on Computer Vision (ECCV), Munich, Germany, 8–14 September 2018; pp. 3–19. [Google Scholar]
- Vaswani, A.; Shazeer, N.; Parmar, N.; Uszkoreit, J.; Jones, L.; Gomez, A.N.; Kaiser, Ł.; Polosukhin, I. Attention is all you need. In Proceedings of the Advances in Neural Information Processing Systems, Long Beach, CA, USA, 4–9 December 2017; pp. 5998–6008. [Google Scholar]
- Qiao, S.; Chen, L.C.; Yuille, A. Detectors: Detecting objects with recursive feature pyramid and switchable atrous convolution. In Proceedings of the IEEE/CVF Conference on Computer Vision and Pattern Recognition, Nashville, TN, USA, 20–25 June 2021; pp. 10213–10224. [Google Scholar]
- Lin, T.Y.; Dollár, P.; Girshick, R.; He, K.; Hariharan, B.; Belongie, S. Feature pyramid networks for object detection. In Proceedings of the IEEE Conference on Computer Vision and Pattern Recognition, Honolulu, HI, USA, 21–26 July 2017; pp. 2117–2125. [Google Scholar]
- Chen, L.C.; Papandreou, G.; Kokkinos, I.; Murphy, K.; Yuille, A.L. Deeplab: Semantic image segmentation with deep convolutional nets, atrous convolution, and fully connected crfs. IEEE Trans. Pattern Anal. Mach. Intell. 2017, 40, 834–848. [Google Scholar] [CrossRef] [PubMed]
- Alvarez, J.; Petersson, L. Decomposeme: Simplifying convnets for end-to-end learning. arXiv 2016, arXiv:1606.05426. [Google Scholar]
- Paszke, A.; Gross, S.; Massa, F.; Lerer, A.; Bradbury, J.; Chanan, G.; Killeen, T.; Lin, Z.; Gimelshein, N.; Antiga, L.; et al. Pytorch: An imperative style, high-performance deep learning library. Adv. Neural Inf. Process. Syst. 2019, 32, 8026–8037. [Google Scholar]
- Chen, K.; Wang, J.; Pang, J.; Cao, Y.; Xiong, Y.; Li, X.; Sun, S.; Feng, W.; Liu, Z.; Xu, J.; et al. MMDetection: Open mmlab detection toolbox and benchmark. arXiv 2019, arXiv:1906.07155. [Google Scholar]
- Bottou, L. Stochastic gradient descent tricks. In Neural Networks: Tricks of the Trade; Springer: Berlin/Heidelberg, Germany, 2012; pp. 421–436. [Google Scholar]
- Shrivastava, A.; Gupta, A.; Girshick, R. Training region-based object detectors with online hard example mining. In Proceedings of the IEEE Conference on Computer Vision and Pattern Recognition, Las Vegas, NV, USA, 27–30 June 2016; pp. 761–769. [Google Scholar]
- Buslaev, A.; Iglovikov, V.I.; Khvedchenya, E.; Parinov, A.; Druzhinin, M.; Kalinin, A.A. Albumentations: Fast and flexible image augmentations. Information 2020, 11, 125. [Google Scholar] [CrossRef]
- Bodla, N.; Singh, B.; Chellappa, R.; Davis, L.S. Soft-NMS–improving object detection with one line of code. In Proceedings of the IEEE International Conference on Computer Vision, Honolulu, HI, USA, 21–26 July 2017; pp. 5561–5569. [Google Scholar]
Figure 1.
The differences between CFPPs and other objects, i.e., cars and ships, in optical HRSIs. (a,b) are the optical images of CFPPs, while (c,d) are the optical images of ships and cars. Compared with CFPP, cars and ships have clearer boundaries and simpler backgrounds. Additionally, their regular shapes make them easier to detect.

Figure 2.
The mAPs of the previous studies on CFPP detection on the BUAA-FFPP60 datasets [7,8,10,63].

Figure 3.
The architecture of our proposed MUREN: the GREEN parts denote our main contributions, including a channel-enhanced subnetwork, a spatial-enhanced subnetwork, and a recursive connection with an improved ASPP module embedded in the Feature Pyramid Network.
Figure 3.
The architecture of our proposed MUREN: the GREEN parts denote our main contributions, including a channel-enhanced subnetwork, a spatial-enhanced subnetwork, and a recursive connection with an improved ASPP module embedded in the Feature Pyramid Network.

Figure 4.
The detailed architectures of CEN and SEN. Both of them are embedded into the residual block of ResNet50.
Figure 4.
The detailed architectures of CEN and SEN. Both of them are embedded into the residual block of ResNet50.

Figure 5.
The architecture of the improved ASPP module. Four outputs generated by four branches are concatenated along the channel dimension.
Figure 5.
The architecture of the improved ASPP module. Four outputs generated by four branches are concatenated along the channel dimension.

Figure 6.
Examples of our datasets, including working chimney, nonworking chimney, working condensing tower, and nonworking condensing tower.
Figure 6.
Examples of our datasets, including working chimney, nonworking chimney, working condensing tower, and nonworking condensing tower.

Figure 7.
(a) is the map of China, (b) is the map of Guangdong province and locations of the Guangzhou–Foshan–Zhaoqing region, and (c) is our study area.
Figure 7.
(a) is the map of China, (b) is the map of Guangdong province and locations of the Guangzhou–Foshan–Zhaoqing region, and (c) is our study area.

Figure 8.
The visualization of large-scale detection in the Guangzhou–Foshan–Zhaoqing region. The blue point denotes an incomplete CFPP location, and the red point denotes a complete CFPP location. There are nine complete CFPPs and forty-three incomplete CFPPs in this region.
Figure 8.
The visualization of large-scale detection in the Guangzhou–Foshan–Zhaoqing region. The blue point denotes an incomplete CFPP location, and the red point denotes a complete CFPP location. There are nine complete CFPPs and forty-three incomplete CFPPs in this region.

Figure 9.
The detection results of eight methods. The box denotes the location, and the text denotes the category and working status. The number denotes the confidence value.
Figure 9.
The detection results of eight methods. The box denotes the location, and the text denotes the category and working status. The number denotes the confidence value.

Figure 10.
The detection results of eight methods. The box denotes the location, and the text denotes the category and working status. The number denotes the confidence value.
Figure 10.
The detection results of eight methods. The box denotes the location, and the text denotes the category and working status. The number denotes the confidence value.

Figure 11.
The visualization of feature maps from ResNet50, ResNet50+CEN, ResNet50+SEN, and ResNet50+CEN+SEN. We visualized the feature maps of these four satellite images. Vanilla ResNet50 is seriously affected by surrounding textures, and the features of CFPP are vague and blurred. By adding CEN into the backbone, most noise is eliminated and the features of CFPP are emphasized, but some useful features are also removed. SEN finds more spatial relationship between components in CFPPs. After employing SEN, the features of CFPPs become more comprehensive with clearer boundaries and more accurate locations.

Figure 12.
The visualization of false detection and misdetection of MUREN results. The red rectangles denote false detection, and the green rectangles denote the misdetection.
Figure 12.
The visualization of false detection and misdetection of MUREN results. The red rectangles denote false detection, and the green rectangles denote the misdetection.


Table 1.
The detection results evaluation of MUREN.
| Index | Chimney | Condensing Tower | ||
|---|---|---|---|---|
| Working | Nonworking | Working | Nonworking | |
| recall | 88.17% | 83.02% | 98.32% | 97.28% |
| precision | 86.92% | 80.46% | 99% | 92.23% |
| AP | 88.92% | 86.32% | 98.10% | 96.49% |
| mAP | 92.46% | |||
Table 2.
The large-scale evaluation results of MUREN.
| Index | Chimney | Condensing Tower | ||
|---|---|---|---|---|
| Working | Nonworking | Working | Nonworking | |
| TP | 66 | 89 | 43 | 57 |
| FP | 13 | 19 | 6 | 7 |
| FN | 11 | 14 | 1 | 4 |
| precision | 83.43% | 82.41% | 87.76% | 89.06% |
| recall | 85.71% | 86.41% | 97.73% | 93.44% |
| AP | 84.67% | 82.72% | 92.75% | 90.19% |
| mAP | 87.58% | |||
Table 3.
The precision comparison between other methods and MUREN.
| Method | Working Chimney | Nonworking Chimney | Working Condensing Tower | Nonworking Condensing Tower | mAP |
|---|---|---|---|---|---|
| SSD | 55.31% | 56.38% | 88.41% | 84.23% | 71.08% |
| RetinaNet | 59.78% | 58.19% | 89.90% | 84.21% | 73.02% |
| Fast R-CNN | 62.02% | 61.56% | 90.67% | 84.67% | 74.73% |
| Dynamic R-CNN | 71.29% | 72.76% | 92.31% | 91.07% | 81.85% |
| Faster R-CNN | 70.73% | 66.24% | 93.44% | 89.41% | 79.95% |
| Cascade R-CNN | 80.34% | 79.92% | 93.76% | 91.93% | 86.48% |
| Libra Faster R-CNN | 82.23% | 78.45% | 94.32% | 96.67% | 87.89% |
| MUREN(Ours) | 88.92% | 86.32% | 98.10% | 96.49% | 92.46% |
Table 4.
The complexity comparison between other methods and MUREN.
| Method | Parameter Amount | Space Occupancy |
|---|---|---|
| SSD | 35 million | 224 MB |
| RetinaNet | 40 million | 633 MB |
| Fast R-CNN | 42 million | 428 MB |
| Dynamic R-CNN | 47 million | 631 MB |
| Faster R-CNN | 42 million | 437 MB |
| Cascade R-CNN | 44 million | 552 MB |
| Libra Faster R-CNN | 45 million | 575MB |
| MUREN(Ours) | 45 million | 587 MB |
Table 5.
The ablation study of CEN and SEN.
| Strategy | Working Chimney | Nonworking Chimney | Working Condensing Tower | Nonworking Condensing Tower | mAP |
|---|---|---|---|---|---|
| Baseline | 80.34% | 79.92% | 95.76% | 92.93% | 87.23% |
| Baseline+CEN | 82.30% | 82.15% | 96.12% | 93.78% | 88.58% |
| Baseline+SEN | 81.33% | 80.45% | 96.25% | 92.67% | 87.63% |
| Baseline+CEN+SEN | 83.91% | 82.93% | 96.17% | 94.07% | 89.27% |
Table 6.
The ablation study of recursive connections.
| Strategy | Working Chimney | Nonworking Chimney | Working Condensing Tower | Nonworking Condensing Tower | mAP | ||
|---|---|---|---|---|---|---|---|
| Baseline | 80.34% | 79.92% | 95.76% | 92.93% | 87.23% | ||
| Recursive Connections | 82.38% | 81.41% | 96.83% | 94.21% | 88.71% | ||
| Recursive | + | Vanilla | 83.02% | 82.19% | 97.11% | 94.76% | 89.27% |
| Connections | ASPP | ||||||
| Recursive | + | Improved | 83.98% | 82.61% | 97.32% | 95.33% | 89.81% |
| Connections | ASPP | ||||||
Disclaimer/Publisher’s Note: The statements, opinions and data contained in all publications are solely those of the individual author(s) and contributor(s) and not of MDPI and/or the editor(s). MDPI and/or the editor(s) disclaim responsibility for any injury to people or property resulting from any ideas, methods, instructions or products referred to in the content. |
© 2023 by the authors. Licensee MDPI, Basel, Switzerland. This article is an open access article distributed under the terms and conditions of the Creative Commons Attribution (CC BY) license (https://creativecommons.org/licenses/by/4.0/).
Share and Cite
MDPI and ACS Style
Yuan, S.; Zheng, J.; Zhang, L.; Dong, R.; Cheung, R.C.C.; Fu, H. MUREN: MUltistage Recursive Enhanced Network for Coal-Fired Power Plant Detection. Remote Sens. 2023, 15, 2200. https://0-doi-org.brum.beds.ac.uk/10.3390/rs15082200
AMA Style
Yuan S, Zheng J, Zhang L, Dong R, Cheung RCC, Fu H. MUREN: MUltistage Recursive Enhanced Network for Coal-Fired Power Plant Detection. Remote Sensing. 2023; 15(8):2200. https://0-doi-org.brum.beds.ac.uk/10.3390/rs15082200
Chicago/Turabian StyleYuan, Shuai, Juepeng Zheng, Lixian Zhang, Runmin Dong, Ray C. C. Cheung, and Haohuan Fu. 2023. "MUREN: MUltistage Recursive Enhanced Network for Coal-Fired Power Plant Detection" Remote Sensing 15, no. 8: 2200. https://0-doi-org.brum.beds.ac.uk/10.3390/rs15082200
Note that from the first issue of 2016, this journal uses article numbers instead of page numbers. See further details here.