Article

Estimating Sugarcane Aboveground Biomass and Carbon Stock Using the Combined Time Series of Sentinel Data with Machine Learning Algorithms

by
Savittri Ratanopad Suwanlee
1,
Dusadee Pinasu
2,
Jaturong Som-ard
1,*,
Enrico Borgogno-Mondino
3 and
Filippo Sarvia
3
1
Department of Geography, Faculty of Humanities and Social Sciences, Mahasarakham University, Maha Sarakham 44150, Thailand
2
Technology and Informatics Institute for Sustainability, National Metal and Materials Technology Center, National Science and Technology Development Agency, Thailand Science Park, Pathum Thani 12120, Thailand
3
Department of Agricultural, Forest and Food Sciences, University of Turin, 10095 Torino, Italy
*
Author to whom correspondence should be addressed.
Submission received: 10 January 2024 / Revised: 10 February 2024 / Accepted: 18 February 2024 / Published: 22 February 2024

Abstract

:
Accurately mapping crop aboveground biomass (AGB) in a timely manner is crucial for promoting sustainable agricultural practices and effective climate change mitigation actions. To address this challenge, the integration of satellite-based Earth Observation (EO) data with advanced machine learning algorithms offers promising prospects to monitor land and crop phenology over time. However, achieving accurate AGB maps in small crop fields and complex landscapes is still an ongoing challenge. In this study, the AGB was estimated for small sugarcane fields (<1 ha) located in the Kumphawapi district of Udon Thani province, Thailand. Specifically, in order to explore, estimate, and map sugarcane AGB and carbon stock for the 2018 and 2021 years, ground measurements and time series of Sentinel-1 (S1) and Sentinel-2 (S2) data were used and random forest regression (RFR) and support vector regression (SVR) applied. Subsequently, optimized predictive models used to generate large-scale maps were adapted. The RFR models demonstrated high efficiency and consistency when compared to the SVR models for the two years considered. Specifically, the resulting AGB maps displayed noteworthy accuracy, with the coefficient of determination (R2) as 0.85 and 0.86 with a root mean square error (RMSE) of 8.84 and 9.61 t/ha for the years 2018 and 2021, respectively. In addition, mapping sugarcane AGB and carbon stock across a large scale showed high spatial variability within fields for both base years. These results exhibited a high potential for effectively depicting the spatial distribution of AGB densities. Finally, it was shown how these highly accurate maps can support, as valuable tools, sustainable agricultural practices, government policy, and decision-making processes.

1. Introduction

Climate change constitutes a significant challenge for humanity, resource managers, and policymakers [1]. Mitigating climate change has become a focal point of global efforts. One strategy recognized for its potential in climate change mitigation results is carbon storage in the form of aboveground biomass (AGB) of plants [2,3]. Within this context, remote sensing plays a key role in mapping and estimating vegetation AGB over large regions, even for those areas not accessible [4,5,6].
Sugarcane, belonging to the Poaceae family, is a monocotyledon C4 plant, and it has the capacity to fix carbon dioxide (CO2) in comparison to other plants (i.e., beans belonging to the Leguminosae family). Sugarcane’s photosynthesis process allows the storage of aboveground and belowground carbon in different plant organs. These sugarcane characteristics can store AGB, with a total dry mass of sugarcane equal to 2.5 tons (t)/ha [7,8]. However, it is well known that several factors affect the biomass storage and carbon fixation capabilities of sugarcane, including environmental conditions, fertilizers, crop phenological stage, and crop variety [9,10]. Knowledge regarding these drivers plays a key role in the successful management of sugarcane cultivation in order to maximize its carbon sequestration potential.
Thailand has been a global leader in sugarcane cultivation. According to an FAO report [11], alongside Brazil, India, and China, Thailand ranked among the top four global producers of sugarcane in 2021. The sugar industry in these countries plays a crucial economic role, contributing significantly to the national economy [12,13]. Moreover, sugarcane cultivation and the related sugar industry have been key components of Thailand’s agricultural and economic landscape. In 2022, Thailand saw a substantial increase in the total cultivation area, reaching 3.4% from 2020. The northeast region of Thailand emerges as a key player, accounting for 43% of the country’s sugarcane cultivation areas. The favorable weather conditions and ample water availability of this region make it suitable for sugarcane cultivation [14]. Several government policies have also played a role in shaping the sugarcane landscape. By changing rice in unsuitable areas to sugarcane, cassava, and oil palm cultivations, the government aims to optimize agricultural practices and incentivize sugarcane farming. This strategic approach is aimed at supporting sugarcane farmers to increase their cultivation and contribute to the prosperity of Thailand’s sugarcane industry [12,15].
However, the environmental impact of agricultural practices, particularly in the northeast region of Thailand, is a growing concern. Surplus agricultural products, including materials like rice straw, sugarcane leaves, and cobs have historically been disposed of through burning or left without proper management, leading to negative environmental consequences. Specifically, the improper burning of agricultural waste materials fuels the emission of carbon dioxide (CO2), the release of air pollutants PM 2.5, and contributes to global warming [16]. Consequently, monitoring AGB and carbon stock is crucial for assessing climate change impacts and ensuring sustainable crop management. The integration of biomass data from both field measurements and remote sensing satellites provides valuable insights into AGB dynamics across various scales, ranging from local to global, as mentioned in the review of Kumar and Mutanga [4].
To alternatively inform the related stockholders, accurate and rapid mapping aimed at estimating sugarcane AGB and carbon stock quantification is useful. The studies of Mansaray et al. [17], Wang et al. [18], Wang et al. [19], and Li et al. [20] have shown highly accurate mapping of crops AGB (i.e., rice, sugarcane, graze, and rubber tree) using multiple remote sensing data and powerful machine learning regression models. Therefore, satellite-based Earth Observation (EO) data can offer valuable information on wide geographical areas in a timely and cost-efficient manner.
EO data have emerged as a crucial tool for mapping and monitoring vegetation and land surface dynamics over large regions in near-real time, offering a cost-efficient approach [5,6,21]. The use of multiple EO data sources for mapping vegetation AGB and phenological dynamics, including crop growth and forest changes, has demonstrated high efficiency and feasibility [5,6,22,23]. Numerous studies have underscored the pivotal role of integrating various EO data sources, such as Moderate Resolution Imaging Spectroradiometer (MODIS), Landsat, Gaofen-1, Sentinel-1 (S1), and Sentinel-2 (S2), for estimating vegetation biomass at regional scales [19,24,25,26,27]. These studies have demonstrated high accuracy and satisfaction in rapidly monitoring and mapping vegetation AGB, particularly in the context of crop sectors.
Starting from 2015, the Copernicus S1 and S2 satellites have provided images with high-temporal (5–12 days) and geometric resolution (ground sample distance equal to 10 m), making them highly valuable for tracking rapid crop phenological dynamics [17,28,29,30,31]. Moreover, data from these sensors are freely available, permitting land surface monitoring of the earth’s surface in different regions and geographic areas even in contexts where affordability is limited [19,32,33,34]. The main benefits of S1 and S2 data can be found in their potential value in mapping and monitoring land surface, the AGB of vegetation, and crop phenological applications [19,21,33,35]. Consequently, several research efforts have used advanced innovative machine learning regression methods, such as multiple linear regression (MLR), random forest regression (RFR), classification and regression trees (CART), and support vector regression (SVR), for rapid mapping vegetation AGB [17,22,27,34,36,37,38,39]. Their studies demonstrated high AGB mapping accuracy when combining data derived from multi-temporal S1 and S2 images.
Moreover, the integration of multi-temporal S1 and S2 data with advanced machine learning regression methods has been proven effective in several studies. For instance, Xu et al. [40] successfully mapped maize biomass in Changchun, Jilin province, northeast China, using a combination of multi-temporal S1 and S2 data. They achieved a high accuracy with the coefficient of determination (R2) = 0.83 and the root mean square error (RMSE) = 3.9 t/ha. Ndikumana et al. [41] estimated rice height and biomass in Camargue, southern France, from multi-temporal S1 and S2 data, obtaining high accuracy, with R2 = 0.90 and RMSE = 1.6 t/ha. Mansaray, Kanu, Yang, Huang, and Wang [17] also estimated rice dry biomass in Tongxiang County, China, using S2, HJ-1 A and B, and Landsat 8 data, demonstrating the best model accuracy of R2 = 0.82 and RMSE = 1.9 t/ha. Zhu et al. [42] mapped sugarcane biomass and yield in Guangxi province, China, by developing the vegetation optical depth (VOD) from S1 data and green–red vegetation index (GRVI) using S2 images. They achieved an R2 = 0.82 and RMSE = 11.4 t/ha. Uribeetxebarria et al. [43] combined S1 and S2 data to estimate wheat biomass and yield in the Llanada Alavesa region in northern Spain, obtaining high accuracy with R2 = 0.95 and RMSE = 0.2 t/ha. In addition, Li, Wang, Gao, Wu, Cheng, Ren, Bao, Yun, Wu, and Xie [20] also mapped the biomass of rubber plantations in Hainan island, China, using S2 and Landsat data, achieving high accuracy (R2 = 0.97 and RMSE = 7.7 × 10⁻⁹ t/ha). Their results proved highly accurate with excellent mapping crop biomass based on combining multi-temporal S1 and S2 satellites and the great machine learning regression methods.
However, smallholder systems, complex landscapes, and cloudy regions that characterize Thailand remain challenges in mapping crop biomass, especially in estimating the AGB of sugarcane plantations. Moreover, the combined S1 and S2 time series data for mapping sugarcane AGB in small field sizes and complex landscapes like the one involved in this study is still an ongoing challenge.
Addressing study gaps, this research assessed the combination of a time series of S1 and S2 image data along with the RFR method in order to explore, estimate, and map sugarcane AGB and carbon stock for the years 2018 and 2021 within the entire Kumphawapi district. Subsequently, the optimized-feature predictive model developed in this work was adapted to estimate AGB and carbon stock over large-scale maps such as the Udon Thani province in Thailand. Consequently, the main objectives pursued in this work can be summarized as follows:
  • develop advanced machine learning models for estimating sugarcane AGB using a combined time series of S1 and S2 data ground datasets;
  • estimate sugarcane AGB for 2018 and 2021 within the entire Kumphawapi district using a combined time series of S1 and S2 together with machine learning methods;
  • map sugarcane carbon stock for 2018 and 2021 using sugarcane AGB maps and a conversion factor;
  • transform the optimized-feature predictive model and derive spectral information with several additional indices for mapping AGB and carbon stock across the larger geographic area of Udon Thani province in Thailand.
These objectives allow us to effectively monitor and understand the field variability of sugarcane AGB and carbon stock, providing valuable insights for sustainable agriculture practices, understanding its carbon sequestration potential and ecosystem response, and supporting zero-carbon policies.

2. Materials and Methods
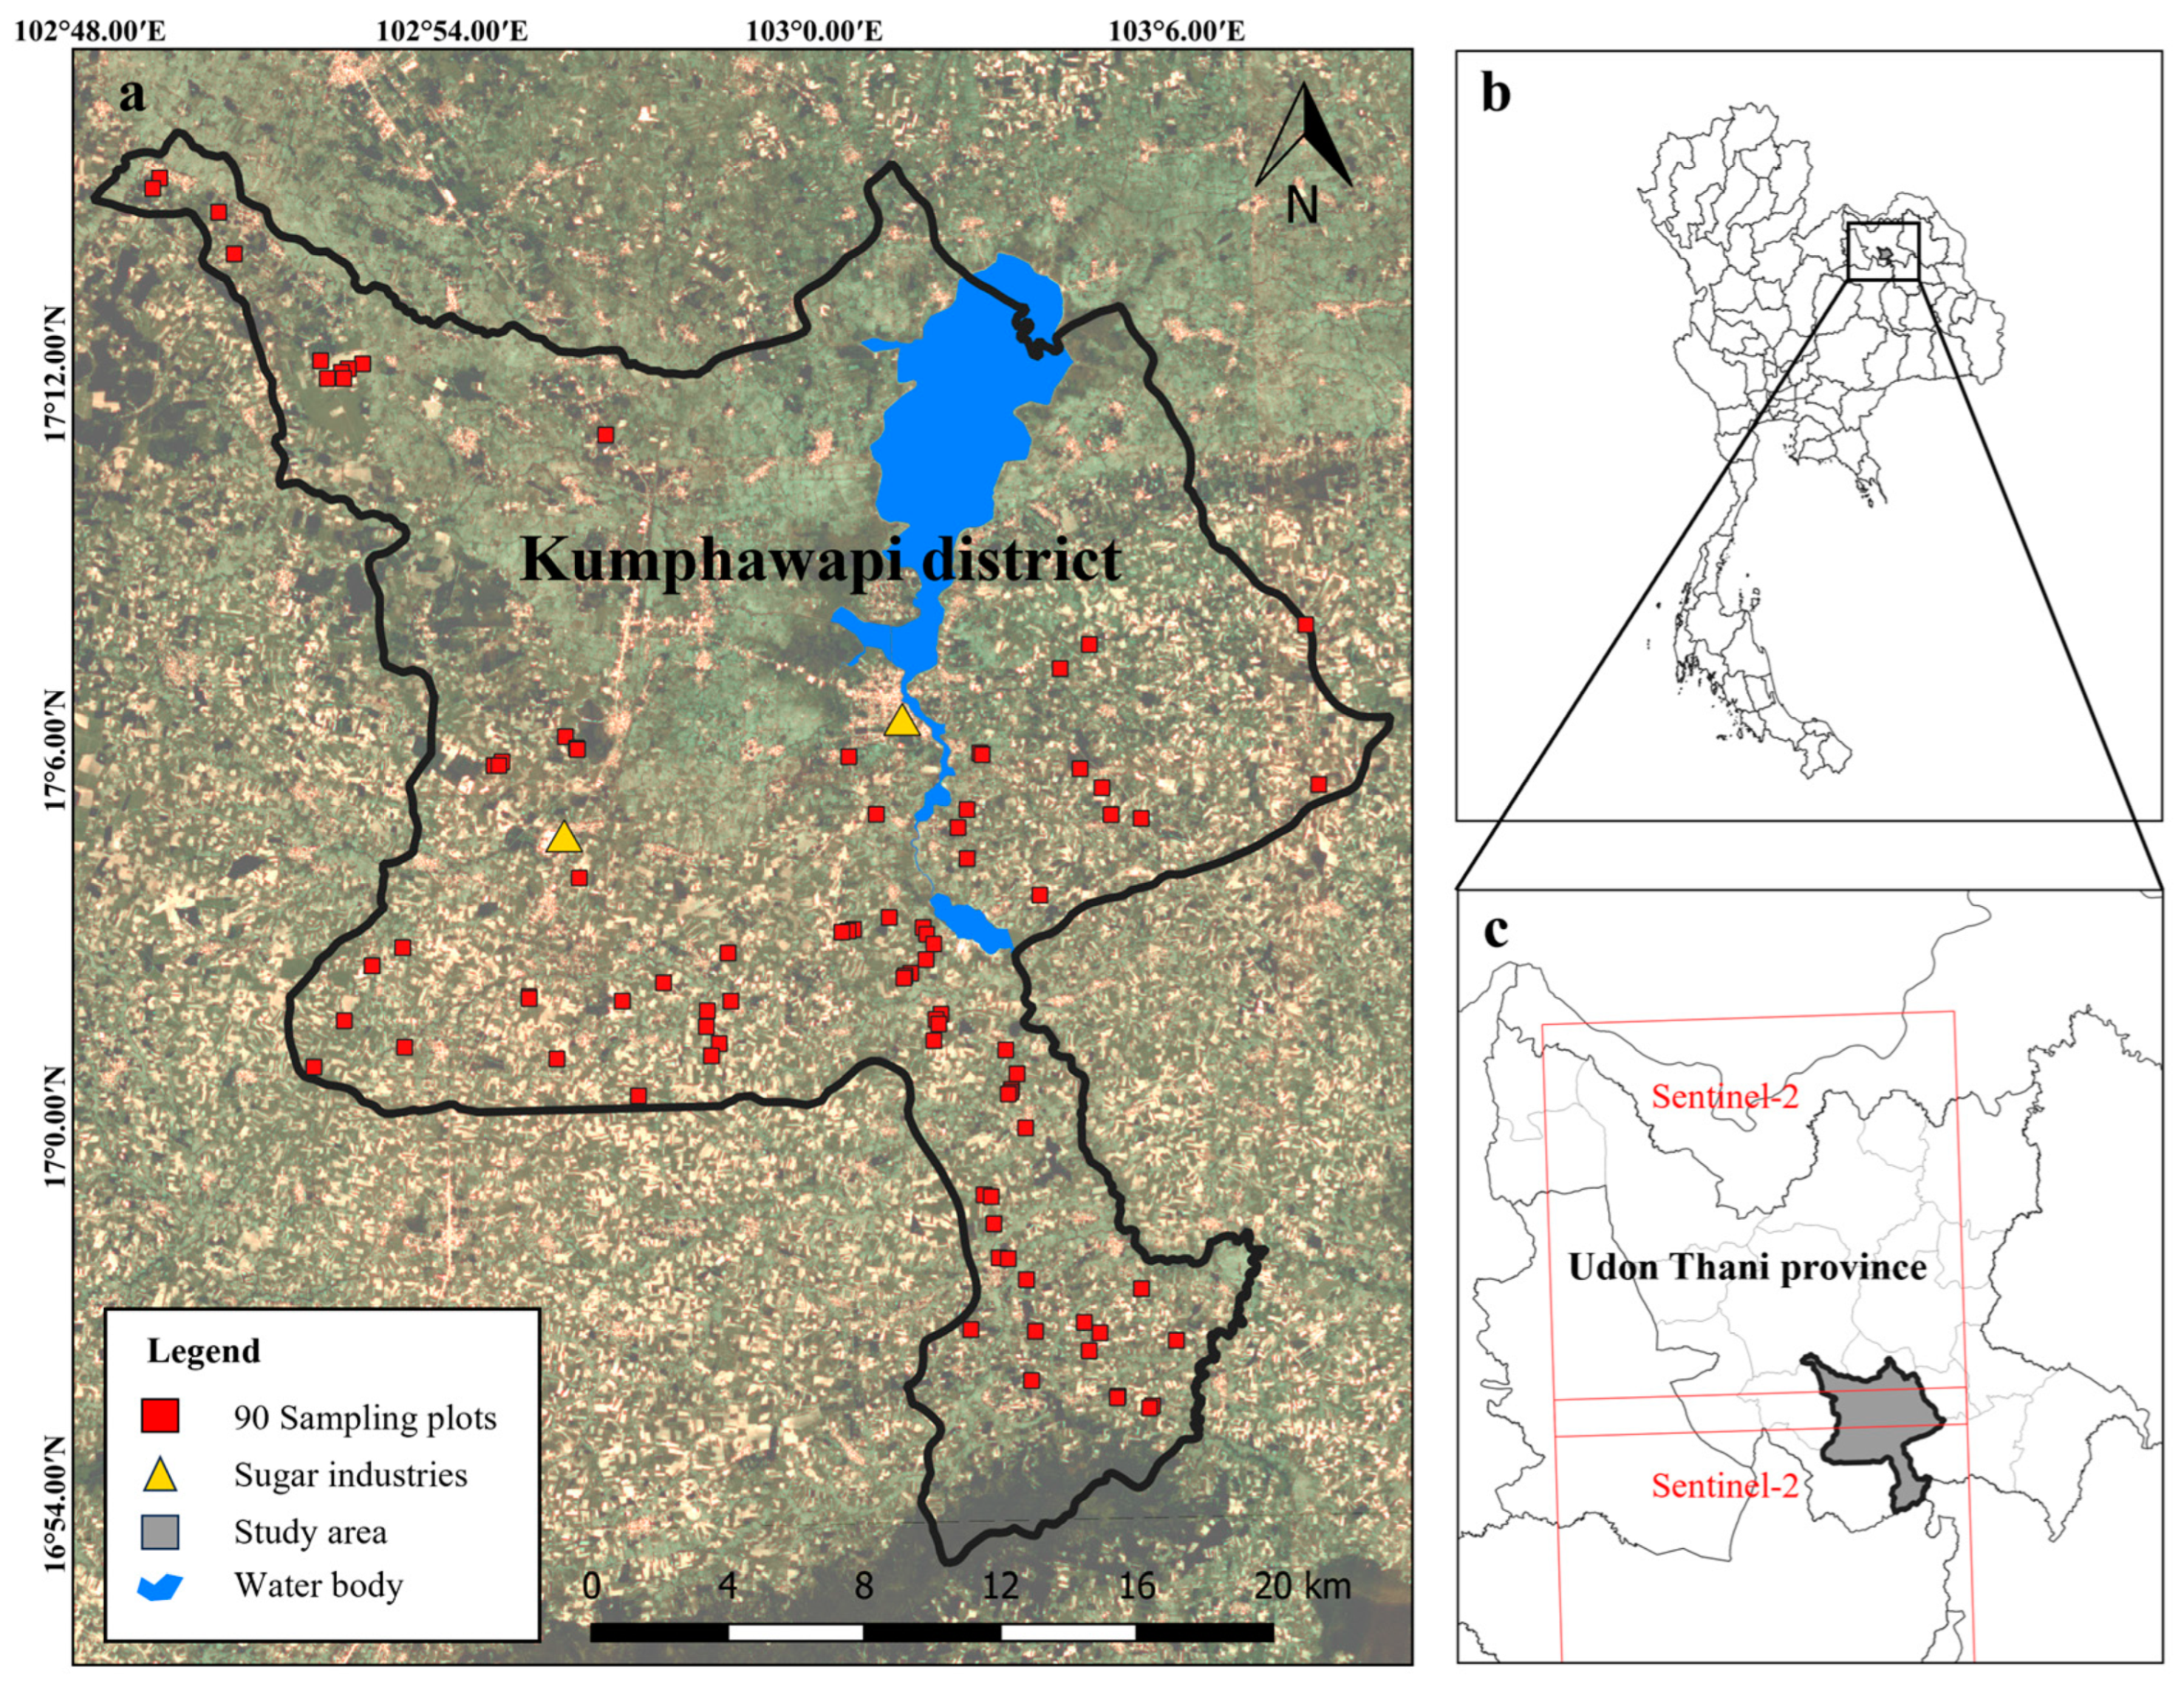
The proposed methodology is aimed at estimating sugarcane AGB and carbon stock using Copernicus Sentinel 1 and 2 data based on machine learning algorithms. Specifically, the main steps require: (i) S1 and S2 time series preprocessing; (ii) predictive models’ application to estimate sugarcane AGB and carbon stock for two based years, namely, 2018 and 2021; (iii) transferability of the prediction models for large-scale mapping within the Udon Thani province. The adopted workflow is reported in Figure 1.

2.1. Study Area

Kumphawapi district, located within Udon Thani province, Thailand (from 16°50′00″ to 17°15′00″N; 102°48′00″ to 103°10′00″E), was identified as the area of interest (AOI) in this work (Figure 2). The AOI is characterized by highlands with rolling plains; the surface elevation ranges from 160 to 310 m a.s.l. and covers a total area of 166,148.61 ha. In this area, the primary water source for agricultural activities is the Nong Han Lake. The climate in this area is categorized as tropical semi-humid wet/dry savanna (Köppen climate classification: Aw), with three distinct seasons: (i) summer (mid-February to mid-May), (ii) rainy (mid-May to mid-October), (iii) winter (mid-October to mid-February). The mean temperature in the region is 27 °C, and the average annual rainfall amounts to 1400 mm. Several crops are cultivated in the Kumphawapi district, including rice, sugarcane, cassava, and para rubber. However, crucial geographical factors such as climate, soil, water sources, and sunlight make AOI highly suitable for sugarcane cultivation [44]. Specifically, sugarcane-cultivated areas increased notably over time in the last year. Such behavior can be mainly attributed to government policies promoting sugarcane cultivation and the rising demand driven by the presence of two sugarcane mills in the region [45].

2.2. Field Data Collection

According to AOI climatic conditions and agronomic practices, sugarcane primarily occurs during the dry season (from January to March) and the rainy season (from September to November). The harvesting period typically takes place from mid-December to March, aligning with the local sugarcane growth cycle [29]. Moreover, within AOI, the arrangement of sugarcane fields involves an inter-row spacing ranging from 0.2 to 0.4 m, while the row spacing typically falls within the range from 1.2 to 1.5 m.
Between 1st November and 15th December in 2018 and 2021, a total of 90 sample plots, 20 m2 in size, were collected in order to estimate sugarcane AGB and carbon stock. Specifically, the field data collection focused on Khonkaen-3 (KK3), the most commonly cultivated sugarcane variety within AOI due to its suitability and good characteristics in the region [46]. For each plot, the following attributes were acquired at plot level: (i) five coordinates (X, Y) (i.e., each corner and center plot); (ii) average height; (iii) total stalk count; (iv) average diameter. The selection of the 90 sample plots was randomized to ensure a representative sample and a comprehensive coverage of sugarcane plots within the AOI (Figure 2). The geographical coordinates of each plot were acquired through the UniStrong G10 global navigation satellite system (GNSS) receiver, manufactured by the Beijing UniStrong Science & Technology company [47].

2.3. Sugarcane Field Database

This study obtained sugarcane field maps for the years 2018 and 2021, which were provided by the Office of The Cane and Sugar Board [14]. In 2018, there were 41,673 sugarcane fields, and, in 2021, there were 38,524 fields spanning the entire Udon Thani province (Figure 3). We appreciate the provision of this database for our analysis. Subsequently, the sugarcane field database for both years underwent thorough rechecking using photo interpretation with RGB composites of S2 images (in November 2018 and 2021). The updated sugarcane fields were then utilized to create masks for S1 and S2 data, which were used to map sugarcane AGB and carbon stock in each field for the entire study region.

2.4. Satellite Image

In order to estimate sugarcane AGB and carbon stock for the sugarcane crop, two time series of S1 and S2 image data were used. The first one ranged from October 2017 to December 2018, while the second one ranged from October 2020 to December 2021. The collection period was selected according to the phenological development of the sugarcane crop, which was the highest between October and December [21]. S1 and S2 satellites were involved instead of others (i.e., Landsat and MODIS) due to their technical features (i.e., high temporal, spatial, and geometric resolutions). It is well noted that the AOI is characterized by having smallholder farms. The number of S1 and S2 images selected for 2018 and 2021, respectively, were reported in Table 1.
In this study, we selected all available S1 and S2 data, and the results showed that the number of images in 2021 was less than in 2018.

2.4.1. Sentinel-1 Data

Due to challenging environmental conditions (i.e., cloud, water vapor, fog, and smoke) present in AOI, S1 SAR (synthetic aperture radar) level-1 Ground Range Detected (GRD) images with C-band SAR in the interferometric wide-swath mode were involved [28]. Specifically, a total of 52 and 75 images, having a Ground Sample Distance (GSD) of 10 m2, were downloaded, respectively, for 2018 and 2021 from the Copernicus Open Access Hub. Preprocessing of the S1 data was conducted using the Sentinel Application Platform (v7.0) [48], and a refined Lee speckle filtering algorithm was applied using a moving window that was 7 × 7 in size [35]. Moreover, additional features such as VV/VH and the radar vegetation index (RVI) were computed and involved in sugarcane AGB prediction models [49].

2.4.2. Sentinel-2 Data

The S2 MSI (Multi Spectral Instrument) Level-2A (L2A) data, which underwent atmospheric correction and covered two adjacent tiles within the study area, were collected [50]. A total of 70 and 78 scenes, having a cloud cover of less than 40%, for the years 2018 and 2021, respectively, were acquired. Specifically, the S2 bands involved in this work were (i) B2, B3, B4, and B8; (ii) B5, B6, B7, B8a, B11, and B12, characterized by having a pixel resolution of 10 and 20 m2, respectively.
To enhance the data quality, cloud masking was applied using the Scene Classification (SCL) data [51]. This makes it possible to remove pixels classified as cloud and snow. Subsequently, the six spectral bands characterized by having a 20 m2 pixel size were resampled to 10 m2 using the nearest neighbor method. The choice of this pixel size is particularly suitable for accurately analyzing small crop field sizes, as observed in Thailand [52]. This analysis was carried out using the “raster” package in R version 4.2.2 [53].
Starting from the processed S2 images, several vegetation indices (VIs) were calculated. VIs have been recognized as important features for characterizing crop phenological dynamics, especially for mapping and monitoring sugarcane health and AGB [21,29]. Therefore, VIs involved in this study are the normalized difference vegetation index (NDVI) [54], green normalized difference vegetation index (GNDVI) [55], normalized difference water index (NDWI) [56], enhanced vegetation index (EVI) [57], normalized difference infrared index (NDII) [58], soil-adjusted vegetation index (SAVI) [59], leaf area index (LAI) [60], greenness index (GI) [61], moisture stress index (MSI) [62], ratio vegetation index (RVI) [63], green ratio vegetation index (GRVI) [64], and normalized difference red/green redness index (RI) [65]. These VIs were computed for each S2 image. Further details and specifics about these VIs are reported in Appendix A, as outlined in Table A1.

2.4.3. The Median Compositing Approach

In this study, the median compositing (MC) method was involved to generate spatiotemporally consistent and composite gap-free monthly images. The MC method is a pixel-based operation aimed at selecting the median value from the time series of satellite image data. This method has proven to be highly efficient in generating cloud-free and consistent phenological information across a large region [66,67]. Recent studies have underscored its significant advantage in computational efficiency, especially for monitoring and mapping agricultural cultivation on a large scale with small crop field sizes as in Thailand [24,29]. The MC algorithm was used for all bands and VIs images at a monthly level, covering the period from October to December for the two reference years. The resulting S2 datasets were photo-interpreted to assess the overall quality with high spatial resolution images available on Google Earth Pro. This quality assessment process helped ensure the high quality and accuracy of the generated image composites. Finally, an additional feature was generated (hereafter called NDVImax) and incorporated by selecting the pixel with the highest NDVI value from the NDVI images at a monthly level. This approach is valuable in mitigating and minimizing the effects of adverse atmospheric conditions [68]. By utilizing the maximum NDVI values, this indicator provides a robust representation of vegetation health and growth, enhancing the accuracy and reliability of the analysis, especially when atmospheric conditions may otherwise affect the data’s quality [5].

2.5. Estimated Aboveground Biomass (AGB) and Carbon Stock

In this study, the allometric Equations (1) and (2) developed and proposed by Youkhana et al. [69] to estimate AGB and carbon stock across the complete sugarcane fields were applied. The allometric equations provided a reliable relationship between the total volumes and sugarcane AGB for each sampling plot. This makes it possible to accurately map AGB and carbon stock for the entire sugarcane fields based on the observed data and the established relationships. This study used the equations shown below.
A G B = 16.08 ( H V I ) 0.73
B i = A G B × S D
where AGB is sugarcane aboveground biomass (unit: t); HVI is sugarcane plant height (cm); 16.08 is the constant of modeling of the relationship between biomass weight and plant height; SD is sugarcane stalk density in each plot; Bi is sugarcane AGB per pixel (unit: t/ha).
Subsequently, in order to estimate AGB and carbon stock, two different machine learning methods were built. In particular, the RFR and SVR were considered. In order to train the algorithms and validate the results starting from the 90 sampled plots, training and validation sets were generated. In particular, 70% of the plots were considered for the training dataset (63 plots) and 30% (27 plots) for the independent validation set. The RFR and SVR predictive models were developed using R version 4.2.2.
It is worth highlighting that, due to the anomaly year with drought occurrences in 2018, this study did not combine the training datasets from 2018 and 2021 to avoid overfitting and noise within the RFR and SVR models. Furthermore, sugarcane crop growth for both base years is different in the greenness of the leaf, leading to the variability of spectral signatures per field for different periods.

2.5.1. Feature Selection

To enhance the model’s performance in estimating sugarcane AGB, an extensive analysis of more than 250 features was conducted for each year. Numbers of the predictors’ features involved in each year are reported in Table 2.
This analysis encompassed all band information and derived vegetation indices (VIs) measured in this study, serving as predictor variables for the models. The feature selection process involved utilizing the recursive feature elimination procedure algorithm, specifically focusing on the “Increase of Mean Squared Error” (%IncMSE) from the random forest (RF) model. This approach has been employed in previous studies and proves effective in selecting important features by reducing the number of features while retaining their relevance and significance as input variables for the predictive model [70].
The “random forest” package in R was employed to implement the important feature selection, aiding in the identification and prioritization of features crucial for accurate AGB estimation in the sugarcane fields. This rigorous feature selection process was essential in optimizing the model’s performance and refining the input variables to enhance predictive accuracy.
The output of the top 20 important features for mapping sugarcane AGB and carbon stock in 2018 and 2021 has been provided in detail in Appendix A and Table A2. Moreover, the corresponding derived features obtained by combining time series of S1 and S2 data were used in this study for the optimized RFR and SRV predictive models for mapping sugarcane AGB across the study region (detailed in Table A2).

2.5.2. Random Forest Regression (RFR)

As mentioned in the previous paragraph, the RFR method was involved in estimating sugarcane AGB. The RFR is an ensemble of multiple non-linear regression trees that can reduce predictive model overfitting [71]. The executed bootstrapping with replacement randomly chooses several training datasets, indicating individual decision trees (DTs) that are later aggregated from the majority vote. In order to generate RFR results, two parameters have to be set: (i) the number of trees (ntrees); (ii) the number of features to randomly spilt in each node (mtry) [71]. The RFR predictor model in this study was analyzed using the “random forest” package [72]. Subsequently, to discover the optimal parameters for optimizing the predictor model, the “Grid Search” function, produced by Bergstra and Bengio [73], was employed. The “Grid Search” involves an exhaustive search over specified hyperparameter values to identify the best combination for the model. In this study, we tried turning the parameters of the RFR models of ntrees from 100 up to 1500 (at step of 50), with mtry from 2 to 10 with an interval of 1. As a result, 500 trees and 8 mtry were determined to be the most effective hyperparameters. These settings were consistently applied across all models.
The RFR models were constructed using the training dataset, utilizing the optimized features as input variables. Subsequently, the best RFR predictor model for each respective year was utilized to accurately map sugarcane AGB across the entire study area, ensuring the robustness and accuracy of the predictive models.

2.5.3. Support Vector Regression (SVR)

The second predictor involved in this work was SVR. SVR regression is a kernel-based machine learning proposed by Cortes and Vapnik [74] and Vapnik [75]. The SVR method normally requires a kernel function to transform training datasets into a highly dimensional feature space for identifying the optimal hyperplane that increases the distance between the hyperplane and the nearest positive and negative reference dataset [74]. For this work, a radial basis function (RBF) was used. Moreover, to optimize the SVR model, a “Grid Search” process similar to the one used for tuning the RFR was implemented using the “e1071” package in R. This process involved systematically exploring various combinations of cost (c) and gamma values to identify the best aggregation for the SVR model. The values of c were experimented from −1 to 6 (at step of 1), while several gamma values were measured from 0.5 to 6 (an interval of 2). In this analysis, the optimized c and gamma values were set equal to 1 and 0.1, respectively.
The results of the root mean square error (RMSE) and coefficient of determination (R2) with repeated cross-validation were employed to evaluate the performance of the RFR and SVR predictive models for all three based years. Those models were used to classify the selected S1 and S2 datasets and validate map results from the independent dataset.

2.5.4. Accuracy Evaluation

The performance of the optimal predictor models obtained through RFR and SVR was rigorously evaluated using two key methodologies: (i) 10-fold cross-validation and (ii) an independent validating dataset based on RMSE and the R2 (Equations (3) and (4), respectively). The constructed models and results with the highest R2 and lowest RMSE values are highly efficient estimation accuracy.
R M S E = i = 1 N x i x ^ i 2 n
R 2 = i = 1 n x ^ i x ¯ i 2 i = 1 n x i x ¯ i 2
where x i represents observations for training datasets, x ^ i is the estimated yield, x ¯ i is the mean value of observations, and n is the number of samples or the number of observations.

2.5.5. Calculation of Aboveground Carbon Stock

The AGB map results obtained for the two reference years, 2018 and 2021, were utilized to derive the corresponding aboveground carbon stock. This calculation involved multiplying the biomass values by a conversion factor of 0.47, as proposed by Eggleston et al. [76]. The factor of 0.47 is a commonly adopted standard value for converting biomass into carbon stock within vegetation.

2.5.6. Model Transferability

The predictive model optimized for the Kumphawapi district was leveraged to perform upscaling and map the sugarcane AGB and carbon stock of the entire Udon Thani province. To achieve this, the sugarcane field database for the years 2018 and 2021, sourced from OCSB, was utilized. The sugarcane map from the OCSB served as a fundamental dataset for generating maps of sugarcane AGB and carbon stock (see more details in Section 2.3). This mapping process involved integrating the sugarcane field database with a time series of S1 and S2 datasets, using the best predictive model obtained through optimization. This approach facilitated the extension of the study’s findings and models from the district level to a larger geographic scale, enabling insights into AGB and carbon stock on a provincial level.

3. Results

3.1. Aboveground Biomass Estimation

In this study, the optimized models were effectively employed to map sugarcane AGB across the study region. The importance of various features utilized in these models is detailed in Appendix A, Table A2. Furthermore, a summary of the model performance based on R2 and RMSE values, derived from both 10-fold cross-validation and an independent validating dataset, is presented in Table 3.
According to Table 3, comparing the RFR predictor model in 2021 to the other models, it can be highlighted that it achieved high accuracy and efficiency (i.e., R2 and RMSE equal to 0.86 and 9.61 respectively). For all models, the result values were slightly different between model accuracy and map validation, and the overall effectiveness and reliability of the RFR model, especially for the year 2021, were evident.
The estimated biomass results based on 27 sampling plots for two years (2018 and 2021) using the RFR and SVR are reported in Figure 4.
Considering Figure 4a,d, it can be noted that the RFR models for the years 2018 and 2021 obtained RMSE values equal to 8.84 t/ha and 12.86 t/ha, respectively. Meanwhile, R2 values equal to 0.73 and 0.86 were obtained for the 2018 and 2021 years, respectively. As expected, the RFR models for the two based years, 2018 and 2021, yielded the highest effectiveness for sugarcane AGB estimation. Notably, the RFR 2021 model showcased exceptional accuracy, outperforming all other models. This superior accuracy was attributed to the utilization of ground truth data and a dense time series of image data during November each year in constructing the model. While the SVR results demonstrated good accuracy, there is potential for further improvement by increasing the dimensionality of feature spaces and/or incorporating more extensive reference data. This suggests opportunities for enhancing the SVR model’s predictive performance to accurately map AGB.
The four models (i.e., RFR and SVR) for the two reference years were applied to predict and map the intra-field AGB sugarcane within the AOI (Figure 5).
Considering Figure 5a,b it can be highlighted that the estimated AGB from the RFR predictive models are smooth and well distributed. Conversely, the two SVR models, reported in Figure 5c,d exhibited inconsistent results when compared to the best map results from the RFR predictive models and field measurements. This suggests that the RFR models were particularly effective in capturing and representing the variability of sugarcane AGB, resulting in more consistent and reliable predictions compared to the SVR models.

3.2. Aboveground Carbon Stock Estimation

The derived sugarcane AGB maps based on the best RFR predictive model were used to map aboveground carbon stock (as seen in the detailed information in Section 2.5) (Figure 6).
Considering Figure 6a,b, it can be noted that carbon stock spatial distribution exhibited significant heterogeneity. In particular, the range value was between 18.80 and 72.85 t/ha. In 2018, the mapped result revealed an average value of 33.03 t/ha, with a standard deviation (SD) of 11.78 t/ha. Additionally, for the year 2021, the average carbon stock was found to be 43.38 t/ha, with an SD of 16.32 t/ha. The mapped result in 2018 had a lower carbon stock value than in 2021 due to droughts that occurred in this region.
This result is probably due to the starting carbon stock field variability. It is worth noting that these levels of carbon stock density can be attributed to sugarcane growth and yield [21,25,46]. Moreover, in Figure 6a, which considers the 2018 year, the highest carbon stock densities were predominantly distributed in the north and southwest parts of the AOI. Conversely, in Figure 6b, which considers the 2021 year, high carbon stock densities were evident in the northern and southern parts. These carbon stock map results could provide valuable insights for stakeholders and crop cultivation management. Notably, the patterns of the spatial distribution observed in the carbon stock maps were similar to those seen in the AGB maps, reinforcing the consistency and reliability of the findings.

3.3. Mapping Large-Scale Sugarcane Aboveground Biomass and Carbon Stock

The derived AGB maps over a large scale of the Udon Thani province (provincial scale) were generated by the transferability of the optimized feature RFR models for each based year, the results of which are shown in Figure 7.
Considering Figure 7a,b, it can be highlighted that the AGB range is between 40 and 150 t/ha. However, some differences can be observed between the year 2018 and the year 2021. Specifically, in the year 2018, as shown in the frequency histogram in Figure 7a, most of the lower estimated biomass results are characterized by having a value less than 45 t/ha. However, values above 90 t/ha appear to be very low. On the contrary, in 2021, as presented in Figure 7b, biomass values are more homogeneously distributed, with values ranging between 0 and 150 t/ha and with a slight peak for values below 40 t/ha.
In addition to some temporal differences, within the same year, it is possible to highlight spatial differences; in fact, notable concentrations of high AGB and carbon densities were highlighted in the southern and northern parts of the region, and these were correlated with different sugarcane AGB densities. The high accuracy of the derived map results provides crucial information, empowering stakeholders with insights necessary for informed decision-making, efficient resource allocation, and strategic planning, ultimately contributing to effective crop management and agricultural productivity.
The disparities in sugarcane AGB densities between 2018 and 2021 can be attributed to extreme drought events in 2018, hindering sugarcane growth. In contrast, the year 2021 experienced ample water availability for cultivation, resulting in a positive impact on increased AGB densities and production. Furthermore, despite the government’s supportive policy, including higher sugarcane prices for this year, cultivation prices (i.e., oil, labor, and fertilizer) have been increased.
Moreover, considering Figure 7, a similar spatial distribution of AGB values when compared to the AGB map (see Figure 5a,b) can be highlighted. This can be related to the optimized RFR models in this study and seems like our RFR models for both based years can be used for mapping sugarcane AGB for other regions as well as on a national scale.
The spatial distribution of carbon stock within the Udon Thani province for the years 2018 and 2021 is reported in Figure 8. In particular, sugarcane carbon stock value ranged between 18 t/ha and 72 t/ha. In the year 2018, the mapped result indicated an average value of 21.07 t/ha with an SD value of 5.65 t/ha. In contrast, for the year 2021, the average value increased to 26.69 t/ha, with an SD of 7.62 t/ha. In 2018, the highest carbon stock densities were observed in the northeast, while the lowest values were demonstrated in the southern part of the region, mirroring the pattern observed in the 2021 map. A comparative analysis reveals that, in 2018, carbon stock densities were lower than those observed in 2021, with similar mapped results observed across the AOI area.
Comparing the mapped results of carbon stock (details in Figure 6) to the large-scale result maps showed very similar spatial patterns for both based years when compared pixel by pixel for the reference years.
These result maps shed light on the distribution and variations in carbon stock densities across the region for the two years, aiding in understanding the carbon storage patterns and dynamics, which are essential for environmental monitoring and sustainable agricultural practices.

4. Discussion

4.1. Estimating Aboveground Biomass (AGB) and Carbon Stock

Starting from the RFR and SVR predictive models and using S1 and S2 time series images, it was possible to map AGB and carbon stock values for 2018 and 2021. Generally, an estimation of sugarcane AGB for all models was applied and achieved highly accurate results (R2 ≥ 0.75 and RMSE < 14 t/ha). However, the RFR predictive models for both based years show higher accuracies than the SVR models. Such a result may be related to the S1 and S2 dense time series data during November for each year [21]. According to a recent study, the RFR predictive model generally requires a high performance for sugarcane AGB estimation, like in a previous study by Wang, Lu, Zhao, Sun, Zhang, and He [18], wherein they highlighted the high accuracies of R2 ≥ 0.70. Furthermore, Shendryk, Davy and Thorburn [37]; Xu et al. [77]; Wang, Zhang, Feng, Du, and Runge [26]; Zhu, Liu, Wang, and Tian [42]; and Fei et al. [78] indicated that the RFR method can be applied for mapping many crop biomasses (i.e., sugarcane, wheat and alfalfa) in different environmental conditions across local and regional scales. To compare the implemented methods with other machine learning techniques, the study by Wang, Lu, Zhao, Sun, Zhang, and He was considered [18]. Specifically, they assessed RFR, SVR, K-nearest neighbor regression (KNN), and deep network regression (DNN) together with light detection and ranging (LiDAR) for monitoring sugarcane AGB at a small field size in Australia, demonstrating high stale performance in mapping AGB in all different periods. On the contrary, Wang, Xiao, Bajgain, Starks, Steiner, Doughty, and Chang [19] estimated the AGB of grazing pastures in two sites in the United States using MLR, SVR, and RFR with multi-temporal S1, S2, and L8 datasets; their results showed the potential of the RFR predictive model with accurate map results. Considering the work performed by Mansaray, Kanu, Yang, Huang, and Wang [17], they evaluated the machine learning models (RFR, SVM, KNN, and Gradient Boosting Decision Tree (GBDT)) together with S2, HJ-1, Gaofen-1, and L8 datasets for monitoring rice in dry biomass at a small area in China; moreover, they highlighted that RFR and GBDT are more appropriate for estimating rice biomass. These results support the outcome provided in this study by using a time series of S1 and S2 datasets to map sugarcane AGB. Moreover, we transferred the highly efficient RFR models to estimate sugarcane AGB across a large region.
Therefore, this study also fully confirmed that RFR demonstrated high potential and more consistency for sugarcane AGB estimation for 2018 and 2021. In contrast, the SVR predictive model requires testing in different geographical regions, different training datasets, and different tuning parameters. It is worth noting that the RMSE and R2 values obtained with an RFR model for sugarcane AGB were lower than 10 t/ha and higher than 0.85 t/ha, respectively. Such results highlight the high efficiency of reference datasets (90 sampling plots). Moreover, the sugarcane AGB showed well-distributed values within the AOI. Such results are in line with studies showing intra-field variability maps over sugarcane fields [18,37,42,70].
Comparing the sugarcane AGB maps confirms that the year 2018 had lower AGB densities (t/ha) than 2021. According to the Office of The Cane and Sugar Board [79], such results can be related to drought occurrence that affected the AOI in 2018. In particular, they report negative effects that led to the development of sugarcane. In addition, our findings illustrated different AGB densities that are strongly related to sugarcane height. The same results were found in previous studies [21,25,46,70]. In particular, starting from remotely sensed data, plant height, and the number of stalks, sugarcane crop biomass has been mapped [18,21,46,70]. Moreover, recent studies [18,70] suggest the use of dense time series image data to monitor sugarcane AGB, especially in inclement regions. This study achieved highly satisfactory maps with excellent efficiency for small crop field sizes (average 1 ha) and cloudy regions and provided valuable information for sustainable agricultural management.
Our study showed the productivity efficiencies of estimating sugarcane carbon stock based on AGB map results. Carbon stock maps for 2018 and 2021 showed intra-field variability and spatial heterogeneity across the study region. A previous study [80] estimated sugarcane carbon stock in different growth stages in the Si Sat Chanalai district, Sukhothai Province, Thailand, using field measurements with three sampling plots and calculating the dry weight of the biomass in order to calculate the carbon stock. Their finding demonstrated the carbon stock for these plots; however, it did not appear in the entire field/region. In this work, we successfully mapped sugarcane carbon stock across the smallholder fields, as well as across the study region.

4.2. Large Scale Mapping

As expected, the RFR predictive models for both years offer great potential to generate large-scale maps. The results highlight the spatial distribution of AGB and carbon stock field variability within the Udon Thani province. The result of AGB and carbon stock maps could be used to guide national or international environmental management, even for Thai government policy on reducing carbon emissions. The resulting spatial AGB maps are also important tools to inform and support the related stockholders for sustainable agricultural development in order to increase productivity and production. Similar to several previous studies [18,23,34,36,81], mapped results are beneficial for both sustainable management and planting management. Therefore, the high accuracy of AGB and carbon stock maps in this study could provide valuable information.

4.3. Uncertainty and Limitations

In this study, we focused on sugarcane AGB and carbon stock mapping by combining S1 and S2 time series data, aiming to achieve efficiency and consistency, especially in small fields and cloudy regions. However, some uncertainties and limitations that should be acknowledged and addressed for future research were identified:
(i)
this analysis did not consider the different phenological stages of the sugarcane crop. A better overview of the phenological dynamics, such as variations in height, stem density, and the diameter of the sugarcane crop at different growth stages, could provide valuable insights into the biomass volume prediction at the field level, as shown in a recent study [18];
(ii)
the number of training and validation samples considered in the analysis is crucial to improve the accuracy of predictive models;
(iii)
other powerful ML/deep learning algorithms can be explored with multiple sensor sources for improving sugarcane AGB and carbon stock estimation across a large region in order to mitigate uncertainties and improve the overall predictive performance of the models.
By addressing these uncertainties and limitations, future studies can refine the mapping of sugarcane AGB and carbon stock, contributing to a more accurate and comprehensive understanding of biomass dynamics in sugarcane fields.

5. Conclusions

Combining Sentinel-1 (S1) and Sentinel-2 (S2) with powerful machine learning (ML) algorithms enables sugarcane aboveground biomass (AGB) and carbon stock mapping within small crop field sizes and cloudy regions in Thailand. Specifically, in this study, AGB and carbon stock map accuracy obtained from random forest regression (RFR) algorithms applied on a time series of S1 and S2 data was obtained. Maps were generated for the years 2018 and 2021. Accurate sugarcane AGB and carbon stock map can offer valuable insights into sustainable agriculture practices and understanding its carbon sequestration.
The main outcome of this work can be summarized as follows:
  • the RFR predictor models in 2018 and 2021 achieved high accuracy and efficiency with R2 > 0.85 and RMSE < 9.61, respectively;
  • high accuracy of the estimated AGB from the RFR models showed the smooth and well-distributed variability of sugarcane AGB within each field;
  • the results of the carbon stock map showed an average value of 33.03 t/ha and 43.38 t/ha for the years 2018 and 2021, providing valuable insights for stakeholders and those involved in crop cultivation management;
  • the generated maps allow one to calculate the distribution and variations of carbon stock densities across the region for the two based years. This capability enhances our ability to monitor changes in carbon stocks over time, contributing to effective climate change mitigation strategies.
However, although the results obtained were satisfactory, some further exploration is needed to refine the research, including (i) taking into account the phenological phases of the crop; (ii) sample size assessment and predictive model accuracy; (iii) the exploration of advanced ML/deep learning algorithms and the integration of multi-sensors. These are further important suggestions that should be produced in future studies.
Finally, it is worth highlighting that the resulting maps can provide important tools to inform and support farmers, industries, and governments for sustainable agricultural practices and land management, as well as for finding solutions for reducing low carbon emissions.

Author Contributions

Conceptualization, S.R.S., F.S. and J.S.-a.; methodology, S.R.S. and J.S.-a.; software, D.P. and J.S.-a.; validation, S.R.S. and J.S.-a.; formal analysis, D.P., S.R.S. and J.S.-a.; writing—original draft preparation, S.R.S., D.P., E.B.-M., F.S. and J.S.-a.; writing—review and editing, S.R.S., D.P., E.B.-M., F.S. and J.S.-a.; visualization, F.S., D.P., S.R.S. and J.S.-a.; supervision, S.R.S. and J.S.-a.; project administration, S.R.S. and J.S.-a.; funding acquisition, S.R.S. and J.S.-a. All authors have read and agreed to the published version of the manuscript.

Funding

The project is funded for personnel by Mahasarakham University.

Data Availability Statement

The data presented in this study are available on request from the corresponding author.

Acknowledgments

This research project was financially supported by Mahasarakham University.

Conflicts of Interest

The authors declare no conflict of interest.

Abbreviations

AGBAboveground Biomass
AOIArea of Interest
S1Sentinel-1
S2Sentinel-2
KK3Khon Kaen 3-Sugarcane Cultivar for the Northeast
EOSatellite-based Earth Observation
GNSSGlobal Navigation Satellite System
SARSynthetic Aperture Radar
MSIMulti Spectral Instrument
VIsVegetation Indices
MCMedian Composite
HVISugarcane Plant Height
SDSugarcane Stalk Density
BiSugarcane AGB Per Pixel
RFRRandom Forest Regression
SVRSupport Vector Regression
MLMachine Learning
R2Coefficient of Determination
RMSERoot Mean Square Error
OCSBOffice of The Cane and Sugar Board

Appendix A

Table A1. The details of the derived vegetation indices (VIs) of Sentinel-2 (S2) data used for estimating sugarcane aboveground biomass (AGB) and carbon stock and formula and references.
IndicesFormulaDefinitionReference
Normalized difference vegetation index (NDVI) NDVI = NIR red NIR + red NDVI = (B8 − B4)/(B8 + B4)[54]
Green normalized difference vegetation index (GNDVI) N I R G R E E N N I R + G R E E N GNDVI = (B8 − B3)/(B8 + B3)[55]
Normalized difference water index (NDWI) G R E E N N I R G R E E N + N I R NDWI = (B3 − B8)/(B3 + B8)[56]
Enhanced vegetation index (EVI) 2.5 N I R R E D N I R + 6 R E D 7.5 B L U E + 1 EVI = 2.5 (B8 − B4)/
(B8 + 6 B4 − 7.5 B2) + 1
[57]
Normalized difference infrared index (NDII) N I R S W I R 1 N I R + S W I R 1 NDII = (B8 − B11)/(B8 + B11)[58]
Soil-adjusted vegetation index (SAVI) N I R R E D N I R + R E D + L   (L+1)SAVI = (B8 − B4)/(B8 + B4 + L) ×
(L + 1), L = 0.5
[59]
Leaf area index (LAI)(3.618 × EVI − 0.118)LAI = (3.618 × EVI − 0.118)[60]
Greenness index (GI) G R E E N R E D GI = B3/B4[61]
Moisture stress index (MSI) S W I R 1 N I R MSI = B11/B8[62]
Ratio vegetation index (RVI) N I R R E D RVI = B8/B4[63]
Green ratio vegetation index (GRVI) N I R G R E E N GRVI = B8/B3[64]
Normalized difference red/green redness index (RI) R E D G R E E N R E D + G R E E N RI = (B4 − B3)/(B4 + B3)[65]
Table A2. Top 20 ranking importance of input features using the random forest regression (RFR) models for the years 2018 and 2021 with a training dataset together with the combined time series of Sentinel-1 (S1) and Sentinel-2 (S2) data.
RFR ModelImportant Feature
2018B08_median_Nov_2018, B8A_median_Nov_2018, NDVI_median_Nov_2018, NDVI_max_Nov_2018, NDVI_median_Oct_2018, GNDVI_median_Nov_2018, GNDVI_median_Oct_2018, B08_median_Nov_2017, NDVI_max_Dec_2017, B08_median_Dec_2017, B05_median_Feb_2018, B12_median_Jan_2018, B04_median_Jan_2018, MSI_median_Nov_2018, GRVI_median_Dec_2017, VV_median_Dec_2017, B06_median_Mar_2018, RI_median_May_2018, LAI_median_May_2018 and VH_median_Jan_2017
2021B08_median_Nov_2021, B8A_median_Nov_2021, NDVI_median_Nov_2021, NDVI_max_Nov_2021, GNDVI_median_Nov_2021, B07_median_Mar_2021, GNDVI_median_Mar_2021, NDII_median_Feb_2021, B08_median_Nov_2021, B8A_median_Nov_2021, NDVI_median_Nov_2021, NDVI_max_Nov_2021, GNDVI_median_Nov_2021, VH_median_Nov_2021, VH_median_Aug_2021, VV_median_Aug_2021, VV_median_Oct _2020, LAI_median_Apr_2021, B07_median_Mar_2021 and GNDVI_median_Mar_2021
Description: meaning of the important feature is Spectral or vegetation indices (VIs) information_Pixel-based compositing method_Monthly_Study year.

References

  1. Abebe, S.; Minale, A.S.; Teketay, D.; Jayaraman, D.; Long, T.T. Biomass, carbon stock and sequestration potential of Oxytenanthera abyssinica forests in Lower Beles River Basin, Northwestern Ethiopia. Carbon Balance Manag. 2021, 16, 29. [Google Scholar] [CrossRef]
  2. Abbas, F.; Hammad, H.M.; Fahad, S.; Cerdà, A.; Rizwan, M.; Farhad, W.; Ehsan, S.; Bakhat, H.F. Agroforestry: A sustainable environmental practice for carbon sequestration under the climate change scenarios—A review. Environ. Sci. Pollut. Res. 2017, 24, 11177–11191. [Google Scholar] [CrossRef]
  3. Whitmore, A.; Kirk, G.; Rawlins, B. Technologies for increasing carbon storage in soil to mitigate climate change. Soil Use Manag. 2015, 31, 62–71. [Google Scholar] [CrossRef]
  4. Kumar, L.; Mutanga, O. Remote sensing of above-ground biomass. Remote Sens. 2017, 9, 935. [Google Scholar] [CrossRef]
  5. Atzberger, C. Advances in remote sensing of agriculture: Context description, existing operational monitoring systems and major information needs. Remote Sens. 2013, 5, 949–981. [Google Scholar] [CrossRef]
  6. Weiss, M.; Jacob, F.; Duveiller, G. Remote sensing for agricultural applications: A meta-review. Remote Sens. Environ. 2020, 236, 111402. [Google Scholar] [CrossRef]
  7. Postma, J.A.; Lynch, J.P. Theoretical evidence for the functional benefit of root cortical aerenchyma in soils with low phosphorus availability. Ann. Bot. 2011, 107, 829–841. [Google Scholar] [CrossRef]
  8. Taub, D. Effects of rising atmospheric concentrations of carbon dioxide on plants. Nat. Educ. Knowl. 2010, 3, 21. [Google Scholar]
  9. Shahid, M.; Nayak, A.K.; Puree, C.; Tripathi, R.; Lal, B.; Gautam, P.; Bhattacharyya, P.; Mohanty, S.; Kumar, A.; Panda, B.B. Carbon and nitrogen fractions and stocks under 41 years of chemical and organic fertilization in a sub-humid tropical rice soil. Soil Tillage Res. 2017, 170, 136–146. [Google Scholar] [CrossRef]
  10. Tenelli, S.; Bordonal, R.O.; Cherubin, M.R.; Cerri, C.E.P.; Carvalho, J.L.N. Multilocation changes in soil carbon stocks from sugarcane straw removal for bioenergy production in Brazil. Glob. Chang. Biol. Bioenergy 2021, 13, 1099–1111. [Google Scholar] [CrossRef]
  11. FAO. Crops and Livestock Products. Available online: https://www.fao.org/faostat/en/?#data/QCL (accessed on 19 December 2022).
  12. Sukyai, P.; Yingkamhaeng, N.; Lam, N.T.; Tangsatianpan, V.; Watcharinrat, C.; Vanitjinda, G.; Vanichsriratana, W.; Sriroth, K. Research and development prospects for sugarcane and sugar industry in Thailand. Sugar Tech 2016, 18, 583–587. [Google Scholar] [CrossRef]
  13. Tukaew, S.; Datta, A.; Shivakoti, G.P.; Jourdain, D. Production practices influenced yield and commercial cane sugar level of contract sugarcane farmers in Thailand. Sugar Tech 2016, 18, 299–308. [Google Scholar] [CrossRef]
  14. Office of the Cane and Sugar Board. The Annual Report in Sugarcane Plantation Areas in Thailand in 2022/2023; Office of the Cane and Sugar Board (OCSB): Bangkok, Thailand, 2023.
  15. Lakapunrat, N.; Thapa, G.B. Policies, socioeconomic, institutional and biophysical factors influencing the change from rice to sugarcane in Nong Bua Lamphu province, Thailand. Environ Manag. 2017, 59, 924–938. [Google Scholar] [CrossRef]
  16. Junpen, A.; Pansuk, J.; Garivait, S. Estimation of reduced air emissions as a result of the implementation of the measure to reduce burned sugarcane in Thailand. Atmosphere 2020, 11, 366. [Google Scholar] [CrossRef]
  17. Mansaray, L.R.; Kanu, A.S.; Yang, L.; Huang, J.; Wang, F. Evaluation of machine learning models for rice dry biomass estimation and mapping using quad-source optical imagery. GIsci Remote Sens. 2020, 57, 785–796. [Google Scholar] [CrossRef]
  18. Wang, Z.; Lu, Y.; Zhao, G.; Sun, C.; Zhang, F.; He, S. Sugarcane biomass prediction with multi-mode remote sensing data using deep archetypal analysis and integrated learning. Remote Sens. 2022, 14, 4944. [Google Scholar] [CrossRef]
  19. Wang, J.; Xiao, X.; Bajgain, R.; Starks, P.; Steiner, J.; Doughty, R.B.; Chang, Q. Estimating leaf area index and aboveground biomass of grazing pastures using Sentinel-1, Sentinel-2 and Landsat images. ISPRS J. Photogramm. Remote Sens. 2019, 154, 189–201. [Google Scholar] [CrossRef]
  20. Li, X.; Wang, X.; Gao, Y.; Wu, J.; Cheng, R.; Ren, D.; Bao, Q.; Yun, T.; Wu, Z.; Xie, G. Comparison of Different Important Predictors and Models for Estimating Large-Scale Biomass of Rubber Plantations in Hainan Island, China. Remote Sens. 2023, 15, 3447. [Google Scholar] [CrossRef]
  21. Som-Ard, J.; Atzberger, C.; Izquierdo-Verdiguier, E.; Vuolo, F.; Immitzer, M. Remote sensing applications in sugarcane cultivation: A review. Remote Sens. 2021, 13, 4040. [Google Scholar] [CrossRef]
  22. Dashpurev, B.; Dorj, M.; Phan, T.N.; Bendix, J.; Lehnert, L.W. Estimating fractional vegetation cover and aboveground biomass for land degradation assessment in eastern Mongolia steppe: Combining ground vegetation data and remote sensing. Int. J. Remote Sens. 2023, 44, 452–468. [Google Scholar] [CrossRef]
  23. Pei, H.; Owari, T.; Tsuyuki, S.; Hiroshima, T. Identifying Spatial Variation of Carbon Stock in a Warm Temperate Forest in Central Japan Using Sentinel-2 and Digital Elevation Model Data. Remote Sens. 2023, 15, 1997. [Google Scholar] [CrossRef]
  24. Meng, X.; Xie, S.; Sun, L.; Liu, L.; Han, Y. Evaluation of temporal compositing algorithms for annual land cover classification using Landsat time series data. Int. J. Digit. Earth 2023, 16, 2574–2598. [Google Scholar] [CrossRef]
  25. Molijn, R.A.; Iannini, L.; Vieira Rocha, J.; Hanssen, R.F. Sugarcane productivity mapping through C-band and L-band SAR and optical satellite imagery. Remote Sens. 2019, 11, 1109. [Google Scholar] [CrossRef]
  26. Wang, Y.; Zhang, Z.; Feng, L.; Du, Q.; Runge, T. Combining multi-source data and machine learning approaches to predict winter wheat yield in the conterminous United States. Remote Sens. 2020, 12, 1232. [Google Scholar] [CrossRef]
  27. Nuthammachot, N.; Askar, A.; Stratoulias, D.; Wicaksono, P. Combined use of Sentinel-1 and Sentinel-2 data for improving above-ground biomass estimation. Geocarto Int. 2022, 37, 366–376. [Google Scholar] [CrossRef]
  28. Torres, R.; Snoeij, P.; Geudtner, D.; Bibby, D.; Davidson, M.; Attema, E.; Potin, P.; Rommen, B.; Floury, N.; Brown, M. GMES Sentinel-1 mission. Remote Sens. Environ. 2012, 120, 9–24. [Google Scholar] [CrossRef]
  29. Som-ard, J.; Immitzer, M.; Vuolo, F.; Ninsawat, S.; Atzberger, C. Mapping of crop types in 1989, 1999, 2009 and 2019 to assess major land cover trends of the Udon Thani Province, Thailand. Comput. Electron. Agric. 2022, 198, 107083. [Google Scholar] [CrossRef]
  30. Borgogno-Mondino, E.; Farbo, A.; Novello, V.; Palma, L.d. A fast regression-based approach to map water status of pomegranate orchards with sentinel 2 data. Horticulturae 2022, 8, 759. [Google Scholar] [CrossRef]
  31. Borgogno-Mondino, E.; Sarvia, F.; Gomarasca, M.A. Supporting insurance strategies in agriculture by remote sensing: A possible approach at regional level. In Proceedings of the Computational Science and Its Applications—ICCSA 2019: 19th International Conference, Saint Petersburg, Russia, 1–4 July 2019; Proceedings, Part IV 19. pp. 186–199. [Google Scholar]
  32. dos Santos Luciano, A.C.; Picoli, M.C.A.; Rocha, J.V.; Franco, H.C.J.; Sanches, G.M.; Leal, M.R.L.V.; Le Maire, G. Generalized space-time classifiers for monitoring sugarcane areas in Brazil. Remote Sens. Environ. 2018, 215, 438–451. [Google Scholar] [CrossRef]
  33. Wang, M.; Liu, Z.; Baig, M.H.A.; Wang, Y.; Li, Y.; Chen, Y. Mapping sugarcane in complex landscapes by integrating multi-temporal Sentinel-2 images and machine learning algorithms. Land Use Policy 2019, 88, 104190. [Google Scholar] [CrossRef]
  34. Li, C.; Zhou, L.; Xu, W. Estimating aboveground biomass using Sentinel-2 MSI data and ensemble algorithms for grassland in the Shengjin Lake Wetland, China. Remote Sens. 2021, 13, 1595. [Google Scholar] [CrossRef]
  35. Veloso, A.; Mermoz, S.; Bouvet, A.; Le Toan, T.; Planells, M.; Dejoux, J.-F.; Ceschia, E. Understanding the temporal behavior of crops using Sentinel-1 and Sentinel-2-like data for agricultural applications. Remote Sens. Environ. 2017, 199, 415–426. [Google Scholar] [CrossRef]
  36. Han, H.; Wan, R.; Li, B. Estimating forest aboveground biomass using Gaofen-1 images, Sentinel-1 images, and machine learning algorithms: A case study of the Dabie Mountain Region, China. Remote Sens. 2021, 14, 176. [Google Scholar] [CrossRef]
  37. Shendryk, Y.; Davy, R.; Thorburn, P. Integrating satellite imagery and environmental data to predict field-level cane and sugar yields in Australia using machine learning. Field Crops Res. 2021, 260, 107984. [Google Scholar] [CrossRef]
  38. Soriano-González, J.; Angelats, E.; Martínez-Eixarch, M.; Alcaraz, C. Monitoring rice crop and yield estimation with Sentinel-2 data. Field Crops Res. 2022, 281, 108507. [Google Scholar] [CrossRef]
  39. Mercier, A.; Betbeder, J.; Baudry, J.; Le Roux, V.; Spicher, F.; Lacoux, J.; Roger, D.; Hubert-Moy, L. Evaluation of Sentinel-1 & 2 time series for predicting wheat and rapeseed phenological stages. ISPRS J. Photogramm. Remote Sens. 2020, 163, 231–256. [Google Scholar]
  40. Xu, C.; Ding, Y.; Zheng, X.; Wang, Y.; Zhang, R.; Zhang, H.; Dai, Z.; Xie, Q. A Comprehensive Comparison of Machine Learning and Feature Selection Methods for Maize Biomass Estimation Using Sentinel-1 SAR, Sentinel-2 Vegetation Indices, and Biophysical Variables. Remote Sens. 2022, 14, 4083. [Google Scholar] [CrossRef]
  41. Ndikumana, E.; Ho Tong Minh, D.; Dang Nguyen, H.T.; Baghdadi, N.; Courault, D.; Hossard, L.; El Moussawi, I. Estimation of rice height and biomass using multitemporal SAR Sentinel-1 for Camargue, Southern France. Remote Sens. 2018, 10, 1394. [Google Scholar] [CrossRef]
  42. Zhu, L.; Liu, X.; Wang, Z.; Tian, L. High-precision sugarcane yield prediction by integrating 10-m Sentinel-1 VOD and Sentinel-2 GRVI indexes. Eur. J. Agron. 2023, 149, 126889. [Google Scholar] [CrossRef]
  43. Uribeetxebarria, A.; Castellón, A.; Aizpurua, A. Optimizing Wheat Yield Prediction Integrating Data from Sentinel-1 and Sentinel-2 with CatBoost Algorithm. Remote Sens. 2023, 15, 1640. [Google Scholar] [CrossRef]
  44. Amatayakul, P.; Thewin, C. Agricultural Meteorology to Know for Udon Thani; Meteorology Department: Bangkok, Thailand, 2014. [Google Scholar]
  45. Kumphawapi District Agricultural Extension Office. Agricultural Information Statistics in Kumphawapi District, Udon Thani Province. Available online: http://kumphawapi.udonthani.doae.go.th/kaset-60.html (accessed on 18 July 2022).
  46. Sumesh, K.; Ninsawat, S.; Som-ard, J. Integration of RGB-based vegetation index, crop surface model and object-based image analysis approach for sugarcane yield estimation using unmanned aerial vehicle. Comput. Electron. Agric. 2021, 180, 105903. [Google Scholar]
  47. UniStrong. Land Survey & LiDAR. Available online: http://en.unistrong.com/ProductShow.asp?ArticleID=340 (accessed on 15 November 2022).
  48. Filipponi, F. Sentinel-1 GRD preprocessing workflow. In Proceedings of the International Electronic Conference on Remote Sensing, Online, 22 May–5 June 2019; p. 11. [Google Scholar]
  49. Mandal, D.; Bhattacharya, A.; Rao, Y.S. Radar Remote Sensing for Crop Biophysical Parameter Estimation; Springer: Berlin/Heidelberg, Germany, 2021. [Google Scholar]
  50. Louis, J.; Debaecker, V.; Pflug, B.; Main-Knorn, M.; Bieniarz, J.; Mueller-Wilm, U.; Cadau, E.; Gascon, F. Sentinel-2 Sen2Cor: L2A processor for users. In Proceedings of the Proceedings Living Planet Symposium 2016, Prague, Czech Republic, 9–13 May 2016; pp. 1–8. [Google Scholar]
  51. Zekoll, V.; Main-Knorn, M.; Alonso, K.; Louis, J.; Frantz, D.; Richter, R.; Pflug, B. Comparison of masking algorithms for sentinel-2 imagery. Remote Sens. 2021, 13, 137. [Google Scholar] [CrossRef]
  52. Som-ard, J. Rice Security Assessment Using Geo-Spatial Analysis. Int. J. Geoinform. 2020, 16, 21–38. [Google Scholar]
  53. Hijmans, R.J.; Van Etten, J.; Cheng, J.; Mattiuzzi, M.; Sumner, M.; Greenberg, J.A.; Lamigueiro, O.P.; Bevan, A.; Racine, E.B.; Shortridge, A. Package ‘raster’. R Package 2015, 734, 473. [Google Scholar]
  54. Rouse, J.W.; Haas, R.H.; Schell, J.A.; Deering, D.W. Monitoring vegetation systems in the Great Plains with ERTS. NASA Spec. Publ. 1974, 351, 309. [Google Scholar]
  55. Gitelson, A.A.; Kaufman, Y.J.; Merzlyak, M.N. Use of a green channel in remote sensing of global vegetation from EOS-MODIS. Remote Sens. Environ. 1996, 58, 289–298. [Google Scholar] [CrossRef]
  56. Serrano, L.; Ustin, S.L.; Roberts, D.A.; Gamon, J.A.; Penuelas, J. Deriving water content of chaparral vegetation from AVIRIS data. Remote Sens. Environ. 2000, 74, 570–581. [Google Scholar] [CrossRef]
  57. Huete, A.; Didan, K.; Miura, T.; Rodriguez, E.P.; Gao, X.; Ferreira, L.G. Overview of the radiometric and biophysical performance of the MODIS vegetation indices. Remote Sens. Environ. 2002, 83, 195–213. [Google Scholar] [CrossRef]
  58. Klemas, V.; Smart, R. The influence of soil salinity, growth form, and leaf moisture on the spectral radiance of Spartina Alterniflora canopies. Photogramm. Eng. Remote Sens 1983, 49, 77–83. [Google Scholar]
  59. Huete, A.R. A soil-adjusted vegetation index (SAVI). Remote Sens. Environ. 1988, 25, 295–309. [Google Scholar] [CrossRef]
  60. Thenkabail, P.S.; Smith, R.B.; De Pauw, E. Hyperspectral vegetation indices and their relationships with agricultural crop characteristics. Remote Sens. Environ. 2000, 71, 158–182. [Google Scholar] [CrossRef]
  61. Le Maire, G.; François, C.; Dufrene, E. Towards universal broad leaf chlorophyll indices using PROSPECT simulated database and hyperspectral reflectance measurements. Remote Sens. Environ. 2004, 89, 1–28. [Google Scholar] [CrossRef]
  62. Vogelmann, J.; Rock, B. Spectral characterization of suspected acid deposition damage in red spruce (Picea Rubens) stands from Vermont. In Proceedings of the Airborne Imaging Spectrometer Data Analysis Workshop, Pasadena, CA, USA, 8–10 April 1985. [Google Scholar]
  63. Kaufman, Y.J.; Tanre, D. Atmospherically resistant vegetation index (ARVI) for EOS-MODIS. IEEE Trans. Geosci. Remote Sens. 1992, 30, 261–270. [Google Scholar] [CrossRef]
  64. Gitelson, A.A.; Kaufman, Y.J.; Stark, R.; Rundquist, D. Novel algorithms for remote estimation of vegetation fraction. Remote Sens. Environ. 2002, 80, 76–87. [Google Scholar] [CrossRef]
  65. Bannari, A.; Morin, D.; Bonn, F.; Huete, A. A review of vegetation indices. Remote Sens. Rev. 1995, 13, 95–120. [Google Scholar] [CrossRef]
  66. Griffiths, P.; van der Linden, S.; Kuemmerle, T.; Hostert, P. A pixel-based Landsat compositing algorithm for large area land cover mapping. IEEE J. Sel. Top. Appl. Earth Obs. Remote Sens. 2013, 6, 2088–2101. [Google Scholar] [CrossRef]
  67. White, J.C.; Wulder, M.; Hobart, G.; Luther, J.; Hermosilla, T.; Griffiths, P.; Coops, N.; Hall, R.; Hostert, P.; Dyk, A. Pixel-based image compositing for large-area dense time series applications and science. Can. J. Remote Sens. 2014, 40, 192–212. [Google Scholar] [CrossRef]
  68. Cihlar, J.; Manak, D.; D’Iorio, M. Evaluation of compositing algorithms for AVHRR data over land. IEEE Trans. Geosci. Remote Sens. 1994, 32, 427–437. [Google Scholar] [CrossRef]
  69. Youkhana, A.H.; Ogoshi, R.M.; Kiniry, J.R.; Meki, M.N.; Nakahata, M.H.; Crow, S.E. Allometric models for predicting aboveground biomass and carbon stock of tropical perennial C4 grasses in Hawaii. Front. Plant Sci. 2017, 8, 650. [Google Scholar] [CrossRef] [PubMed]
  70. Canata, T.F.; Wei, M.C.F.; Maldaner, L.F.; Molin, J.P. Sugarcane yield mapping using high-resolution imagery data and machine learning technique. Remote Sens. 2021, 13, 232. [Google Scholar] [CrossRef]
  71. Breiman, L. Random forests. Mach. Learn. 2001, 45, 5–32. [Google Scholar] [CrossRef]
  72. Liaw, A.; Wiener, M. Classification and regression by randomForest. R News 2002, 2, 18–22. [Google Scholar]
  73. Bergstra, J.; Bengio, Y. Random search for hyper-parameter optimization. J. Mach. Learn. Res. 2012, 13, 281–305. [Google Scholar]
  74. Cortes, C.; Vapnik, V. Support-vector networks. Mach. Learn. 1995, 20, 273–297. [Google Scholar] [CrossRef]
  75. Vapnik, V. The Nature of Statistical Learning Theory; Springer Science & Business Media: Berlin/Heidelberg, Germany, 1999. [Google Scholar]
  76. Eggleston, H.; Buendia, L.; Miwa, K.; Ngara, T.; Tanabe, K. 2006 IPCC Guidelines for National Greenhouse Gas Inventories. 2006. Available online: https://www.ipcc-nggip.iges.or.jp/public/2006gl/ (accessed on 18 July 2022).
  77. Xu, J.-X.; Ma, J.; Tang, Y.-N.; Wu, W.-X.; Shao, J.-H.; Wu, W.-B.; Wei, S.-Y.; Liu, Y.-F.; Wang, Y.-C.; Guo, H.-Q. Estimation of sugarcane yield using a machine learning approach based on uav-lidar data. Remote Sens. 2020, 12, 2823. [Google Scholar] [CrossRef]
  78. Fei, S.; Hassan, M.A.; He, Z.; Chen, Z.; Shu, M.; Wang, J.; Li, C.; Xiao, Y. Assessment of ensemble learning to predict wheat grain yield based on UAV-multispectral reflectance. Remote Sens. 2021, 13, 2338. [Google Scholar] [CrossRef]
  79. Office of the Cane and Sugar Board. Harvested Sugarcane 2017–2018 Report; Office of the Cane and Sugar Board (OCSB): Bangkok, Thailand, 2019.
  80. Watcharapirak, W.; Pattanakiat, S.; Navanugraha, C. The estimation of carbon storages in various growth stages of sugarcane in Si Sat Chanalai district, Sukhothai province, Thailand. Environ. Nat. Resour. J. 2009, 7, 72–81. [Google Scholar]
  81. Li, Z.; Zan, Q.; Yang, Q.; Zhu, D.; Chen, Y.; Yu, S. Remote estimation of mangrove aboveground carbon stock at the species level using a low-cost unmanned aerial vehicle system. Remote Sens. 2019, 11, 1018. [Google Scholar] [CrossRef]
Figure 1. The framework of sugarcane aboveground biomass (AGB) and carbon stock estimation in Thailand using the combined time series of Sentinel-1 (S1) and Sentinel-2 (S2) datasets together with machine learning algorithms.
Remotesensing 16 00750 g001
Figure 2. Study area: background consists of an RGB composite of a Sentinel-2 (S2) image (in November 2021), 90 sampling plots (red rectangle), sugar mills (yellow triangle), and a water body (a); this region is located in Thailand (b); the study region in Udon Thani province is overlaid with two Sentinel-2 tiles (c).
Remotesensing 16 00750 g002
Figure 3. The detailed sugarcane field across the Udon Thani province, Thailand, provided by the Office of The Cane and Sugar Board [14]. The green areas are sugarcane plantations in 2018 (a) and 2021 (b).
Remotesensing 16 00750 g003
Figure 4. The scatter plots of estimated biomass results based on 27 sampling plots using the random forest regression (RFR) and support vector regression (SVR) together with a time series of Sentine-1 (S1) and Sentinel-2 (S2) data: (a,b) are the results for 2018 and 2021 using RFR; (c,d) are the 2018 and 2021 results obtained from the SVR models.
Remotesensing 16 00750 g004
Figure 5. The sugarcane aboveground biomass (AGB) map results obtained using the random forest regression (RFR) and support vector regression (SVR) models together with a time series of Sentine-1 (S1) and Sentinel-2 (S2) datasets: maps (a,b) are the result of years 2018 and 2021 using RFR; maps (c,d) are years 2018 and 2021 using SVR models.
Remotesensing 16 00750 g005
Figure 6. The derived aboveground carbon stock maps in 2018 (a) and 2021 (b) based on the random forest regression (RFR) models were generated using the mapped sugarcane aboveground biomass (AGB) for two years.
Remotesensing 16 00750 g006
Figure 7. Results of aboveground biomass (AGB) in Udon Thani province, Thailand, in 2018 (a) and 2021 (b), generated by the optimized random forest regression (RFR) models and a time series of Sentinel-1(S1) and Sentinel-2 (S2) datasets.
Remotesensing 16 00750 g007
Figure 8. The spatial distribution patterns of sugarcane aboveground carbon stock in Udon Thani province, Thailand, in 2018 (a) and 2021 (b), produced using the aboveground biomass (AGB) maps.
Remotesensing 16 00750 g008
Table 1. Number of Sentinel-1 (S1) and Sentinel-2 (S2) images from October to December for two based years (2018 and 2021) involved in mapping sugarcane aboveground biomass (AGB) and carbon stock. The red and green colors are Sentinel-1 and Sentinel-2 image data, respectively.
Sensor DataMonthly
20172018
OctNovDecJanFebMarAprMayJuneJulAugSepOctNovDec
Sentinel-1 (S1)●●●●●●●●●● ●●●●●●
●●
●●
●●
●●●
●●
●●●
●●
●●●
●●
●●●●
●●●●●●●
●●
Sentinel-2 (S2) 1●●●●●●●●●●●●●●●
●●
●●
●●
●●
●●●●●●●
Sentinel-2 (S2) 2●●●●●●●●●●●●●●●●●●●●
●●
●●
●●
●●●●●●●●
Total7799101281057571295
20202021
Sentinel-1 (S1)●●●●●●●●●●●●●●●●●●●●●●●●●●●●●●●●●●●●●●●●●●●●●●●●●●●●●●
●●●●●●●●●●●●●●●●●
●●
Sentinel-2 (S2) 1●●●●●●
●●
●●
●●
●●
●●
●●
●●
●●
●●
●●●●●●●●● ●●● ●●●●
Sentinel-2 (S2) 2●●●●●●
●●
●●
●●
●●
●●●●●●●●●●●●●●● ●●●●
Total7131617131413995865135
Note: 1 Sentinel-2 (T48QTD); 2 Sentinel-2 (T48QTE).
Table 2. All predictor features of a time series of Sentinel-1 (S1) and Sentinel-2 (S2) data from October to December for two based years (2018 and 2021) for estimating the sugarcane aboveground biomass (AGB) and carbon stock using machine learning algorithms.
Predictor Variable20182021
S1S2S1S2
Feature information (all bands)301003090
Vegetation indices (VIs)3013030117
Total (full feature sets)6023060207
Table 3. R2 and RMSE of the model accuracy and map validation results based on 10-fold cross-validation and independent validating dataset using random forest regression (RFR) and support vector regression (SVR) together with a time series of Sentine-1 (S1) and Sentinel-2 (S2) data.
MethodModel Accuracy (10-Fold Cross-Validation)Map Validation (Validating Dataset)
2018202120182021
R2RMSE (t/ha)R2RMSE (t/ha)R2RMSE (t/ha)R2RMSE (t/ha)
RFR0.8512.350.866.140.858.840.869.61
SVR0.8413.190.768.290.8110.530.7312.86
Disclaimer/Publisher’s Note: The statements, opinions and data contained in all publications are solely those of the individual author(s) and contributor(s) and not of MDPI and/or the editor(s). MDPI and/or the editor(s) disclaim responsibility for any injury to people or property resulting from any ideas, methods, instructions or products referred to in the content.

