
Tracing Magma Migration at Mt. Etna Volcano during 2006–2020, Coupling Remote Sensing of Crater Gas Emissions and Ground Measurement of Soil Gases
 , , ,
, , ,  ,
,  , ,
, ,
Abstract
:1. Introduction
2. Materials and Methods
3. Results
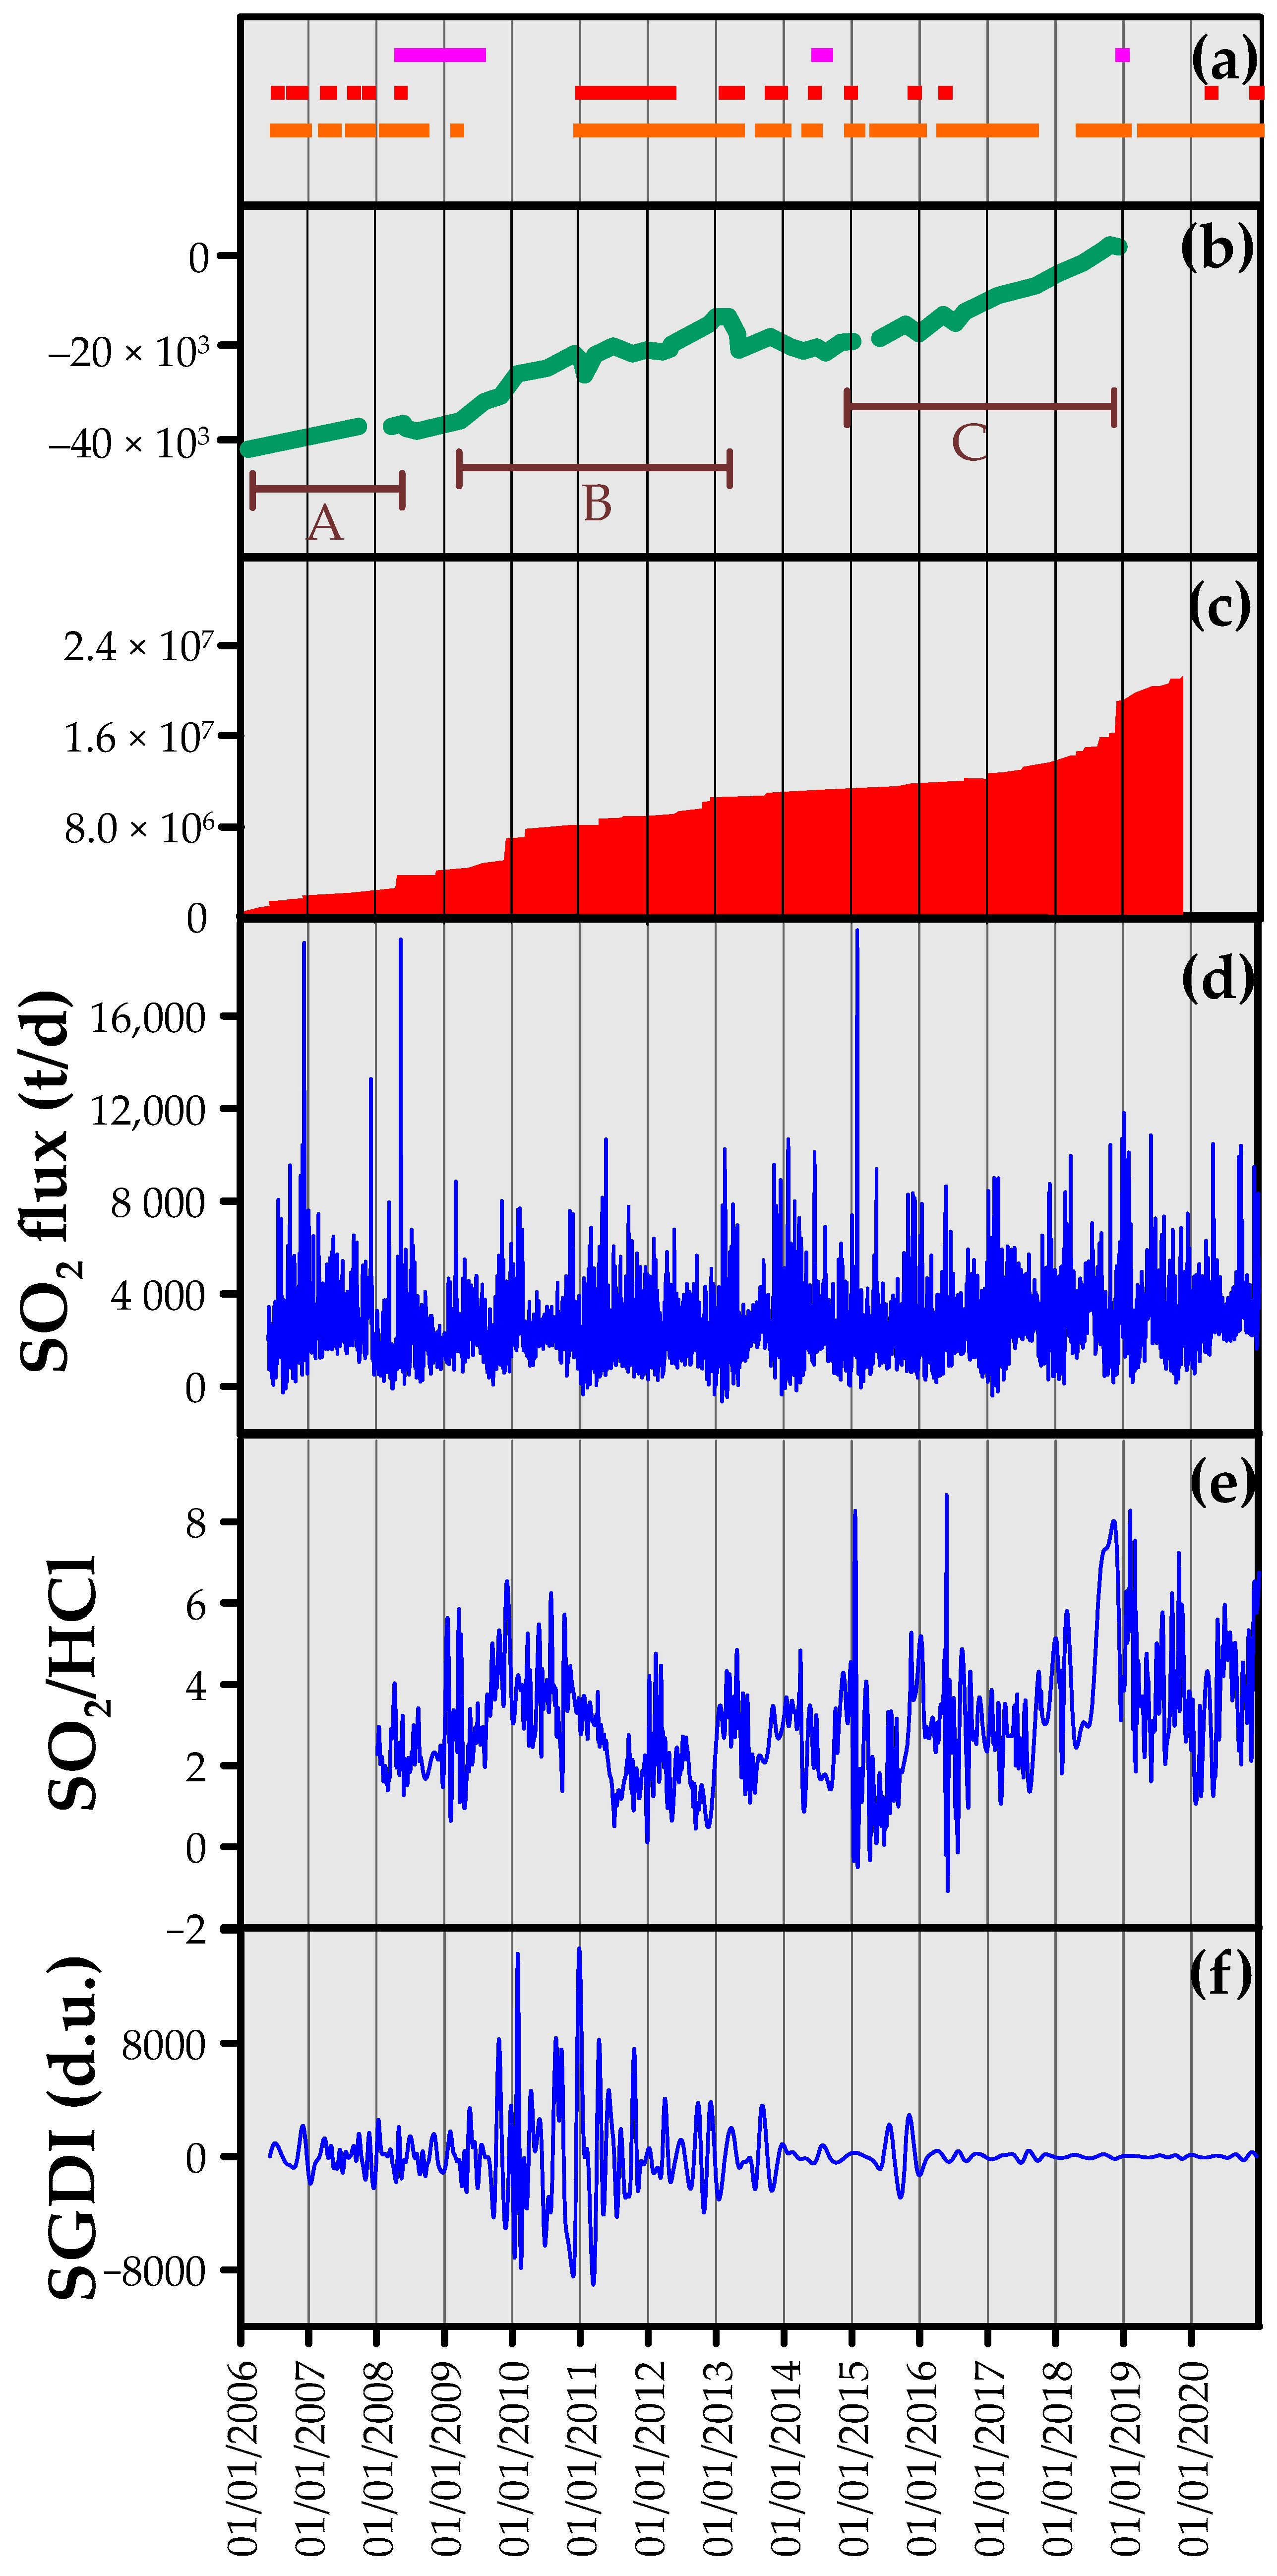
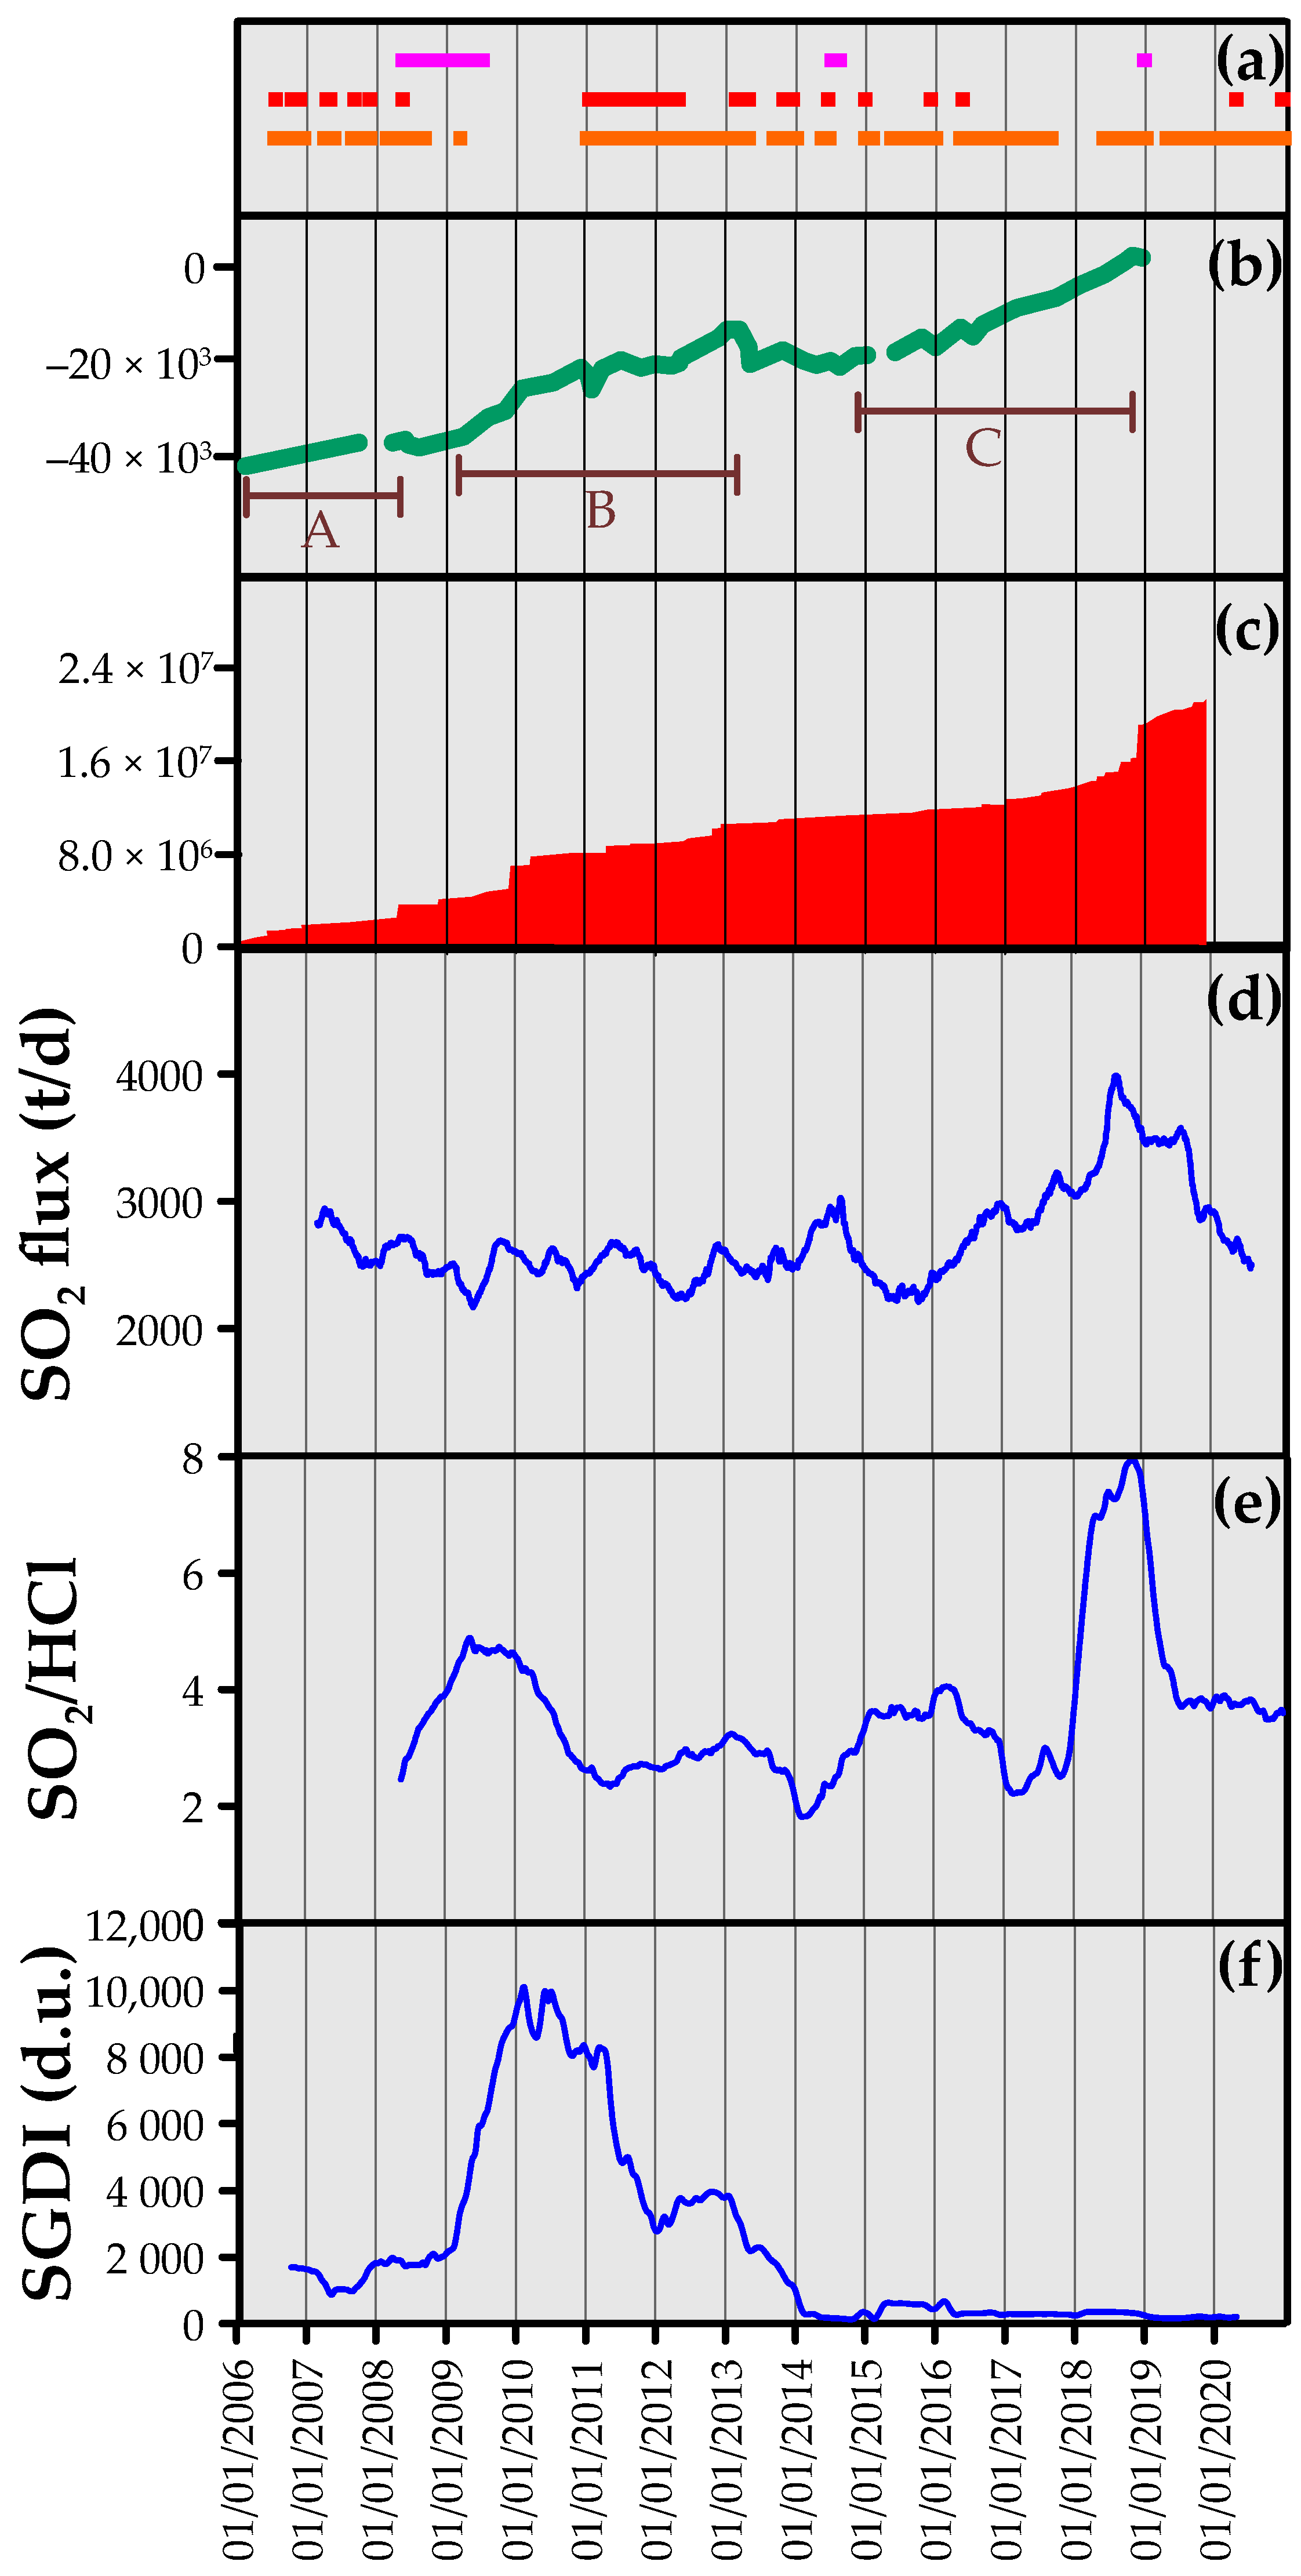
3.1. SO2 Fluxes
3.2. SO2/HCl Ratio
3.3. SGDI Values
4. Discussion
5. Degassing Model
- (a)
- The situation before 2009 is compatible with the emptying of a shallow magma reservoir that was feeding the 2008–2009 flank eruption. Emptying of this reservoir caused the high SO2/HCl and moderate crater SO2 flux with no significant flank degassing because magma was already depleted in the deep gases;
- (b)
- The situation during the period 2009–2014 indicated the formation of a deep (about 4–5 km bsl) magma reservoir that eventually fed the activity of the newborn NSEC. This led to marked flank degassing of deep origin and moderate plume bulk degassing.
- (c)
- The situation from about 2015 to 2020 suggested magma migration to shallow levels (1–2 km bsl) of the volcano plumbing system with sustained crater plume bulk degassing and negligible flank emissions of soil gases. This period culminated with the 2018 flank eruption.

6. Conclusions
Author Contributions
Funding
Data Availability Statement
Acknowledgments
Conflicts of Interest
References
- Fischer, T.P.; Chiodini, G. Volcanic, Magmatic and Hydrothermal Gases. In The Encyclopedia of Volcanoes; Sigurdsson, H., Houghton, B., McNutt, S., Rymer, H., Stix, J., Eds.; Elsevier: London, UK, 2015; pp. 779–797. [Google Scholar]
- Pyle, D.M.; Mather, T.A.; Biggs, J. Remote Sensing of Volcanoes and Volcanic Processes: Integrating Observation and Modelling—Introduction. Geol. Soc. Lond. Spec. Publ. 2013, 380, 1–13. [Google Scholar] [CrossRef]
- Edmonds, M. New Geochemical Insights into Volcanic Degassing. Philos. Trans. R. Soc. Math. Phys. Eng. Sci. 2008, 366, 4559–4579. [Google Scholar] [CrossRef] [PubMed]
- Burton, M.; Allard, P.; Muré, F.; La Spina, A. Magmatic Gas Composition Reveals the Source Depth of Slug-Driven Strombolian Explosive Activity. Science 2007, 317, 227–230. [Google Scholar] [CrossRef] [PubMed]
- Oppenheimer, C. Volcanic Degassing. In Treatise on Geochemistry; Elsevier: Amsterdam, The Netherlands, 2003; pp. 123–166. [Google Scholar]
- Moretti, R.; Métrich, N.; Arienzo, I.; Di Renzo, V.; Aiuppa, A.; Allard, P. Degassing vs. Eruptive Styles at Mt. Etna Volcano (Sicily, Italy). Part I: Volatile Stocking, Gas Fluxing, and the Shift from Low-Energy to Highly Explosive Basaltic Eruptions. Chem. Geol. 2018, 482, 1–17. [Google Scholar] [CrossRef]
- Spilliaert, N.; Métrich, N.; Allard, P. S–Cl–F Degassing Pattern of Water-Rich Alkali Basalt: Modelling and Relationship with Eruption Styles on Mount Etna Volcano. Earth Planet. Sci. Lett. 2006, 248, 772–786. [Google Scholar] [CrossRef]
- Delmelle, P.; Stix, J. Volcanic Gases. Encycl. Volcanoes 2011, 63, 803–815. [Google Scholar]
- Stolper, E.; Holloway, J.R. Experimental Determination of the Solubility of Carbon Dioxide in Molten Basalt at Low Pressure. Earth Planet. Sci. Lett. 1988, 87, 397–408. [Google Scholar] [CrossRef]
- Pan, V.; Holloway, J.R.; Hervig, R.L. The Pressure and Temperature Dependence of Carbon Dioxide Solubility in Tholeiitic Basalt Melts. Geochim. Cosmochim. Acta 1991, 55, 1587–1595. [Google Scholar] [CrossRef]
- Clocchiatti, R.; Weisz, J.; Mosbah, M.; Tanguy, J.C. Coexistence de “Verres” Alcalins et Tholéiitiques Saturés En CO2 Dans Les Olivines Des Hyaloclastites d’Aci Castello (Etna, Sicile, Italie). Arguments En Faveur d’un Manteau Anormal et d’un Réservoir Profond. Acta Vulcanol. 1992, 2, 161–173. [Google Scholar]
- Carroll, M.R.; Webster, J.D. Solubilities of Sulfur, Noble Gases, Nitrogen, Chlorine and Fluorine in Magmas. In Volatiles in Magmas; Carroll, M.R., Holloway, J.R., Eds.; De Gruyter: Berlin, Germany, 2018; pp. 231–280. ISBN 978-1-5015-0967-4. [Google Scholar]
- Metrich, N.; Clocchiatti, R.; Mosbah, M.; Chaussidon, M. The 1989–1990 Activity of Etna Magma Mingling and Ascent of H2O-Cl-S-rich Basaltic Magma. Evidence from Melt Inclusions. J. Volcanol. Geotherm. Res. 1993, 59, 131–144. [Google Scholar] [CrossRef]
- Métrich, N.; Allard, P.; Spilliaert, N.; Andronico, D.; Burton, M. 2001 Flank Eruption of the Alkali- and Volatile-Rich Primitive Basalt Responsible for Mount Etna’s Evolution in the Last Three Decades. Earth Planet. Sci. Lett. 2004, 228, 1–17. [Google Scholar] [CrossRef]
- Holloway, J.R.; Blank, J.G. Application of Experimental Results to C-O-H Species in Natural Melts. In Volatiles in Magmas; Carroll, M.R., Holloway, J.R., Eds.; De Gruyter: Berlin, Germany; Boston, MA, USA, 2018; Volume 30. [Google Scholar]
- Lesne, P.; Kohn, S.C.; Blundy, J.; Witham, F.; Botcharnikov, R.E.; Behrens, H. Experimental Simulation of Closed-System Degassing in the System Basalt-H2O-CO2-S-Cl. J. Petrol. 2011, 52, 1737–1762. [Google Scholar] [CrossRef]
- La Spina, A.; Burton, M.; Salerno, G.; Caltabiano, T. Insights into Magma Dynamics at Etna (Sicily) from SO2 and HCl Fluxes during the 2008–2009 Eruption. Geology 2023, 51, 419–423. [Google Scholar] [CrossRef]
- Giammanco, S.; Bonfanti, P. Cluster Analysis of Soil CO2 Data from Mt. Etna (Italy) Reveals Volcanic Influences on Temporal and Spatial Patterns of Degassing. Bull. Volcanol. 2009, 71, 201–218. [Google Scholar] [CrossRef]
- Giammanco, S.; Sims, K.W.W. Monitoring Volcanic Activity through Combined Measurements of CO2 Efflux and (222Rn) and (220Rn) in Soil Gas: An Application to Mt. Etna (Italy). In Isotopic Constraints on Earth System Processes; Sims, K., Maher, K., Schrag, D., Eds.; Wiley: Hoboken, NJ, USA, 2022; pp. 167–202. ISBN 978-1-119-59500-7. [Google Scholar]
- Neri, M.; Ferrera, E.; Giammanco, S.; Currenti, G.; Cirrincione, R.; Patanè, G.; Zanon, V. Soil Radon Measurements as a Potential Tracer of Tectonic and Volcanic Activity. Sci. Rep. 2016, 6, 24581. [Google Scholar] [CrossRef]
- Caltabiano, T.; Burton, M.; Giammanco, S.; Allard, P.; Bruno, N.; Murè, F.; Romano, R. Volcanic Gas Emissions from the Summit Craters and Flanks of Mt. Etna, 1987–2000. In Mt. Etna: Volcano Laboratory; Bonaccorso, A., Calvari, S., Coltelli, M., Del Negro, C., Falsaperla, S., Eds.; Geophysical Monograph Series; American Geophysical Union: Washington, DC, USA, 2004; Volume 143, pp. 111–128. [Google Scholar] [CrossRef]
- Giammanco, S.; Neri, M.; Salerno, G.G.; Caltabiano, T.; Burton, M.R.; Longo, V. Evidence for a Recent Change in the Shallow Plumbing System of Mt. Etna (Italy): Gas Geochemistry and Structural Data during 2001–2005. J. Volcanol. Geotherm. Res. 2013, 251, 90–97. [Google Scholar] [CrossRef]
- Behncke, B.; Branca, S.; Corsaro, R.A.; De Beni, E.; Miraglia, L.; Proietti, C. The 2011–2012 Summit Activity of Mount Etna: Birth, Growth and Products of the New SE Crater. J. Volcanol. Geotherm. Res. 2014, 270, 10–21. [Google Scholar] [CrossRef]
- De Beni, E.; Behncke, B.; Branca, S.; Nicolosi, I.; Carluccio, R.; D’Ajello Caracciolo, F.; Chiappini, M. The Continuing Story of Etna’s New Southeast Crater (2012–2014): Evolution and Volume Calculations Based on Field Surveys and Aerophotogrammetry. J. Volcanol. Geotherm. Res. 2015, 303, 175–186. [Google Scholar] [CrossRef]
- Andronico, D.; Cannata, A.; Di Grazia, G.; Ferrari, F. The 1986–2021 Paroxysmal Episodes at the Summit Craters of Mt. Etna: Insights into Volcano Dynamics and Hazard. Earth-Sci. Rev. 2021, 220, 103686. [Google Scholar] [CrossRef]
- Calvari, S.; Salerno, G.G.; Spampinato, L.; Gouhier, M.; La Spina, A.; Pecora, E.; Harris, A.J.L.; Labazuy, P.; Biale, E.; Boschi, E. An Unloading Foam Model to Constrain Etna’s 11–13 January 2011 Lava Fountaining Episode. J. Geophys. Res. Solid Earth 2011, 116, B11207. [Google Scholar] [CrossRef]
- Salerno, G.G.; Burton, M.R.; Oppenheimer, C.; Caltabiano, T.; Randazzo, D.; Bruno, N.; Longo, V. Three-Years of SO2 Flux Measurements of Mt. Etna Using an Automated UV Scanner Array: Comparison with Conventional Traverses and Uncertainties in Flux Retrieval. J. Volcanol. Geotherm. Res. 2009, 183, 76–83. [Google Scholar] [CrossRef]
- Salerno, G.G.; Burton, M.R.; Oppenheimer, C.; Caltabiano, T.; Tsanev, V.I.; Bruno, N. Novel Retrieval of Volcanic SO2 Abundance from Ultraviolet Spectra. J. Volcanol. Geotherm. Res. 2009, 181, 141–153. [Google Scholar] [CrossRef]
- Sellitto, P.; Salerno, G.; La Spina, A.; Caltabiano, T.; Terray, L.; Gauthier, P.J.; Briole, P. A Novel Methodology to Determine Volcanic Aerosols Optical Properties in the UV and NIR and Ångström Parameters Using Sun Photometry. J. Geophys. Res. Atmos. 2017, 122, 9803–9815. [Google Scholar] [CrossRef]
- Francis, P.; Burton, M.R.; Oppenheimer, C. Remote Measurements of Volcanic Gas Compositions by Solar Occultation Spectroscopy. Nature 1998, 396, 567–570. [Google Scholar] [CrossRef]
- Cardellini, C.; Chiodini, G.; Frondini, F. Application of Stochastic Simulation to CO2 Flux from Soil: Mapping and Quantification of Gas Release. J. Geophys. Res. Solid Earth 2003, 108, 3-1–3-13. [Google Scholar] [CrossRef]
- Chiodini, G.; Cioni, R.; Guidi, M.; Raco, B.; Marini, L. Soil CO2 Flux Measurements in Volcanic and Geothermal Areas. Appl. Geochem. 1998, 13, 543–552. [Google Scholar] [CrossRef]
- Klusman, R.W. Comparison of Surface and Near-Surface Geochemical Methods for Detection of Gas Microseepage from Carbon Dioxide Sequestration. Int. J. Greenh. Gas Control 2011, 5, 1369–1392. [Google Scholar] [CrossRef]
- Lane-Smith, D.; Sims, K.W.W. The Effect of CO2 on the Measurement of 220Rn and 222Rn with Instruments Utilising Electrostatic Precipitation. Acta Geophys. 2013, 61, 822–830. [Google Scholar] [CrossRef]
- Aiuppa, A.; Allard, P.; D’Alessandro, W.; Giammanco, S.; Parello, F.; Valenza, M. Magmatic Gas Leakage at Mount Etna (Sicily, Italy): Relationships with the Volcano-Tectonic Structures, the Hydrological Pattern and the Eruptive Activity. In Mt. Etna: Volcano Laboratory; Bonaccorso, A., Calvari, S., Coltelli, M., Del Negro, C., Falsaperla, S., Eds.; Geophysical Monograph Series; American Geophysical Union: Washington, DC, USA, 2004; Volume 143, pp. 129–145. [Google Scholar] [CrossRef]
- Giammanco, S.; Inguaggiato, S.; Valenza, M. Soil and Fumarole Gases of Mount Etna: Geochemistry and Relations with Volcanic Activity. J. Volcanol. Geotherm. Res. 1998, 81, 297–310. [Google Scholar] [CrossRef]
- Johnová, K.; Thinová, L.; Giammanco, S. Revealing the Hidden Faults in the SE Flank of Mt. Etna Using Radon in-Soil Gas Measurement. Radiat. Prot. Dosim. 2014, 160, 70–73. [Google Scholar] [CrossRef]
- Bonaccorso, A.; Aloisi, M. Tracking Magma Storage: New Perspectives From 40 Years (1980–2020) of Ground Deformation Source Modeling on Etna Volcano. Front. Earth Sci. 2021, 9, 638742. [Google Scholar] [CrossRef]
- Firetto Carlino, M.; Scarfì, L.; Cannavò, F.; Barberi, G.; Patanè, D.; Coltelli, M. Frequency-Magnitude Distribution of Earthquakes at Etna Volcano Unravels Critical Stress Changes along Magma Pathways. Commun. Earth Environ. 2022, 3, 68. [Google Scholar] [CrossRef]
- Granieri, D.; Chiodini, G.; Marzocchi, W.; Avino, R. Continuous Monitoring of CO2 Soil Diffuse Degassing at Phlegraean Fields (Italy): Influence of Environmental and Volcanic Parameters. Earth Planet. Sci. Lett. 2003, 212, 167–179. [Google Scholar] [CrossRef]
- Hinkle, M.E. Environmental Conditions Affecting Concentrations of He, CO2, O2 and N2 in Soil Gases. Appl. Geochem. 1994, 9, 53–63. [Google Scholar] [CrossRef]
- King, C.Y. Episodic Radon Changes in Subsurface Soil Gas along Active Faults and Possible Relation to Earthquakes. J. Geophys. Res. 1980, 85, 3065–3078. [Google Scholar] [CrossRef]
- Klusman, R.W.; Jaacks, J.A. Environmental Influences upon Mercury, Radon and Helium Concentrations in Soil Gases at a Site near Denver, Colorado. J. Geochem. Explor. 1987, 27, 259–280. [Google Scholar] [CrossRef]
- Pérez, N.M.; Hernández, P.A.; Padrón, E.; Cartagena, R.; Olmos, R.; Barahona, F.; Melián, G.; Salazar, P.; López, D.L. Anomalous Diffuse CO2 Emission Prior to the January 2002 Short-Term Unrest at San Miguel Volcano, El Salvador, Central America. Pure Appl. Geophys. 2006, 163, 883–896. [Google Scholar] [CrossRef]
- Rogie, J.D.; Kerrick, D.M.; Sorey, M.L.; Chiodini, G.; Galloway, D.L. Dynamics of Carbon Dioxide Emission at Mammoth Mountain, California. Earth Planet. Sci. Lett. 2001, 188, 535–541. [Google Scholar] [CrossRef]
- Salazar, J.M.L.; Pérez, N.M.; Hernández, P.A.; Soriano, T.; Barahona, F.; Olmos, R.; Cartagena, R.; López, D.L.; Lima, R.N.; Melián, G.; et al. Precursory Diffuse Carbon Dioxide Degassing Signature Related to a 5.1 Magnitude Earthquake in El Salvador, Central America. Earth Planet. Sci. Lett. 2002, 205, 81–89. [Google Scholar] [CrossRef]
- Sugisaki, R.; Ido, M.; Takeda, H.; Isobe, Y.; Hayashi, Y.; Nakamura, N.; Satake, H.; Mizutani, Y. Origin of Hydrogen and Carbon Dioxide in Fault Gases and Its Relation to Fault Activity. J. Geol. 1983, 91, 239–258. [Google Scholar] [CrossRef]
- Thomas, D.M.; Cotter, J.M.; Holford, D. Experimental Design for Soil Gas Radon Monitoring. J. Radioanal. Nucl. Chem. 1992, 161, 313–323. [Google Scholar] [CrossRef]
- Barnet, I.; Procházka, J.; Skalský, L. Do the Earth Tides Have an Influence on Short-Term Variations in Radon Concentration? Radiat. Prot. Dosim. 1997, 69, 51–60. [Google Scholar] [CrossRef]
- Cigolini, C.; Poggi, P.; Ripepe, M.; Laiolo, M.; Ciamberlini, C.; Delle Donne, D.; Ulivieri, G.; Coppola, D.; Lacanna, G.; Marchetti, E.; et al. Radon Surveys and Real-Time Monitoring at Stromboli Volcano: Influence of Soil Temperature, Atmospheric Pressure and Tidal Forces on 222Rn Degassing. J. Volcanol. Geotherm. Res. 2009, 184, 381–388. [Google Scholar] [CrossRef]
- Koike, K.; Yoshinaga, T.; Asaue, H. Characterizing Long-Term Radon Concentration Changes in a Geothermal Area for Correlation with Volcanic Earthquakes and Reservoir Temperatures: A Case Study from Mt. Aso, Southwestern Japan. J. Volcanol. Geotherm. Res. 2014, 275, 85–102. [Google Scholar] [CrossRef]
- Kraner, H.; Schroeder, G.; RD, E. Measurements of the Effects of Atmospheric Variables on Radon-222 Flux and Soil Gas Concentrations. In The Natural Radiation Environment; Adams, J.A., Lowder, W.M., Eds.; University of Chicago Press: Chicago, IL, USA, 1964; pp. 191–215. [Google Scholar]
- Schumann, R.R.; Owen, D.E. Relationships between Geology, Equivalent Uranium Concentration, and Radon in Soil Gas; USGS Open File Report 88-18; U.S. Geological Survey: Reston, VA, USA, 1988; pp. 1–28. [CrossRef]
- İçhedef, M.; Giammanco, S.; Neri, M.; Catalano, R.; Immé, G.; Morelli, D.; Muré, F.; Giudice, N. In Soil Radon Anomalies and Volcanic Activity on Mt. Etna (Italy). J. Environ. Radioact. 2020, 218, 106267. [Google Scholar] [CrossRef]
- Mattia, M.; Bruno, V.; Montgomery-Brown, E.; Patanè, D.; Barberi, G.; Coltelli, M. Combined Seismic and Geodetic Analysis Before, During, and After the 2018 Mount Etna Eruption. Geochem. Geophys. Geosyst. 2020, 21, e2020GC009218. [Google Scholar] [CrossRef]
- La Spina, A.; Salerno, G. Composizione del Gas Emesso dalla Bocca Apertasi Il 6 Novembre 2009 alla Base del Cratere di Sud-Est; Internal Protocol UFVG2009/88 Internal Report; Istituto Nazionale di Geofisica e Vulcanologia: Rome, Italy, 2009; 3p. [Google Scholar]
- Liuzzo, M.; Gurrieri, S.; Giudice, G.; Giuffrida, G. Ten Years of Soil CO2 Continuous Monitoring on Mt. Etna: Exploring the Relationship between Processes of Soil Degassing and Volcanic Activity. Geochem. Geophys. Geosyst. 2013, 14, 2886–2899. [Google Scholar] [CrossRef]


| SO2 Flux (t/d) | SO2/HCl (Molar Ratio) | SGDI (d.u.) | |
|---|---|---|---|
| Min | 172.7 | 1.5 | 1.2 |
| Max | 20,528.1 | 7.4 | 96,419.4 |
| Mean | 2700.8 | 3.1 | 5706.0 |
| Stand. Dev. | 1714.0 | 1.0 | 12,221.7 |
| Median | 2333.7 | 2.8 | 1256.4 |
| Skewness | 2.2 | 0.8 | 4.4 |
Disclaimer/Publisher’s Note: The statements, opinions and data contained in all publications are solely those of the individual author(s) and contributor(s) and not of MDPI and/or the editor(s). MDPI and/or the editor(s) disclaim responsibility for any injury to people or property resulting from any ideas, methods, instructions or products referred to in the content. |
© 2024 by the authors. Licensee MDPI, Basel, Switzerland. This article is an open access article distributed under the terms and conditions of the Creative Commons Attribution (CC BY) license (https://creativecommons.org/licenses/by/4.0/).
Share and Cite
Giammanco, S.; Salerno, G.; La Spina, A.; Bonfanti, P.; Caltabiano, T.; Maugeri, S.R.; Murè, F.; Principato, P. Tracing Magma Migration at Mt. Etna Volcano during 2006–2020, Coupling Remote Sensing of Crater Gas Emissions and Ground Measurement of Soil Gases. Remote Sens. 2024, 16, 1122. https://0-doi-org.brum.beds.ac.uk/10.3390/rs16071122
Giammanco S, Salerno G, La Spina A, Bonfanti P, Caltabiano T, Maugeri SR, Murè F, Principato P. Tracing Magma Migration at Mt. Etna Volcano during 2006–2020, Coupling Remote Sensing of Crater Gas Emissions and Ground Measurement of Soil Gases. Remote Sensing. 2024; 16(7):1122. https://0-doi-org.brum.beds.ac.uk/10.3390/rs16071122
Chicago/Turabian StyleGiammanco, Salvatore, Giuseppe Salerno, Alessandro La Spina, Pietro Bonfanti, Tommaso Caltabiano, Salvatore Roberto Maugeri, Filippo Murè, and Paolo Principato. 2024. "Tracing Magma Migration at Mt. Etna Volcano during 2006–2020, Coupling Remote Sensing of Crater Gas Emissions and Ground Measurement of Soil Gases" Remote Sensing 16, no. 7: 1122. https://0-doi-org.brum.beds.ac.uk/10.3390/rs16071122