Article

Analysis of the Low-Frequency Debris Flow Disaster Induced by a Local Rainstorm on 12 July 2022, in Pingwu County, China

1
School of Emergency Management, Xihua University, Chengdu 610039, China
2
Key Lab of Mountain Hazards and Surface Process, Institute of Mountain Hazards and Environment, Chinese Academy of Sciences, Chengdu 610041, China
*
Author to whom correspondence should be addressed.
Submission received: 20 February 2024 / Revised: 15 April 2024 / Accepted: 24 April 2024 / Published: 26 April 2024

Abstract

:
Low-frequency debris flows often lead to severe disasters due to large energy releases and strong concealment. However, the understanding of formation conditions, movement processes, and disaster-causing mechanisms of low-frequency debris flow is still limited, especially regarding occurrences within the large catchment (>50 km2). This study presents a typical case of large-scale, low-frequency debris flow occurring in the Heishui catchment (102.65 km2), Pingwu County, China. The movement process, disaster characteristics, and causes of the Heishui debris flow were analyzed in detail through field investigations and remote sensing interpretation. The results indicated that the Heishui debris flow is a large-scale, low-frequency, dilute debris flow with a recurrence period of over 100 years. The debris flow was primarily initiated from the right branch gully, Longchi gully, triggered by a local rainstorm with a maximum hourly rainfall return period of over 20 years. The main cause of casualties and building damage is attributed to large energy releases from boulder blockages and outbursts that occurred in the middle part of the main channel. This led to a sudden increase in peak discharge to 1287 m3/s, with a volume of 3.5 × 10⁵ m3 of solid materials being transported to the outlet of the gully. It is essential to enhance the identification of debris flows by comprehensively considering tributary gullies’ susceptibility and strengthening joint meteorological and hydrological monitoring networks in the middle and upper reaches within large catchments. This preliminary work contributes towards improving prevention and mitigation strategies for low-frequency debris flows occurring within large catchments.

1. Introduction

Debris flows are major geohazards in mountainous regions that seriously endanger both infrastructure and society [1,2]. According to the classification of recurrence period, low-frequency debris flows refer to those with a recurrence interval of more than 50 years [3,4,5]. Low-frequency debris flows often pose significant risks due to large energy releases and long recurrence intervals, leading local residents to overlook their danger and live within the hazard zone [6]. Studies suggest that most catastrophic disasters are caused by low-frequency debris flows [7,8,9]. For example, a mass debris flow with a recurrence interval of 300 years occurred in the Vagas region of Venezuela in December 1999, leading to more than 30,000 deaths and direct economic losses of 20 billion dollars [10]. Similarly, a low-frequency debris flow with a recurrence interval of 400 years occurred on 7 August 2010, with the near-complete destruction of Zhouqu County, China, resulting in the deaths and missing of 1765 individuals [11]. Additionally, a 100-year interval debris flow occurred on 8 August 2017, leading to 25 deaths in Puge County, Sichuan Province, China [12]. Compared with medium- and high-frequency debris flows, low-frequency debris flows exhibit strong concealment and are difficult to identify, making it difficult to establish an early monitoring system and effective engineering prevention and control measures [5,6]. Therefore, conducting research on the identification, movement process, and disaster-causing mechanism of low-frequency debris flow is conducive to prevention and mitigation to reduce the risk of debris flow disasters.
Catchment area can reflect essential morphometric information about a catchment and is often considered an important factor in identifying debris flow [5,13,14]. Previous research has suggested that debris flows typically occur in small to medium-sized watersheds, with a low likelihood of occurrence in large catchments. Statistical results of 1437 debris flows in the Panxi area of Sichuan, China, indicate that debris flow gullies with a catchment area of 0.4~50.0 km2 account for 90.2% of the total, while those with an area of >50.0 km2 make up 4.7% [15]. Similarly, statistical findings from numerous debris flows in Tibet and Sichuan revealed that the catchment area ranges from 0.5 to 35.0 km2, whereas those with a watershed area ≥50.0 km2 are primarily rare debris flows or flash floods, and the possibility of debris flow in gullies with a watershed area >100 km2 is extremely low [16,17]. Hence, watersheds with an area larger than 50 km2 are often ignored in debris flow risk assessments in previous research and practice, leading to misjudgments or missed determination. In recent years, serious disasters caused by low-frequency debris flows in large catchments have been reported. For example, ShuiKazi gully (84 km2) on 11 July 2003 [18], Aizi gully (65.55 km2) debris flow on 28 June 2012 [19], Qipan gully (52.65 km2) debris flow on 13 August 2013 [20], Suoqiao gully (111.11 km2) and Cangwang gully (56.43 km2) debris flow on 19 August 2019 [21], and Meilong gully (62.69 km2) debris flow on 17 June 2020 [22]. Therefore, enhancing the comprehension of the formation conditions and characteristics of low-frequency debris flow in large watersheds will help improve the accuracy of debris flow identification.
Rainfall is one of the primary factors triggering debris flows [23,24]. Generally, long-lasting adverse rainfall raises vigilance among local residents and observers of community-based warning systems, who can prepare monitoring and emergency measures in advance to avoid or mitigate disasters [25,26]. Nevertheless, short-duration, high-intensity rainstorm-triggered debris flows are more sudden, making them difficult to prevent. Rain-triggered debris flow early warning systems based on statistical models of rainfall intensity and duration, antecedent precipitation, and cumulative rainfall play an important role in the prevention of debris flow disasters [27,28,29,30]. Accurate rainfall data are essential for defining rainfall thresholds and ensuring early warnings [31]. However, determining rainfall thresholds for debris flow remains challenging due to the limited availability of sufficient rainfall observation data, especially in mountainous regions [32]. In addition, the mountainous terrain is typically complex, and local microclimates are significant and prone to the formation of local rainstorms. These factors pose a greater challenge to the monitoring and early warning of debris flows.
On 12 July 2022, several debris flows occurred along the Duobu River in Pingwu County, Sichuan Province, China, with the Heishui catchment experiencing the most severe disaster. The Heishui debris flow event led to 18 deaths and missing persons and the urgent transfer and resettlement of more than 397 individuals. Notably, according to an interview with local residents, a debris flow disaster has not occurred in the Heishui catchment over the past 100 years. This study utilized field investigations, channel measurements, rainfall records at one-hour intervals, and remote sensing images to analyze the triggering rainfall conditions, movement, and disaster characteristics of the Heishui debris flow. The goals of the study were to (i) clarify the process and characteristics of the Heishui debris flow disaster; (ii) explore the causes of the Heishui catastrophic debris flow disaster; and (iii) propose improvements for the prevention and mitigation of low-frequency debris flows in large catchments. The results of this study can provide a reference for low-frequency debris flow disaster prevention and mitigation in large catchments.

2. Study Area and Methods

2.1. Study Area

The Heishui catchment (104°31′10.42″E, 32°36′26.95″N), a tributary of the Duobu River, is located in Muzuo Township, Pingwu County, Sichuan Province, China (Figure 1). The catchment covers an area of 102.65 km2 and has a channel length of 18.7 km and a mean gradient of 9.6%. The topography of the catchment is steep and deeply incised, with the highest elevation reaching 3848 m and a relative relief of 2603 m. The catchment has well-developed branches, including two large branches known as Longchi gully and Heishui gully. To avoid confusion, we use the abbreviations LCG and HSG to refer to Longchi gully and Heishui gully, respectively. The two branches converge at an elevation of 1602 m and then drain into the Doubu River at Muzuo town. LCG is in the western part of the catchment and has an area of 36.0 km2. The channel is 13.6 km long, and the average longitudinal gradient is 12.1%. The HSG has an area of 48.5 km2, and the gully is 9.7 km long with an average longitudinal gradient of 12.3%. The Heishui catchment has a high vegetation coverage rate of 87%.
The region is located in a subtropical mountain climate zone and is cool and humid in the summer. The annual average temperature is 14.7 °C, and the average annual precipitation is approximately 895.4 mm. The rainfall is mainly concentrated from July to September, accounting for 61.1% of the annual precipitation, with a high frequency of rainfall occurring at night. The maximum daily and hourly rainfall are 108.97 mm (in 1992) and 64 mm (in 1964), respectively.
The study area is located in a geologically complex region at the intersection of the Songpan–Ganzi Block, Yangtze Block, and West Qingling Orogenic Belt (Figure 1b). The regional geological structure is complex and is strongly affected by seismic activity. According to the United States Geological Survey (USGS) earthquake data records (https://earthquake.usgs.gov/earthquakes/, accessed on 12 September 2022), seven earthquakes (M ≥ 6.0) occurred within 100 km of the study area from 1900–2022. Based on the seismic intensity maps released by the China Earthquake Administration, the study area is located in the region that had a seismic intensity of VI during the Jiuzhaigou earthquake (M7.0) on 8 August 2017, and in the region that had a seismic intensity of VIII during the Wenchuan earthquake (M8.0) on 12 May 2008. According to the 1:200,000 geological map surveyed by the Sichuan Provincial Geological Bureau, the lithology of the study area mainly includes Indosinian granite, Devonian sandstone, siltstone, and slate; Silurian slate, shale, and sandstone; Sinian metasandstone, limestone, phyllite, sandstone, and granulite; and lower Paleozoic Bikou Group metasandstone, sandstone, slate, and tuff (Figure 1d).
In mountainous regions, residential settlements and production activities tend to be concentrated on old alluvial fans or river terraces due to mountainous topographic conditions. In the Heishui catchment, there are four settlements comprising a total of 369 residents, with most of the population concentrated in Muzuo Town at the outlet of the gully (Figure 1d). National road G247 and the highway from Mianyang to Jiuzaigou County cross the outlet of the Heishui catchment.

2.2. Field Investigation

To obtain more detail on the initiation, mobilization, erosion, and deposition processes of Heishui debris flow, two field investigations were conducted on 16 July 16 and 1 August 2022. Information on the debris flow timeline, movement process, and damages to the debris flow was obtained through interviews with eyewitnesses to the event. Seven cross-sections were selected and measured in the straight and smooth segments without embossments, trunks, or other blockages that could interrupt the debris flow, and one boulder blockage cross-section was measured at the narrow site near village 1 (Figure 1c). The geomorphic settings of these cross-sections were carefully measured and analyzed, including channel width, flow height (judged from the level of mud imprinted on the bank or based on the extent of moss and vegetation damage to gully sidewalls), roughness of the slope bed (refer to the bed particle composition, the ratio of stones, sand, and gravel), and boulder blockage dam size and geometry. In addition, we also conducted solid particle size measurement and statistical analysis with a size >60 mm along the channel. Specifically, two 50-m-long strips were measured near cross-section 3 and cross-section 8, respectively. The particle size of boulders larger than 60 mm was measured in the 3-axis direction at intervals of 1 m, and its lithology was also recorded (Figure 2a). Moreover, five samples for grain size distribution were collected from the debris flow deposits (Figure 1c and Figure 2b). The grain size samples were measured using sieve analysis, and particles with diameters less than 0.25 mm were measured using Mastersizer 2000 produced by Malvern Panalytical (Chipping Norton, Australia).

2.3. Remote Sensing Interpretation

The Heishui catchment has a large area, and the elevation of the zone in which debris flows is high, making it difficult to conduct field investigations. To map the distribution of the loose soil material, channel erosion, and accumulation before and after the debris flow event, multiperiod remote sensing images were collected. Additionally, an unmanned aerial vehicle (UAV) was used to take aerial images and produce topographic data for the main channel. The image and DEM information are shown in Table 1.

2.4. Rainfall Record Analysis

There are four rain gauge stations near the Heishui catchment (Figure 1b). The Muzuo station is located at the outlet of the Heishui catchment, and the elevation (h) is 1244 m. The Laomuzuo station (h = 1550 m) is located at the outlet of the Ziyili catchment, which originates from the same ridge as the Heishui catchment. The Mupi station (h = 1072 m) and Baima station (h = 2143 m) are located approximately 9 km downstream and 25 km upstream of the Heishui catchment, respectively. We collected rainfall data from these four stations from 8:00 on 11 July to 8:00 on 12 July. As no rain gauges were installed in the uninhabited areas of the middle and upper reaches of the Heishui catchment, the rainfall data from these four stations was used as a reference for estimating the duration and intensity of the rainfall that triggered the Heishui debris flow.
The frequency of rainfall was calculated using the following equation:
H 1 p = K 1 p × H 1
where H 1 p is the annual maximum hourly rainfall at P frequency; K 1 p and H 1 is the maximum hourly rainfall coefficient at P frequency. The value of K 1 p is determined by referencing the P-III distribution function recommended by the Rainstorm and Flood Calculation Manual of Medium and Small Basins in Sichuan Province, China (1984) [33]; H 1 is the maximum hourly rainfall average at P frequency, which is estimated based on the Parameter Atlas of Rainstorm in Sichuan Province (2010) [34].

2.5. Calculation of Dynamic Debris Flow Parameters

The discharge of the Heishui debris flow was calculated by the morphological survey method. The discharge of the debris flow was calculated using the following equation:
Q c = A c × V c
where Qc is the debris flow discharge, in m3/s; Ac is the cross-section area, in m2, which was calculated based on the field investigation; and Vc is the debris flow velocity, in m/s. The debris flow velocity was calculated according to Manning’s formula (Equation (2)), which is widely used in the debris flow calculation and considers the open-channel flow velocity to be dependent on the surface materials of the channel’s wetted perimeter and the slope inclination [11,35,36,37]:
V c = 1 n R n 2 / 3 I c 1 / 2
where n is the Manning roughness coefficient; Rn is the hydraulic radius, in m; and Ic is the channel gradient, which is dimensionless. Rn and Ic were directly measured in the field investigation. The Manning’s roughness coefficient in this paper is approximately evaluated based on the research work of Xu and Feng [38], as the method is highly recommended by Chien and Wan [39] and Cui et al. [11]. The Heishui debris flow is characterized as a non-viscous debris flow. The Heishui channel is wide and straight, and the bed material is mainly composed of stones, sand, and gravel, with an average particle size of approximately 0.3 m. According to the data from Xu and Feng [38], the roughness coefficient of Heishui debris flows can be approximately evaluated as 0.07.

3. Results

3.1. Characteristics of the Catastrophic Heishui Debris Flow

3.1.1. Branch Gully-Initiated Debris Flow

Remote sensing interpretation and field investigation indicate that the debris flow was initiated from the branch gully, LCG. Clear signs of debris flow initiation were left on the post-disaster remote sensing images, including damage to vegetation, exposure of fresh rock and soil masses, and notably wider ditches in the upstream of LCG and HSG (Figure 3). Based on field investigation and comparison of erosion and accumulation of the LCG and HSG, it was inferred that the debris flow mainly originated from the LCG.
The source area of the LCG is a winter snow-covered area with an elevation of more than 3300 m. The bedrock is Indosinian granite, and a large amount of moraine material left over from the Quaternary glaciers overlies the bedrock. The average slope of the zone where the debris flow formed in the LCG is 29.3°, meeting the slope conditions for debris flow initiation [15]. Remote sensing images showed that more than 25 branch ditches and gullies were activated, and the total erosion area was 1.58 km2, accounting for 4.4% of the total area of the LCG (Figure 3b,c). Although several branches and ditches in the HSG also showed obvious initiation characteristics, the erosion area only accounts for 1.7% of the HSG area, and its scale and intensity area were far less than those of the LCG (Figure 3c,d). The main channel of the LCG is long and narrow, with an average gradient of 12.1%, while the length of each branch is short, which is conducive to rapid confluence. The branch ditches and gullies quickly converged to form channel runoff, which drove the boulders and sediments in the main channel of the LCG to continuously carry the sediments forward. A large number of stones and sediments rushed out of the LCG, the channel widened significantly, and they accumulated at the confluence, strongly squeezing the HSG (Figure 3e).

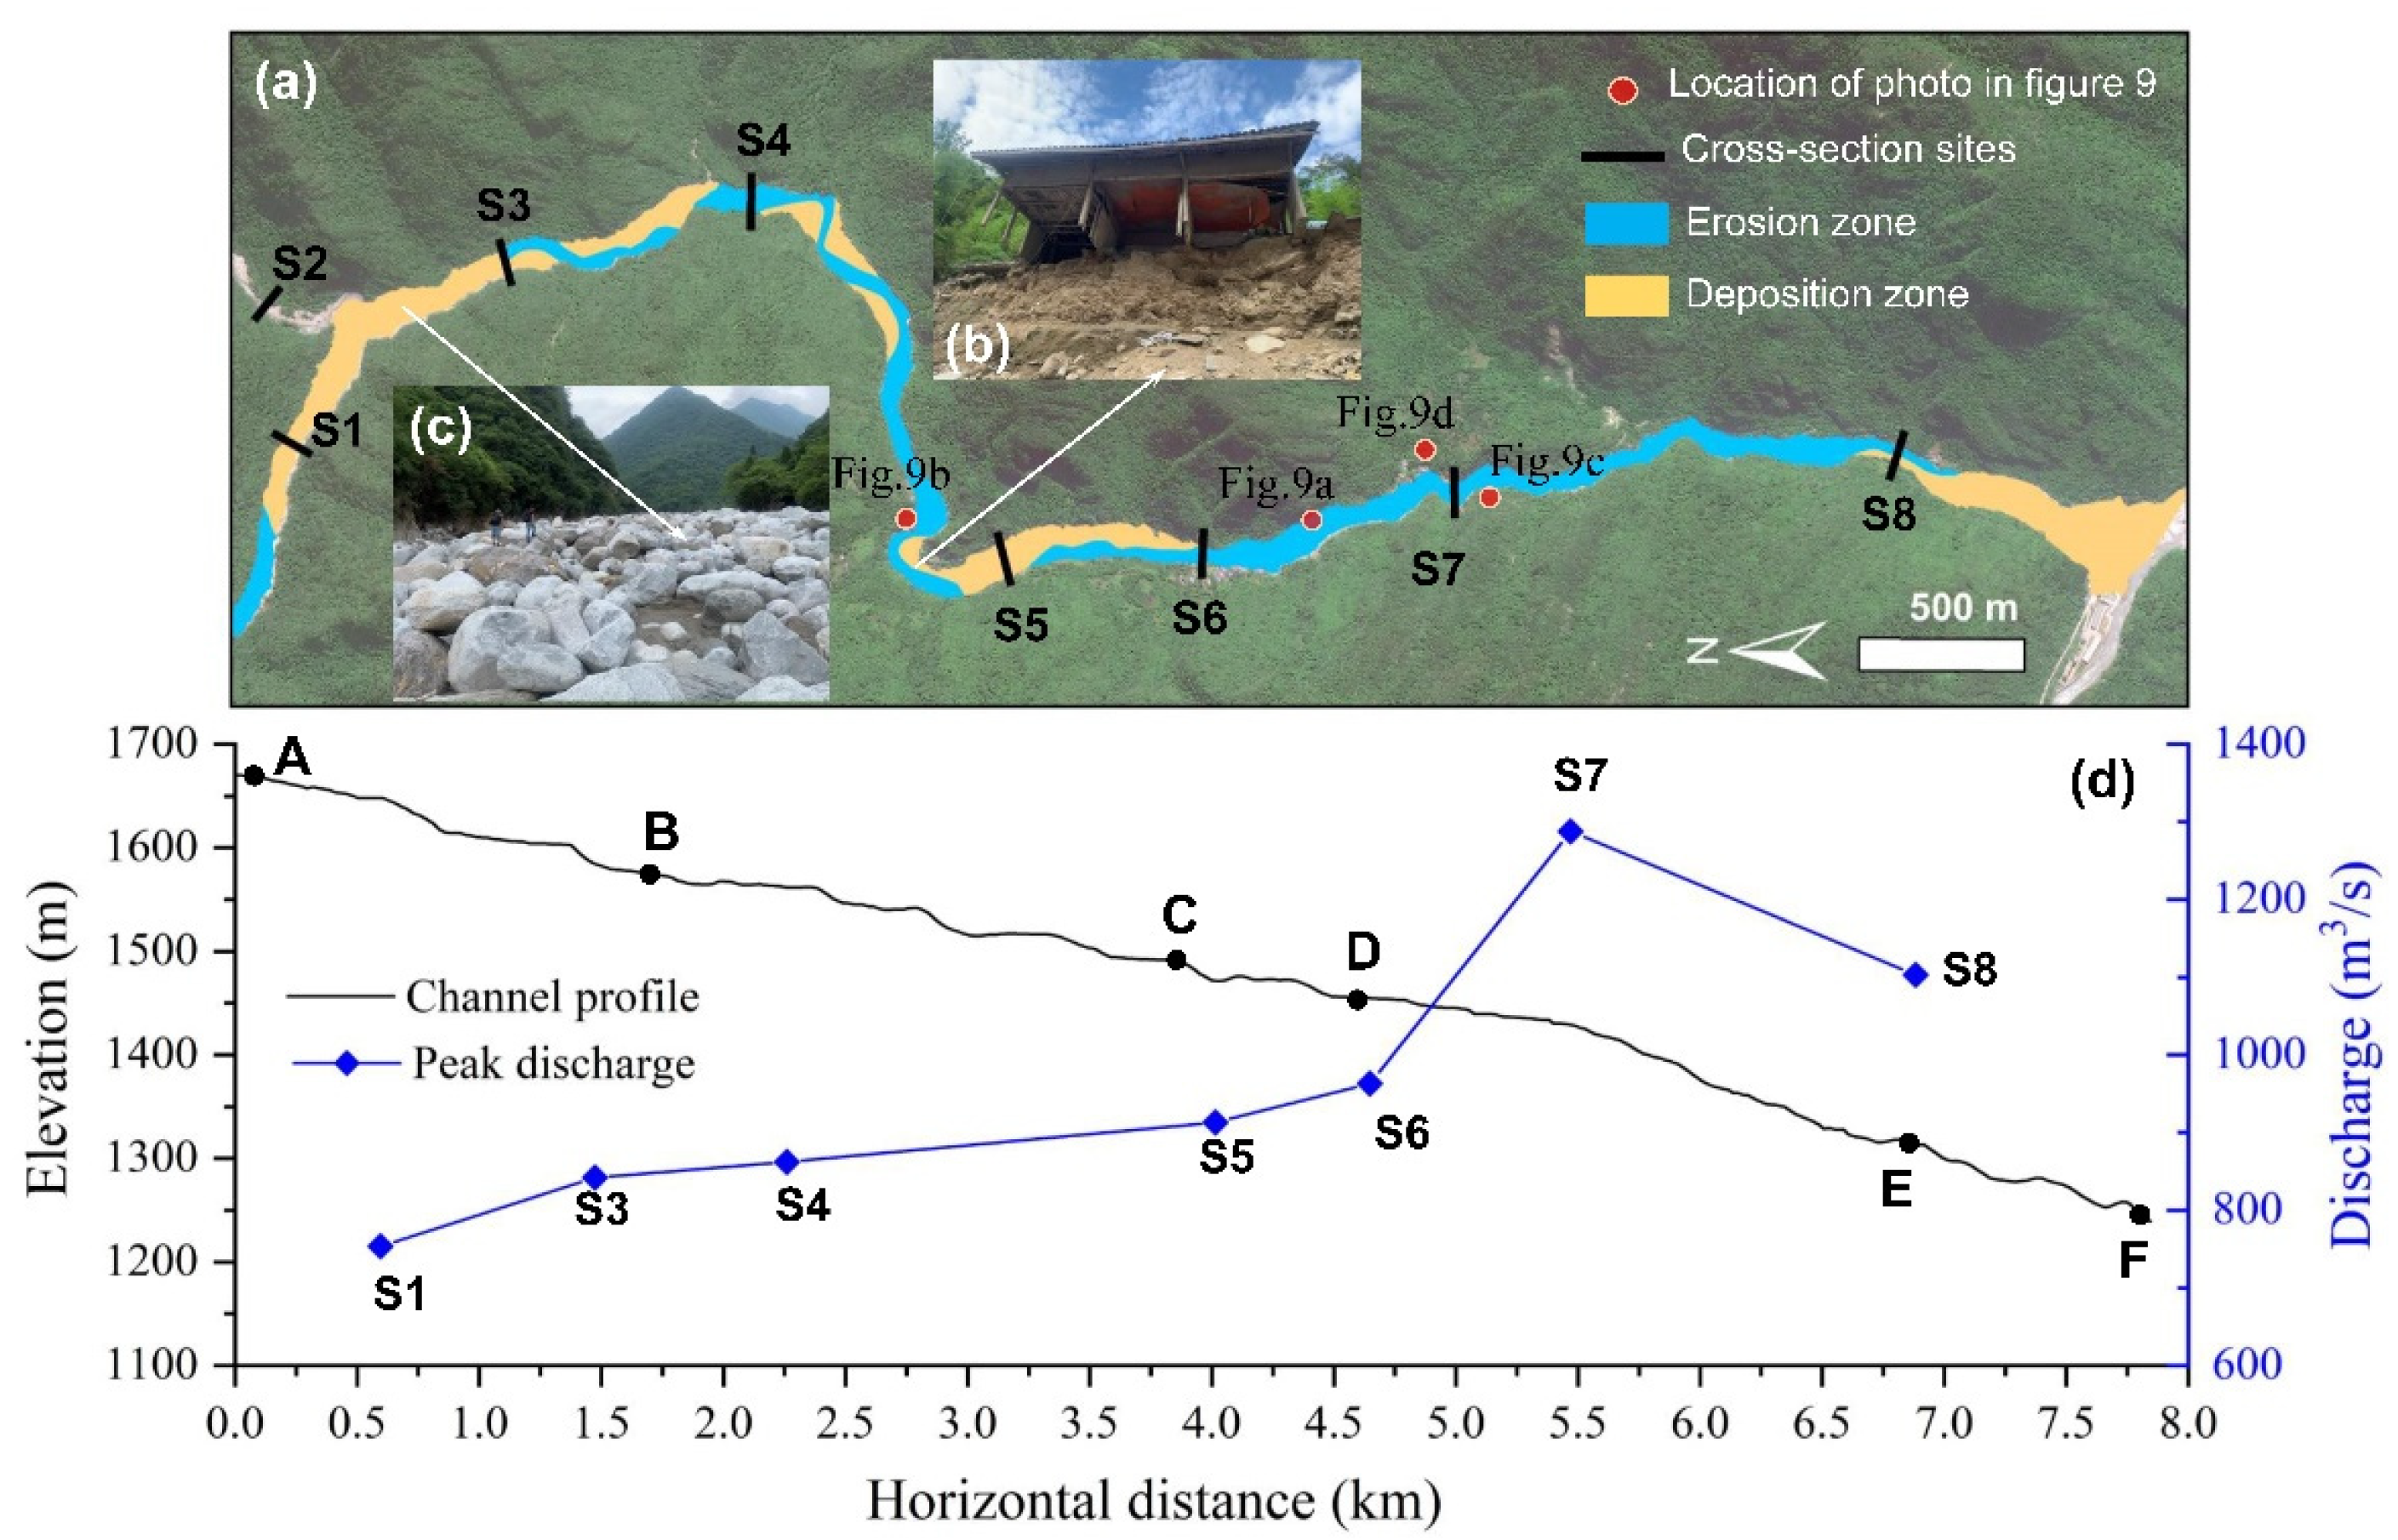
3.1.2. Debris Flow Movement Process

The particle curves of the five debris flow deposit samples (the maximum particle size is 60 mm) in the Heishui catchment reveal that they contain a lower proportion of fractions of fine-grained material (Figure 4). The particle curves of P2 and P4 are similar and exhibit a high proportion of gravel (2–60 mm), approximately 73.2% on average, while the proportions in P1 and P5 are close to 54.5%. The sand (0.75–2 mm) contents are 22.5%~44.0%, and P1 has the highest proportion. P3 has higher proportions of clay (<0.005 mm) and silt (0.005~0.075 mm), 1.27% and 18.3%, respectively, while the other samples’ clay contents are less than 1%. According to the grain size distributions of five samples, the debris flow density was calculated using an empirical method proposed by Chen et al. [40]. The results showed that the debris flow density in this event ranged from 1.55~1.58 g/cm3, indicating that it was a diluted debris flow with a volumetric solid concentration of less than 50% [41].
The peak discharge of the Heishui debris flow varied with movement and deposition in different segments (Figure 5). The peak discharge near the outlet of the LCG (cross-section S1) was 753.6 m3/s, which was 3.6 times that of the outlet of the HSG (cross-section S2). It also indicated that the debris flow mainly originated from the LCG. The peak discharge gradually increased to 963.2 m3/s at cross-section S6. At cross-section S7, the discharge increased sharply to 1287.9 m3/s and subsequently decreased to 1102.9 m3/s near the outlet of the main channel (cross-section S8). The large amount of energy released by the debris flow strongly eroded the channel bed and banks and caused collapses and landslides on the bank slope. Strong erosion occurred at the bend of the channel, leading to the phenomenon of an ultrahigh curve. The maximum mud height reached 14 m, which washed away the bases of houses, and accumulations formed on the convex bank (Figure 5b).

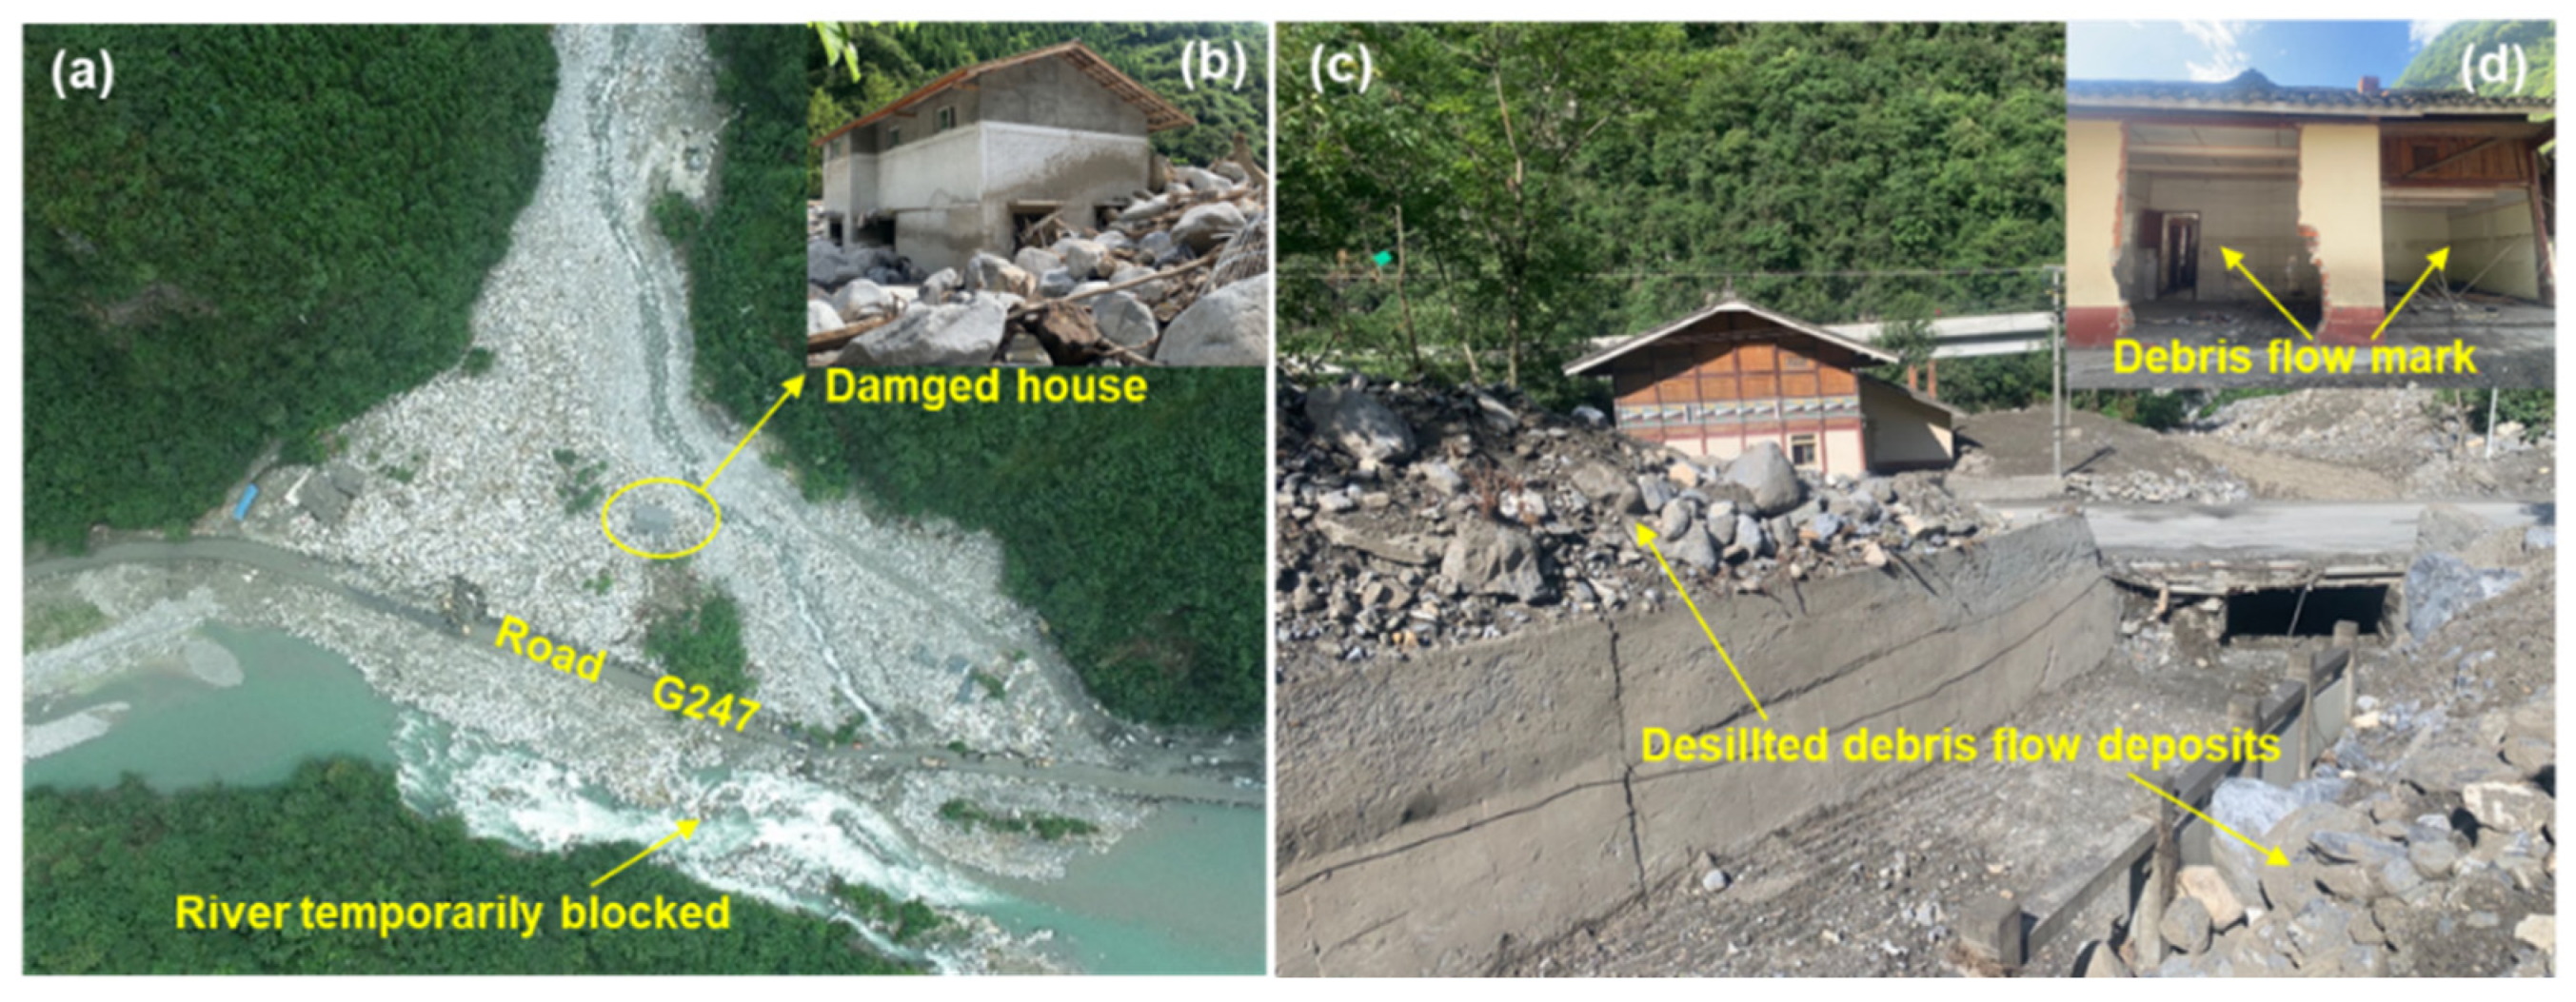
3.1.3. Disaster Characteristics

The Heishui debris flow had a strong carrying capacity, and much of the solid material carried by the debris flow was eventually deposited in segments AB and EF, causing the most severe damage (Figure 6). Large boulders with a diameter of more than 1 m are common in the deposition zone, and the maximum measured boulder size was 5.8 m × 2.7 m × 1.8 m. Stones and driftwood blocked the main hole and part of the adjacent hole of the national road G247 arch bridge at the outlet of the channel (Figure 6f), resulting in a significant increase in the channel bed and flood water level. The debris flow swept through the Muzuo town, damaging 31 houses to varying degrees (Figure 6b). Houses situated close to the gully were either completely washed away or buried and damaged, leading to the deaths and disappearance of local residents (Figure 6d,e,g). Additionally, the country road connecting Muzuo town to Heishui village and the arch bridge were both completely damaged. The comparison of elevation points before and after the disaster revealed that the maximum thickness of accumulation was 11.7 m, with an average thickness of approximately 3.7 m. The deposition area was approximately 9.4 × 10⁴ m2, and the volume of accumulated solid material was approximately 3.5 × 10⁵ m3, indicating that this event was a large-scale debris flow. This catastrophic disaster resulted in a direct economic loss of 480 million RMB.

3.2. The Causes of the Heishui Debris Flow

3.2.1. Local Rainstorm-Triggered Debris Flow

Short-duration, high-intensity rainfall was the key initiator of the Heishui debris flow. Heavy rainfall occurred in the Duobu River basin starting at 18:00 on 11 July. However, the rainfall intensity and accumulation amount from 18:00 on 11 July to 6:00 on 12 July at the four stations varied greatly. The accumulation rainfall at Baima station, Laomuzuo station, Muzuo station, and Mupi station was 18.8 mm, 131.5 mm, 50.7 mm, and 58.0 mm, respectively (Figure 7). Field investigation showed that among the multiple catchments between the four rain gauge stations, only the Ziyili catchment, Yishida catchment, and Heishui catchment experienced debris flows on 12 July, which led to the destruction of residential houses and roads (Figure 8). Both the Ziyili catchment and Yishida catchment are located on the left side of the Heishui catchment, adjacent to the LCG branch, and originate from the same mountain ridge (Figure 1b,c). The rainfall records and the distribution of the debris flow catchment indicated that the rainstorm center was concentrated in the regions of the LCG, Ziyili catchment, and Yishida catchment. Although Muzuo Station is located at the outlet of the Heishui catchment, its straight-line distance from the top of LCG is about 17 km, while the distance between Laomuzuo Station and the top of Longchigou is about 8 km. Moreover, the altitude of Muzuo Station is 1244 m, while the altitude of Laomuzuo Station is 1550 m. Therefore, in terms of both distance and altitude, the rainfall at Laomuzuo station is the most suitable for representing the rainfall level that triggered the debris flow.
According to the water level monitoring at the outlet of the Heishui catchment, the debris flow occurred at approximately 5:00 on 12 July and lasted for approximately 30 min. The cumulative rainfall amount before the debris flow at Laomuzuo station was 119 mm, and the rainfall intensity that triggered the debris flow was 12.5 mm (Figure 7). There were two rainfall peaks at Laomuzuo station before the debris flow occurred, which appeared at 0:00 and 4:00 on 12 July with hourly rainfall of 48.5 mm and 22.1 mm, respectively. According to the calculation results of hourly and 6 h (00:00 to 5:00) rainstorm intensity of different frequencies in Heishui catchment (Table 2), the maximum hourly rainfall return period of Laomuzuo station is nearly 20 years, and the 6-h frequency is over 50 years, respectively. In general, local rainfall increases with increasing elevation in linear or exponential form, which has proved an acceptable approximation in many cases [30,42,43]. Given the 2306 m height difference between the headwater and the outlet of the Heishui catchment, it can be inferred that the frequency of the maximum rainfall is more than 20 years. This rainfall from 00:00 to 05:00 on 12 July was high enough to saturate the slope soil, inducing hyperosmosis runoff and causing the solid materials on the slope to quickly form a debris flow.

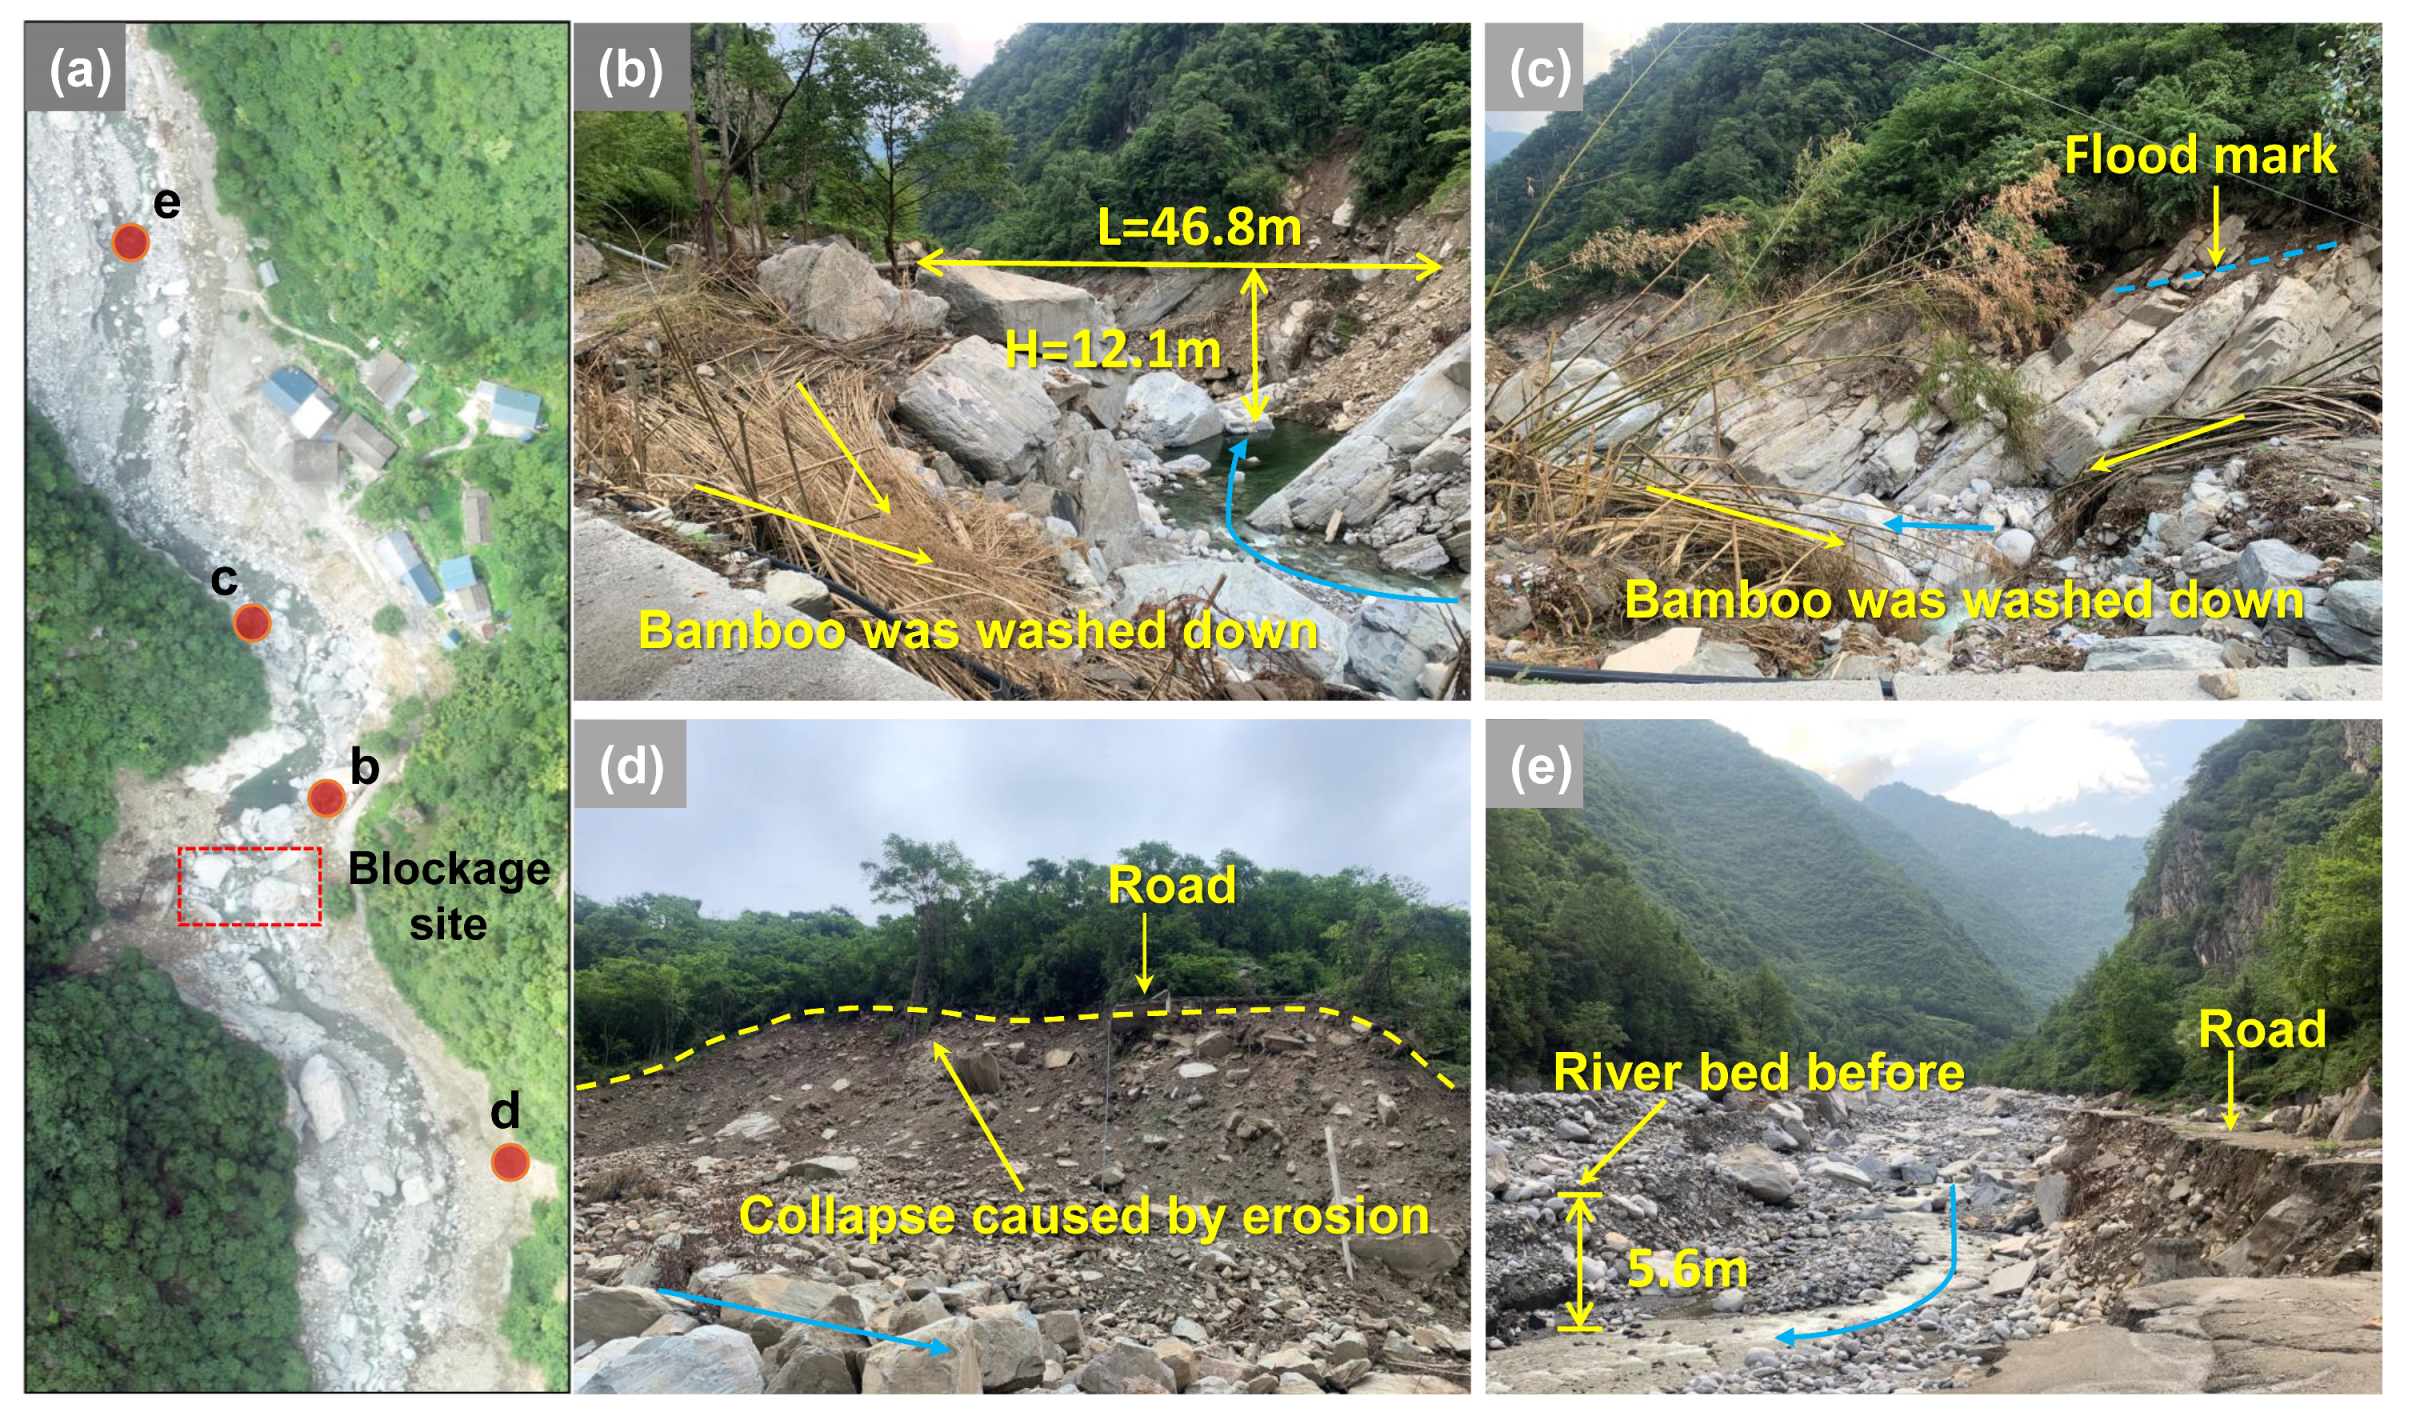
3.2.2. Boulder Blockage Amplified the Debris Flow Discharge

The debris flow discharge increased 324.7 m3/s from cross-section S6 to S7 with an average of 395.9 m3/s per kilometer, which is 6.8 times that of S1 to S6. According to the field investigation, no significant gully confluences or large landslides occurred between cross-sections S6 and S7. The debris flow discharge increase within a short distance is often related to channel blockages and outbursts in narrow gullies and sharply curved sections due to landslide deposits, collapse deposits, natural boulders, and artificial dams [44,45]. Boulder blockage and outburst phenomena were observed near cross-section S7 (Figure 9). The blockage site was located in a narrow and curved part of the channel, with several large boulders remaining on the left bank. The largest boulder had a size of approximately 13.9 m × 6.1 m × 5.1 m, occupying most of the river, and only a 3.2 m wide area was available for the passage of flow. Consequently, the stones, sand, and driftwood carried by the debris flow from upstream had difficulty passing through this narrow section, leading to channel blockage. The maximum flow depth, as determined from muddy marks, was 12.1 m, and the top width of the blockage dam was 46.8 m (Figure 9b). The temporary dam ultimately failed because of the continuous accumulation of debris flow material, which increased the pressure on the temporary dam. The sudden breach of the temporary dam led to bamboo falling toward the center of the breach (Figure 9b,c). The high energy of the debris flow caused strong erosion downstream, resulting in the collapse of the channel bank and the road subgrade washing away (Figure 9d). At the same time, retrogressive erosion occurred upstream of the dam, with erosion depths ranging from 2 m to 6 m (Figure 9e).
Hard rock regions are more prone to collapses and rockfalls, thereby providing a favorable environment for boulder blockage [19]. The Heishui catchment is located on the southern slope of the West Qinling Orogenic Belt, where the exposed rocks are mainly weather-resistant igneous rocks and metamorphic rocks. Field investigations found that cracks and joints are well developed in the rocks, and a large amount of the bedrock on the hillsides had been cut into blocks, forming rock cells and hazardous rocks that are prone to rockfall and collapse (Figure 10a,b). The rocks and boulders from collapses and rockfalls are generally large in volume and quantity, accumulating in or crowding some parts of the channel, and they are difficult for floods to transport [46]. In the Heishui catchment, numerous large boulders were scattered on the slopes and in the channel, with the largest boulder in the channel measuring 21.4 m × 11.8 m × 6.7 m and located approximately 50 m downstream from the blockage site (Figure 10c,d). In addition to rocks and boulders, large wood chunks and fragments also contribute to blockage and have been observed in debris flow events [47,48,49]. Remote sensing interpretation showed that the Heishui catchment has a high vegetation coverage of nearly 87%, and some trees on the slope and channel banks were involved in the debris flow. Driftwood was also found in the channel and deposition zone (Figure 6e,f), indicating a potential contribution to boulder blockage.

4. Discussion

It is extremely challenging to prevent and mitigate low-frequency debris flows caused by local rainstorms in large catchments, such as the Heishui debris flow. This difficulty mainly comes from the identification of low-frequency debris flow catchments and the monitoring and early warning of local rainstorms in mountainous regions.
The identification of debris flow catchments is the first step in disaster prevention and control. At present, the identification of debris flow catchments can be carried out based on historical disaster records and interviews, field surveys or remote sensing interpretations of debris flow fans, and morphometric indices or models [13,14,50]. Interviews with local residents, such as an interview with a 78-year-old senior citizen who resides in the Heishui catchment, revealed that flash floods carrying small amounts of sediment and stones have occurred only twice in the Heishui catchment over the past century. The susceptibility of debris flow in the Heishui catchment has been assessed using the debris flow susceptibility scoring method [4], which takes into account 15 influencing factors, including geology, topography, catchment area, vegetation coverage, and loose material sources. The results demonstrate that the susceptibility of debris flows in the Heishui catchment is remarkably low. Although the Heishui catchment is located in the region affected by the 2008 Wenchuan M8.0 earthquake and the 2017 Jiuzhaigou M7.0 earthquake, no large landslides were found in the Heishui catchment based on the interpretation of remote sensing images before and after the earthquake events [51,52]. Based on Zhou’s method [53], which employs AL (areas of coseismic landslides)–A (catchment area), AL–H (catchment relief), and AL–(A/H) threshold models in the Wenchuan earthquake area, the Heishui catchment is not a debris flow catchment. The widely used Melton’s ruggedness number (RM) is determined by dividing the catchment relief by the square root of the catchment area, suggesting that RM > 0.3 is suitable for identifying debris flow catchments [13]. The RM of the Heishui catchment is 0.26, indicating that it is not a debris flow catchment. The misidentification of these methods led to the Heishui catchment being regarded as a flash flood catchment for prevention and control in the past. Therefore, there is a lack of appropriate measures and preparations to deal with debris flow disasters.
Analyzing the reported debris flow cases that occurred in a large catchment, we found that most of them were caused by large tributary gullies, and the RM of these tributary gullies satisfied the condition of debris flow. For example, the debris flow originated from the Qiongshan tributary gully of the ShuiKazi catchment [18], and the RM is 0.45; the Aizi gully debris flow was caused by the tributary Gualv gully [19], and the RM is 0.8. The Heishui debris flow mainly originated from the tributary gully, the LCG. The RM of the LCG is 0.43, and the RM of the HSG is 0.37, which suggests that both are debris flow catchments. Therefore, for debris flow identification in large catchments, we suggest considering the susceptibility of tributary gullies.
Debris flows triggered by a local rainstorm are often caused by intense convective rainfall in small storm cells, which can be just a few kilometers or even less [54]. In mountainous catchments, rainfall is highly spatially variable due to elevation effects, which introduces uncertainty in forecasting flash floods or debris flows [32]. The distance between Muzuo station and Laomuzuo station is 6 km, with an elevation difference of 300 m. However, during the same period, the maximum difference in hourly rainfall was 37.8 mm, and the difference in cumulative precipitation was 80.8 mm, which exemplifies the scale of the variation and uncertainty associated with rainfall in this region. Therefore, to avoid misrepresenting rainfall-triggering conditions, it is crucial to install rain gauges as close to the initiation zone as possible. In large mountainous catchments where villages or towns are located downstream, it is necessary to install meteorological and hydrological monitoring facilities, such as rain gauges and water level stations, in the middle and upper reaches. In addition, the sharing of upstream and downstream monitoring and early warning information should be strengthened to ensure that the upstream information informs the downstream dynamic hydrological information in a timely manner [55,56].
Furthermore, community-based warning systems have been shown to be an effective method of managing geological disasters in mountainous areas in China [9,25,57]. On the night of 11 July, community-based observers in Muzuo Township organized the transfer of 182 people in advance after receiving the rainstorm warning, while the evacuation range was limited to residents in the flash flood danger zone. Due to the lack of professional disaster identification capabilities, the community-based observers failed to expand the scope of evacuation and transfer according to the actual situation. Thus, it is essential to improve the emergency plan, strengthen regular emergency drills and training, and enhance the emergency response abilities of community-based observers in mountainous areas.

5. Conclusions

This study analyzed the characteristics of the movement process, disaster characteristics, and causes of the Heishui debris flow on 12 July, 2022. The methods for identifying the susceptibility of debris flows in large catchments and prevention strategies for local rainstorm-triggered debris flow were discussed. The research conclusions are as follows:
The Heishui debris flow is a large-scale, low-frequency, dilute debris flow occurring in a basin with a catchment area exceeding 100 km2. The recurrence period of the debris flow exceeded 100 years, with a density of 1.56 g/cm3. The debris flow was primarily initiated from the right branch LCG gully, triggered by a local rainstorm with a maximum hourly rainfall return period of over 20 years. The main cause of devastating loss of life and property is attributed to large energy releases from boulder blockages and outbursts, which led to an increase in peak discharge to 1287.9 m3/s as well as a rise in the transport capacity of solid materials.
For low-frequency debris flows occurring in large watersheds, the initial step in disaster prevention and mitigation is to conduct early identification of debris flows. It is essential to not only assess the overall situation of the catchments but also to comprehensively consider the condition of the branch gullies by using field surveys, morphometric indices, or models to identify debris flow. In the future, the influence of branch gullies needs to be taken into consideration when developing a debris flow identification model in order to avoid misidentification. Simultaneously, it is necessary to install meteorological and hydrological monitoring systems in the middle and upper reaches of the basin within large catchments to provide enough evacuation time for the residents who live in the lower reach. Additionally, it is also important to popularize disaster prevention and enhance the emergency response capabilities of community-based observers and local residents in the mountainous area.

Author Contributions

Conceptualization, T.W. and M.L.; methodology, M.L., M.D., and N.C.; investigation, M.L., M.D., and T.W.; writing—original draft preparation, M.L.; writing—review and editing, T.W. and S.T.; visualization, M.L.; funding acquisition, N.C. and M.L. All authors have read and agreed to the published version of the manuscript.

Funding

This research was funded by the Second Tibetan Plateau Scientific Expedition and Research Program (Grant No. 2019QZKK0902), the Natural Science Foundation of Sichuan, China (Grant No. 2022NSFSC1022), the Talent Introduction Project of Xihua University (Grant No. RZ2100002841), and the Chinese Academy of Sciences (CAS) Light of West China Program.

Data Availability Statement

Data are contained within the article.

Conflicts of Interest

The authors declare that they have no potential conflicts of interest with respect to the research, authorship, and/or publication of this article.

References

  1. Iverson, R.M. The physics of debris flows. Rev. Geophys. 1997, 35, 245–296. [Google Scholar] [CrossRef]
  2. Jakob, M.; Hungr, O.; Jakob, D.M. Debris-Flow Hazards and Related Phenomena; Springer: Berlin/Heidelberg, Germany, 2005; Volume 739. [Google Scholar]
  3. Steijn, V.H. Debris-flow magnitude—Frequency relationships for mountainous regions of Central and Northwest Europe. Geomorphology 1996, 15, 259–273. [Google Scholar] [CrossRef]
  4. Ministry of Land and Resources of the People’s Republic of China. Specification of Geological Investigation for Debris Flow Stabilization in China (T/CAGHP 006-2018); Ministry of Land and Resources of the People’s Republic of China: Beijing, China, 2018. (In Chinese)
  5. Zhao, Y.; Meng, X.; Qi, T.; Qing, F.; Xiong, M.; Li, Y.; Guo, P.; Chen, G. AI-based identification of low-frequency debris flow catchments in the Bailong River basin, China. Geomorphology 2020, 359, 107125. [Google Scholar] [CrossRef]
  6. Hu, G.; Huang, H.; Tian, S.; Rahman, M.; Shen, H.; Yang, Z. Method on early identification of low-frequency debris flow gullies along the highways in the Chuanxi Plateau. Remote Sens. 2023, 15, 1183. [Google Scholar] [CrossRef]
  7. Cui, P. Disaster characteristics by debris flow in 2004, China and hazard rediction countermeatures. J. Mt. Sci. 2005, 23, 437–441. [Google Scholar]
  8. Angillieri, M.Y.E. Debris flow susceptibility mapping using frequency ratio and seed cells, in a portion of a mountain international route, Dry Central Andes of Argentina. Catena 2020, 189, 104504. [Google Scholar] [CrossRef]
  9. Tian, S.; Hu, G.; Chen, N.; Rahman, M.; Han, Z.; Somos-Valenzuela, M.; Habumugisha, J.M. Extreme climate and tectonic controls on the generation of a large-scale, low-frequency debris flow. Catena 2022, 212, 106086. [Google Scholar] [CrossRef]
  10. Pérez, F.L. Matrix granulometry of catastrophic debris flows (December 1999) in central coastal Venezuela. Catena 2001, 45, 163–183. [Google Scholar] [CrossRef]
  11. Cui, P.; Zhou, G.G.; Zhu, X.; Zhang, J. Scale amplification of natural debris flows caused by cascading landslide dam failures. Geomorphology 2013, 182, 173–189. [Google Scholar] [CrossRef]
  12. Zhong, Z.; Chen, N.; Hu, G.; Han, Z.; Ni, H. Aggravation of debris flow disaster by extreme climate and engineering: A case study of the Tongzilin Gully, Southwestern Sichuan Province, China. Nat. Hazards 2021, 109, 237–253. [Google Scholar] [CrossRef]
  13. Jackson, L.; Kostaschuk, R.; MacDonald, G. Identification of debris flow hazard on alluvial fans in the Canadian Rocky Mountains. Geol. Soc. Am. Rev. Eng. 1987, 7, 115–124. [Google Scholar]
  14. Wilford, D.; Sakals, M.; Innes, J.; Sidle, R.C.; Bergerud, W. Recognition of debris flow, debris flood and flood hazard through watershed morphometrics. Landslides 2004, 1, 61–66. [Google Scholar] [CrossRef]
  15. Kang, Z.C.; Li, Z.F.; Ma, A.N.; Luo, J.T. Research on Debris Flow in China; Science Press: Beijing, China, 2004. (In Chinese) [Google Scholar]
  16. Institute of Mountain Hazards and Environment, China. Debris Flow and Environment in Tibet; Sichuan University Publishing House: Chengdu, China, 1999. (In Chinese) [Google Scholar]
  17. Zhu, Y.; Yu, B.; Qi, X.; Wang, T.; Chen, Y.J. Topographical Factors in the Formation of Gully Type Debris Flows in the Upper Reaches of Minjiang River. J. Jilin Univ. Earth Sci. Ed. 2014, 44, 268–277. [Google Scholar]
  18. Chen, N.S.; Li, T.C.; Gao, Y.C. A great disastrous debris flow on 11 July 2003 in Shuikazi valley, Danba County, western Sichuan, China. Landslides 2005, 2, 71–74. [Google Scholar] [CrossRef]
  19. Liu, M.; Zhang, Y.; Tian, S.-f.; Chen, N.-s.; Mahfuzr, R.; Javed, I. Effects of loose deposits on debris flow processes in the Aizi Valley, southwest China. J. Mt. Sci. 2020, 17, 156–172. [Google Scholar] [CrossRef]
  20. Hu, T.; Huang, R.-q. A catastrophic debris flow in the Wenchuan Earthquake area, July 2013: Characteristics, formation, and risk reduction. J. Mt. Sci. 2017, 14, 15–30. [Google Scholar] [CrossRef]
  21. Zhang, X.; Tang, C.; Li, N.; Xiong, J.; Chen, M.; Li, M.; Tang, C. Investigation of the 2019 Wenchuan County debris flow disaster suggests nonuniform spatial and temporal post-seismic debris flow evolution patterns. Landslides 2022, 19, 1935–1956. [Google Scholar] [CrossRef]
  22. An, H.; Ouyang, C.; Wang, F.; Xu, Q.; Wang, D.; Yang, W.; Fan, T. Comprehensive analysis and numerical simulation of a large debris flow in the Meilong catchment, China. Eng. Geol. 2022, 298, 106546. [Google Scholar] [CrossRef]
  23. Wieczorek, G.F.; Glade, T. Climatic Factors Influencing Occurrence of Debris Flows; Springer: Berlin/Heidelberg, Germany, 2005; pp. 325–362. [Google Scholar]
  24. Bel, C.; Liébault, F.; Navratil, O.; Eckert, N.; Bellot, H.; Fontaine, F.; Laigle, D. Rainfall control of debris-flow triggering in the Réal Torrent, Southern French Prealps. Geomorphology 2017, 291, 17–32. [Google Scholar] [CrossRef]
  25. Fang, K.; Tang, H.; Li, C.; Su, X.; An, P.; Sun, S. Centrifuge modelling of landslides and landslide hazard mitigation: A review. Geosci. Front. 2023, 14, 101493. [Google Scholar] [CrossRef]
  26. Guo, X.-J.; Cui, P.; Li, Y. Debris flow warning threshold based on antecedent rainfall: A case study in Jiangjia Ravine, Yunnan, China. J. Mt. Sci. 2013, 10, 305–314. [Google Scholar] [CrossRef]
  27. Guzzetti, F.; Peruccacci, S.; Rossi, M.; Stark, C.P. Rainfall thresholds for the initiation of landslides in central and southern Europe. Meteorol. Atmos. Phys. 2007, 98, 239–267. [Google Scholar] [CrossRef]
  28. Coe, J.A.; Kinner, D.A.; Godt, J.W. Initiation conditions for debris flows generated by runoff at Chalk Cliffs, central Colorado. Geomorphology 2008, 96, 270–297. [Google Scholar] [CrossRef]
  29. Baum, R.L.; Godt, J.W. Early warning of rainfall-induced shallow landslides and debris flows in the USA. Landslides 2010, 7, 259–272. [Google Scholar] [CrossRef]
  30. Guo, X.; Cui, P.; Li, Y.; Ma, L.; Ge, Y.; Mahoney, W.B. Intensity–duration threshold of rainfall-triggered debris flows in the Wenchuan earthquake affected area, China. Geomorphology 2016, 253, 208–216. [Google Scholar] [CrossRef]
  31. Nikolopoulos, E.I.; Crema, S.; Marchi, L.; Marra, F.; Guzzetti, F.; Borga, M. Impact of uncertainty in rainfall estimation on the identification of rainfall thresholds for debris flow occurrence. Geomorphology 2014, 221, 286–297. [Google Scholar] [CrossRef]
  32. Guo, X.; Cui, P.; Chen, X.; Li, Y.; Zhang, J.; Sun, Y. Spatial uncertainty of rainfall and its impact on hydrological hazard forecasting in a small semiarid mountainous watershed. J. Hydrol. 2021, 595, 126049. [Google Scholar]
  33. Shen, Y.M.; Chen, T.L.; Xiao, G.J.; Fu, Q.Y.; Qing, Z.Z.; Li, L.P. Rainstorm and Flood Calculation Manual of Medium and Small Basins in Sichuan Province, China; Sichuan Provincial Water Resources Department: Beijing, China, 1984. (In Chinese)
  34. Sichuan Province Hydrology and Water Resources Survey Compilation, China. Parameter Atlas of Rainstorm in Sichuan Province, China; Sichuan Province Hydrology and Water Resources Survey: Chengdu, China, 2010. (In Chinese)
  35. Manning, R. Fundamentals of Fluid Mechanics. Trans. Inst. Civ. Eng. Irel. 1891, 20, 161–207. [Google Scholar]
  36. Rice, C.; Kadavy, K.; Robinson, K. Roughness of loose rock riprap on steep slopes. J. Hydraul. Eng. 1998, 124, 179–185. [Google Scholar] [CrossRef]
  37. Munson, B.R.; Young, D.F.; Okiishi, T.H. Fundamentals of fluid mechanics. Oceanogr. Lit. Rev. 1995, 10, 831. [Google Scholar]
  38. Xu, M.D.; Feng, Q.H. Roughness of debris flows. In Proceeding of the First Conference of Chinese Research of Debris Flows, Chengdu China, April 1980; pp. 51–52. (In Chinese). [Google Scholar]
  39. Chien, N.; Wan, Z.H. Mechanics of Sediment Transport; ASCE Press: Reston, VA, USA, 1999. [Google Scholar]
  40. Chen, N.S.; Cui, P.; Liu, Z.G.; Wei, F.Q. Calculation of the debris flow concentration based on clay content. Sci. China E Technol. Sci. 2003, 46, 163–174. [Google Scholar] [CrossRef]
  41. Takahashi, T. Debris Flow Mechanics, Prediction and Countermeasures; Taylor & Francis: New York, NY, USA, 2007. [Google Scholar]
  42. Liu, L.; Xu, Z.X. Regionalization of precipitation and the spatiotemporal distribution of extreme precipitation in southwestern China. Nat. Hazards 2016, 80, 1195–1211. [Google Scholar] [CrossRef]
  43. Buytaert, W.; Celleri, R.; Willems, P.; De Bievre, B.; Wyseure, G. Spatial and temporal rainfall variability in mountainous areas: A case study from the south Ecuadorian Andes. J. Hydrol. 2006, 329, 413–421. [Google Scholar] [CrossRef]
  44. Korup, O. Geomorphic hazard assessment of landslide dams in South Westland, New Zealand: Fundamental problems and approaches. Geomorphology 2005, 66, 167–188. [Google Scholar] [CrossRef]
  45. Costa, J.E.; Schuster, R.L. The formation and failure of natural dams. Geol. Soc. Am. Bull. 1988, 100, 1054–1068. [Google Scholar] [CrossRef]
  46. Wei, F.; Gao, K.; Hu, K.; Li, Y.; Gardner, J.S. Relationships between debris flows and earth surface factors in Southwest China. Environ. Geol. 2008, 55, 619–627. [Google Scholar] [CrossRef]
  47. Schmocker, L.; Weitbrecht, V. Driftwood: Risk analysis and engineering measures. J. Hydraul. Eng. 2013, 139, 683–695. [Google Scholar] [CrossRef]
  48. Chen, J.; Liu, W.; Zhao, W.; Jiang, T.; Zhu, Z.; Chen, X. Magnitude amplification of flash floods caused by large woody in Keze gully in Jiuzhaigou National Park, China. Geomat. Nat. Hazards Risk 2021, 12, 2277–2299. [Google Scholar] [CrossRef]
  49. Piton, G.; Horiguchi, T.; Marchal, L.; Lambert, S. Open check dams and large wood: Head losses and release conditions. Nat. Hazards Earth Syst. Sci. 2020, 20, 3293–3314. [Google Scholar] [CrossRef]
  50. Stolle, A.; Langer, M.; Blöthe, J.H.; Korup, O. On predicting debris flows in arid mountain belts. Glob. Planet. Change 2015, 126, 1–13. [Google Scholar] [CrossRef]
  51. Huang, R.; Li, W.L. Analysis of the geo-hazards triggered by the 12 May 2008 Wenchuan Earthquake, China. Bull. Eng. Geol. Environ. 2009, 68, 363–371. [Google Scholar] [CrossRef]
  52. Tian, Y.; Xu, C.; Ma, S.; Xu, X.; Wang, S.; Zhang, H. Inventory and spatial distribution of landslides triggered by the 8th August 2017 MW 6.5 Jiuzhaigou earthquake, China. J. Earth Sci. 2019, 30, 206–217. [Google Scholar] [CrossRef]
  53. Zhou, W.; Tang, C.; Van Asch, T.W.; Chang, M. A rapid method to identify the potential of debris flow development induced by rainfall in the catchments of the Wenchuan earthquake area. Landslides 2016, 13, 1243–1259. [Google Scholar] [CrossRef]
  54. Underwood, S.J.; Schultz, M.D.; Berti, M.; Gregoretti, C.; Simoni, A.; Mote, T.L.; Saylor, A.M. Atmospheric circulation patterns, cloud-to-ground lightning, and locally intense convective rainfall associated with debris flow initiation in the Dolomite Alps of northeastern Italy. Nat. Hazards Earth Syst. Sci. 2016, 16, 509–528. [Google Scholar] [CrossRef]
  55. Fang, K.; Dong, A.; Tang, H.; An, P.; Wang, Q.; Jia, S.; Zhang, B. Development of an easy-assembly and low-cost multismartphone photogrammetric monitoring system for rock slope hazards. Int. J. Rock Mech. Min. Sci. 2024, 174, 105655. [Google Scholar] [CrossRef]
  56. Jakob, M.; Owen, T.; Simpson, T. A regional real-time debris-flow warning system for the District of North Vancouver, Canada. Landslides 2012, 9, 165–178. [Google Scholar] [CrossRef]
  57. Hu, G.; Liu, M.; Chen, N.; Zhang, X.; Wu, K.; Raj Khanal, B.; Han, D. Real-time evacuation and failure mechanism of a giant soil landslide on 19 July 2018 in Yanyuan County, Sichuan Province, China. Landslides 2019, 16, 1177–1187. [Google Scholar] [CrossRef]
Figure 1. Location and geological background of the study area. (a) the location of the study area; (b) a map showing the simplified geological background and earthquakes around the study area; (c) the location of the rain gauge station and four catchments adjacent to the Heishui catchment; (d) a map of lithology and villages and field work sites.
Remotesensing 16 01547 g001
Figure 2. Field measurement of particle size (>60 mm) (a) and sampling of debris flow deposition (b).
Remotesensing 16 01547 g002
Figure 3. Comparison of remote sensing images before and after the debris flow event. (a) Sentinel-2A image of the Heishui catchment; (bd) Sentinel-2A images of the debris flow-forming zone; (e) JL1 images of the intersection area of the LCG and HSG.
Remotesensing 16 01547 g003
Figure 4. Particle size (≤60 mm) distribution of the debris flow samples in the study area.
Remotesensing 16 01547 g004
Figure 5. Characteristics of channel erosion, accumulation, and discharge changes during debris flow movement. (a) channel erosion and accumulation changes and the location of cross-sections and photo in Figure 9; (b,c) photos of channel erosion and deposition; (d) debris flow peak discharge and the longitudinal channel profile of the LCG to the outlet of the main channel corresponding to (a).
Remotesensing 16 01547 g005
Figure 6. Deposition and damage in the downstream section of the main channel. (a) UAV image taken in June 2022; (b) buildings and bridges swept away in damaged areas. (cg) photograph of damaged buildings and a buried bridge taken on 2 August.
Remotesensing 16 01547 g006
Figure 7. Antecedent hourly rainfall and cumulative rainfall prior to 11 to 12 July 2022, for the rain gauge stations around the Heishui catchment.
Remotesensing 16 01547 g007
Figure 8. Photos of debris flow disasters at the outlet of the Ziyili and Yishi catchments. (a,b) photograph showing damaged houses and the temporary blockage of the Duobu River caused by the Ziyili debris flow. (c,d) photograph of a silted channel and house damaged by the Yishida debris flow.
Remotesensing 16 01547 g008
Figure 9. Aerial image and photographs of the channel environment around boulder blockage sites. (a) aerial image of the channel and location of each photo; (b,c) size and shape of the boulder dam, and bamboo was washed down toward the flow vortex; (d) bank collapse caused by erosion downstream of the boulder blockage and outburst site; (e) erosion upstream of the boulder blockage site.
Remotesensing 16 01547 g009
Figure 10. Boulders and their development environment. (a) rock cells are developed on the right bank of the channel (camera direction: northeast); (b) rock blocks cut by joint fissures on the left bank (camera direction: northwest); (c) a large boulder downstream of the blockage site; and (d) large boulders scattered on the left bank slope of the blockage site (red circle represents a man as a reference).
Remotesensing 16 01547 g010
Table 1. Remote sensing and DEM data.
Data TypeTimeResolution (m)Image TypeSource
Remote sensing images2022/6/2310Sentinel-2Ahttps://scihub.copernicus.eu/dhus/#/home
(accessed on 10 September 2022)
2022/7/23Sentinel-2A
2022/5/50.63JL-1Ahttps://www.jl1mall.com
(accessed on 12 August 2022)
2022/7/20JL-1A
Aerial images2022/8/20.1UAVField measurement
DEM2022/8/20.1UAV
ALOS DEM2011/2/2512.5mALOShttps://search.asf.alaska.edu/
(accessed on 14 August 2022)
Table 2. The parameters and results of hourly and 6 h rainstorm intensity at different frequencies in Heishui catchment.
FrequencyK1pH’1 (mm)H1p (mm)K6pH’6 (mm)H6p (mm)
1%2.872571.802.9145.00131.00
2%2.512562.802.5545.00114.80
5%2.052551.302.0745.0093.20
10%1.702542.501.7145.0077.00
Disclaimer/Publisher’s Note: The statements, opinions and data contained in all publications are solely those of the individual author(s) and contributor(s) and not of MDPI and/or the editor(s). MDPI and/or the editor(s) disclaim responsibility for any injury to people or property resulting from any ideas, methods, instructions or products referred to in the content.

