Article

Complementarity of Two Rice Mapping Approaches: Characterizing Strata Mapped by Hypertemporal MODIS and Rice Paddy Identification Using Multitemporal SAR

1
Faculty of Geo-Information and Earth Observation (ITC), University of Twente, Enschede 7500 AE, The Netherlands
2
International Rice Research Institute (IRRI), Los Baños 4031, Philippines
3
sarmap, Purasca 6989, Switzerland
*
Author to whom correspondence should be addressed.
Remote Sens. 2014, 6(12), 12789-12814; https://0-doi-org.brum.beds.ac.uk/10.3390/rs61212789
Submission received: 30 August 2014 / Revised: 30 November 2014 / Accepted: 15 December 2014 / Published: 22 December 2014

Abstract

:
Different rice crop information can be derived from different remote sensing sources to provide information for decision making and policies related to agricultural production and food security. The objective of this study is to generate complementary and comprehensive rice crop information from hypertemporal optical and multitemporal high-resolution SAR imagery. We demonstrate the use of MODIS data for rice-based system characterization and X-band SAR data from TerraSAR-X and CosmoSkyMed for the identification and detailed mapping of rice areas and flooding/transplanting dates. MODIS was classified using ISODATA to generate cropping calendar, cropping intensity, cropping pattern and rice ecosystem information. Season and location specific thresholds from field observations were used to generate detailed maps of rice areas and flooding/transplanting dates from the SAR data. Error matrices were used for the accuracy assessment of the MODIS-derived rice characteristics map and the SAR-derived detailed rice area map, while Root Mean Square Error (RMSE) and linear correlation were used to assess the TSX-derived flooding/transplanting dates. Results showed that multitemporal high spatial resolution SAR data is effective for mapping rice areas and flooding/transplanting dates with an overall accuracy of 90% and a kappa of 0.72 and that hypertemporal moderate-resolution optical imagery is effective for the basic characterization of rice areas with an overall accuracy that ranged from 62% to 87% and a kappa of 0.52 to 0.72. This study has also provided the first assessment of the temporal variation in the backscatter of rice from CSK and TSX using large incidence angles covering all rice crop stages from pre-season until harvest. This complementarity in optical and SAR data can be further exploited in the near future with the increased availability of space-borne optical and SAR sensors. This new information can help improve the identification of rice areas.

Graphical Abstract

1. Introduction

Rice is a staple food for more than half of the world’s population and the most important crop in low-income and lower-middle-income countries [1,2]. Its contribution as a staple food and source of income and employment is crucial to food security [3]. In 2012, rice was cultivated on about 163 million hectares of land that produced approximately 719 million tons of rice with 90% of it originating from Asia [4]. The timely provision of accurate spatial information on the rice crop supports policies and decisions on agricultural production and food security in the region [5].
Remote sensing can provide spatial and temporal information to characterize rice agro-ecological attributes [6], assess rice growth [7] and productivity [8]. It is also used to differentiate cropping patterns [9], detect cropping calendar [6] and the dynamic phenological stages of rice [10,11].
Passive and active sensors have different spatial, temporal and spectral characteristics that acquire different types of information at various levels of detail on the ground. Medium-resolution optical images such as SPOT [12,13], Landsat TM [14,15,16,17,18,19] and ETM [20] have been used successfully for paddy field delineation. Flood damage assessment in rice areas and detection of changes in rice area extent, composition and field conditions due to crop rotation, natural vegetation transformation and natural disasters (i.e., floods or storm) are other applications of medium-resolution satellite optical images [21]. However, some studies based on SPOT-XS [13], Landsat TM and MOS-1 [22] reported difficulties in mapping the extent of rice area because of small field sizes and land cover heterogeneity in the area. Persistent and heavy cloud cover conditions also pose a problem when using relatively low-temporal-resolution images such as SPOT or Landsat TM [23], especially during the rainy season for vegetation mapping [24].
Optical images with low spatial resolution such as MODIS, AVHRR and SPOT VEGETATION provide wide area coverage with a high temporal resolution. These satellite images are suitable for capturing the dynamic phenology of rice [11,25] and mapping and monitoring changes in cropping systems [26], cropping intensity [27], cropping patterns [28] and cropping calendars [6,29] by season using vegetation indices such as NDVI data. Several studies on the use of MODIS conducted in China [30,31] and South and Southeast Asia [32] showed that MODIS is effective for mapping, monitoring and characterizing rice-based cropping systems for vast areas.
Active sensors such as Synthetic Aperture Radar (SAR) use longer wavelengths (0.01 to 1 m) to acquire ground information. SAR penetrates clouds and obtains information regardless of weather and light conditions [8]. However, unusual weather such as intense localized events (rainfall or dense cloud cover) has been shown to affect high-frequency bands such as the X-band (2.4 to 3.8 cm) [33]. Despite this, SAR remains a reliable sensor for providing stable data quality and images at a chosen time [34].
Studies have shown the successful use of SAR data for rice mapping, monitoring and yield estimation [23,35,36,37]. SAR’s sensitivity to rice texture variations and flooded conditions, and its capability to capture the unique temporal backscatter signature of rice when observed throughout the crop season, makes SAR suitable for mapping cultivated rice area and monitoring growth [38]. Capturing the flooding stage in SAR images is essential for the correct identification of rice fields [39]. SAR images acquired at the right time to capture flooding [39] and early and late growth stages [40] improve rice crop identification. The availability of high-spatial-resolution SAR images with multitemporal resolution of 11 to 16 days such as Terra SAR-X and Cosmo Skymed (CSK) can be used to capture small patches of rice paddies.
Research on how the complementarity of both optical and SAR images can be used for comprehensive rice mapping to provide complete, timely and accurate spatial and temporal information on the rice crop is important in the agricultural sector. The use of low-resolution images such as MODIS can differentiate major land cover types [21] and provide an overview of the general situation on the ground. At a spatial resolution of 250 m, MODIS can be used for the delineation of land cover complexes with little information on the actual extent of individual land cover types. On the other hand, the use of a sensor with spatial resolution that is equal to or smaller than the size of the target fields can generate maps of currently irrigated croplands with high accuracy [41]. Rice maps derived from high-spatial-resolution SAR images, however, require multidate imagery to be acquired at the proper time for high accuracy.
The objective of this study is to generate complementary and comprehensive rice crop information from hypertemporal moderate-resolution optical imagery and multitemporal high-resolution SAR based on remote sensing data and field data in the Philippines. The study relies on MODIS data to stratify and characterize rice areas at a small scale and X-band SAR data from TSX and CSK to identify cropped rice fields at a large scale and to extract details on the actual dates of flooding/transplanting during two consecutive seasons.

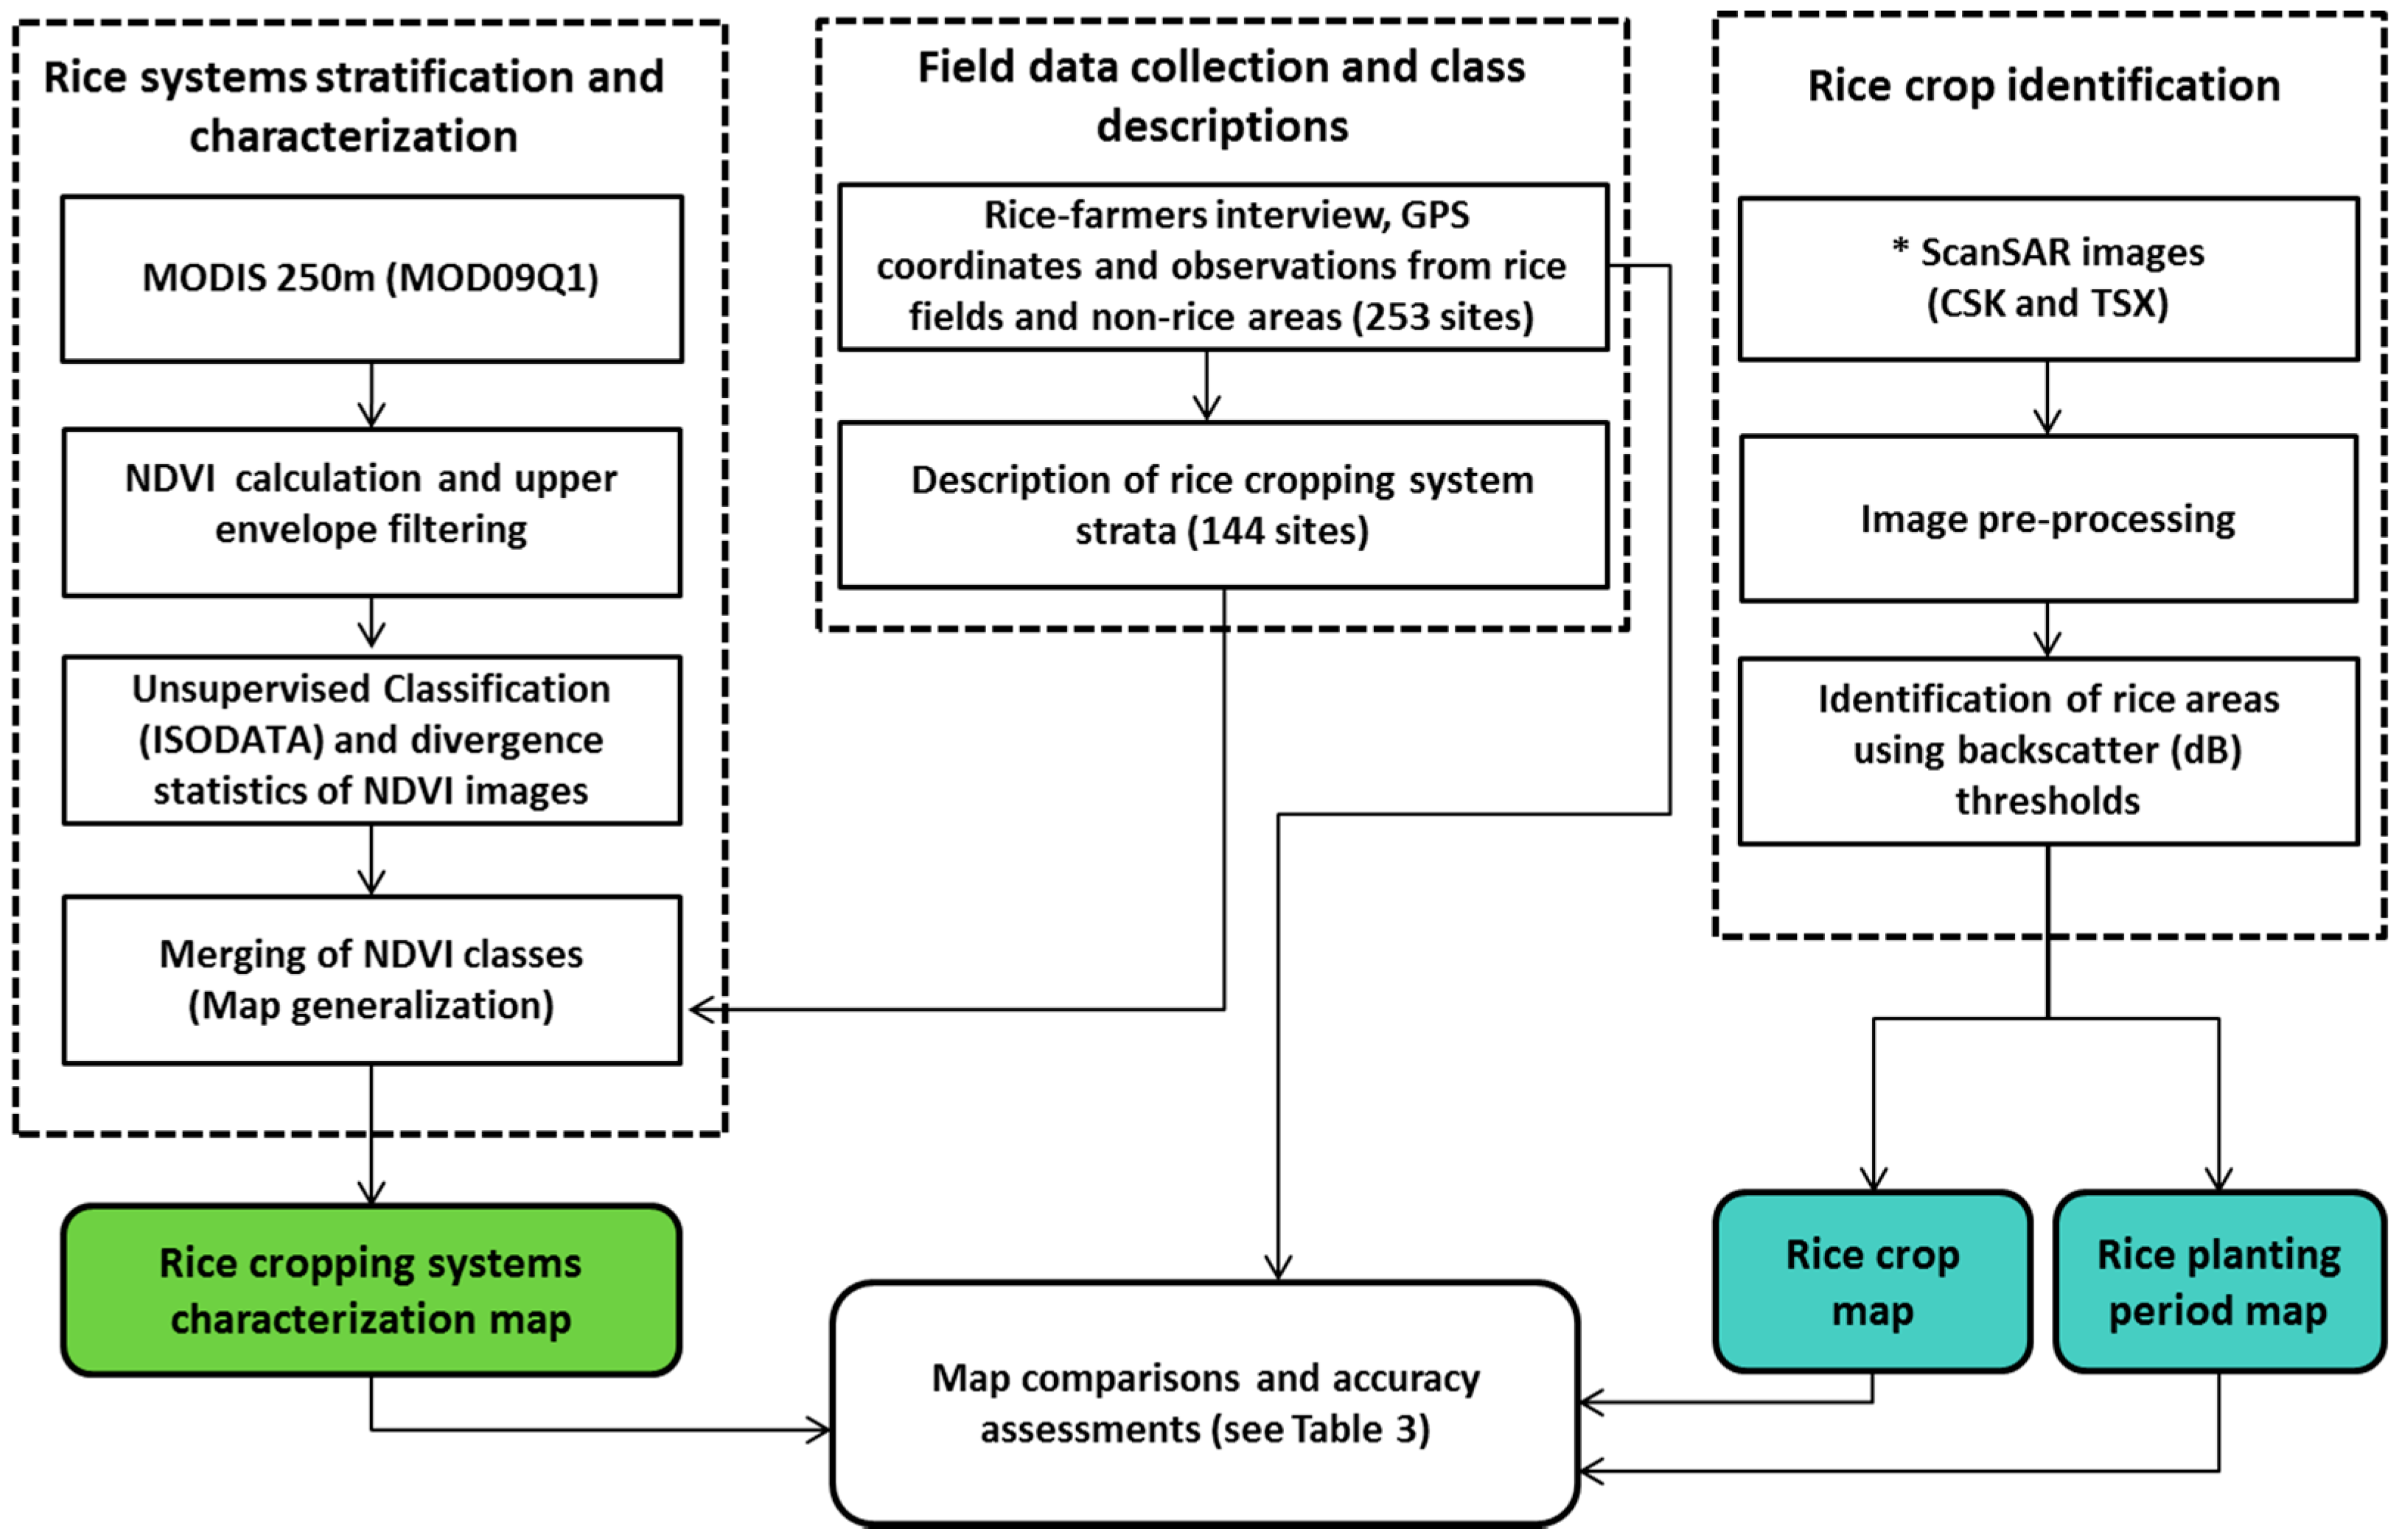
2. Materials and Methods

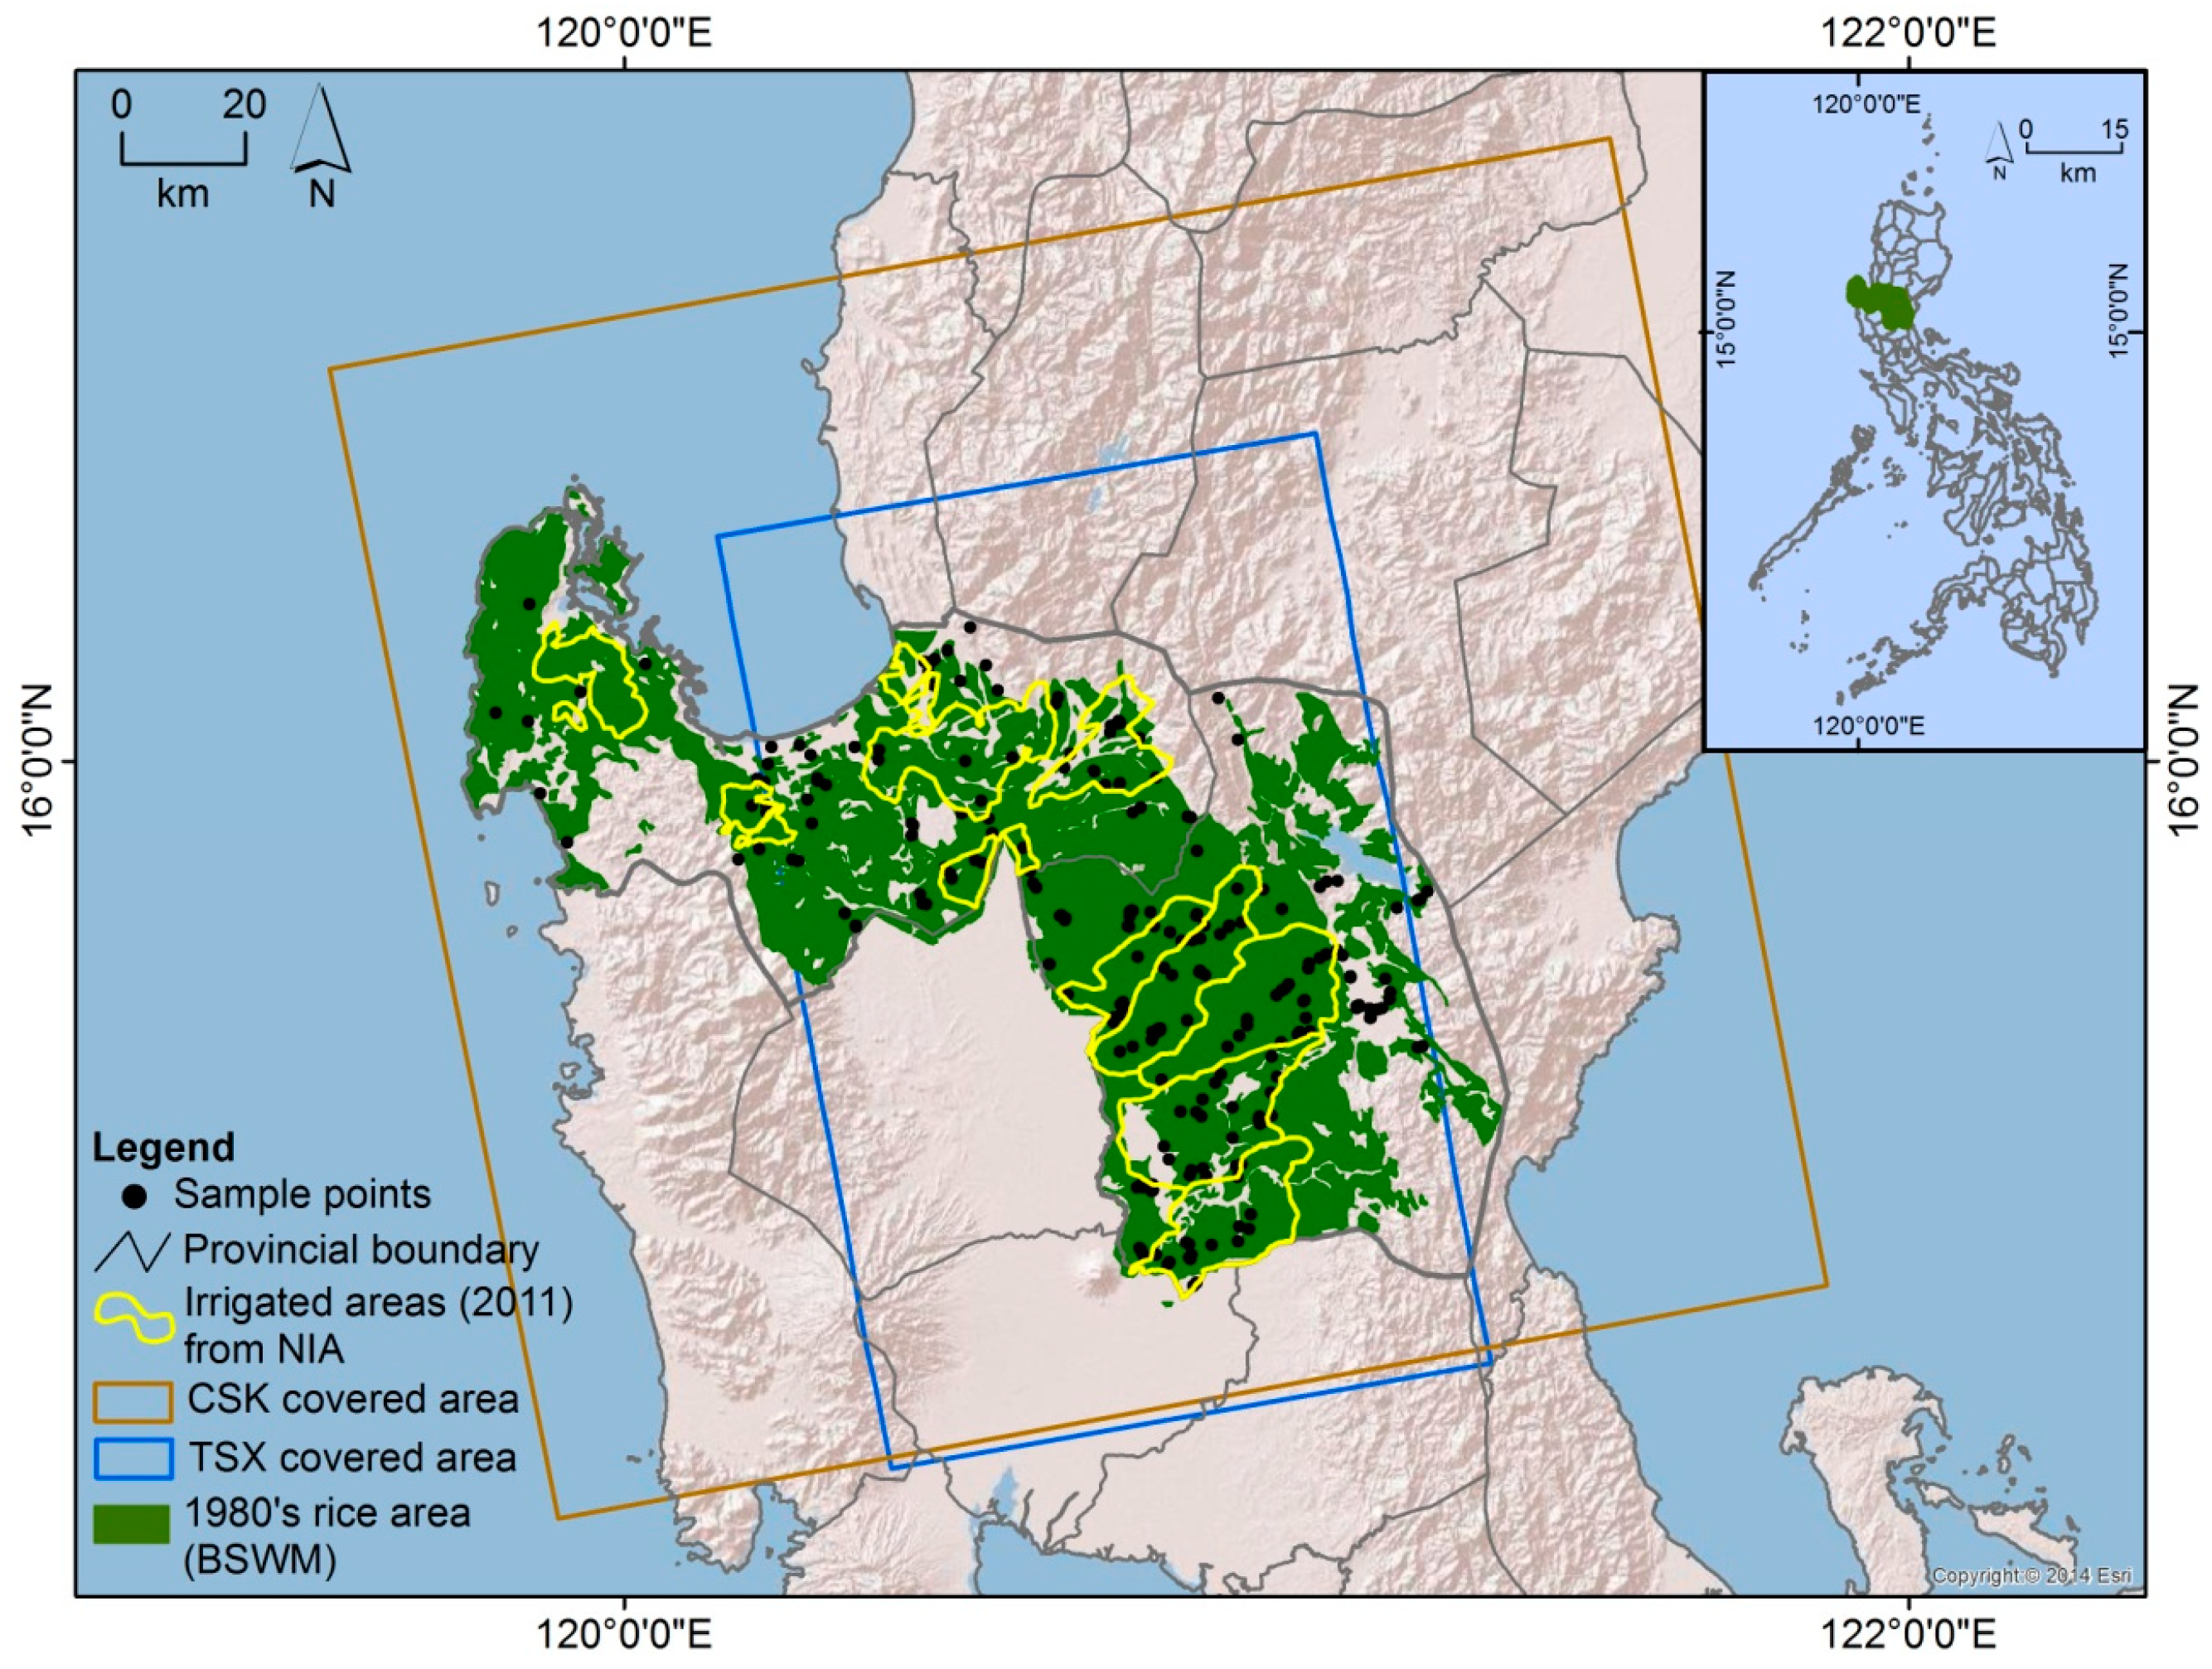
2.1. Study Area and Data

The study area covers the provinces of Nueva Ecija and Pangasinan located in Central Luzon, Philippines. These provinces are two of the main rice-growing areas in the Philippines that cover 25,878 km2 (Figure 1). Nueva Ecija is the highest rice-producing province, while Pangasinan ranks third, with the highest rainfed production in Luzon.
Nueva Ecija is characterized by a terrain that comprises mostly low alluvial plains in the west and in the southwest, and rolling uplands in the northeast. The topography of Pangasinan, on the other hand, is characterized by broad alluvial plains in the central part and mountainous regions in the northeast and in the west [42].
The study area has a distinct wet season (WS) and dry season (DS), with maximum rainfall expected to occur from July to August. In general, the first or WS crop is sown in June, planted in late June or in July and harvested in late September or in October. The second or DS crop is sown or planted between late December and early January and harvested in April. Most rice farmers practice direct-seeding during the DS and transplanting in the WS.
Land preparation (plowing, harrowing, leveling) in Nueva Ecija and Pangasinan generally takes 3–4 weeks before planting. The majority of rice fields are prepared under flooded conditions in which fields have standing water of about 2–3 cm for about 3–7 days until the soil is soft enough for tillage [43]. This is followed by leveling to remove high or low spots and ensure even water distribution and better weed control. Rice fields are usually planted 1 or 2 days after leveling.
In terms of rice production, irrigated rice is cultivated in areas where a national or communal irrigation system (NIS/CIS) is in place. These are large to medium-sized schemes supported by the National Irrigation Administration (NIA). Some small privately owned schemes also exist in the area. In general, two rice crops are cultivated annually in irrigated areas. Only one rice crop is cultivated during the WS in the remaining rainfed lowland areas, followed by fallow or a non-rice crop during the DS. There are very few upland rice areas characterized by unbounded fields with no water management.
Nueva Ecija is dominated by irrigated rice areas, which comprise 78% (138,157 ha) of the total physical area; the remaining 22% are rainfed (38,387 ha). In Pangasinan, 55% (98,313 ha) of the rice areas are irrigated, while 45% (82,001 ha) are rainfed [44], where the water supply is from rain and through groundwater pumping. Hence, the dry season rice area in Pangasinan is more fragmented than the more contiguous rice areas under surface water irrigation in Nueva Ecija.
Figure 1. Pangasinan and Nueva Ecija showing rice area in the 1980s (green). The brown and blue boxes delineate coverage of CSK and TSX SAR products, respectively. MODIS tile h29v07 completely covers the area. The yellow line shows the boundary of irrigated areas as reported by NIA (2011) and the sites for ground data collection are in black dots.
Remotesensing 06 12789 g001

2.1.1. MODIS Surface Reflectance 8-Day Composite

MODIS is a sensor onboard the Terra satellite launched by NASA into space in 1999 [45]. The MODIS collection 5 product MOD09Q1 (Table 1) was used as the hypertemporal optical remote sensing data source for stratification and rice characterization, which is available at 8-day composite with 250-m spatial resolution. It is one of the MOD09 products that estimate ground surface reflectance corrected for the effects of atmospheric gases and aerosols. Each pixel contains the best observation values within the 8-day period with low view angle and the minimum amounts of clouds, haze or cloud shadow and aerosol loading [46]. Each image contains red (band 1: 620 to 670 nm) and NIR (band 2: 841 to 876 nm), which were used to calculate NDVI (Equation (1)) [47]:
N D V I = N I R R e d N I R + R e d
Table 1. Characteristics of the series of satellite images acquired for rice mapping.
Satellite SpecificationsCosmo-Skymed (CSK)Terra SAR-X (TSX)Terra
Sensor (mode)ScanSARScanSARMODIS
Product (mode)Huge regionScanSARMOD09Q1 (h29v07)
Dates of acquisition6 December 201225 May 20132006–2011
22 December 20125 June 2013-
7 January 201316 June 2013-
23 January 201327 June 2013-
8 February 20138 July 2013-
24 February 201319 July 2013-
13 April 201330 July 2013-
-1 September 2013-
-12 September 2013-
-23 September 2013-
Band/wavelength (cm)X (3.12 cm)X (3.11 cm)Red (620–670)
NIR (841–876)
Repeat cycle (days)16118-day composite
Spatial resolution (m)30 (experimental)18.5250
Swath (km) width × length200 × 200100 × 1502330
PolarizationHHHH-
LookRightRight-
OrbitAscendingAscendingDescending
Incidence angle40°45°-

2.1.2. SAR Data

SAR multitemporal images from the Cosmo-SkyMed (CSK) ScanSAR Huge Region and TerraSAR-X (TSX) ScanSAR were used for the identification and mapping of rice areas and flooding/transplanting dates for the DS and WS.
CSK is a constellation of four X-band SAR satellites that became fully operational in 2010 under the mandate of the Italian Space Agency (ASI). The CSK Huge Region mode provides standard products with a resolution of 100 meters [48]. However, an experimental product with 30-m spatial resolution has been processed (Table 1) and provided for the purpose of this study. The experimental data were acquired for DS 2012 to 2013. The revisit period using the same satellite with the same observation angle is 16 days.
TerraSAR-X (TSX) is a German X-band satellite operated by the German Aerospace Center (DLR) that was launched in June 2007 and became fully operational in 2008. TSX ScanSAR images were acquired in WS 2013. The revisit period is 11 days and the spatial resolution is 18.5 m [49] (Table 1).

2.1.3. Stratification

Stratified random sampling was used for the selection of rice monitoring sites. The classes derived from a MODIS unsupervised classification were used as the strata for the random selection of monitoring sites (c.f. Section 2.2). A pre-test of the survey questionnaire (Figure S1) and the associated fieldwork activities (including GPS coordinate collection and site observations) and the travel time to go from one monitoring site to another were used as the basis to determine the number of samples that could be accomplished in one day. Budget, person-days, labor constraints and nearness to the road were additional considerations. Based on these, a sample size of 11 per class was used which was derived using the sample size equation (Equation (2)):
s a m p l e   s i z e     = n u m b e r   o f   p o i n t s   i n   o n e   d a y ×   n u m b e r   o f   w o r k i n g   d a y s n u m b e r   o f   c l a s s e s   f r o m   M O D I S   I S O D A T A   u n s u p e r v i s e d   c l a s s i f i c a t i o n = ( 8 × 20 ) / 14

2.1.4. Field Data Collection

During the 2012–2013 DS, 253 sites were visited, that is, 194 sites in rice areas and 59 in non-rice areas (Table 2). GPS coordinates were collected for each site. Interviews with farmers (Figure S1) were carried out to collect data on cropping systems, crop calendar (a sequential summary of periods of operations such as land preparation, planting and harvesting) [50] and rice ecosystem (irrigated or rainfed) [51]. Cropping system included sequential cropping information such as cropping intensity (the number of crops planted on the same field within a cropping year: single, double or triple) [6] and cropping pattern (temporal sequence of crops planted in an area for the WS and DS within a cropping year [52]: rice-rice, rice-other, other-rice, rice-fallow, fallow-rice).
Table 2. Number of rice fields and non-rice areas visited for data collection.
AreasWith Farmers’ Interviews and GPS CoordinatesWithout Farmers’ Interviews (Only GPS Coordinates and Observation—Used for Rice/Non-rice)Total
Rice16628194
Non-rice59-59
Field monitoring was carried out to determine the actual condition of rice fields at the time of every SAR acquisition. Separate data sets during the DS (33 fields) and WS (36 fields) were monitored (Table 3). The selected rice fields were observed and the field conditions such as land preparation status (plowed, harrowed, leveled, flooded, saturated), crop establishment, growth stages and weather condition at the time of the field visit were recorded. Actual dates of flooding and transplanting were acquired through interviews with farmers for the WS 2013.
Table 3. Number of rice fields used for the accuracy assessment of rice-based cropping system characteristics and rice area delineation.
SensorCropping System Information Tested for AccuracyNumber of Sites Used for Accuracy Assessment of MODISNumber of Sites Used for Accuracy Assessment of SAR within TSX-Covered Area
MODISRice or non-rice109-
Cropping intensity:
Single or double crop
(regardless of the crops planted)
81-
Single or double rice81-
Cropping pattern (rice-rice, rice-fallow, fallow-rice, rice-other crop)81-
Cropping calendar WS
Cropping calendar DS
81
81
-
-
Irrigated or rainfed81-
SARRice or non-rice (points within the TSX- covered area)-240
Flooding/transplanting DS-33
Flooding/transplanting WS-36

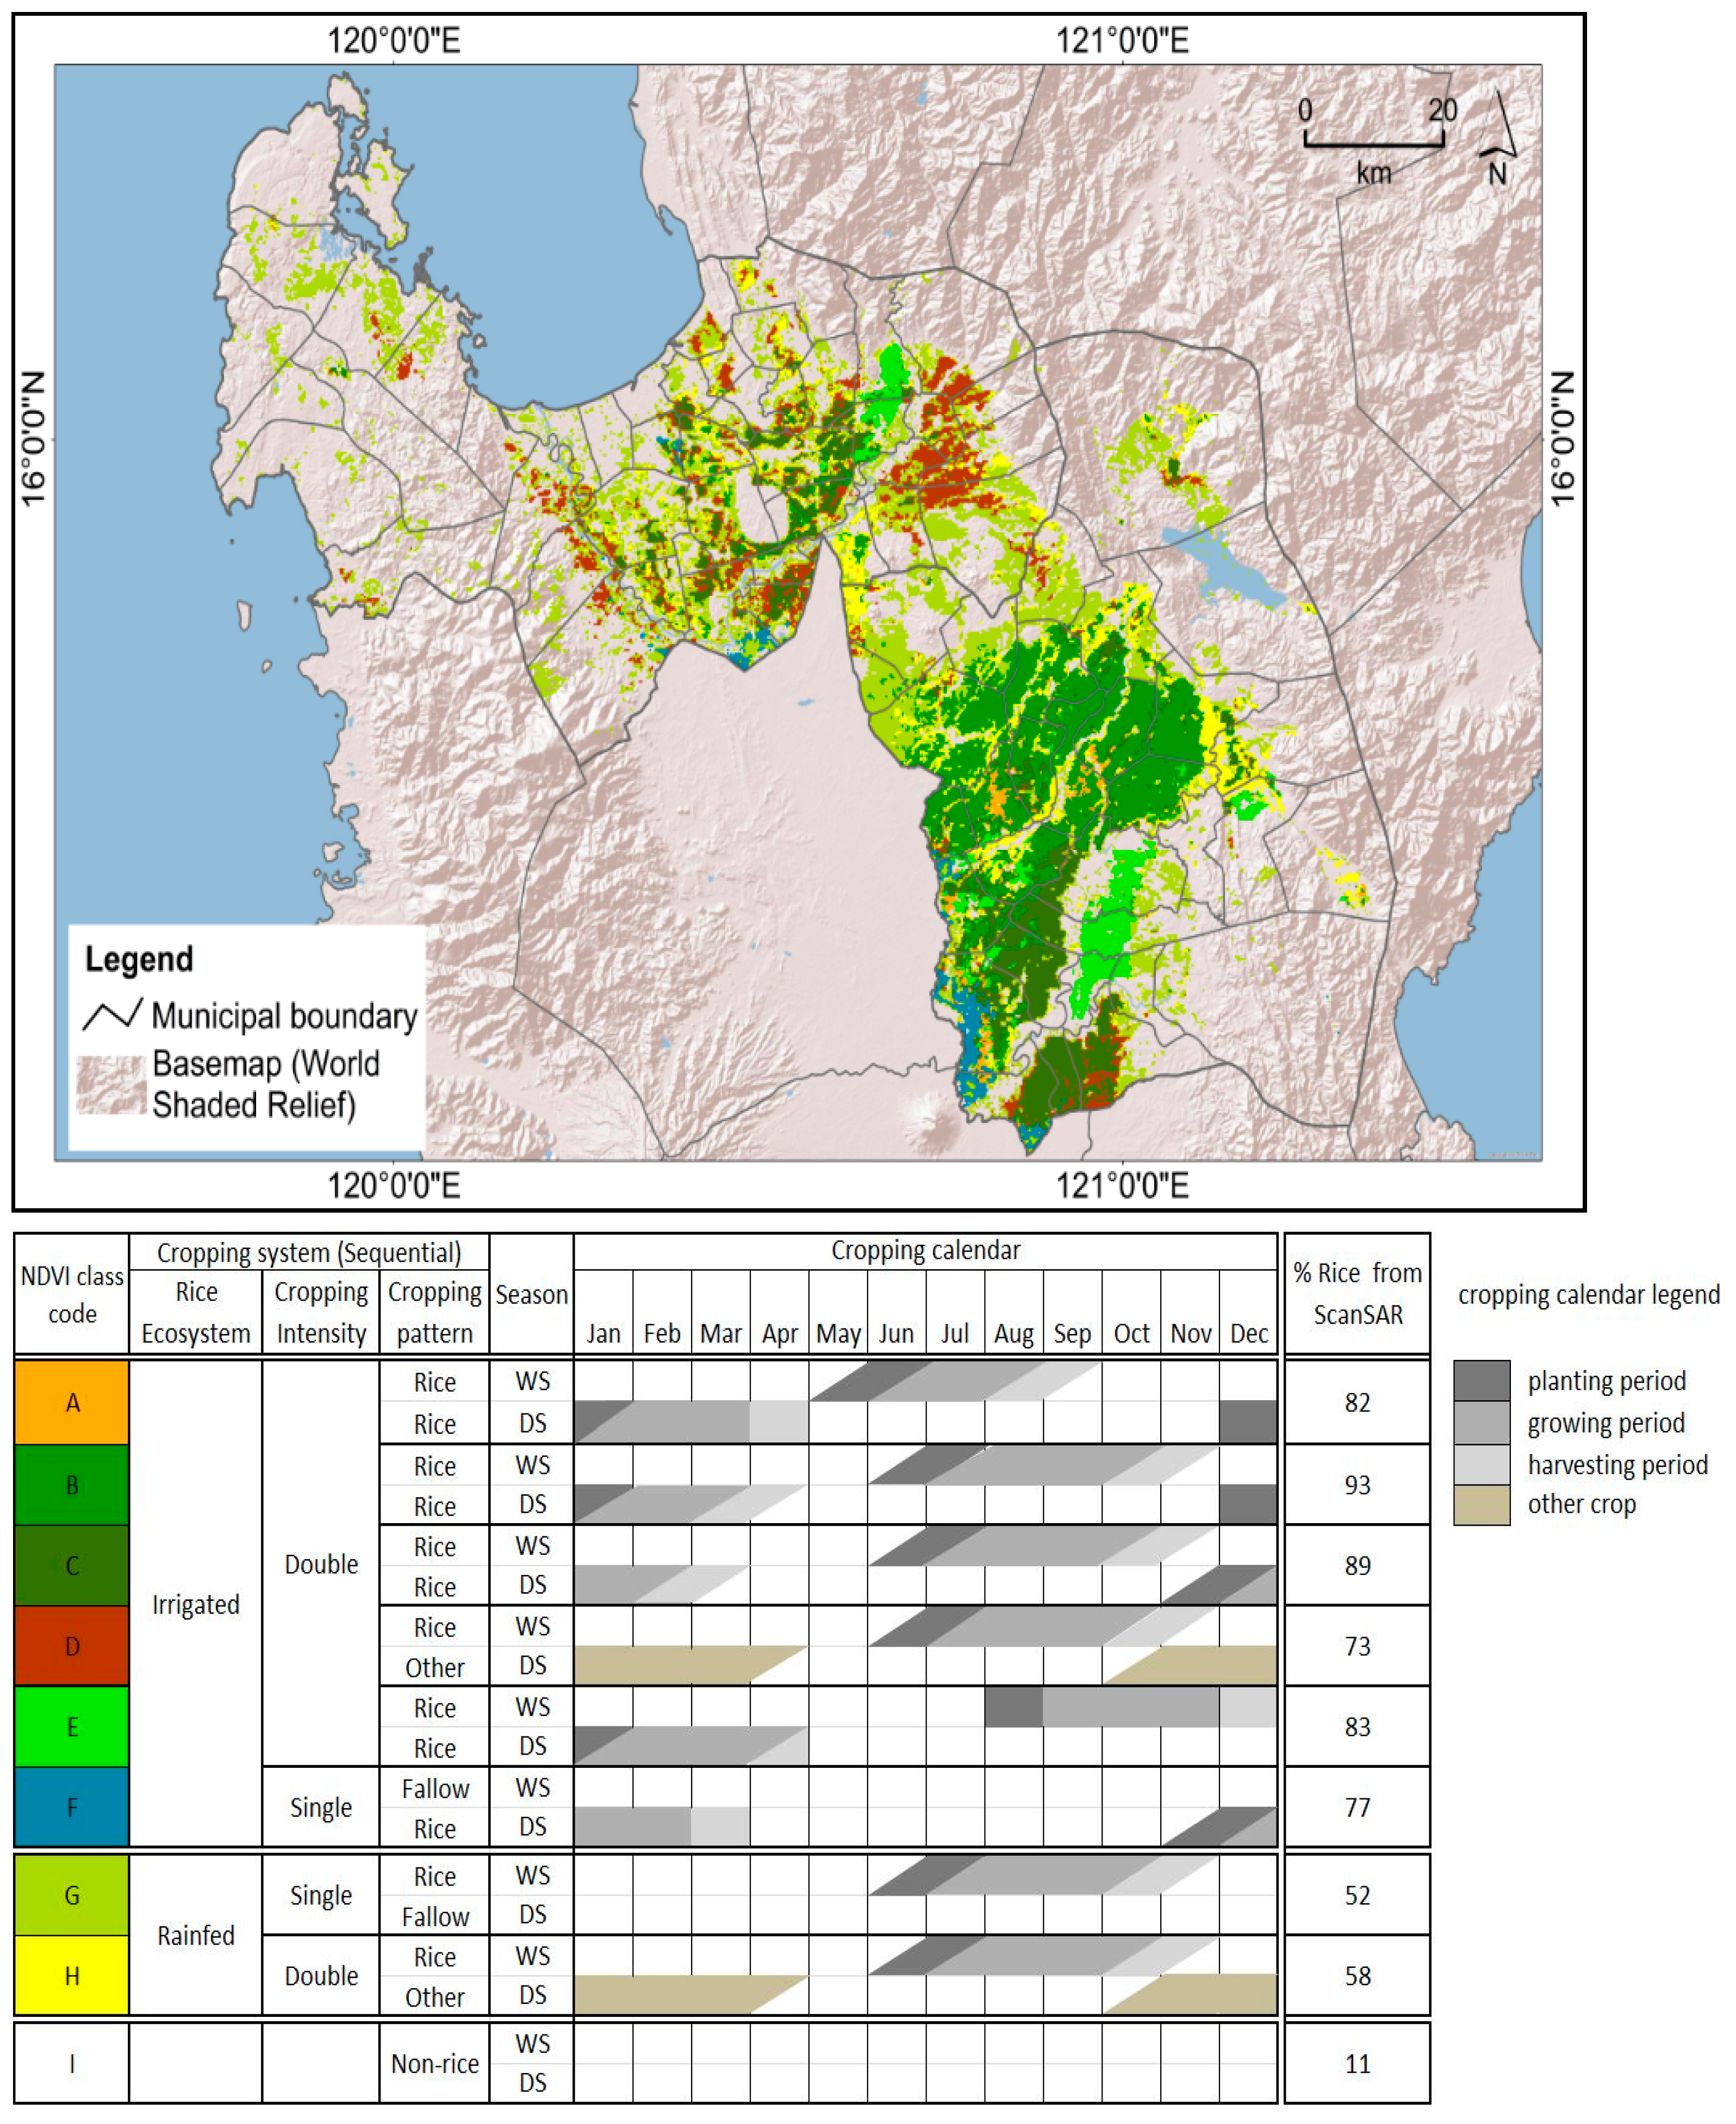
2.2. MODIS-Based Rice System Stratification and Characterization

Figure 2 shows the integrated flow chart for rice stratification and characterization using MODIS data and rice crop identification using SAR data. Hypertemporal MODIS NDVI images were processed to generate strata that reflect differences in practiced cropping systems.
MODIS 8-day composite images from 2006 to 2011 were used for deriving 276 NDVI images. Linear stretching was applied to generate the digital NDVI numbers (DN), where −1, the minimum NDVI value, was assigned to 0 and the maximum NDVI value of 1 to 255. The upper envelope of the NDVI time series was derived using the adaptive Savitzky-Golay filter in TIMESAT [53,54,55] (Figure S2) and the resulting time series was classified using the ISODATA [56] clustering algorithm through unsupervised classification [9,57,58,59].
Each ISODATA run was evaluated using the divergence distance measure [60] that assesses the clustering signature separability. The highest positive deviation from the trend in average divergence indicates a solution in number of classes that can be extracted from the time series [9,59]. The extraction of 115 classes provided an optimal stratification for the NDVI time series. As described, the temporal signatures of the 115 NDVI classes (Figure S3) were evaluated for merging the likely non-rice class into one.
Differentiation of the rice and non-rice strata based on their temporal NDVI profiles was carried out using the existing 1980s rice area map, visual interpretation of Google Earth imagery, experts’ knowledge and opinion exchanges among authors. The field data were randomly divided into two parts. One part (144 points) was used to define the classes, that is, to assign the corresponding rice-based cropping system characteristics (collected on the ground and from farmers’ interviews) to each of the eight NDVI classes.
Figure 2. Flow chart of data processing method. The asterisk (*) indicates the use of MODIS in determining the dates for acquisition of ScanSAR images.
Remotesensing 06 12789 g002

2.3. SAR-Based Rice Crop Identification and Planting Period Mapping

2.3.1. Basic Processing of Multitemporal SAR Images

SAR images were acquired over the study area for the DS (2012 to 2013) and WS (2013) to identify rice areas and determine flooding/transplanting dates based on time-series analysis of the backscatter coefficient (dB). The set of CSK and TSX ScanSAR images in Single Look Complex (SLC) format was processed separately using MAPscape-RICE, a semi-automated software developed by sarmap. The SLC data were transformed into a terrain geocoded backscatter coefficient by following these processing steps [33,61]:
(1)
Strip mosaicking and multilooking—single frames in slant range geometry with the same orbit were mosaicked along their azimuth to facilitate data processing and handling. Multilooking was carried out to improve SAR image quality through a reduction in speckle and to obtain approximately square pixels [62]. Averaging of range and resolution cells generates the multilooked images [63].
(2)
DEM-based orbital correction—SRTM 90 m Digital Elevation Model (DEM) tiles were used for the orbital correction. Errors of the azimuth start time and/or slant range distance were corrected on the basis of a reference DEM.
(3)
Co-registration—strip mosaics covering the same area with the same geometry and mode were co-registered by gross shift estimation based on orbital data. A set of sub-windows based on reference image and images to be used for co-registration was then automatically identified. The shift between pixels, including elevation, was calculated through cross-correlation. Polynomial function was used to calculate the shifts to be applied in azimuth and range direction [61].
(4)
De Grandi time-series filtering—a balance of differences in reflectivity between images at different times was achieved with the use of an optimum weighting filter [64]. Multitemporal filtering is based on the assumption that SAR geometry is the same for all acquisitions. The reflectivity can change because of dielectric and geometrical properties but not because of a different position of the resolution element with respect to the radar [61].
(5)
Terrain geocoding, radiometric calibration and normalization—conversion of backscatter elements into slant range image coordinates was carried out using a DEM as a backward solution. Range-Doppler equations [65] were used in the transformation of two-dimensional coordinates of the slant range image to three-dimensional object coordinates in a cartographic reference system. Geometric and radiometric calibration of the backscatter values is necessary for inter-comparison of radar images acquired at different times with different sensors and/or different viewing geometries [63]. Radiometric calibration was performed using a radar equation that takes into consideration the scattering area, antenna gain patterns and range spread loss. The backscatter coefficient (σ°) was normalized to compensate for the range dependency using the cosine law of the incidence angle [61].
(6)
Anisotropic Non-Linear Diffusion (ANLD) filtering—the ANLD filter performs strong smoothing in homogeneous areas while preserving signal variations coming from neighboring areas [61] and linear structures (e.g., roads, rivers and field edges). A diffusion equation was used wherein the diffusion coefficient is a function of image positions and assumes a tensor value [66].
(7)
Removal of cloud-related effects from localized intense weather events—anomalous peaks or troughs caused by localized intense events were identified through the analysis of temporal σ°, which was corrected using an interpolator. A priori information on the cropping calendar and weather conditions at the time of image acquisition is necessary for correct interpretation of these events [33,61].
These processing steps were carried out in an almost fully automatic way to allow the analysis and interpretation of the multitemporal backscatter signature.

2.3.2. Rice Detection Algorithm and Threshold Selection

After the SAR data processing, specific thresholds (Table 4) were set in MAPscape-RICE to identify and map rice as well as the flooding/transplanting dates for each season. Flooded soils, which are a unique characteristic of paddy rice fields [7,30], are characterized by low SAR backscatter that makes them easily separable from other areas with no surface water and certain ground roughness. Stable water has a low average backscatter (i.e., a low mean value measured across the whole multitemporal series) compared with rice. Built-up areas, on the other hand, show higher average backscatter than rice [34]. In general, rice can be discriminated from other crops that are not inundated during the planting and vegetative stage if the multitemporal acquisition series is properly synchronized with the cropping calendar. The minimum rice cycle duration is 90–100 days [67] increasing to 140–150 in temperate latitudes [68]. The majority of rice farmers plant a 110-120-day rice variety in the Philippines. Figure 3 shows examples of temporal backscatter signatures for different land covers.
Figure 3. Example of a temporal backscatter signature from different land covers derived from CSK (left) and TSX (right).
Remotesensing 06 12789 g003
The algorithm used to identify the rice crop using multitemporal images is very similar to the algorithm that is fully documented in [61] and the parameters (P) we used for rice detection are shown in Table 4. We first excluded non-rice areas such as permanent water bodies (P5) where there is a stable low backscatter and built-up areas (P6) where there is a stable high backscatter (Figure 3). Areas that exhibit non-permanent, longer duration flooding (P7) such as fishponds, irrigation tanks and seasonal wetlands and other seasonal field crops that show larger variation (P4) in backscatter from the growth in biomass were also masked out. The remaining unmasked pixels undergo a stepwise process to look for agronomic flooding where a drop, that is, the lowest value in the temporal signature of rice is, observed (P1). This marks the start of the rice growing cycle (SoS) and is also identified as the flooding/transplanting date. Once agronomic flooding is detected, we look for a rapid increase in biomass that confirms that rice is grown. The parameters used to detect rice growth are PoS (P2), span of SoS to PoS (P3), minimum growth (P4) and minimum rice cycle duration (P8). If the flooding period was not captured in any of the image acquisitions, the same parameters in detecting rice growth are used [61]. The non-rice area exclusion and rice growth detection through a rapid increase in biomass are also similar to the criteria used for rice paddy mapping using MODIS time-series data [32].
Selection of thresholds was guided by the backscatter coefficient extracted from the monitored sites. For every image acquisition, field visits were carried out at the selected sites to link the backscatter values with the corresponding land preparation condition and growth stages. From this, simple statistics such as the minimum, maximum, mean and range were calculated to set the ceiling for the threshold selection. Table 4 describes the threshold parameters used for the identification of rice areas and flooding/transplanting dates.
The rice identification using thresholds generated rice maps with 15-m pixel size for CSK and 10 m for TSX (these values correspond to the pixel sampling of the original SAR products). The pixel size follows the Nyquist sampling theorem, wherein a sampling rate higher than the real pixel resolution (i.e., half of the resolution cell) [69] is required for “perfect” interpolation fidelity.
Table 4. Threshold parameters for rice identification and detection of flooding/transplanting dates.
Parameter CodeParameterDescriptionRelationship between
ParameterBackscatter Coefficient
from Growth Stage
P1SoS Rice (dB)Start of season (SoS), flooded rice fields (maximum admitted backscatter)<maxleveled flooded
P2PoS Rice (dB)Peak of season (PoS), tillering (minimum admitted backscatter)>mintillering to stem elongation
P3Span of SoS to PoS (dB)Backscatter increase from flooding to tillering>min rangefrom leveled flooded to tillering-stem elongation
P4Minimum growth (dB)Minimum backscatter absolute difference from the beginning to the end of the rice crop season>min rangefrom leveled flooded to maturity
P5Stable water (dB)Permanent water backscatter<max-
P6Built-up mean (dB)Average backscatter of built-up or strong stable scatterers>min-
P7Stable water (days)Minimum number of days for the water to stay below the “Stable Water dB” threshold ≥20 days-
P8Minimum rice cycle duration (days)Minimum duration of the observed rice growth >60 days-

2.4. Accuracy Assessment
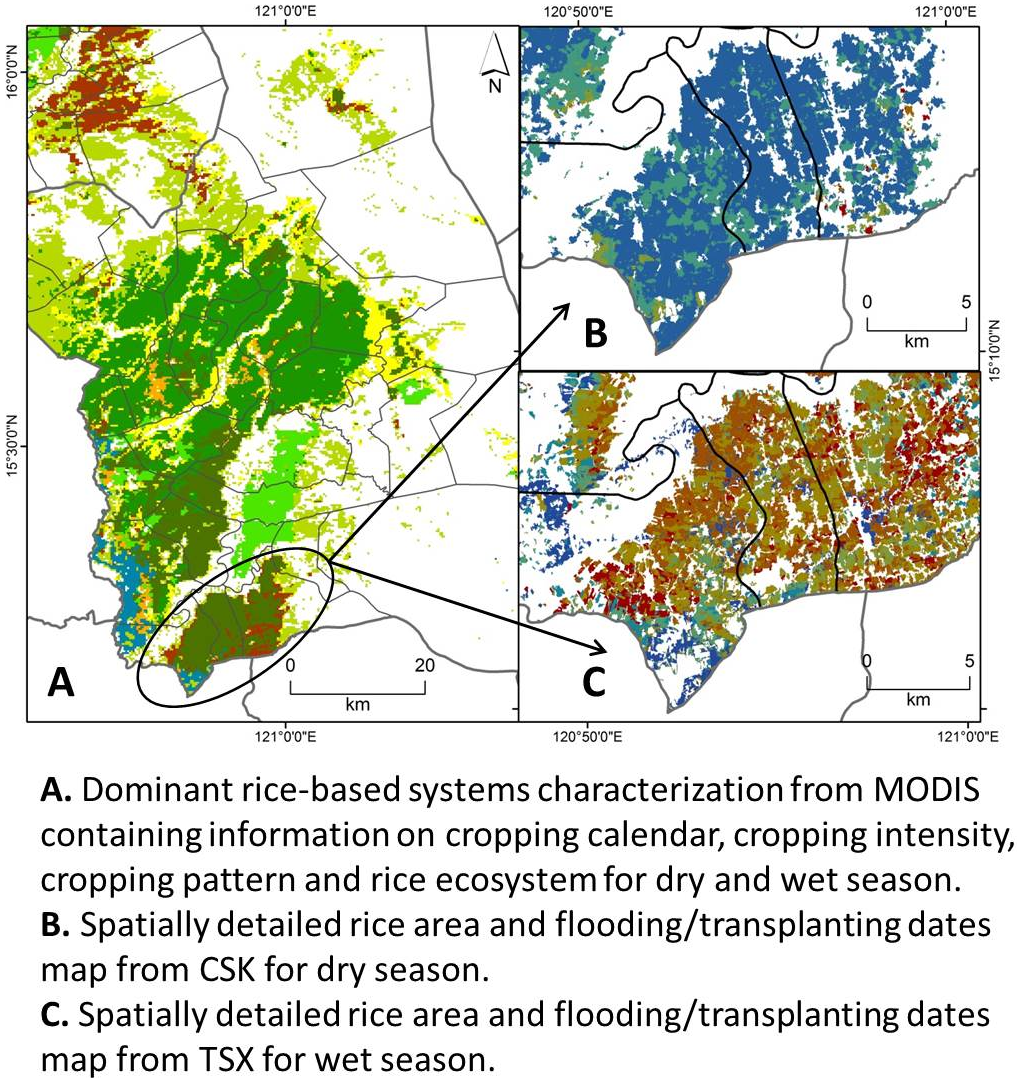
Accuracy assessment of the MODIS-derived rice map was based on the kappa coefficient and confusion matrix (Tables S1-S8) showing the correctly classified pixels with reference to ground-truth points [70]. The rice map generated from MODIS was evaluated using 109 points (the rest of the points were used for defining the classes derived from ISODATA clustering) with ground information indicating whether an area is rice or non-rice. Assessment of rice cropping intensity required ground information on the number of times an area is planted with rice in a year for the WS and DS (single or double rice), while cropping intensity is compared to information on the number of crops planted in a year regardless of whether it is rice or another crop. Cropping pattern accuracy assessment used the sequential pattern indicating the type of crops planted in a year (rice-rice, rice-fallow, rice-other, fallow-rice). The crop calendar for WS and DS was assessed separately using ground information on the general planting dates.
The spatially detailed rice area map generated from SAR was evaluated using 240 points of rice/non-rice ground information that covers the TSX footprint (Table 3). Root Mean Square Error (RMSE) was used to determine the difference between the actual flooding/transplanting dates (from farmers’ interviews and ground observations) and the dates derived from TSX. An RMSE of less than 11 days indicates good detection of planting dates using TSX ScanSAR multitemporal images. The relationship between the actual planting dates and the TSX-derived dates was assessed using the coefficient of determination (R2). DS flooding/transplanting dates derived from CSK ScanSAR were not assessed for their accuracy due to the lack of ground information on the actual planting and sowing dates.

3. Results

3.1. MODIS-Based Rice Stratification and Characterization

A rice characteristics map was generated using ISODATA unsupervised classification of MODIS-derived NDVI images. From the preliminary result of 115 classes, all non-rice classes were merged into one, and the remaining possible rice classes with similar NDVI temporal profiles (Figure S3) were merged based on the visual assessment of signature similarity. This resulted in a map with 13 rice classes and one non-rice class. Field data on the characteristics of different rice cropping systems were used to describe and assign cropping systems to the MODIS-derived NDVI strata or classes. The 13 rice classes were merged into nine classes (Figure 4) based on similarity in cropping calendars. The final stratified rice map contains the following information on rice cropping systems: cropping calendar, cropping intensity, cropping pattern and rice ecosystem (irrigated or rainfed).
Accuracy assessment of the rice-based cropping system characteristics map using the ground data showed an overall accuracy of 87.2% for rice or non-rice and 82.7% for cropping intensity (Table 5). The confusion matrix is in the supplementary information Tables S1-S8. In the case of rice ecosystem discrimination (74.1%), the result shows that, inside the boundary of NIA irrigation divisions, some rice fields are not receiving irrigation water and they are thus identified by farmers during the interview as rainfed.
Table 5. Accuracy assessment of the cropping system information derived from MODIS for the whole Nueva Ecija and Pangasinan provinces.
SensorRice Cropping SystemOverall Accuracy (%)Kappa CoefficientCorrectly Classified Pixels
MODISRice area (rice or non-rice)87.20.6295/109
Cropping intensity (single or double crop)82.70.7267/81
Rice cropping intensity (single or double rice)77.80.6663/81
Cropping pattern (sequential cropping types: rice-rice, rice-fallow, rice-other, fallow-rice) 77.80.7163/81
Cropping calendar WS75.30.6061/81
Cropping calendar DS61.70.5250/81
Rice ecosystem (irrigated or rainfed)74.10.6060/81
SARRice or non-rice90.40.72217/240
As we mapped more details such as rice cropping intensity (77.8%), cropping pattern (77.8%) and cropping calendar (WS: 75.3% and DS: 61.7%), the overall accuracy became lower. In summary, the results showed an overall accuracy of 61.7% to 87.2% with a kappa coefficient of 0.52 to 0.72 (Table 4). Higher accuracies were obtained for the most basic information layers, such as rice/non-rice or cropping intensity, and lower accuracies were obtained for the more thematically detailed information layers such as the cropping calendar.
Figure 4. MODIS-derived rice cropping systems and characteristics map.
Remotesensing 06 12789 g004

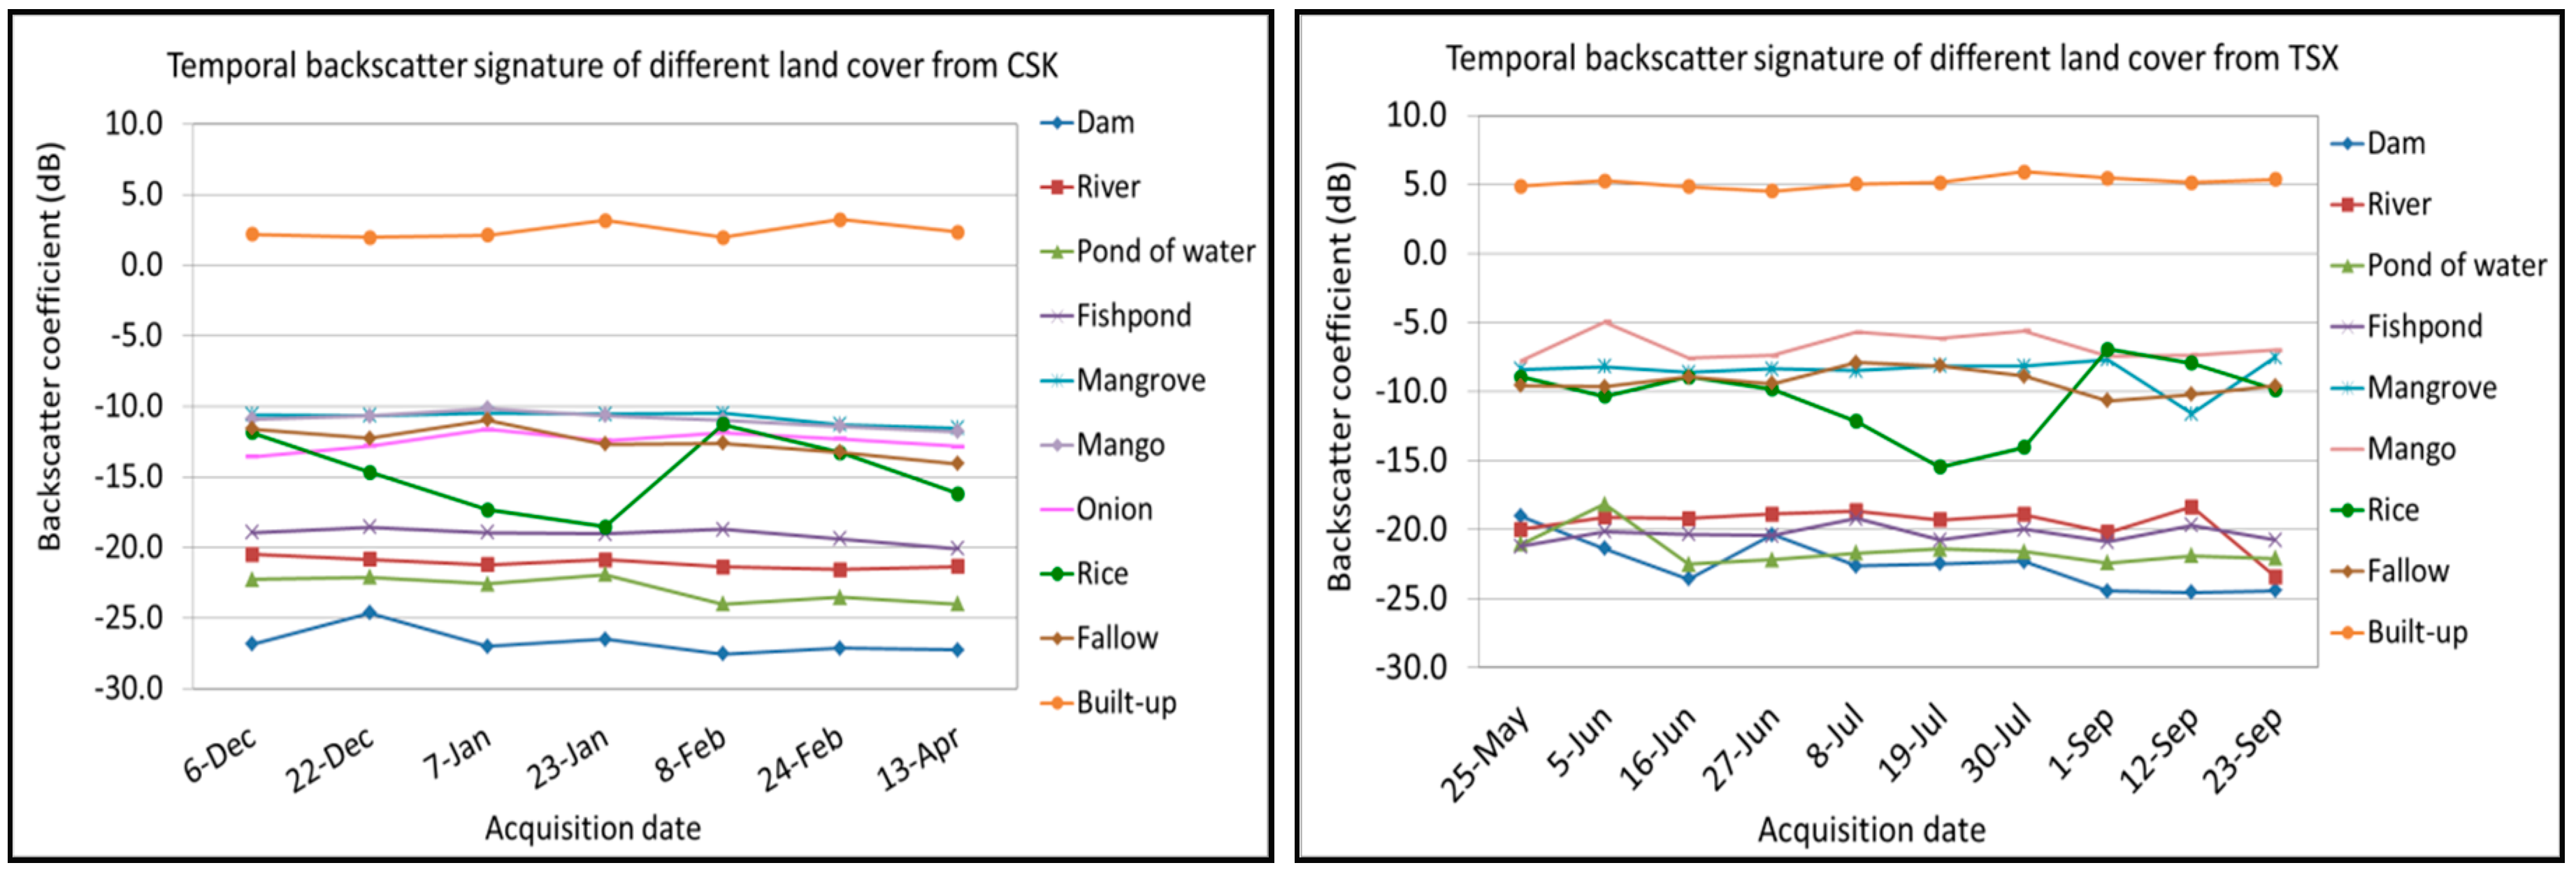
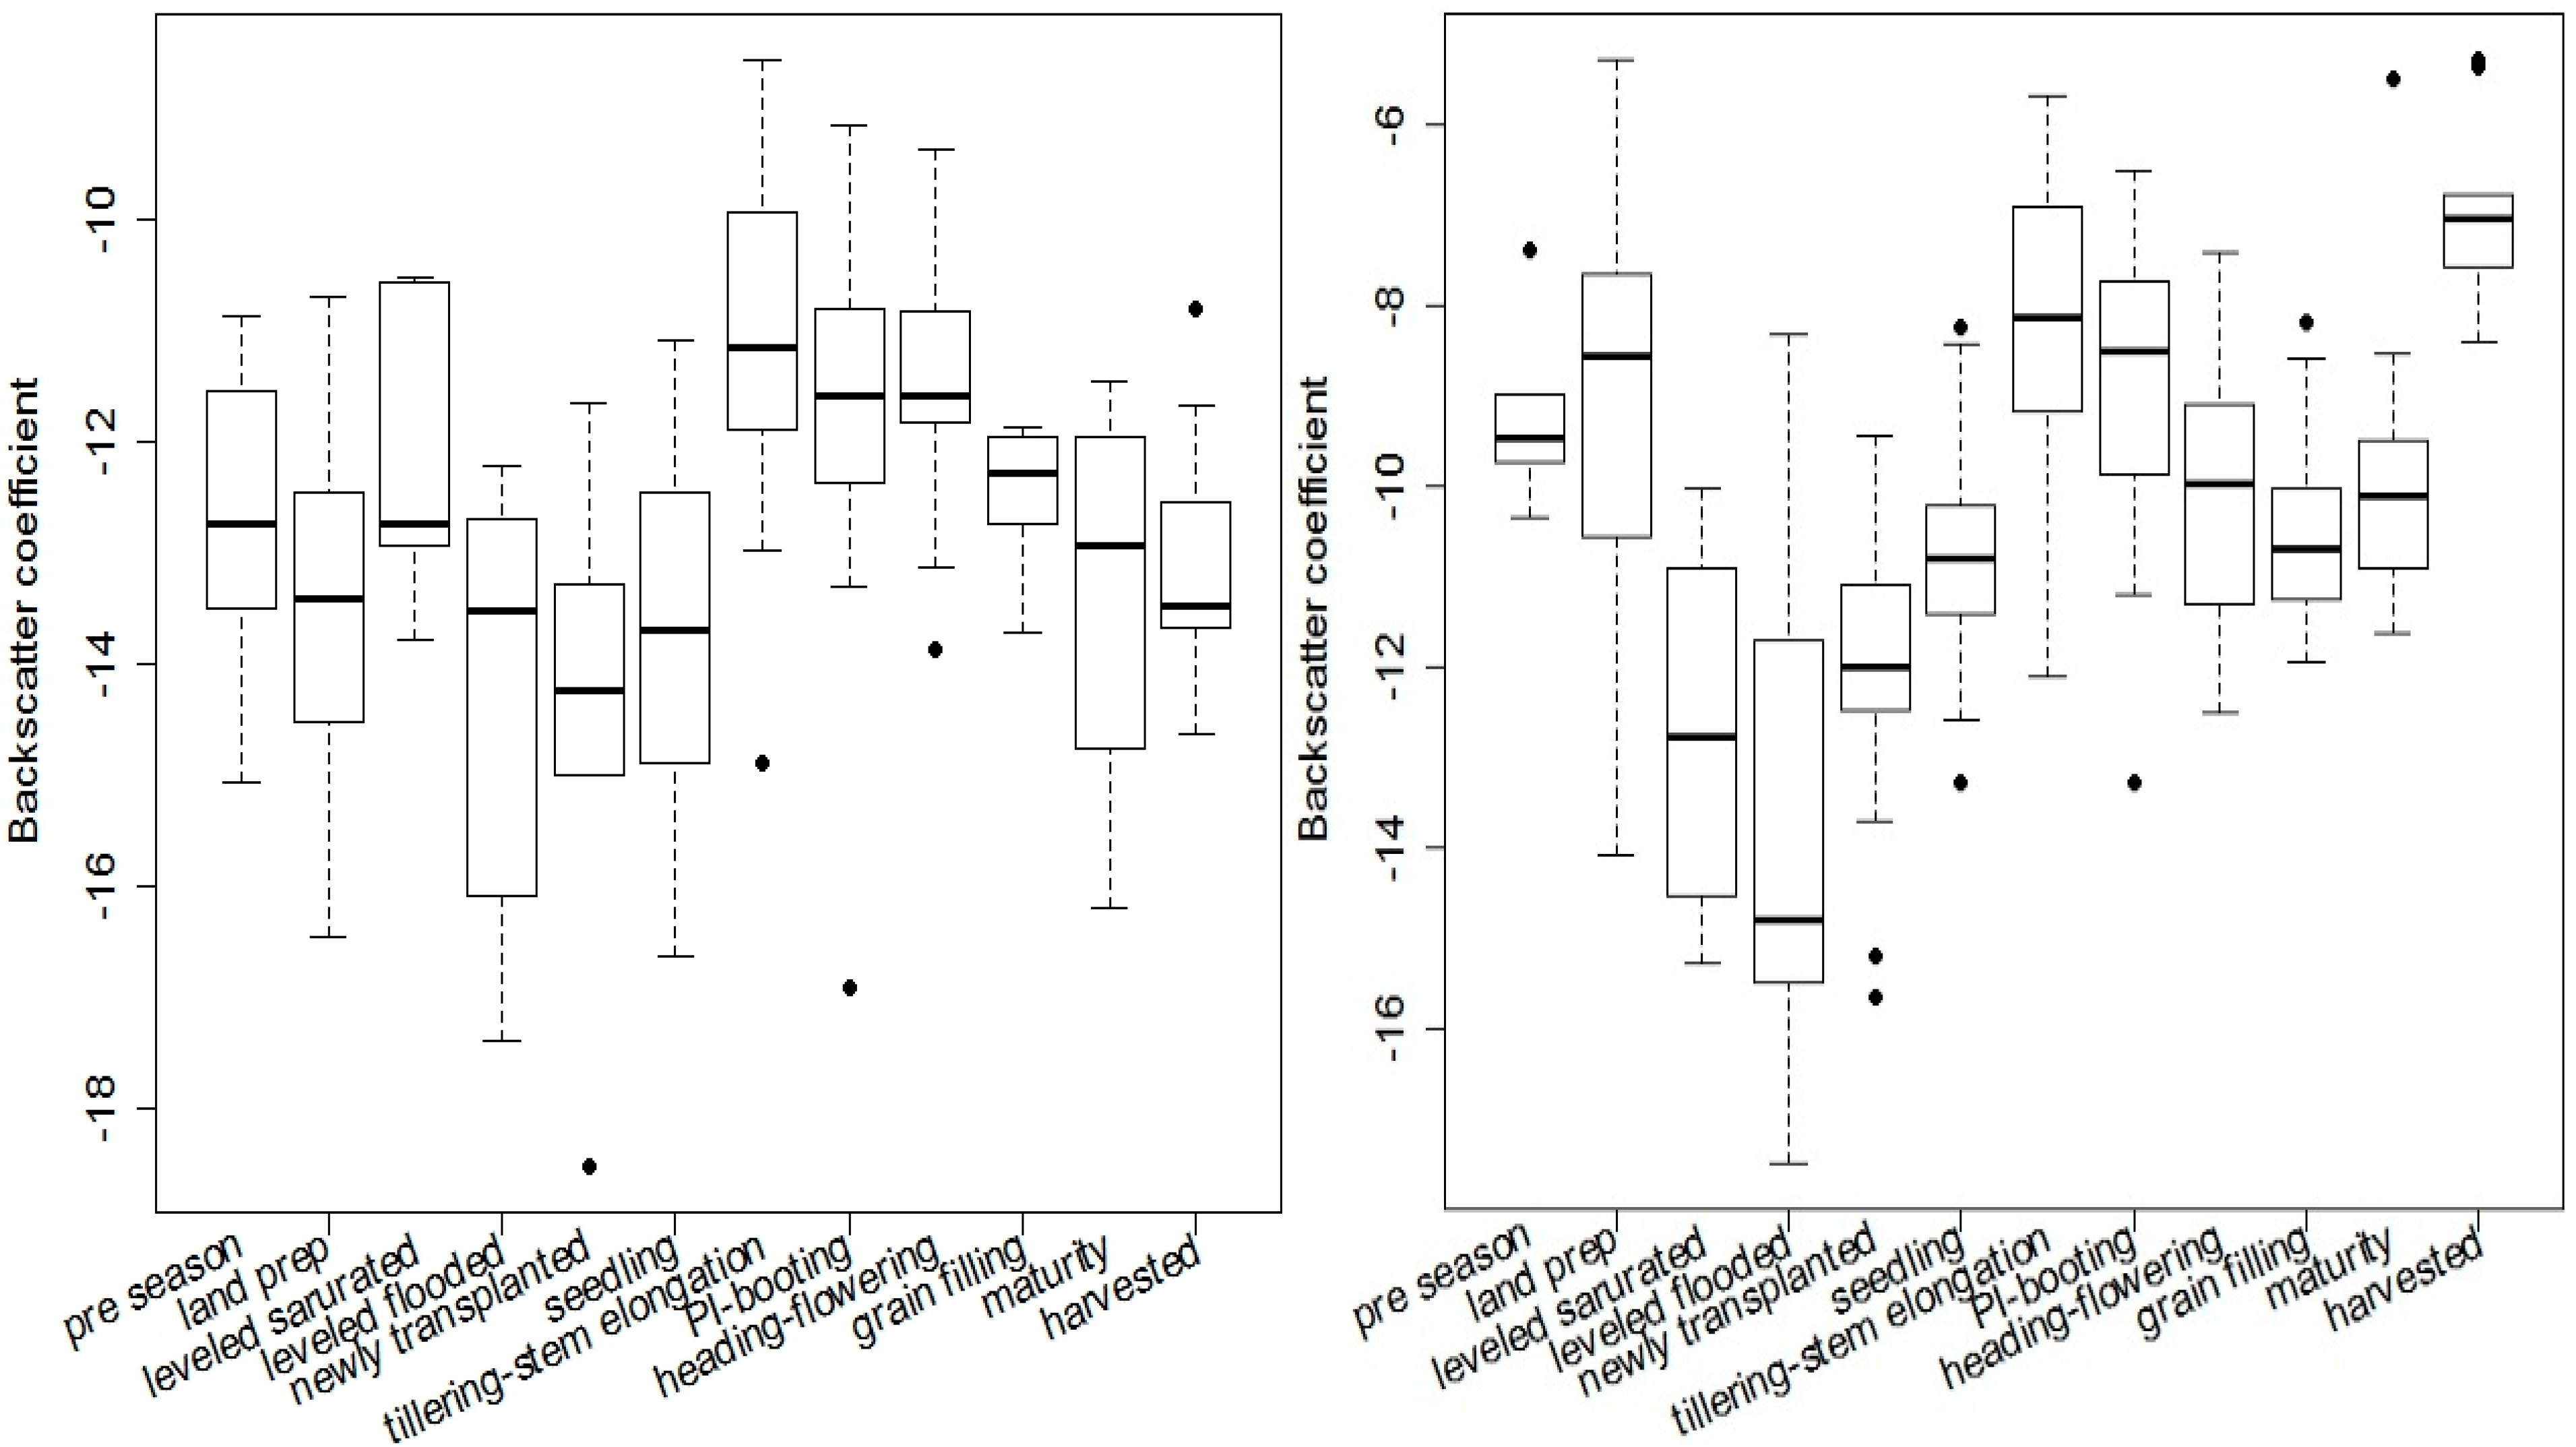
3.2. Temporal Rice Backscatter Signature from TSX and CSK ScanSAR and Threshold Selection

Monitoring of the rice areas during the DS 2012–2013 and WS 2013 for every satellite image acquisition facilitated establishment of the rice temporal backscatter signature from pre-season to harvesting for CSK and TSX ScanSAR, respectively. Figure 5 shows the range of backscatter values extracted from CSK and TSX data for the monitoring sites, grouped by the observed land preparation and rice crop growth stage.
Table 6 and Table 7 contain the thresholds used for rice identification and flooding/transplanting dates. The rice temporal backscatter signature was used to guide the threshold selection. Simple statistics such as the mean, minimum, maximum and range were used in setting the ceiling for the threshold selection. A description of the parameters is given in Table 4.
Figure 5. Boxplots of the backscatter coefficient derived from CSK (left) and TSX (right) for each observed land preparation and growth stage at the monitored sites. The black dots represent the outliers, the thick horizontal black line in the middle of the box is the median, the upper half of the box is the 25th percentile and the lower half is the 75th percentile, and the extent of dashed lines represent the minimum and maximum.
Remotesensing 06 12789 g005
Table 6. Thresholds selected for rice identification and flooding/transplanting dates using TSX multitemporal images.
ParametersThresholdsValues from Temporal BackscatterPercentage of Values Meeting the Threshold
SoS Rice (dB)<−10−8.3183
PoS Rice (dB)>−11−12.1197
Span of SoS to PoS (dB)>2.24.5971
Minimum growth (dB)>1.51.9750
Stable water (dB)<−16−18.2100
Built-up mean (dB)>−7.54.50100
Stable water (days)≥20--
Minimum rice cycle duration (days)>60--
Table 7. Thresholds selected for rice identification and flooding/transplanting dates using CSK multitemporal images.
ParametersThresholdsValues from Temporal BackscatterPercentage of Values Meeting the Threshold
SoS Rice (dB)<−12−12.23100
PoS Rice (dB)>−13−14.998
Span of SoS to PoS (dB)>2.32.7156
Minimum growth (dB)>1.01.40100
Stable water (dB)<−17−20.5100
Built-up mean (dB)>−92.0100
Stable water (days)≥20--
Minimum rice cycle duration (days)>60--

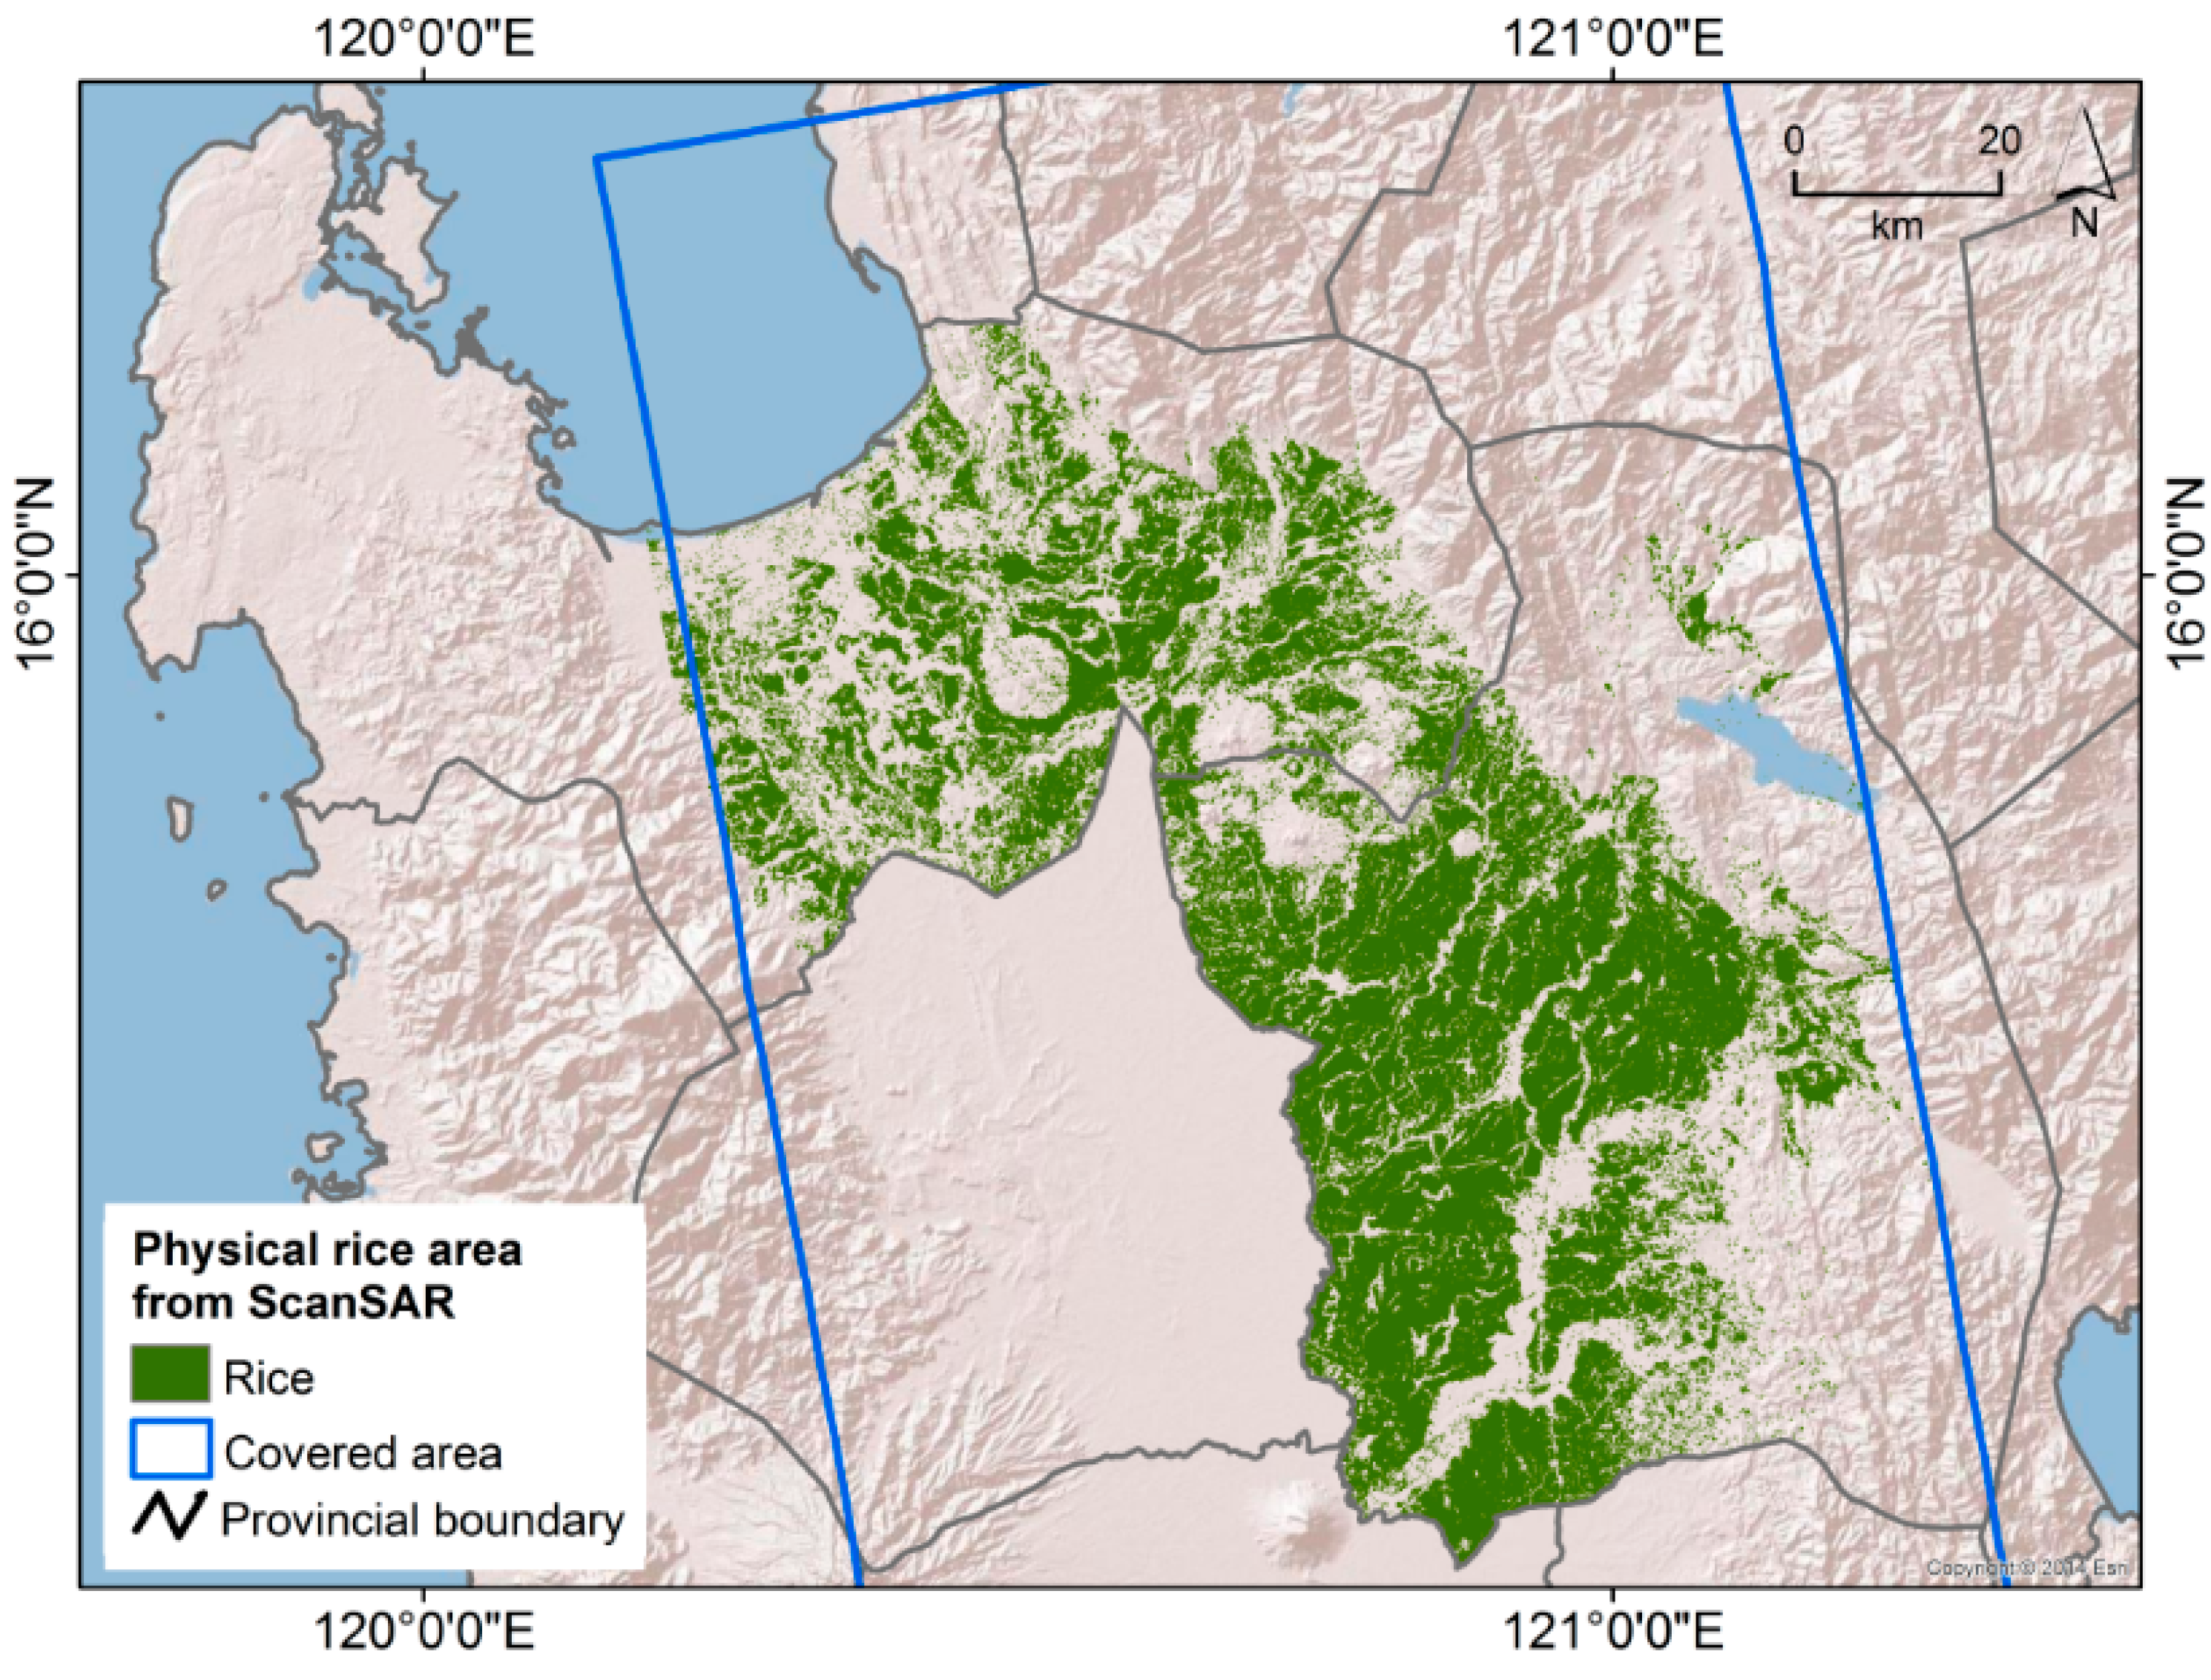
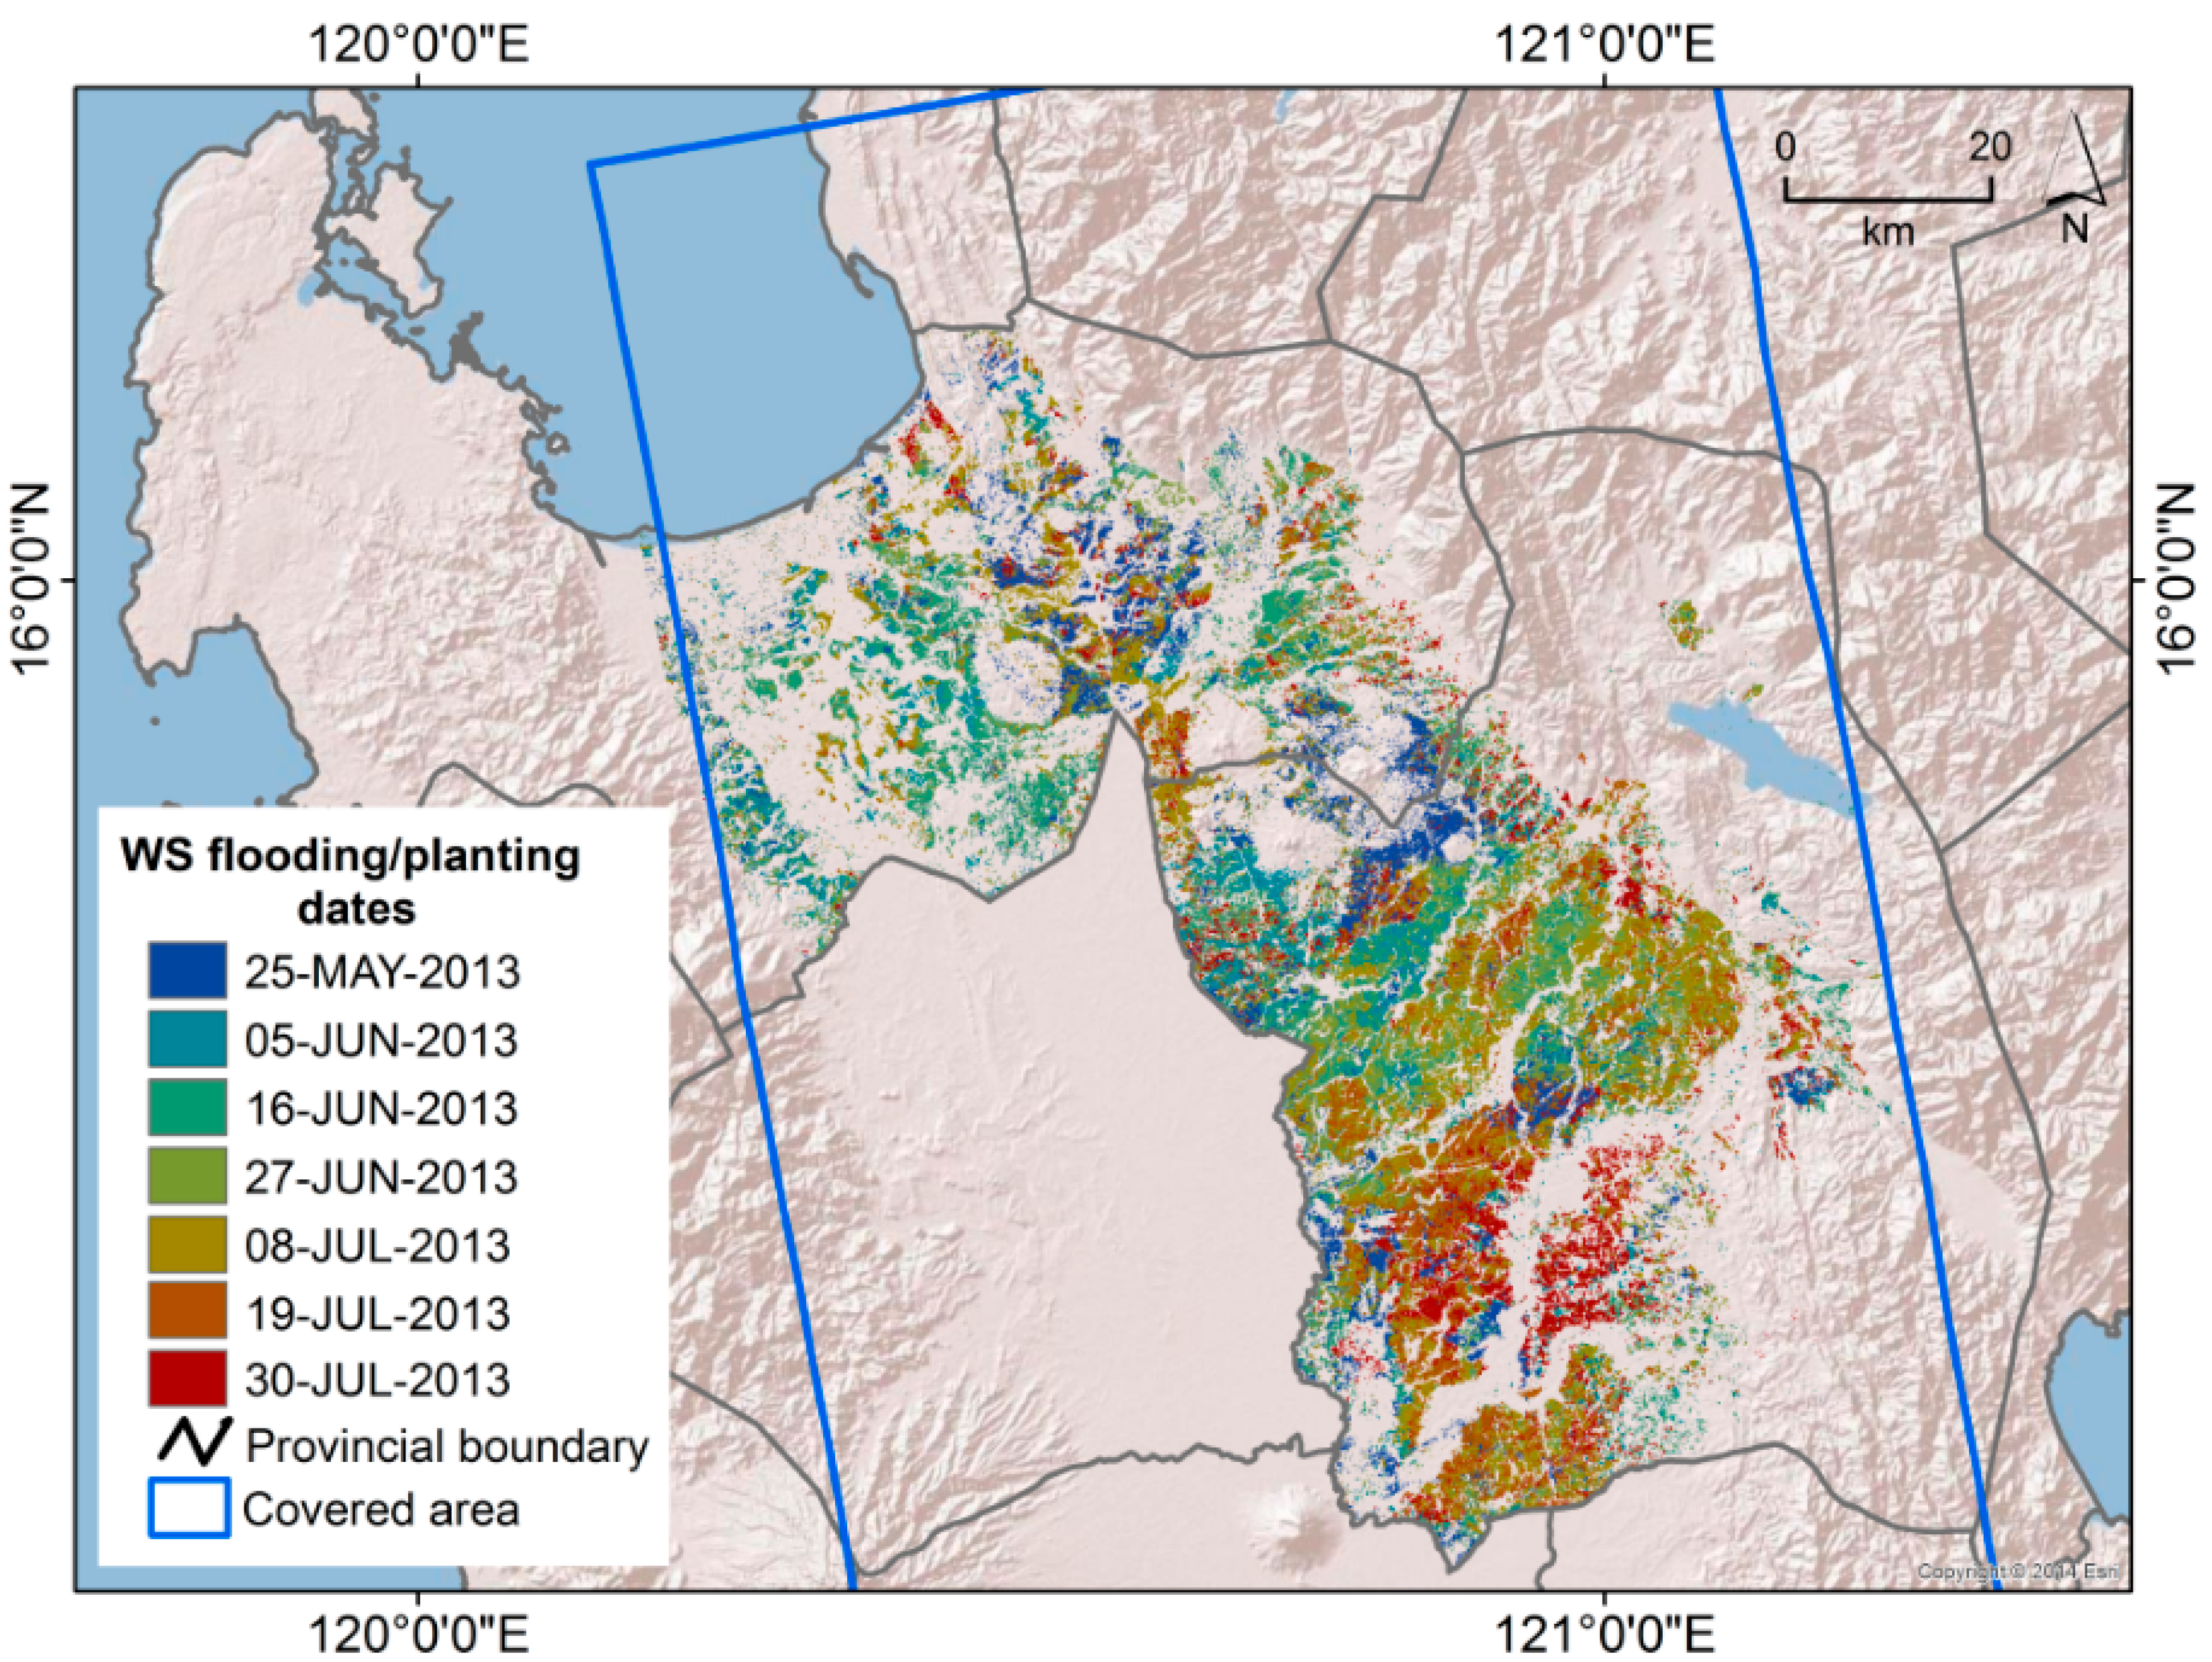
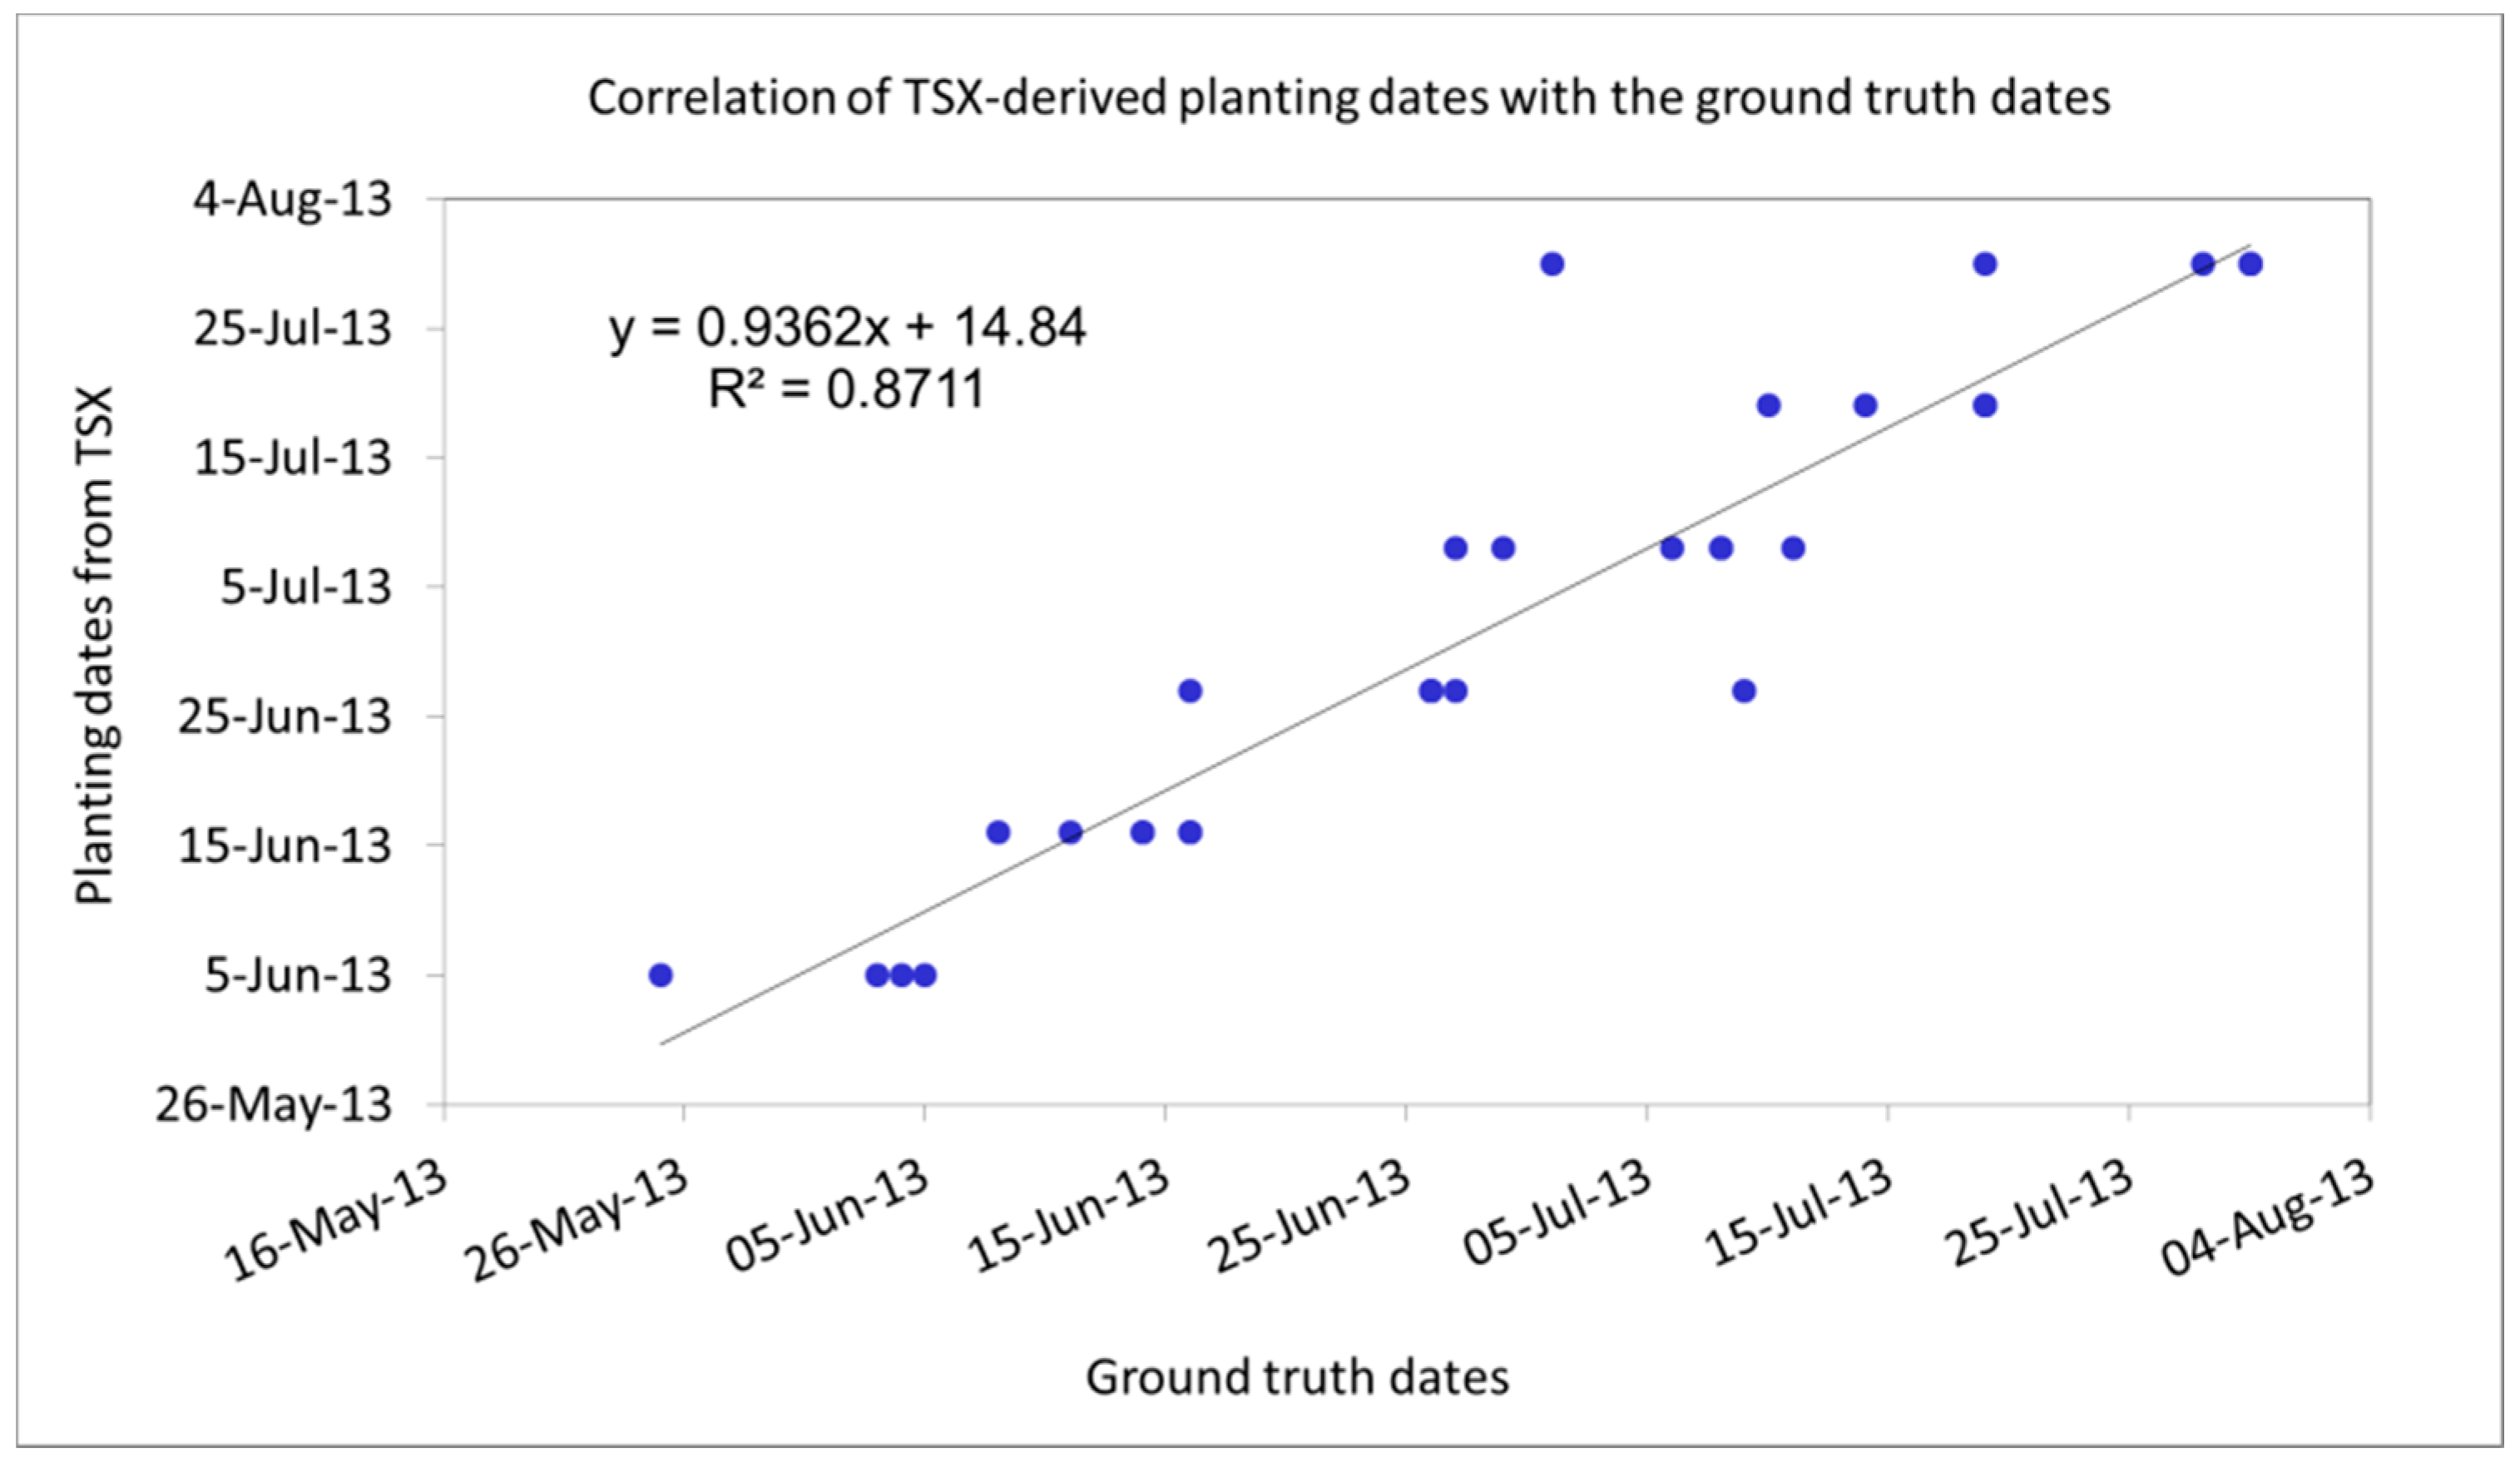
3.3. SAR-Based Rice Cropped Area and Flooding/Transplanting Dates Map (TSX and CSK ScanSAR)

The temporal backscatter signatures observed in Figure 4 were used to select specific thresholds that were applied to the multitemporal SAR data to generate rice area maps and maps of planting dates for the DS 2012–2013 and WS 2013. The combination of these consecutive seasonal area maps resulted in a physical rice area map (Figure 6) containing information on areas planted with rice across seasons. The overall accuracy was 90.4% with a kappa coefficient of 0.72 (Table 5).
The spatially detailed flooding/transplanting dates for the DS and WS generated from SAR are shown in Figure 7 and Figure 8. The flooding/transplanting dates that were detected during satellite acquisition for the DS were from 6 December 2012 to 8 February 2013. For the WS 2013, the dates were from 25 May to 30 July 2013.
Figure 6. Physical rice cropped area map for 2012–2013 derived from TSX ScanSAR (WS) and CSK ScanSAR (DS) images.
Remotesensing 06 12789 g006
Figure 7. Flooding/transplanting dates within the rice areas during DS 2012–2013 generated from CSK ScanSAR multitemporal images.
Remotesensing 06 12789 g007
Figure 8. Flooding/transplanting dates within the rice areas during WS 2013 generated from TSX ScanSAR multitemporal images.
Remotesensing 06 12789 g008
Figure 9. Correlation of TSX-derived planting dates with the ground data.
Remotesensing 06 12789 g009
Accuracy of the flooding/transplanting dates was assessed by linear correlation. The result showed strong correlation (R2 = 0.87) between the TSX-derived dates and the ground truth dates (Figure 9). Root Mean Square error (RMSE) was also calculated to determine the difference between the TSX-derived and the actual flooding/planting dates. The RMSE is 9 days (Table 8), which is less than the 11-day revisit period of TSX ScanSAR.
Table 8. Correlation of TSX-derived flooding/planting dates with the ground truth flooding/planting dates.
Measure of AccuracyTSX-Derived Flooding/Transplanting Dates for WS
R20.87
RMSE9 days

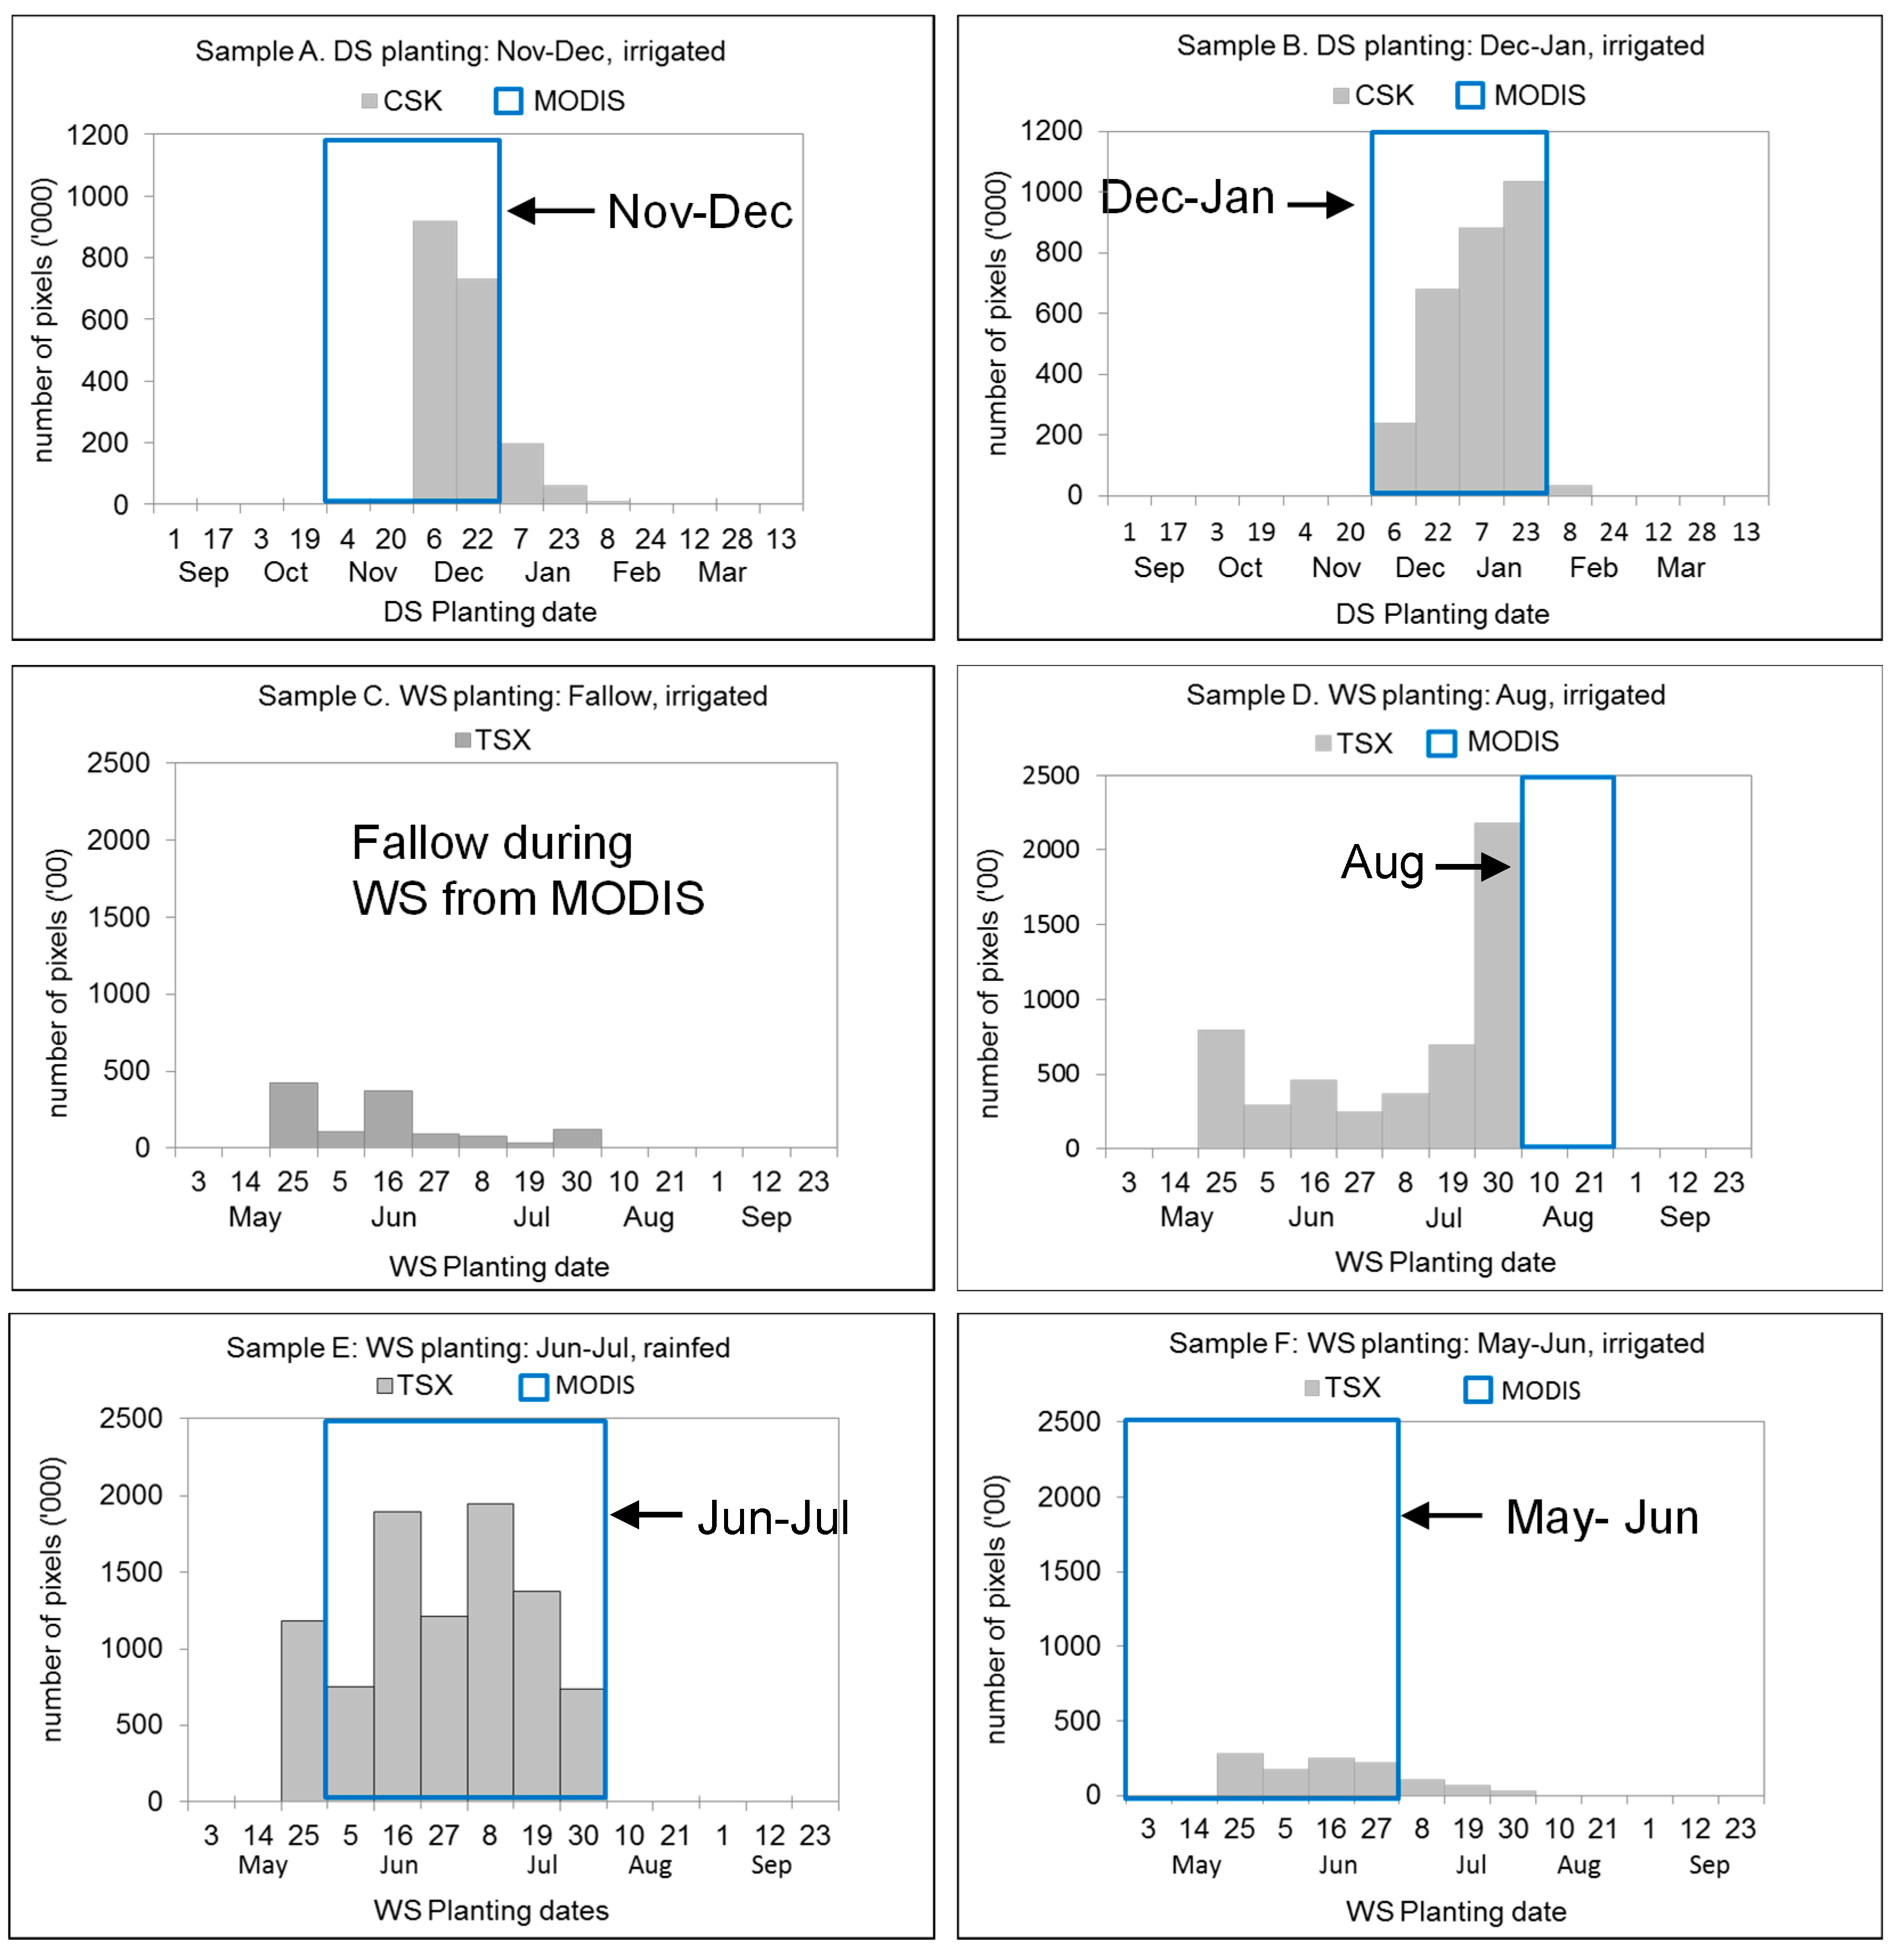
3.4. Comparison of MODIS and SAR Planting Dates

Figure 10 shows the comparison of the usual/general planting period acquired from MODIS and the planting dates from ScanSAR for DS 2012 and WS 2013. The DS is characterized by a much shorter time period, reflecting the narrow water release dates in the irrigation systems. The WS shows a much larger range of planting dates, albeit with a defined peak planting window. A shift in the planting calendar can be observed where the planting period from CSK and TSX exhibited a late (samples A and F) and early (samples D and E) start of planting with reference to the general planting period from MODIS. Sample D also shows that planting dates in August from TSX were not captured as there was no image acquisition during that month. Sample B, on the other hand, showed no difference for MODIS and CSK. Sample C showed a different result. In MODIS, this rice cropping system does not plant rice in the WS; however, TSX shows that some pixels were detected as rice in WS 2013 but with no obvious peak planting period. This could be attributed to the higher spatial resolution of SAR that was able to pick up rice in these relatively small areas.
Figure 10. Examples of planting period from different rice cropping systems acquired from MODIS (blue box) and SAR (gray columns) for the DS and WS.
Remotesensing 06 12789 g010

4. Discussions

4.1. MODIS-Based Rice Stratification and Characterization

The MODIS-derived rice characteristics map contains information on the distribution of the predominant cropping systems being followed in the study area. MODIS was found to be effective in capturing the large homogeneous rice areas (B, C and E in Figure 3). However, rice areas with small field sizes and variability in the cropping systems practiced such as the cropping calendar and crops planted mostly located in the rainfed areas tend to be generalized within the strata when using MODIS. The identification of cropping systems in the smaller and dispersed rice classes (i.e., D, G and H from Figure 3) in the rainfed areas was found to be challenging. Overall, we note that the ability of hypertemporal MODIS to map the predominant rice characteristics is related to the spatial homogeneity and spatial fragmentation of the observed area.

4.2. Rice SAR Temporal Backscatter Signature and SAR-Based Rice Cropped Area and Flooding/Transplanting Dates Map

SAR sensors (TSX and CSK) were found to be effective in mapping the rice areas with an overall accuracy of 90.4%. Newly planted or transplanted rice showed an increase in backscatter coefficient from both CSK and TSX (Figure 5) at an incidence angle of 40° and 45°, respectively. This result confirms the findings of [7] that high-frequency bands such as Ka, Ku and X bands can detect thin rice seedlings after transplanting at large incidence angles [7]. During the initial part of the growing season, rice shows an increase in backscatter because of a progressively higher surface roughness (i.e., from transplanting until tillering to stem elongation stage). As the rice canopy closes to cover the stems and spaces between rows and the surface becomes more homogeneous, the backscatter decreases because of a progressively lower surface roughness. High-frequency bands are sensitive to early rice growth stages (with LAI < 1.5) within one month after transplanting and lose sensitivity after that [7]. Backscatter of rice from X-band saturates at an earlier growth stage [34,71]. This research has identified the peak to occur within the tillering to stem elongation stage. This is then followed by a decrease in backscatter coefficient that starts from the panicle initiation stage. An increase in backscatter was observed to occur again during the maturity stage, which is also in agreement with the findings of [7] that X-band is sensitive to ripening grains in the larger incidence angle. Harvested areas during the WS show higher backscatter than in the DS (Figure 5). This can be attributed to the moist condition related to the dielectric properties of stubbles during the rainy season (WS), whereas, during the DS, very dry stubbles and soils exist in the harvested areas.
Multitemporal X-band SAR data clearly identifies newly transplanted rice seedlings and hence has the potential to detect transplanting dates [34]. The analysis of the relationship between TSX-derived dates and the actual flooding/transplanting dates showed a very strong correlation with an R2 of 0.87 (Table 7). CSK-derived flooding/transplanting dates were not assessed in the same way because of a lack of information on the actual flooding/transplanting dates.
Factors affecting the accuracy of the SAR-generated rice maps include weather conditions and the timing of image acquisition. Several tropical storms passed over the study area during the WS acquisition period for TSX ScanSAR, which affected the images. Examples of the effect of these storms are shown in the Supplementary Information section (Figure S4). We assume that thick cloud cover in the image appears as black patches that decreased the intensity of backscatter from the ground that was not able to penetrate the clouds to reach the SAR sensor. The intense localized rainfall, on the other hand, is assumed to be the bright areas in the image that were probably produced because of the increase in water in the air that acted as multiple scatterers, also increasing the dielectric constant, resulting in an increase in backscatter. Further ground data are needed to validate these observations, which were not available in this study since the intense rainfall precluded any field activity at the time and location of these events. Longer microwave bands (e.g., C-band) for rice mapping, especially during the wet season, should be considered when mapping rice areas in a tropical country such as the Philippines, which experiences around 20 severe tropical storms every year [72]. Proper planning and timing of the image acquisitions are also essential for accurate rice area mapping. In our methodology, the rice area will be strongly underestimated if the SAR time series does not adequately capture the flooding/transplanting dates. In our study, one image was not acquired in August, which is toward the end of the transplanting period, and it is likely that we underestimated the area of the rice crop that was established around that time.

4.3. Comparison of General Planting Dates from MODIS with SAR-Derived Flooding/Transplanting Dates

Our comparison of the general planting period from MODIS with the SAR-derived flooding/planting dates showed consistency in the periods of planting for sample B and a slight early shift of planting for samples A, E and F. The use of MODIS time series (2006–2011) for capturing the general planting period was shown to be a valid approach since the majority of the rice areas detected by SAR in 2012–2013 were planted in time periods that were consistent with the general planting dates derived from MODIS (Figure 10).

5. Conclusions

This study showed how hypertemporal MODIS and multitemporal, high-spatial-resolution SAR images can be used to derive complementary information from rice areas. We used hypertemporal MODIS data to generate a rice characteristics map of the dominant rice-based cropping systems containing information on the general cropping calendar, cropping pattern, cropping intensity and rice ecosystem, while X-band SAR was used for the spatially detailed and accurate mapping of rice areas and flooding/transplanting dates.
The study also provided the first assessment of the temporal variation in backscatter in X-band SAR from CSK and TSX using large incidence angles (40° and 45°, respectively) for rice covering stages from pre-season and land preparation until harvest. CSK and TSX with large incidence angles can detect newly transplanted seedlings. An increase in backscatter was observed for both CSK and TSX from flooding to transplanting. The peak in backscatter coefficient was observed to occur from tillering to stem elongation, which is followed by a decrease in backscatter due to lower surface roughness as the canopy closes and covers the stem and spaces between rows. An increase in backscatter was observed again at the maturity stage, with the ripening grains as the major scatterers with large incidence angles. In comparison to C-band SAR such as ERS-1, flooded rice fields have increasing backscatter until they reach the reproductive phase, which can be attributed to the wave-vegetation-water interaction [68]. C-band SAR backscatter reaches the maximum at early ripening phase, which is attributed to the vertical plant structures and water surfaces as scatterers, while a slight decrease in backscatter occurs during the late ripening phase due to a reduction in the capability to penetrate the soil or water [73].
High accuracy (90.4%) was obtained from the spatially detailed rice area map derived from SAR. The flooding/transplanting dates from TSX ScanSAR had a very strong correlation with the actual planting dates, showing its effectiveness in detecting the flooding/transplanting period. Accuracy of the information that describes the characteristics of the cropping systems within the rice areas obtained from MODIS ranged from 61.7% to 87.2%. The most basic information layers (e.g., rice/non-rice) had the highest overall accuracy, while the more thematically detailed information layers such as the cropping calendars had the lowest overall accuracy. MODIS provides general information that leads to a better understanding of rice areas, which gives insight into general farmers’ management practices within each rice cropping system.
The results suggest that the planting period derived from MODIS can be used as a guide in planning SAR image acquisition [41] even over large extents in addition to secondary information on irrigation water release dates. MODIS can provide a general planting period while SAR can provide spatially detailed planting dates. Though X-band SAR is effective in mapping the temporal variability in planting dates and in detailed mapping of rice areas, the key to an accurate mapping is to acquire SAR images at the right time and with a sufficiently high repetition frequency, especially during the critical phases of the cropping season. This includes the flooding period, which is needed for the correct identification of rice areas [39], and the tillering to stem elongation stage, when the maximum backscatter is achieved, which confirms that rice is planted and grown. Missing an image during these critical periods could lead to unmapped rice area as experienced in this study.
This study emphasizes the complementarity of optical and SAR sensors to acquire comprehensive rice information. Together, the use of optical and SAR sensors generated accurate, comprehensive and necessary information to help aid decision making in the identification of rice areas for intensification, and areas for the development of irrigation as one of the necessary steps in dealing with food security issues. Despite some limitation in the SAR acquisitions, this study suggests that current and future optical and SAR systems such as Sentinel 1, 2, 3, Proba-V, RISAT-1, Landsat 8, MODIS, CSK and TerraSAR-X can be used complementarily to provide valuable spatial, thematic and temporal information on the rice crop in Asia.

Supplementary Files

Supplementary File 1

Acknowledgment

The authors would like to thank the following: IRRI for providing financial support and personnel for the satellite data and fieldwork, PhilRice for its help in ground data collection, sarmap for technical support in SAR image processing and in ordering the satellite images and all the farmers who devoted their time for interviews.
Andrew Nelson was funded by the Global Rice Science Partnership (GRiSP) research program of the CGIAR, the Remote Sensing-based Information and Insurance for Crops in Emerging economies program (RIICE), financially supported by the Swiss Agency for Development and Cooperation (SDC), and the Philippine Rice Information System (PRiSM) project, financially supported by the Philippines Department of Agriculture. Sonia Asilo was funded by a Global Rice Science Scholarship (GRiSS).
MODIS data were provided by NASA and SAR data were provided by ASI/e-GEOS from COSMO-SkyMed and by InfoTerra GmbH from TerraSAR-X.
We thank Bill Hardy for English editing and four anonymous reviewers for their comments which improved the manuscript.

Author Contributions

Sonia Asilo was responsible for the development and implementation of the methods and writing of the paper. Kees de Bie was responsible for supervision and the development and improvement of the methods and editing the paper. Andrew Skidmore and Andrew Nelson were responsible for supervision in the development of the methods and made a significant contribution in writing and editing the paper. Massimo Barbieri provided scientific and technical support in processing the SAR images. Aileen Maunahan was responsible for the ground data collection. All authors contributed in writing the paper.

Conflicts of Interest

The authors declare no conflict of interest.

References

  1. Pandey, S.; Byerlee, D.; Dawe, D.; Dobermann, A.; Mohanty, S.; Rozelle, S.; Hardy, B. Rice in the Global Economy: Strategic Research and Policy Issues for Food Security; International Rice Research Institute: Los Baños, Philippines, 2010. [Google Scholar]
  2. Nguyen, N.V. Global climate changes and rice food security. 2005, 54, 24–30. [Google Scholar]
  3. Toriyama, K.; Heong, K.L.; Hardy, B. Rice is life: Scientific perspectives for the 21st century. In World Rice Research Conference; International Rice Research Institute: Tsukuba, Japan, 2004; p. 590. [Google Scholar]
  4. FAOSTAT. Production (Crops: Rice Paddy). Available online: http://faostat.fao.org/site/567/default.aspx#ancor (accessed on 30 August 2014).
  5. Boschetti, M.; Nutini, F.; Manfron, G.; Brivio, P.A.; Nelson, A. Comparative analysis of normalised difference spectral indices derived from MODIS for detecting surface water in flooded rice cropping systems. PLoS ONE 2014, 9. [Google Scholar] [CrossRef] [PubMed]
  6. Torbick, N.; Salas, W.; Xiao, X.; Ingraham, P.; Fearon, M.; Biradar, C.; Zhao, D.; Liu, Y.; Li, P.; Zhao, Y. Integrating SAR and optical imagery for regional mapping of paddy rice attributes in the Poyang Lake watershed, China. Can. J. Remote Sens. 2011, 37, 17–26. [Google Scholar] [CrossRef]
  7. Inoue, Y.; Kurosu, T.; Maeno, H.; Uratsuka, S.; Kozu, T.; Dabrowska-Zielinska, K.; Qi, J. Season-long daily measurements of multifrequency (Ka, Ku, X, C, and L) and full-polarization backscatter signatures over paddy rice field and their relationship with biological variables. Remote Sens. Environ. 2002, 81, 194–204. [Google Scholar] [CrossRef]
  8. Shao, Y.; Fan, X.; Liu, H.; Xiao, J.; Ross, S.; Brisco, B.; Brown, R.; Staples, G. Rice monitoring and production estimation using multitemporal RADARSAT. Remote Sens. Environ. 2001, 76, 310–325. [Google Scholar] [CrossRef]
  9. Nguyen, T.T.H.; de Bie, C.A.J.M.; Ali, A.; Smaling, E.M.A.; Chu, T.H. Mapping the irrigated rice cropping patterns of the Mekong Delta, Vietnam, through hyper-temporal SPOT NDVI image analysis. Int. J. Remote Sens. 2011, 33, 415–434. [Google Scholar] [CrossRef]
  10. Kurosu, T.; Fujita, M.; Chiba, K. Monitoring of rice crop growth from space using the ERS-1 C-band SAR. IEEE Trans. Geosci. Remote Sens. 1995, 33, 1092–1096. [Google Scholar] [CrossRef]
  11. Sakamoto, T.; Yokozawa, M.; Toritani, H.; Shibayama, M.; Ishitsuka, N.; Ohno, H. A crop phenology detection method using time-series MODIS data. Remote Sens. Environ. 2005, 96, 366–374. [Google Scholar] [CrossRef]
  12. Chen, C.F.; Huang, S.W.; Son, N.T.; Chang, L.Y. Mapping double-cropped irrigated rice fields in Taiwan using time-series Satellite Pour I’Observation de la Terre data. J. Appl. Remote Sens. 2011, 5. [Google Scholar] [CrossRef]
  13. Turner, M.D.; Congalton, R.G. Classification of multi-temporal SPOT-XS satellite data for mapping rice fields on a West African floodplain. Int. J. Remote Sens. 1998, 19, 21–41. [Google Scholar] [CrossRef]
  14. Panigrahy, S.; Parihar, J.S. Role of middle infrared bands of Landsat Thematic Mapper in determining the classification accuracy of rice. Int. J. Remote Sens. 1992, 13, 2943–2949. [Google Scholar] [CrossRef]
  15. Okamoto, K.; Fukuhara, M. Estimation of paddy field area using the area ratio of categories in each mixel of Landsat TM. Int. J. Remote Sens. 1996, 17, 1735–1749. [Google Scholar] [CrossRef]
  16. Miyazato, M.; Ishiguro, E.; Hidaka, Y.; Sato, M.; Yoshida, S.; Chen, J.Y. Estimation of the Area of Rice Paddy Field Using Satellite Data: By Multi Level Slice Method and Band Ratio Method. Available online: http://ir.kagoshima-u.ac.jp/bitstream/10232/2928/1/KJ00000011053.pdf (accessed on 30 August 2014).
  17. Fang, H. Rice crop area estimation of an administrative division in China using remote sensing data. Int. J. Remote Sens. 1998, 19, 3411–3419. [Google Scholar] [CrossRef]
  18. Hong, S.Y.; Lee, K.S.; Rim, S.K.; Kim, K.U. Estimation of rice field area using two-date Landsat TM images in Korea. In Proceedings of Geoscience and Remote Sensing Symposium, Hamburg, Germany, 28 June–2 July 1999; pp. 732–734.
  19. Tennakoon, S.B.; Murty, V.V.N.; Eiumnoh, A. Estimation of cropped area and grain yield of rice using remote sensing data. Int. J. Remote Sens. 1992, 13, 427–439. [Google Scholar] [CrossRef]
  20. Van Niel, T.G.; McVicar, T.R.; Fang, H.; Liang, S. Calculating environmental moisture for per-field discrimination of rice crops. Int. J. Remote Sens. 2003, 24, 885–890. [Google Scholar] [CrossRef]
  21. Kuenzer, C.; Knauer, K. Remote sensing of rice crop areas. Int. J. Remote Sens. 2012, 34, 2101–2139. [Google Scholar] [CrossRef]
  22. Ishiguro, E.; Kumar, M.K.; Hidaka, Y.; Yoshida, S.; Sato, M.; Miyazato, M.; Chen, J.Y. Use of rice response characteristics in area estimation by Landsat/TM and MOS-1 satellites data. ISPRS J. Photogramm. Remote Sens. 1993, 48, 26–32. [Google Scholar] [CrossRef]
  23. Ribbes, F. Rice field mapping and monitoring with RADARSAT data. Int. J. Remote Sens. 1999, 20, 745–765. [Google Scholar] [CrossRef]
  24. Xie, Y.; Sha, Z.; Yu, M. Remote sensing imagery in vegetation mapping: A review. J. Plant Ecol. 2008, 1, 9–23. [Google Scholar] [CrossRef]
  25. Boschetti, M.; Stroppiana, D.; Brivio, P.A.; Bocchi, S. Multi-year monitoring of rice crop phenology through time series analysis of MODIS images. Int. J. Remote Sens. 2009, 30, 4643–4662. [Google Scholar] [CrossRef]
  26. Chen, C.F.; Son, N.T.; Chen, C.R.; Chang, L.Y. Wavelet filtering of time-series moderate resolution imaging spectroradiometer data for rice crop mapping using support vector machines and maximum likelihood classifier. J. Appl. Remote Sens. 2011, 5. [Google Scholar] [CrossRef]
  27. Gray, J.; Friedl, M.; Frolking, S.; Ramankutty, N.; Nelson, A.; Gumma, M. Mapping Asian Cropping Intensity with MODIS. Available online: http://ftp-earth.bu.edu/public/joshgray/MultiCropRevisions/AsiaCroppingIntensity.pdf (accessed on 30 August 2014).
  28. Peng, D.; Huete, A.R.; Huang, J.; Wang, F.; Sun, H. Detection and estimation of mixed paddy rice cropping patterns with MODIS data. Int. J. Appl. Earth Obs. Geoinf. 2011, 13, 13–23. [Google Scholar] [CrossRef]
  29. Gumma, M.K.; Nelson, A.; Thenkabail, P.S.; Singh, A.N. Mapping rice areas of South Asia using MODIS multitemporal data. Int. J. Remote Sens. 2011, 5. [Google Scholar] [CrossRef]
  30. Xiao, X.; Boles, S.; Liu, J.; Zhuang, D.; Frolking, S.; Li, C.; Salas, W.; Moore Iii, B. Mapping paddy rice agriculture in Southern China using multi-temporal MODIS images. Remote Sens. Environ. 2005, 95, 480–492. [Google Scholar] [CrossRef]
  31. Sun, H.S.; Huang, J.F.; Huete, A.; Peng, D.L.; Zhang, F. Mapping paddy rice with multi-date moderate-resolution imaging spectroradiometer (MODIS) data in China. J. Zhejiang Univ. Sci. A 2009, 10, 1509–1522. [Google Scholar] [CrossRef]
  32. Xiao, X.M.; Boles, S.; Frolking, S.; Li, C.S.; Babu, J.Y.; Salas, W.; Moore, B. Mapping paddy rice agriculture in South and Southeast Asia using Multi-temporal MODIS images. Remote Sens. Environ. 2006, 100, 95–113. [Google Scholar] [CrossRef]
  33. Holecz, F.; Barbieri, M.; Collivignarelli, F.; Gatti, L.; Nelson, A.; Setiyono, T.D.; Boschetti, M.; Manfron, G.; Brivio, P.A. An Operational Remote Sensing Based Service for Rice Production Estimation at National Scale. Available online: http://www.rcmrd.org/docs/RIICE.pdf (accessed on 30 August 2014).
  34. Inoue, Y.; Sakaiya, E.; Wang, C. Potential of X-band images from high-resolution satellite SAR sensors to assess growth and yield in paddy rice. Remote Sens. 2014, 6, 5995–6019. [Google Scholar] [CrossRef]
  35. Shen, S.; Yang, S.; Li, B.; Tan, B.; Li, Z.; Toan, T.L. A scheme for regional rice yield estimation using ENVISAT ASAR data. Sci. China Ser. Earth Sci. 2009, 52, 1183–1194. [Google Scholar] [CrossRef]
  36. Bouvet, A.; Toan, T.L.; Nguyen, L.-D. Monitoring of the rice cropping system in the Mekong Delta using ENVISAT/ASAR dual polarization data. IEEE Trans. Geosci. Remote Sens. 2009, 47, 517–526. [Google Scholar] [CrossRef] [Green Version]
  37. Bouvet, A.; Toan, T.L. Use of ENVISAT/ASAR wide-swath data for timely rice fields mapping in the Mekong River Delta. Remote Sens. Environ. 2011, 115, 1090–1101. [Google Scholar] [CrossRef] [Green Version]
  38. Choudhury, I.; Chakraborty, M. SAR signature investigation of rice crop using RADARSAT data. Int. J. Remote Sens. 2006, 27, 519–534. [Google Scholar] [CrossRef]
  39. Kurosu, T.; Fujita, M.; Chiba, K. The identification of rice fields using multi-temporal ERS-1 C band SAR data. Int. J. Remote Sens. 1997, 18, 2953–2965. [Google Scholar] [CrossRef]
  40. Panigrahy, S.; Chakraborty, M.; Sharma, S.A.; Kundu, N.; Ghose, S.C.; Pal, M. Early estimation of rice area using temporal ERS-1 synthetic aperture radar data a case study for the Howrah and Hughly Districts of West Bengal, India. Int. J. Remote Sens. 1997, 18, 1827–1833. [Google Scholar] [CrossRef]
  41. Ozdogan, M.; Yang, Y.; Allez, G.; Cervantes, C. Remote sensing of irrigated agriculture: Opportunities and challenges. Remote Sens. 2010, 2, 2274–2304. [Google Scholar] [CrossRef]
  42. IBON. Philippines Profile, 1st ed.; DIAKONIA: Manila, Philippines, 1996. [Google Scholar]
  43. How to Prepare Ricefield for Planting. Available online: http://www.knowledgebank.irri.org/step-by-step-production/pre-planting/land-preparation (accessed on 19 October 2014).
  44. BAS. Palay and Corn: Area Harvested by Ecosystem/Croptype, by Quarter, by Semester, by Region and by Province; Bureau of Agricultural Statistics: Quezon City, Philippines, 2014.
  45. NASA. MODIS Components. Available online: http://modis.gsfc.nasa.gov/about/components.php (accessed on 4 June 2013).
  46. Vermote, E.F.; Kotchenova, S.Y.; Ray, J.P. MODIS Surface Reflectance User’s Guide. Available online: http://modis-sr.ltdri.org/products/MOD09_UserGuide_v1_3.pdf (accessed on 16 March 2014).
  47. Townshend, J.; Justice, C.; Li, W.; Gurney, C.; McManus, J. Global land cover classification by remote sensing: Present capabilities and future possibilities. Remote Sens. Environ. 1991, 35, 243–255. [Google Scholar] [CrossRef]
  48. ASI. COSMO-SkyMed System Description & User Guide. Available online: http://www.cosmo-skymed.it/en/index.htm (accessed on 20 October 2013).
  49. Eineder, M.; Fritz, T.; Mittermayer, J.; Roth, A.; Boerner, E.; Breit, H. TerraSAR-X Ground Segment, Basic Product Specification Document. Available online: http://www.researchgate.net/publication/235027942_TerraSAR-X_Ground_Segment_Basic_Product_Specification_Document (accessed on 30 August 2014).
  50. De Bie, C.A.J.M. Comparative Performance Analysis of Agro-Ecosystems. Ph.D. Thesis, Wageningen University and Research Centre, Enschede, The Netherlands, 2000. [Google Scholar]
  51. Submerge Soils for Rice Production: Rice Growing Environments. Available online: http://www.knowledgebank.irri.org/submergedsoils/index.php/rice-growing-environments/lesson-1 (accessed on 21 August 2014).
  52. Martínez-Casasnovas, J.A.; Martín-Montero, A.; Auxiliadora Casterad, M. Mapping multi-year cropping patterns in small irrigation districts from time-series analysis of Landsat TM images. Eur. J. Agron. 2005, 23, 159–169. [Google Scholar] [CrossRef]
  53. Eklundh, L.; Jönsson, P. TIMESAT 3.1 Software Manual. Available online: http://www.nateko.lu.se/timesat/docs/timesat3_1_1_SoftwareManual.pdf (accessed on 20 August 2014).
  54. Jonsson, P.; Eklundh, L. Seasonality extraction by function fitting to time-series of satellite sensor data. IEEE Trans. Geosci. Remote Sens. 2002, 40, 1824–1832. [Google Scholar] [CrossRef]
  55. Jönsson, P.; Eklundh, L. TIMESAT—A program for analyzing time-series of satellite sensor data. Comput. Geosci. 2004, 30, 833–845. [Google Scholar] [CrossRef]
  56. Tou, J.T.; Gonzalez, R.C. Pattern Recognition Principles; Addison-Wesley Publishing Company: Massachusetts, MA, USA, 1974. [Google Scholar]
  57. Ali, A.; de Bie, C.A.J.M.; Skidmore, A.K.; Scarrott, R.G.; Hamad, A.; Venus, V.; Lymberakis, P. Mapping land cover gradients through analysis of hyper-temporal NDVI imagery. Int. J. Appl. Earth Obs. Geoinf. 2013, 23, 301–312. [Google Scholar] [CrossRef]
  58. De Bie, C.A.J.M.; Nguyen, T.T.H.; Ali, A.; Scarrott, R.; Skidmore, A.K. LaHMa: A landscape heterogeneity mapping method using hyper-temporal datasets. Int. J. Geogr. Inf. Sci. 2012, 26, 2177–2192. [Google Scholar] [CrossRef]
  59. Khan, M.R.; de Bie, C.A.J.M.; van Keulen, H.; Smaling, E.M.A.; Real, R. Disaggregating and mapping crop statistics using hypertemporal remote sensing. Int. J. Appl. Earth Obs. Geoinf. 2010, 12, 36–46. [Google Scholar] [CrossRef]
  60. Swain, P.; King, R. Two Effective Feature Selection Criteria for Multispectral Remote Sensing. Available online: http://docs.lib.purdue.edu/cgi/viewcontent.cgi?article=1038&context=larstech (accessed on 30 August 2014).
  61. Nelson, A.; Setiyono, T.; Rala, A.; Quicho, E.; Raviz, J.; Abonete, P.; Maunahan, A.; Garcia, C.; Bhatti, H.; Villano, L.; et al. Towards an operational SAR-based rice monitoring system in Asia: Examples from 13 demonstration sites across Asia in the RIICE project. Remote Sens. 2014, 6, 10773–10812. [Google Scholar] [CrossRef]
  62. Mitchell, A.L.; Tapley, I.; Milne, A.K.; Williams, M.; Lowell, K. Radar Processing Methodologies for the Generation of Wall-to-Wall Mosaics. Available online: http://crcsi.com.au/assets/Uploads/Files/1-IFCIRA-SARproc.pdf (accessed on 30 August 2014).
  63. Lemp, D.; Koch, B. In Forest Monitoring Using TerraSAR-X Data—Evaluation of Processing Methods and First Results. Available online: http://sss.terrasar-x.dlr.de/papers_sci_meet_3/poster/MTH0384_lemp.pdf (accessed online 30 August 2014).
  64. De Grandi, G.F.; Leysen, M.; Lee, J.S.; Schuler, D. Radar Reflectivity Estimation Using Multiple SAR Scenes of the Same Target: Technique and Applications. Available online: http://0-ieeexplore-ieee-org.brum.beds.ac.uk/xpl/login.jsp?tp=&arnumber=615338&url=http%3A%2F%2Fieeexplore.ieee.org%2Fiel3%2F4810%2F13419%2F00615338.pdf%3Farnumber%3D615338 (accessed on 8 August 1997).
  65. Meier, E.; Frei, U.; Nüesch, D. Precise Terrain Corrected Geocoded Images. Available online: http://citeseer.uark.edu:8080/citeseerx/showciting;jsessionid=A5ABC292190B6C7331543DA9D7EDE934?cid=192163 (accessed on 30 August 2014).
  66. Aspert, F.; Cuadra, M.B.; Thiran, J.; Cantone, A.; Holecz, F. Time-Varying Segmentation for Mapping of Land Cover Changes. Available online: http://earth.esa.int/workshops/envisatsymposium/proceedings/sessions/4E4/462651as.pdf (accessed on 30 August 2014).
  67. Yoshida, S. Fundamentals of Rice Crop Science; International Rice Research Institute: Los Banos, Philippines, 1981. [Google Scholar]
  68. Toan, T.L.; Ribbes, F.; Wang, L.F.; Floury, N.; Ding, K.H.; Kong, J.A.; Fujita, M.; Kurosu, T. Rice crop mapping and monitoring using ERS-1 data based on experiment and modeling results. IEEE Trans. Geosci. Remote Sens. 1997, 35, 41–56. [Google Scholar] [CrossRef]
  69. Stergiopoulos, S. Advanced Signal Processing Handbook: Theory and Implementation for RADAR, Sonar, and Medical Real Time Systems; CRC Press: Boca Raton, FL, USA, 2000. [Google Scholar]
  70. Lillesand, T.M.; Kiefer, R.W.; Chipman, J.W. Remote Sensing and Image Interpretation, 6th ed.; John Wiley and Sons, Inc.: New York, USA, 2008. [Google Scholar]
  71. Inoue, Y.; Sakaiya, E. Relationship between X-band backscattering coefficients from high-resolution satellite SAR and biophysical variables in paddy rice. Remote Sens. Lett. 2012, 4, 288–295. [Google Scholar] [CrossRef]
  72. PAGASA. Current Climate Trends in the Philippines. Available online: http://www.pagasa.dost.gov.ph/climate-agromet/climate-change-in-the-philippines/116-climate-change-in-the-philippines/594-current-climate-and-observed-trends (accessed on 25 March 2014).
  73. Aschbacher, J.; Pongsrihadulchai, A.; Karnchanasutham, S.; Rodprom, C.; Paudyal, D.R.; Toan, T.L. Assessment of ERS-1 SAR Data for Rice Crop Mapping and Monitoring. Available online: http://www.researchgate.net/publication/224589687_Assessment_of_ERS-1_SAR_data_for_rice_crop_mapping_and_monitoring (accessed on 30 August 2014).

