Article

Seasonal to Interannual Variability of Satellite-Based Precipitation Estimates in the Pacific Ocean Associated with ENSO from 1998 to 2014

1
State Key Laboratory of Hydroscience and Engineering, Department of Hydraulic Engineering, Tsinghua University, Beijing 100084, China
2
School of Civil Engineering and Environmental Science, University of Oklahoma, Norman, OK 73070, USA
3
Department of Geological Sciences, University of Texas at San Antonio, San Antonio, TX 78204, USA
*
Authors to whom correspondence should be addressed.
Submission received: 27 July 2016 / Revised: 7 September 2016 / Accepted: 28 September 2016 / Published: 11 October 2016

Abstract

:
Based on a widely used satellite precipitation product (TRMM Multi-satellite Precipitation Analysis 3B43), we analyzed the spatiotemporal variability of precipitation over the Pacific Ocean for 1998–2014 at seasonal and interannual timescales, separately, using the conventional empirical orthogonal function (EOF) and investigated the seasonal patterns associated with El Niño–Southern Oscillation (ENSO) cycles using season-reliant empirical orthogonal function (SEOF) analysis. Lagged correlation analysis was also applied to derive the lead/lag correlations of the first two SEOF modes for precipitation with Pacific Decadal Oscillation (PDO) and two types of El Niño, i.e., central Pacific (CP) El Niño and eastern Pacific (EP) El Niño. We found that: (1) The first two seasonal EOF modes for precipitation represent the annual cycle of precipitation variations for the Pacific Ocean and the first interannual EOF mode shows the spatiotemporal variability associated with ENSO; (2) The first SEOF mode for precipitation is simultaneously associated with the development of El Niño and most likely coincides with CP El Niño. The second SEOF mode lagged behind ENSO by one year and is associated with post-El Niño years. PDO modulates precipitation variability significantly only when ENSO occurs by strengthening and prolonging the impacts of ENSO; (3) Seasonally evolving patterns of the first two SEOF modes represent the consecutive precipitation patterns associated with the entire development of EP El Niño and the following recovery year. The most significant variation occurs over the tropical Pacific, especially in the Intertropical Convergence Zone (ITCZ) and South Pacific Convergence Zone (SPCZ); (4) Dry conditions in the western basin of the warm pool and wet conditions along the ITCZ and SPCZ bands during the mature phase of El Niño are associated with warm sea surface temperatures in the central tropical Pacific, and a subtropical anticyclone dominating over the northwestern Pacific. These findings may be useful for prediction of seasonal precipitation anomalies over the Pacific Ocean during El Niño years and recovery years.

Graphical Abstract

1. Introduction

Precipitation is one of the basic climate factors that drives large-scale circulation and describes the water cycle on Earth [1,2]. It brings fresh water into the ocean, which dilutes the concentration of salt and has considerable impacts on ocean ecosystems [1,3]. El Niño–Southern Oscillation (ENSO), which is the dominant mode of interannual variability over the Pacific Ocean, influences convection and precipitation with anomalously warm sea surface temperatures (SSTs) in the eastern and central equatorial Pacific Ocean, and thus affects the sources of fresh water upon which millions of people rely [4,5]. Therefore, understanding the variability of precipitation and its relationship with ENSO are of great importance.
Before the advent of satellite remote sensing, studies of ocean precipitation were rare because long-term direct measurements of precipitation over the whole oceans were unavailable. The landmark publications of Ropelewski and Halpert [6,7] presented the global ENSO–precipitation relationship using data from several land- and island-based stations. Advances in remote sensing have provided us with long-term and globally complete satellite–gauge-merged precipitation products and satellite-based estimates, such as the Global Precipitation Climatology Project (GPCP) [8], the Climate Prediction Center Merged Analysis of Precipitation (CMAP) [9], and the Tropical Rainfall Measuring Mission (TRMM) Multi-satellite Precipitation Analysis (TMPA) [10]. Many studies have investigated the impacts of ENSO on precipitation using these satellite-based precipitation datasets [11,12,13,14,15,16]. For example, Dai and Wigley [11] and Haddad et al. [14] derived the global climatology and variability of ENSO-induced precipitation using the CMAP and TRMM datasets, respectively, and found that ENSO is the major driver of the interannual variability of global rainfall.
In recent years, many efforts have been made to examine the climatology and variability of ocean precipitation using the TRMM dataset [4,14,17,18,19]. The TRMM satellite, which was launched in late November 1997 and ended on 15 April 2015, provided a unique 17-year dataset of global tropical rainfall. It was followed by the Global Precipitation Measurement (GPM), which aims to improve the accuracy of extratropical precipitation estimates. The TMPA datasets are currently among the most recognized satellite-based precipitation products available [4] and provide us with the opportunity to understand large-scale characteristics of precipitation over the Pacific Ocean more comprehensively.
The most prominent precipitation structures in the Pacific Ocean are the Intertropical Convergence Zone (ITCZ) and the South Pacific Convergence Zone (SPCZ), the low-pressure zones where trade winds converge and considerable precipitation occurs because of excess solar heating and strong convection. Dorman and Bourke [20] reported that most rainfall north of 28°N occurs in winter, whereas the maximum amount of rainfall in the tropics occurs in July and August [20]. It was found that on interannual timescales, ENSO may drive changes in the magnitudes and positions of both the ITCZ and SPCZ. Climatologically, the ITCZ extends across the Pacific Ocean north of the equator, while the SPCZ extends southeast from the western central Pacific to approximately 30°S, 120°W in boreal winter [21]. During El Niño years, the ITCZ and SPCZ tend to merge in the central Pacific, accompanied by increasing rainfall in the ITCZ and the northeastern SPCZ [21,22].
Changes in precipitation over the ocean are significantly correlated with ocean dynamics through air–sea interactions. For example, SST anomalies, which are the expression of ENSO events and the response to evaporation and downward solar radiation, are generally observed positively correlated with precipitation in the tropics [15,23,24]. Precipitation variability is also generally proportional to wind speed variability associated with ENSO; high wind speeds are associated with higher evaporation and latent heat flux from the ocean to the atmosphere [15,25]. Recent studies have also reported that El Niño events can be divided into two types based on the area where the largest September–February SST anomaly occurs: central Pacific (CP) El Niño (i.e., El Niño Modoki), and eastern Pacific (EP) El Niño (i.e., traditional El Niño) [26,27,28]. In contrast to the traditionally recognized El Niño, the El Niño Modoki phenomenon is characterized by anomalously warm central equatorial Pacific flanked by anomalously cool regions to both the west and east. Note that different types of El Niño phenomena may produce a variety of effects in precipitation across the globe [26].
In most published studies, the variability of precipitation over the Pacific Ocean has been investigated individually on seasonal or interannual timescales [14,23,24,29,30,31]. However, a more comprehensive understanding of the seasonal cycles of ENSO–precipitation relationships is important considering that El Niño typically peaks in boreal winter but can be strong in any season [4,13]. The objective of this study is therefore to provide a more integrated perspective of the variability of precipitation over the Pacific on both seasonal and interannual timescales, and of the seasonal evolution of precipitation associated with the two types of El Niño events in the Pacific, based on TRMM precipitation estimates from 1998 to 2014. The seasonal evolution patterns associated with ocean dynamic anomalies, including anomalies in SST, sea level, and sea surface wind (SSW), are also examined in this manuscript.
The manuscript is organized as follows. Section 2 describes the datasets and methodologies used in this study. Results are presented in Section 3 in four parts: (1) seasonal and interannual variability of precipitation based on empirical orthogonal function (EOF) analysis; (2) dominant seasonal precipitation evolution associated with interannual variability derived from season-reliant EOF (SEOF) analysis; (3) relationships between the dominant SEOF modes of precipitation and climate indices (the ENSO index and the Pacific Decadal Oscillation index) identified through lagged correlation analysis; and (4) seasonal evolution patterns of ocean dynamic anomalies associated with SEOF modes of precipitation. A discussion of determining which type of El Niño dominates the seasonal evolution of ENSO–precipitation relationships is given in Section 4. Finally, conclusions are provided in Section 5.

2. Datasets and Methods

Various satellite products were used to analyze the variability of precipitation and the associated ocean dynamic factors in the Pacific Ocean, including precipitation, SST, sea level anomalies (SLA), and SSW. Table 1 summarizes the sources, timespans, and the temporal and spatial resolutions of remote sensing datasets. These datasets include: the Tropical Rainfall Measuring Mission (TRMM) 3B43 precipitation product, Version 7, provided by the NASA Goddard Earth Sciences Data and Information Services Center; Optimum Interpolation SST, Version 2, provided by the NOAA/OAR/ESRL Physical Sciences Division [32]; SLA products derived from multiple satellite sensors (Jason-1, TOPEX/Poseidon, Geosat Follow-On, European Remote Sensing 2 and Environmental Satellite) and distributed by AVISO [33]; and the Cross-Calibrated Multi-Platform (CCMP) V1.1 ocean surface winds dataset derived from SSM/I, TMI, AMSR-E, SeaWinds on QuikSCAT, and SeaWinds on ADEOS-II [34] and provided by the NASA Physical Oceanography Distributed Active Archive Center (podaac.jpl.nasa.gov).
In addition, four indices of Pacific climate variability were used in this study, the multivariate ENSO index (MEI) [35], the Pacific Decadal Oscillation (PDO) index [36], the El Niño Modoki index (EMI) [37], and the Niño 3 index [38].
A number of statistical methods were used to differentiate the seasonal and interannual variabilities of precipitation, including EOF [39] and SEOF [40] analysis. The EOF is a statistical method used to decompose the variability of a field into sums of modes, each of which is described as a spatial pattern and a time series [41]. To derive the variability of precipitation on an interannual timescale, 13-month running means were used to filter out annual variation and seasonal variability. EOF analysis was able to reveal the spatial patterns and temporal evolution of the dominant modes on seasonal or interannual timescales individually. However, the EOF was unable to determine the combined seasonal and interannual evolution of a single dominant mode. Therefore, we used the SEOF, which was discussed in detail by Wang and An [40], to identify the dominant season-dependent interannual variability modes and to depict seasonally evolving anomalies throughout a full year. El Niño is a strongly phase-locked phenomenon with a seasonal cycle, which initiates during the boreal spring or summer, peaks during autumn or winter, and terminates during spring [42]. Therefore, the precipitation anomalies applied in the SEOF analysis were in the seasonal sequence of a “monsoon year” [43], beginning in the boreal summer of year 0, denoted as June–July–August (JJA(0)), to the boreal spring of the following year (year 1), referred to as March–April–May (MAM(1)). The precipitation anomalies for JJA(0), September–October–November (SON(0)), December–January–February (DJF(0) or D(0)JF(1)) and MAM(1) were together treated as a “yearly block” to construct a covariance matrix. After the EOF decomposition was performed, the yearly block was then divided into four consecutive seasonal anomalies to identify seasonally evolving modes. The statistical significance test applied to the EOF and SEOF modes was based on the rule of thumb proposed by North et al. [44]. The relative separation of the eigenvalues of each mode were examined by computing the sampling error, i.e., λ × (2/N)1/2, where λ is a given eigenvalue and N is the length of time series, and checking that the spacing between the two eigenvalues is larger than the sampling error of them [44,45].
We also used the lagged correlation and regression analysis methods to identify the relationships between principal seasonal evolving modes for precipitation and climate-related indices and ocean dynamic variables, i.e., SST, SLA, and SSW.

3. Results

3.1. Seasonal and Interannual Variability of Precipitation Based on EOF Analysis

The EOF was applied to the monthly precipitation anomalies to identify the leading modes of precipitation over the Pacific Ocean. According to the rule of North et al. [44], only the first two seasonal modes were statistically significant and distinguishable. The leading two modes, which account for 20.8% and 7.4% of the total variance respectively, presented dominant seasonal variabilities in precipitation. The spatial patterns of the first two leading modes are shown in Figure 1a,b. The corresponding temporal coefficients of the two leading modes are presented in Figure 1c,d. The positive (negative) spatial distributions and positive (negative) temporal coefficients yield positive precipitation anomalies, whereas the positive (negative) spatial distributions and negative (positive) temporal coefficients yield negative precipitation anomalies.
In term of temporal variation, the PC of the first mode shown in Figure 1c indicates seasonal variation of precipitation with peaks in June–August (boreal summer) and troughs in December–February (boreal winter), whereas the PC of the second mode shown in Figure 1d exhibits variation with peaks in September–November (boreal autumn) and troughs in March–May (boreal spring). The combination of the PCs for the two modes thus describes a consecutive annual cycle of variation in precipitation over the Pacific Ocean.
Figure 1a shows the spatial variation pattern of precipitation in boreal summer and winter. The most notable spatial feature is the approximately symmetrical but opposite variation structure north and south of the latitude 5°N. Specifically, there is a zonal positive anomaly band along the ITCZ within the latitudes of 5–20°N and negative anomaly bands in the SPCZ and eastern equatorial Pacific between latitudes of 5°S–5°N. These patterns mean that in boreal summer, rainfall increases in the ITCZ and tropical offshore regions, including the South China Sea, Philippine Sea, and the seas west of Mexico and Colombia, whereas rainfall decreases within 20°S–5°N, especially in the SPCZ region and the eastern equatorial Pacific between 5°S and 5°N. For the midlatitudes of 20–50°N, precipitation increases along the western offshore region but decreases in the northeastern Pacific in boreal summer, and the reverse situation occurs in boreal winter. In the midlatitudes of the South Pacific Ocean, in contrast, precipitation increases less significantly during austral winter but decreases in austral summer.
Figure 1b presents the spatial variation pattern of precipitation in boreal spring and autumn. One remarkable feature is the shrinking of the ITCZ in boreal autumn and a widespread decrease in precipitation in the equatorial Pacific, whereas it increases in the SPCZ and over the Maritime Continent. During boreal spring, however, a double ITCZ forms: one located north and another south of the equator, along the latitudes of 5°N and 5°S, respectively. Meanwhile, a narrow ridge of high pressure and reduced precipitation forms between these two convergence zones. In the midlatitudes of the Northern Hemisphere, conditions become dry on the eastern coast of China and wet across most of the North Pacific Ocean during boreal autumn. For the midlatitudes of the South Pacific Ocean, precipitation increases in austral autumn but decreases in austral spring.
The interannual variability of precipitation was determined using EOF analysis on 13-month running mean datasets. The first mode of precipitation over the Pacific accounts for 36.5% of the total variance. The spatial distribution and principal components of interannual variability in precipitation from July 1998 to June 2014 are shown in Figure 2.
The time series of the PC has a close relationship with ENSO, with a correlation coefficient of 0.81 (passing the 95% Student’s t-test). This correlation indicates that this EOF mode reveals the interannual precipitation variability associated with ENSO. The positive PC values plotted in Figure 2b coincide with the El Niño years 2002–2003, 2004–2005, 2006–2007, 2009–2010, 2012–2013, and 2014–2015, and the negative values coincide with the La Niña years 1998–1999, 1999–2001, 2007–2008, and 2010–2011 [46,47]. The spatial pattern shown in Figure 2a is characterized by the significantly positive, wedge-shaped, westward-pointing feature centered along the equator in the central tropical Pacific that extends eastward along the IPCZ during El Niño years. Meanwhile, a negative precipitation anomaly exists in the western region of the warm pool, i.e., over the Maritime Continent and seas northeast of Australia. The reverse of these precipitation anomalies occurs during La Niña years. Overall, this EOF mode describes the precipitation variability during El Niño and La Niña years.

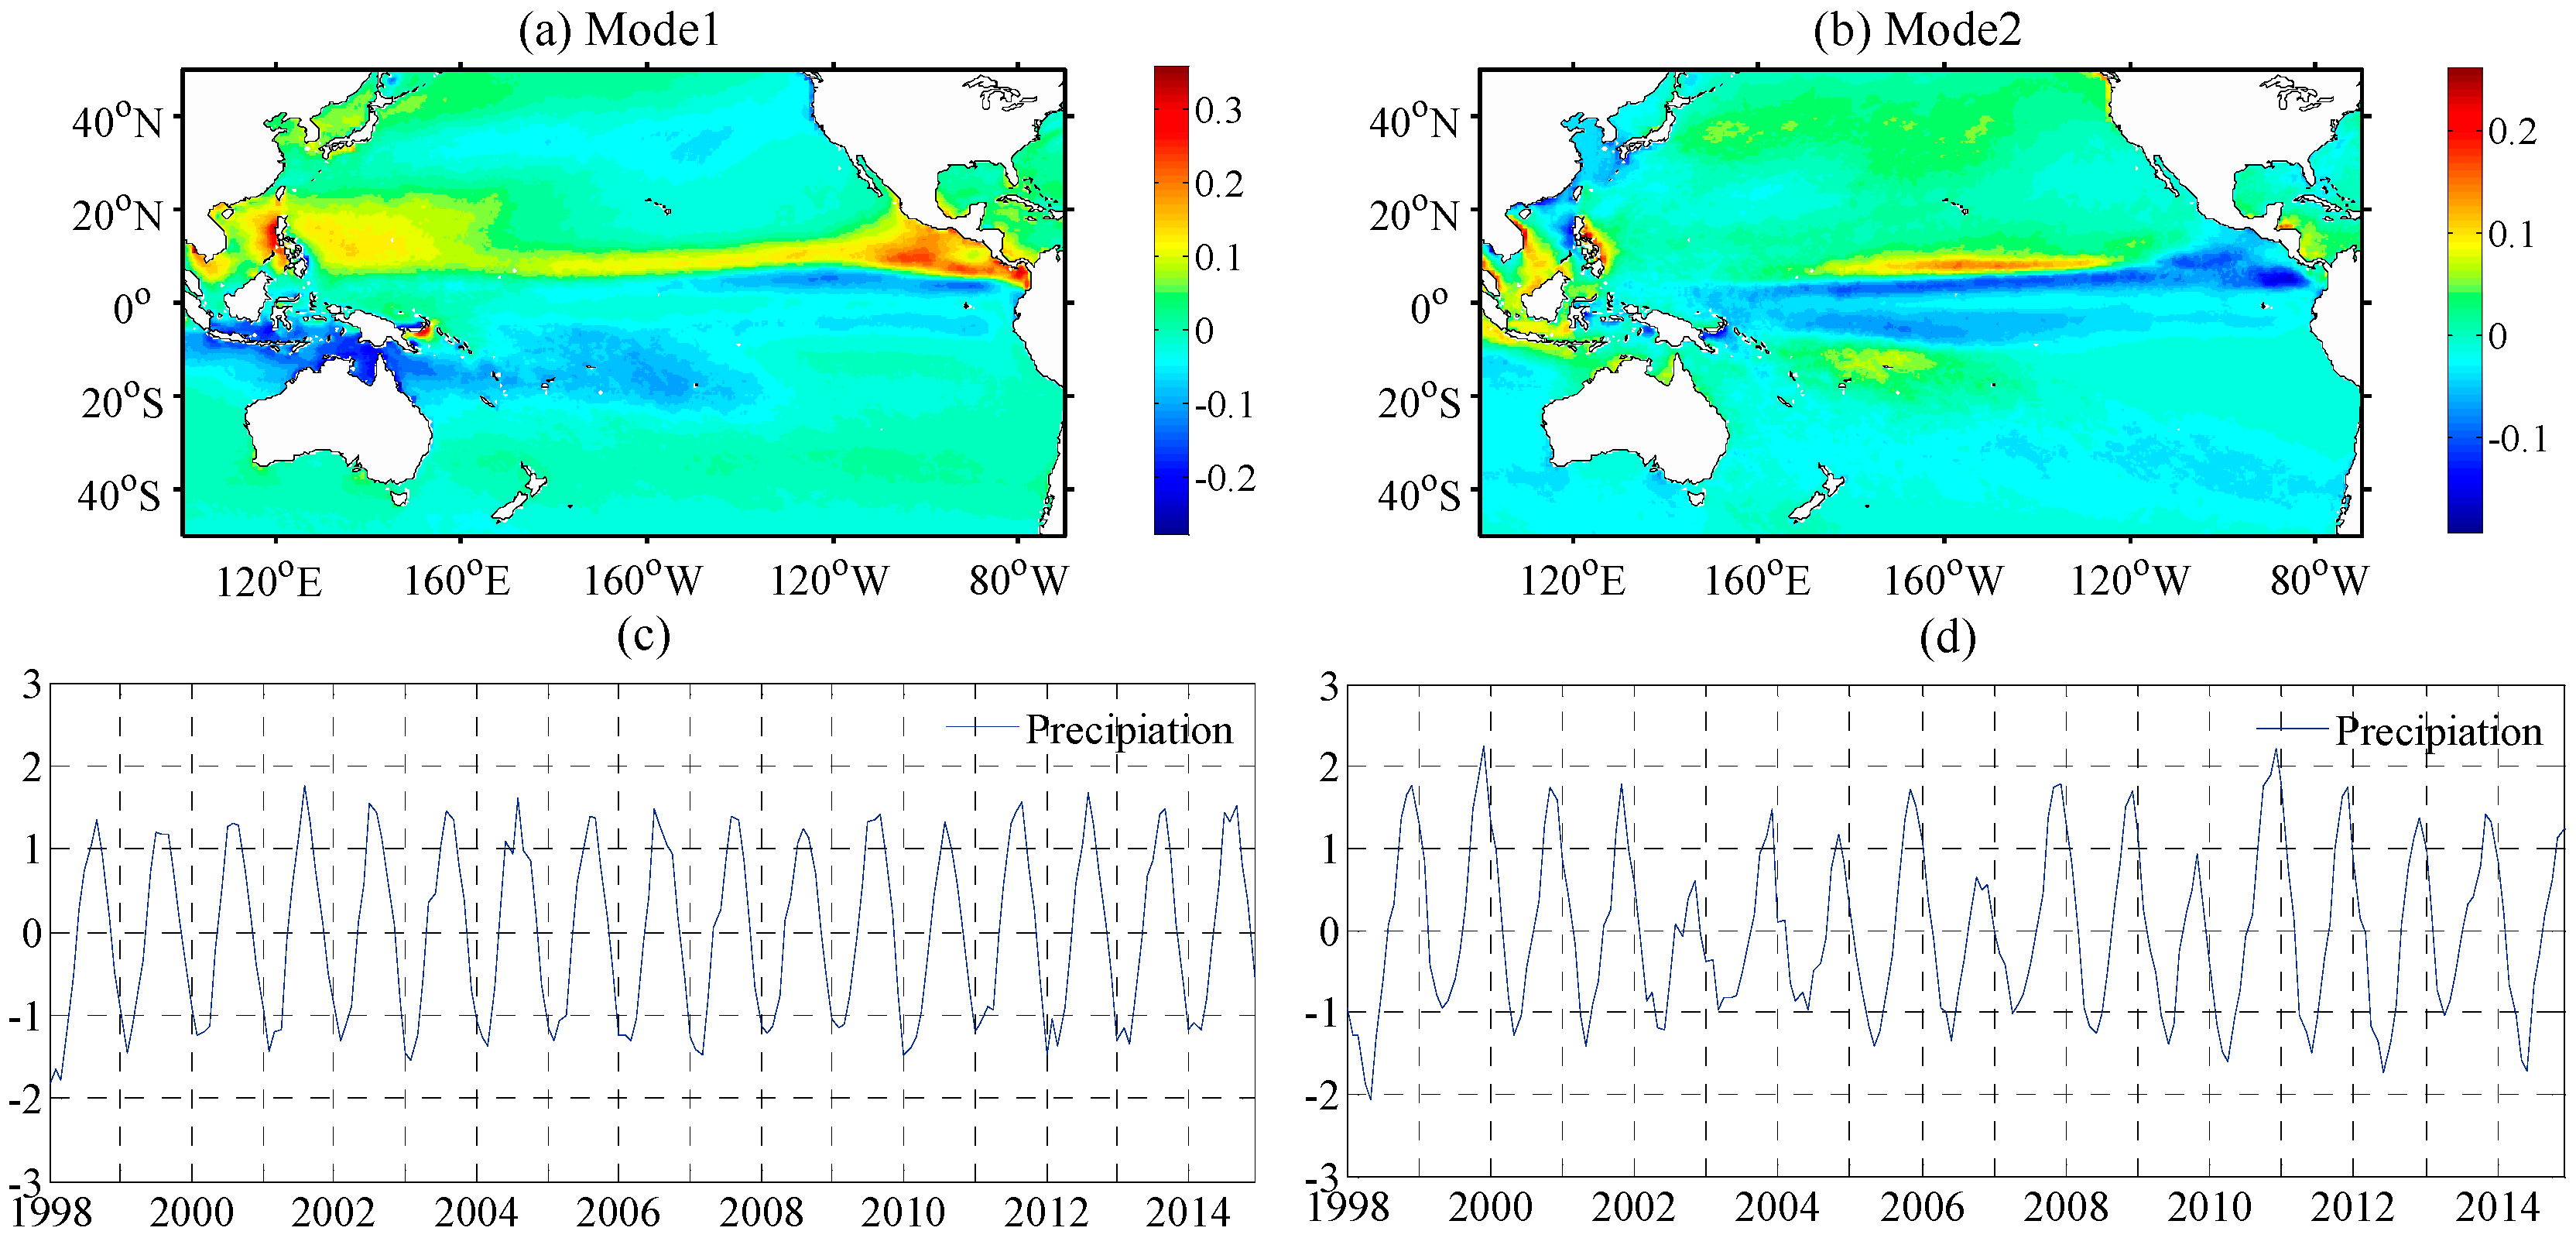
3.2. Dominant Seasonally Evolving Precipitation Patterns from SEOF Analysis

The season-dependent interannual variability of precipitation in the Pacific Ocean was evaluated through SEOF analysis. The first two leading modes account for 25.2% and 7.8% of the total variance, respectively. According to the rule of North et al. (1982), these two modes were well distinguishable from each other and from the remaining modes at the 95% confidence level.
Figure 3 shows the time series of the PCs of the first two SEOF modes of precipitation in the Pacific. Both of these modes show prominent interannual variabilities. PC1 of the SEOF (SEOF-PC1) reflects the ENSO cycle, with positive and negative values corresponding to El Niño and La Niña years, respectively. This relationship indicates that the first SEOF mode (SEOF1) describes the seasonal evolution of precipitation associated with ENSO. PC2 of the SEOF (SEOF-PC2) correlates closely with PC1 with a lag time of approximately one year, with a lagged correlation coefficient of 0.6 (which passes the 95% Student’s t-test); therefore, the second SEOF mode (SEOF2) lags behind SEOF1 by about one year. Figure 4 shows the seasonally evolving spatial patterns of the first two SEOF modes of precipitation. There is notable similarity between the general spatial pattern of SEOF1 in Figure 4a and the precipitation pattern of the first EOF mode in Figure 2a. The main difference is that the spatial pattern of the SEOF mode depicts the seasonal evolution of precipitation with interannual variability. Because the positive values of the SEOF-PC1 correspond to El Niño years, the spatial patterns in Figure 4a reveal the seasonal evolution of precipitation associated with El Niño events.
The most notable feature in Figure 4a is that the positive precipitation anomaly dominates the ITCZ and SPCZ regions in the equatorial Pacific, while the negative anomaly mainly occupies the Maritime Continent region and southeast of the Solomon Islands. More specifically, during the boreal summer of year zero, i.e., JJA(0), above-average precipitation occurs over the regions east of the Philippines, as well as along the ITCZ and SPCZ bands. During this period, a below-average precipitation pattern occurs only around the islands of Indonesia and the western coast of Mexico. For the boreal autumn, i.e., SON(0), however, anomalously dry conditions expand to a large area, especially in the western Pacific from the South China Sea to the Maritime Continent. Meanwhile, the ITCZ band of high precipitation narrows and moves slightly equatorward. During the following boreal winter, i.e., DJF(1), both the positive and negative precipitation variation patterns of the tropics are strengthened, and the development of El Niño reaches its mature phase. Precipitation increased in both the ITCZ and SPCZ, but the band regions north of the ITCZ and south of the SPCZ in the central Pacific experience declines in precipitation. During the subsequent boreal spring, i.e., MAM(1), the anomalously dry region extends from the Philippines to Australia across the Maritime Continent in the western Pacific. Meanwhile, in the central tropical Pacific, the western part of the SPCZ starts to shrink, and the diagonally-oriented eastern portion of the SPCZ that extends into the sub-tropics continues to experience high precipitation. Note that the eastern equatorial Pacific between 3°S and 10°S and east of 150°W receives lower than average precipitation during austral spring in El Niño years. A negative precipitation anomaly also occurs in the midlatitude Pacific Ocean in both the Northern and Southern Hemispheres. The negative anomalies are found mainly over the Maritime Continent and the South Pacific during the onset of El Niño events, but these anomalies shift to the North Pacific during the decay stage [13]. The opposite of the seasonal evolution of precipitation associated with El Niño development described above occurs with La Niña.
Based on the lagged correlation between SEOF-PC1 and SEOF-PC2, it is inferred that the spatial pattern of SEOF2 (see Figure 4b) is one year out of phase with SEOF1. Figure 4b features a less significant spatial variation pattern that is approximately opposite to that of SEOF1 during the period from JJA(0) to DJF(1). In the boreal summer, negative precipitation anomalies occur over the seas east of the Philippines and north of Papua New Guinea and extend eastward along latitudes of 3–5°N to the Columbian coast and southeastward to the southeast Pacific (~30°S, 120°W). This pattern implies that the ITCZ in the northern hemisphere moves northward to about 10°N and that the SPCZ starts to shrink. The northwestern Pacific also receives above average precipitation during the summer. During SON(0), wet conditions occur on the coasts of Asia, especially over the South China Sea and the Maritime Continent region. Meanwhile, the band that extends northeastward from New Guinea to the central tropical Pacific continues to experience dry conditions. By the boreal winter, these dry conditions occur over the Maritime Continent and north of New Guinea and the Solomon Islands, while the anomalously wet conditions dominate the central tropical Pacific. The ITCZ band east of 160°W moves closer to the equator during this season. A circle of above-average precipitation occurs in the North Pacific around 140°E–170°W, 8–30°N, and extends northeastward toward the California coast. During the following spring, the ITCZ in the Northern Hemisphere moves northward and extends from the Philippines eastward to Mexico, while most of the SPCZ region experiences below-average precipitation conditions.

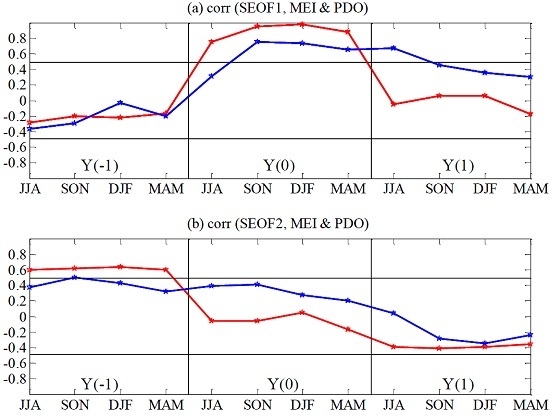
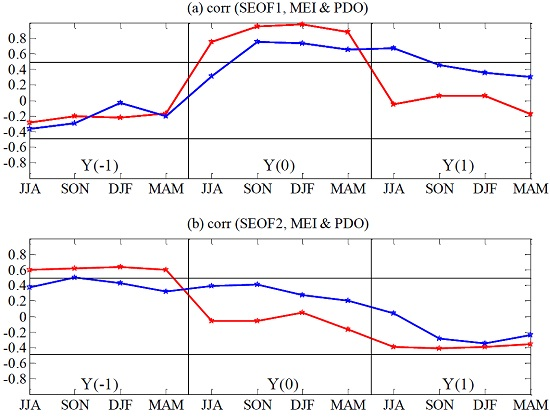
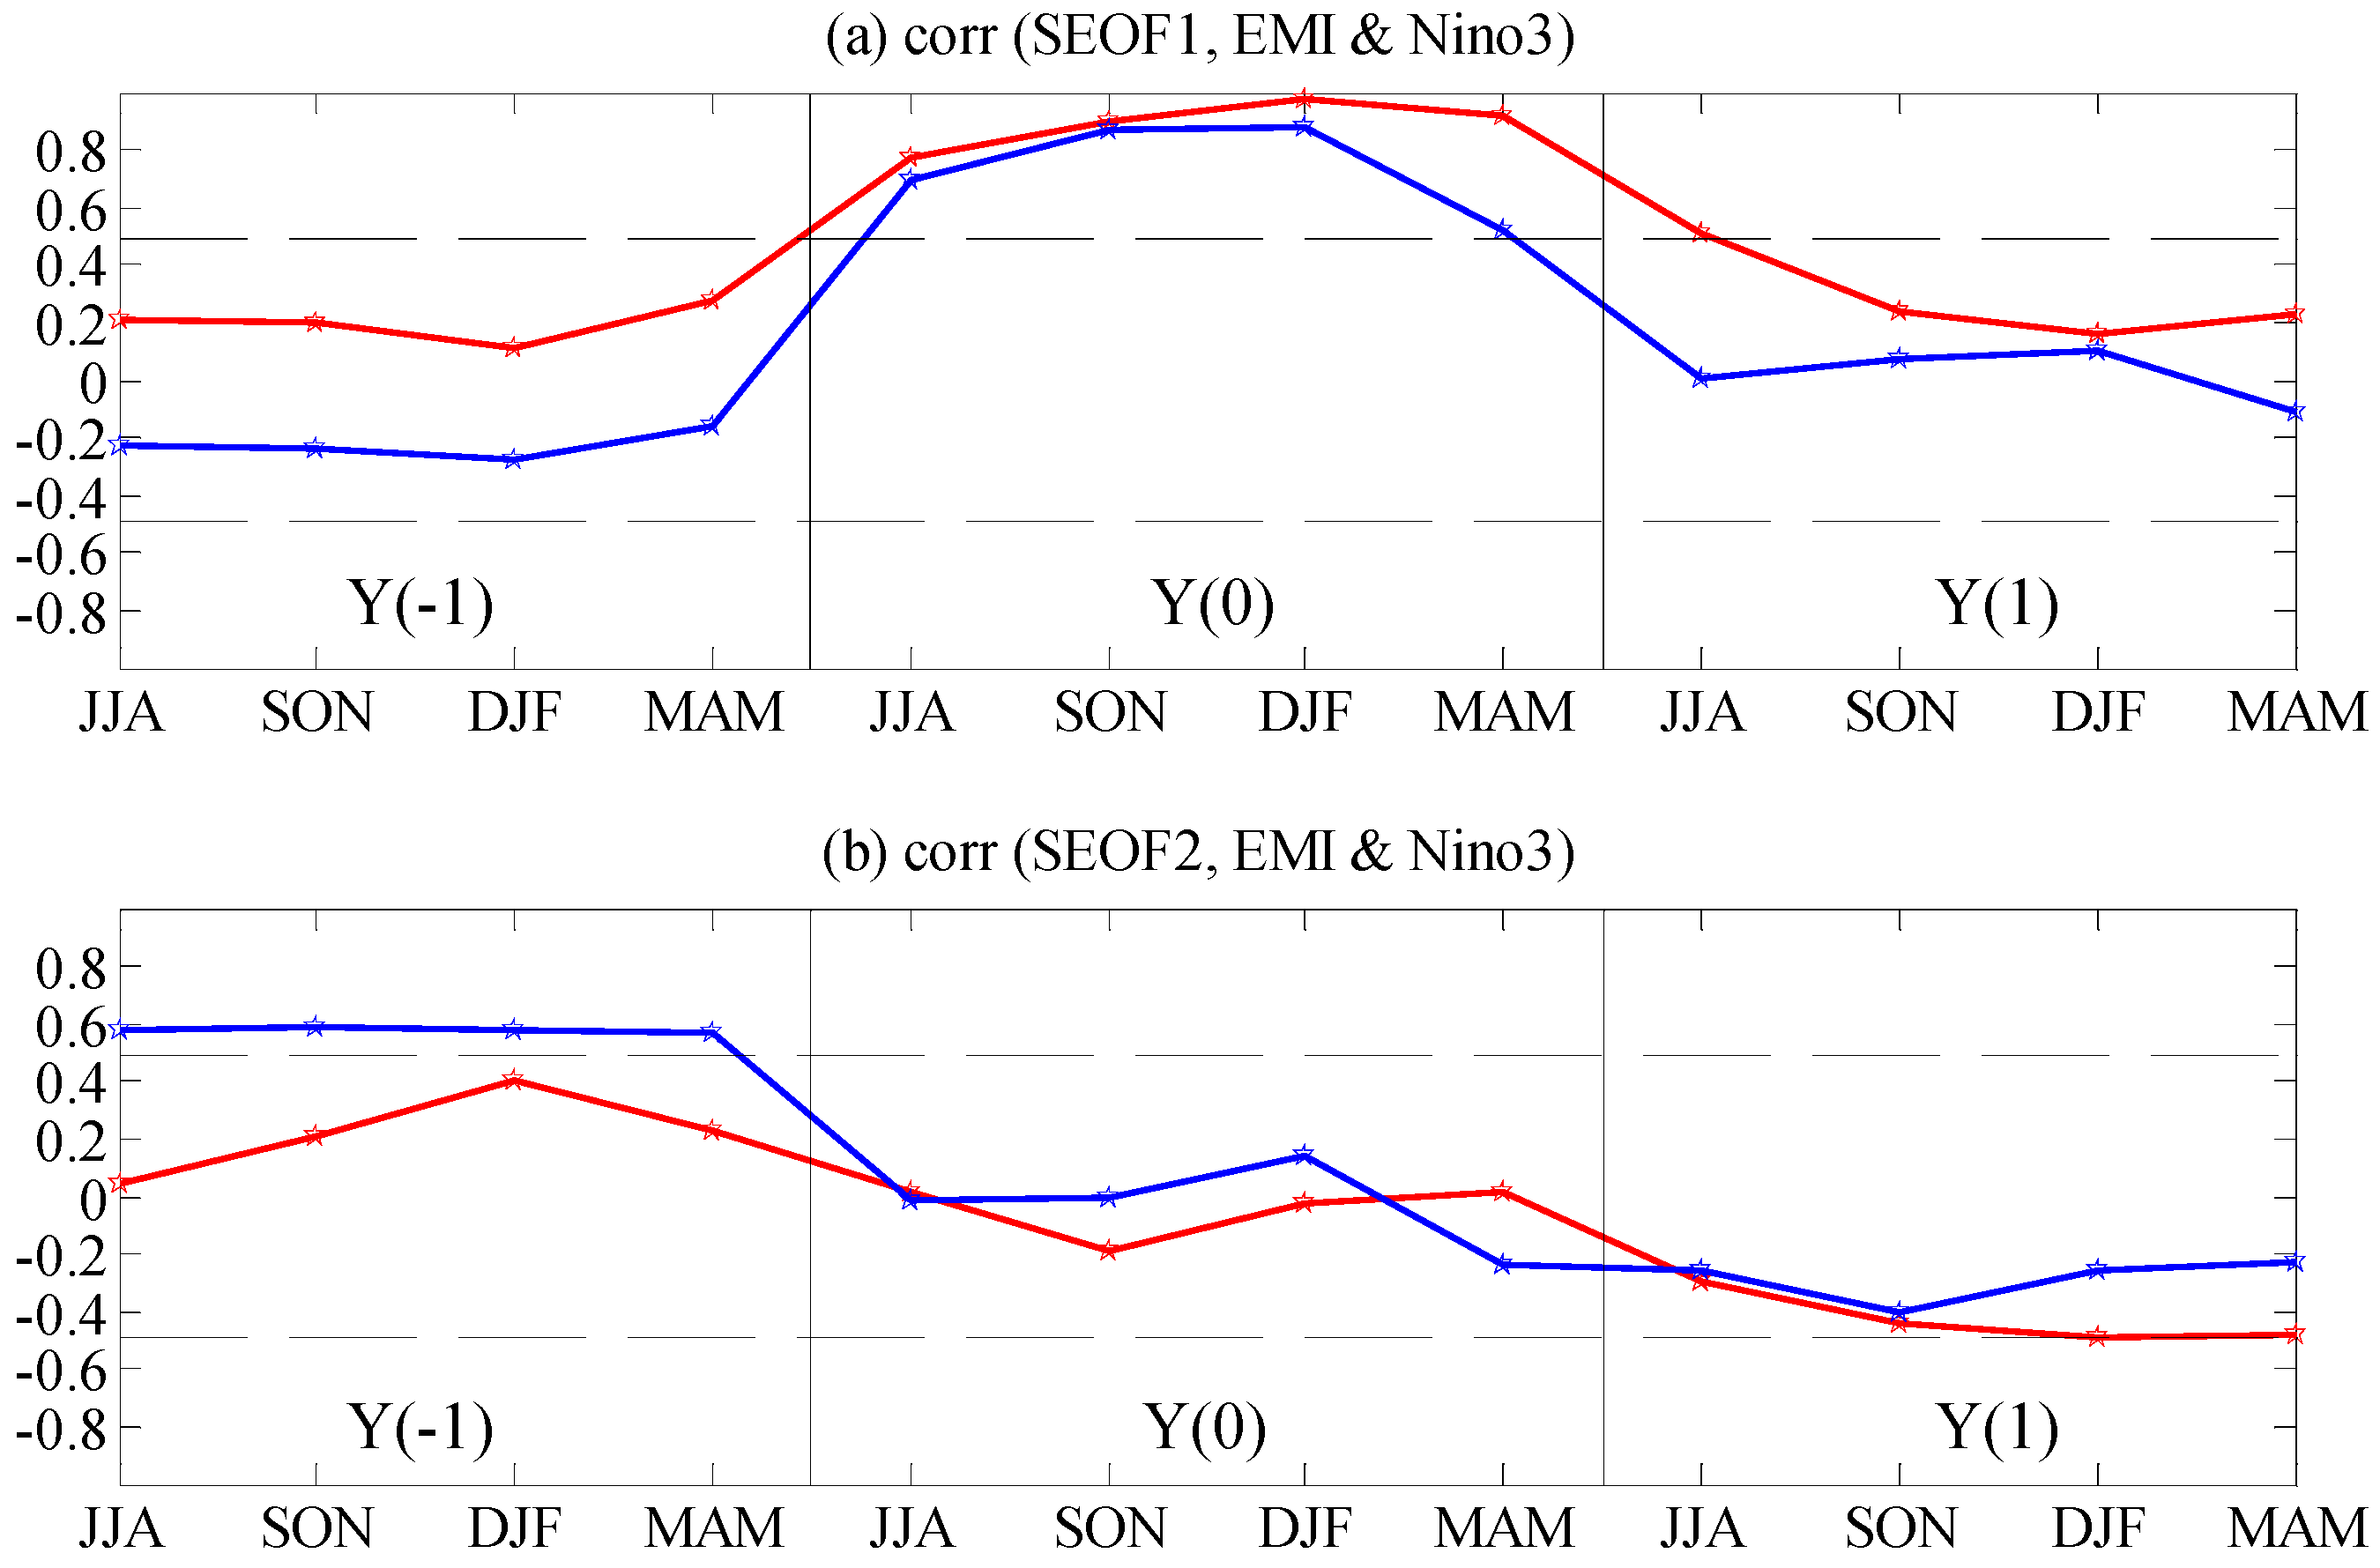
3.3. Relationships between the Dominant SEOF Modes and Climate Indices

To further demonstrate the relationships between the dominant SEOF modes of precipitation and climate variability, the lagged correlations between the first two precipitation SEOF-PCs and the MEI and PDO index are shown in Figure 5. Here, Year(−1) and Year(1), which are the abbreviations of Year(−1) and Year(1), indicate that the SEOF-PCs lags behind or leads its counterpart by one year, respectively. Year(0) , which is the abbreviation of Year(0), denotes simultaneous correlation. The lagged correlations between the first SEOF mode and the MEI and PDO index are presented in Figure 5a as red and blue lines, respectively. Note that the correlation coefficients between the SEOF-PC1 and the MEI (red line in Figure 5a) are positive and exceed the 5% significance level from JJA to MAM for Year(0), which indicates that there is simultaneous correlation between the precipitation SEOF1 and ENSO. Note that the SEOF1 and the MEI reach their maximum correlation coefficient of 0.97 in DJF(0). ENSO exhibits significant phase locking to the seasonal cycle; it starts in boreal spring, matures in boreal winter and decays in following spring or summer [48]. Because ENSO events tend to reach their peaks at the end of the year, we speculate that the SEOF1 is primarily associated with episodes of ENSO development.
Lagged correlations between the SEOF-PC1 and the PDO index (blue line in Figure 5a) are significant from boreal autumn, i.e., SON(0) to the summer of the next year, i.e., JJA(1). This lagged relationship indicates that PDO plays a crucial role in modulating the variability of precipitation on an interannual timescale. The correlations between the SEOF1 and the PDO index are weaker than those between the SEOF1 and the MEI and lag by one season, which signifies that PDO impacts the variability of precipitation from boreal autumn to the following spring and prolongs the impact of ENSO on precipitation by one season, specifically during the ENSO-decaying summer.
Lagged correlations of the SEOF-PC2 with the MEI and PDO index are shown in Figure 5b as red and blue lines, respectively. The simultaneous correlations between them are not statistically significant at the 5% level, but the lagged correlation is significant and positive from JJA to MAM in Year(−1), i.e., the SEOF2 lags behind ENSO by one year. This trend is consistent with the previous conclusions that the SEOF2 lags behind the SEOF1 by approximately one year and that the SEOF1 correlates simultaneously with ENSO. Therefore, the SEOF2 corresponds to the years immediately after ENSO events. The lagged correlation between the SEOF2 and the PDO index are not statistically significant at the 5% level, which indicates that PDO has no significant effect on the variability of precipitation during post-ENSO years.

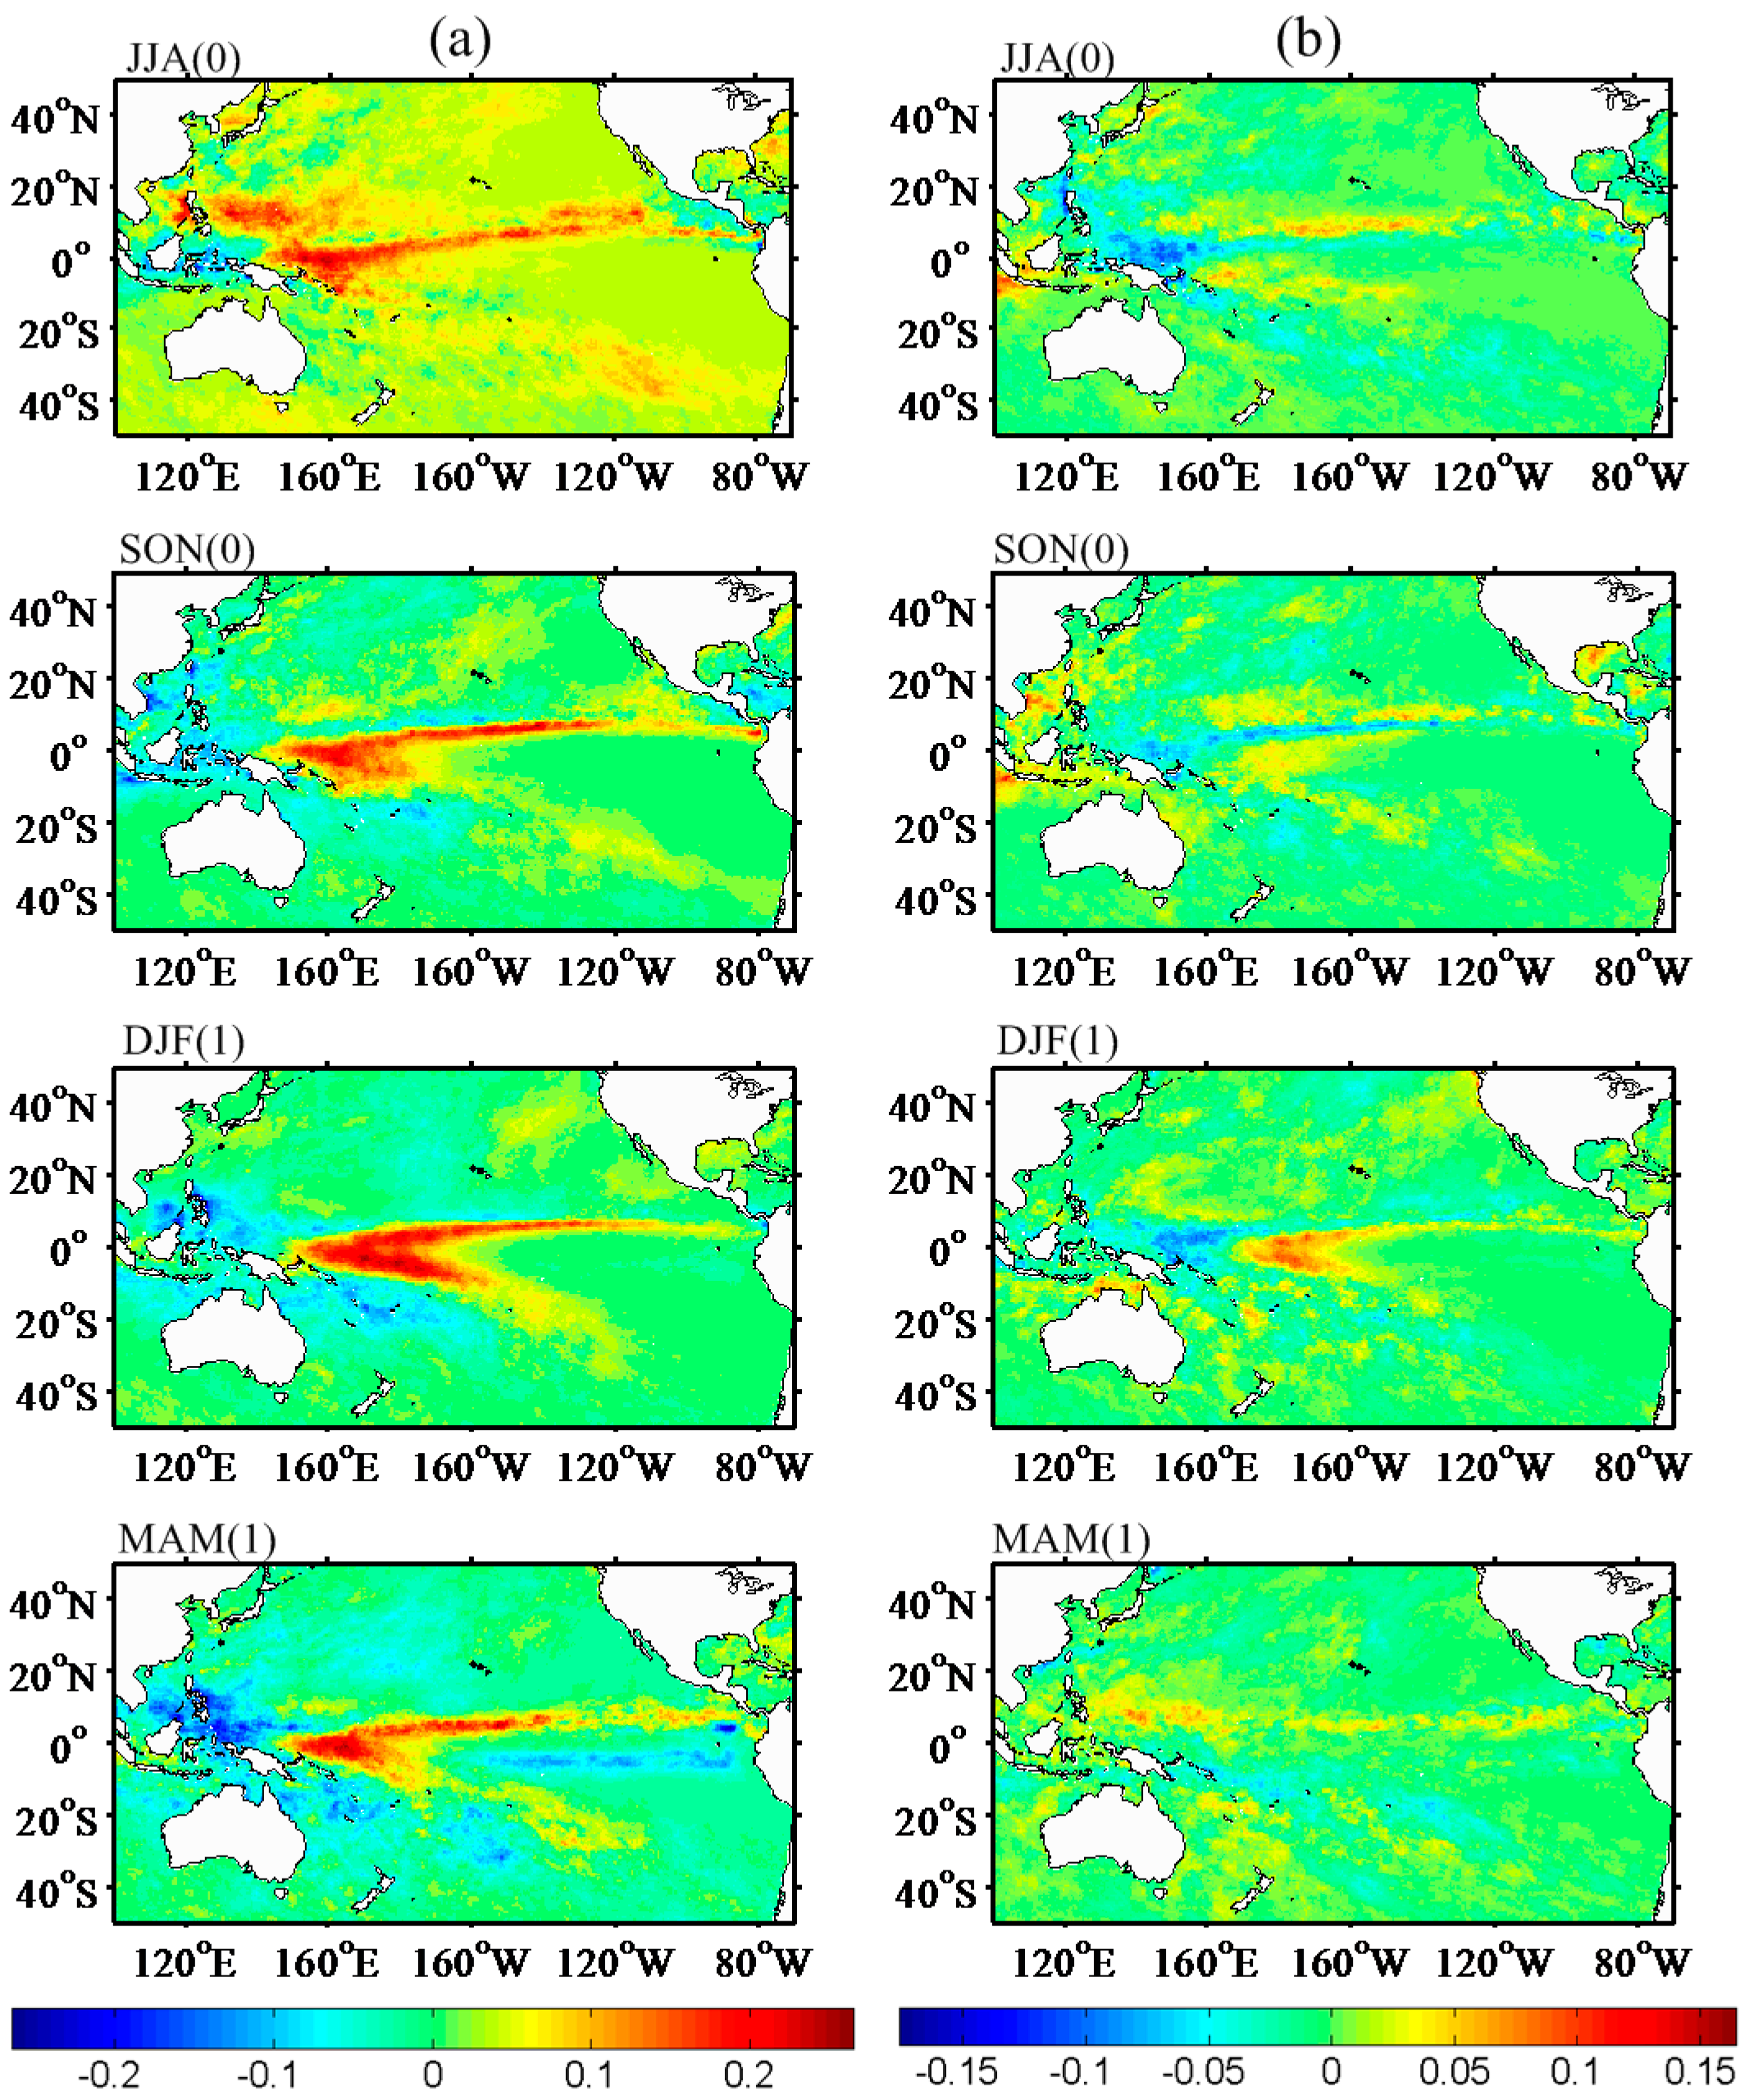
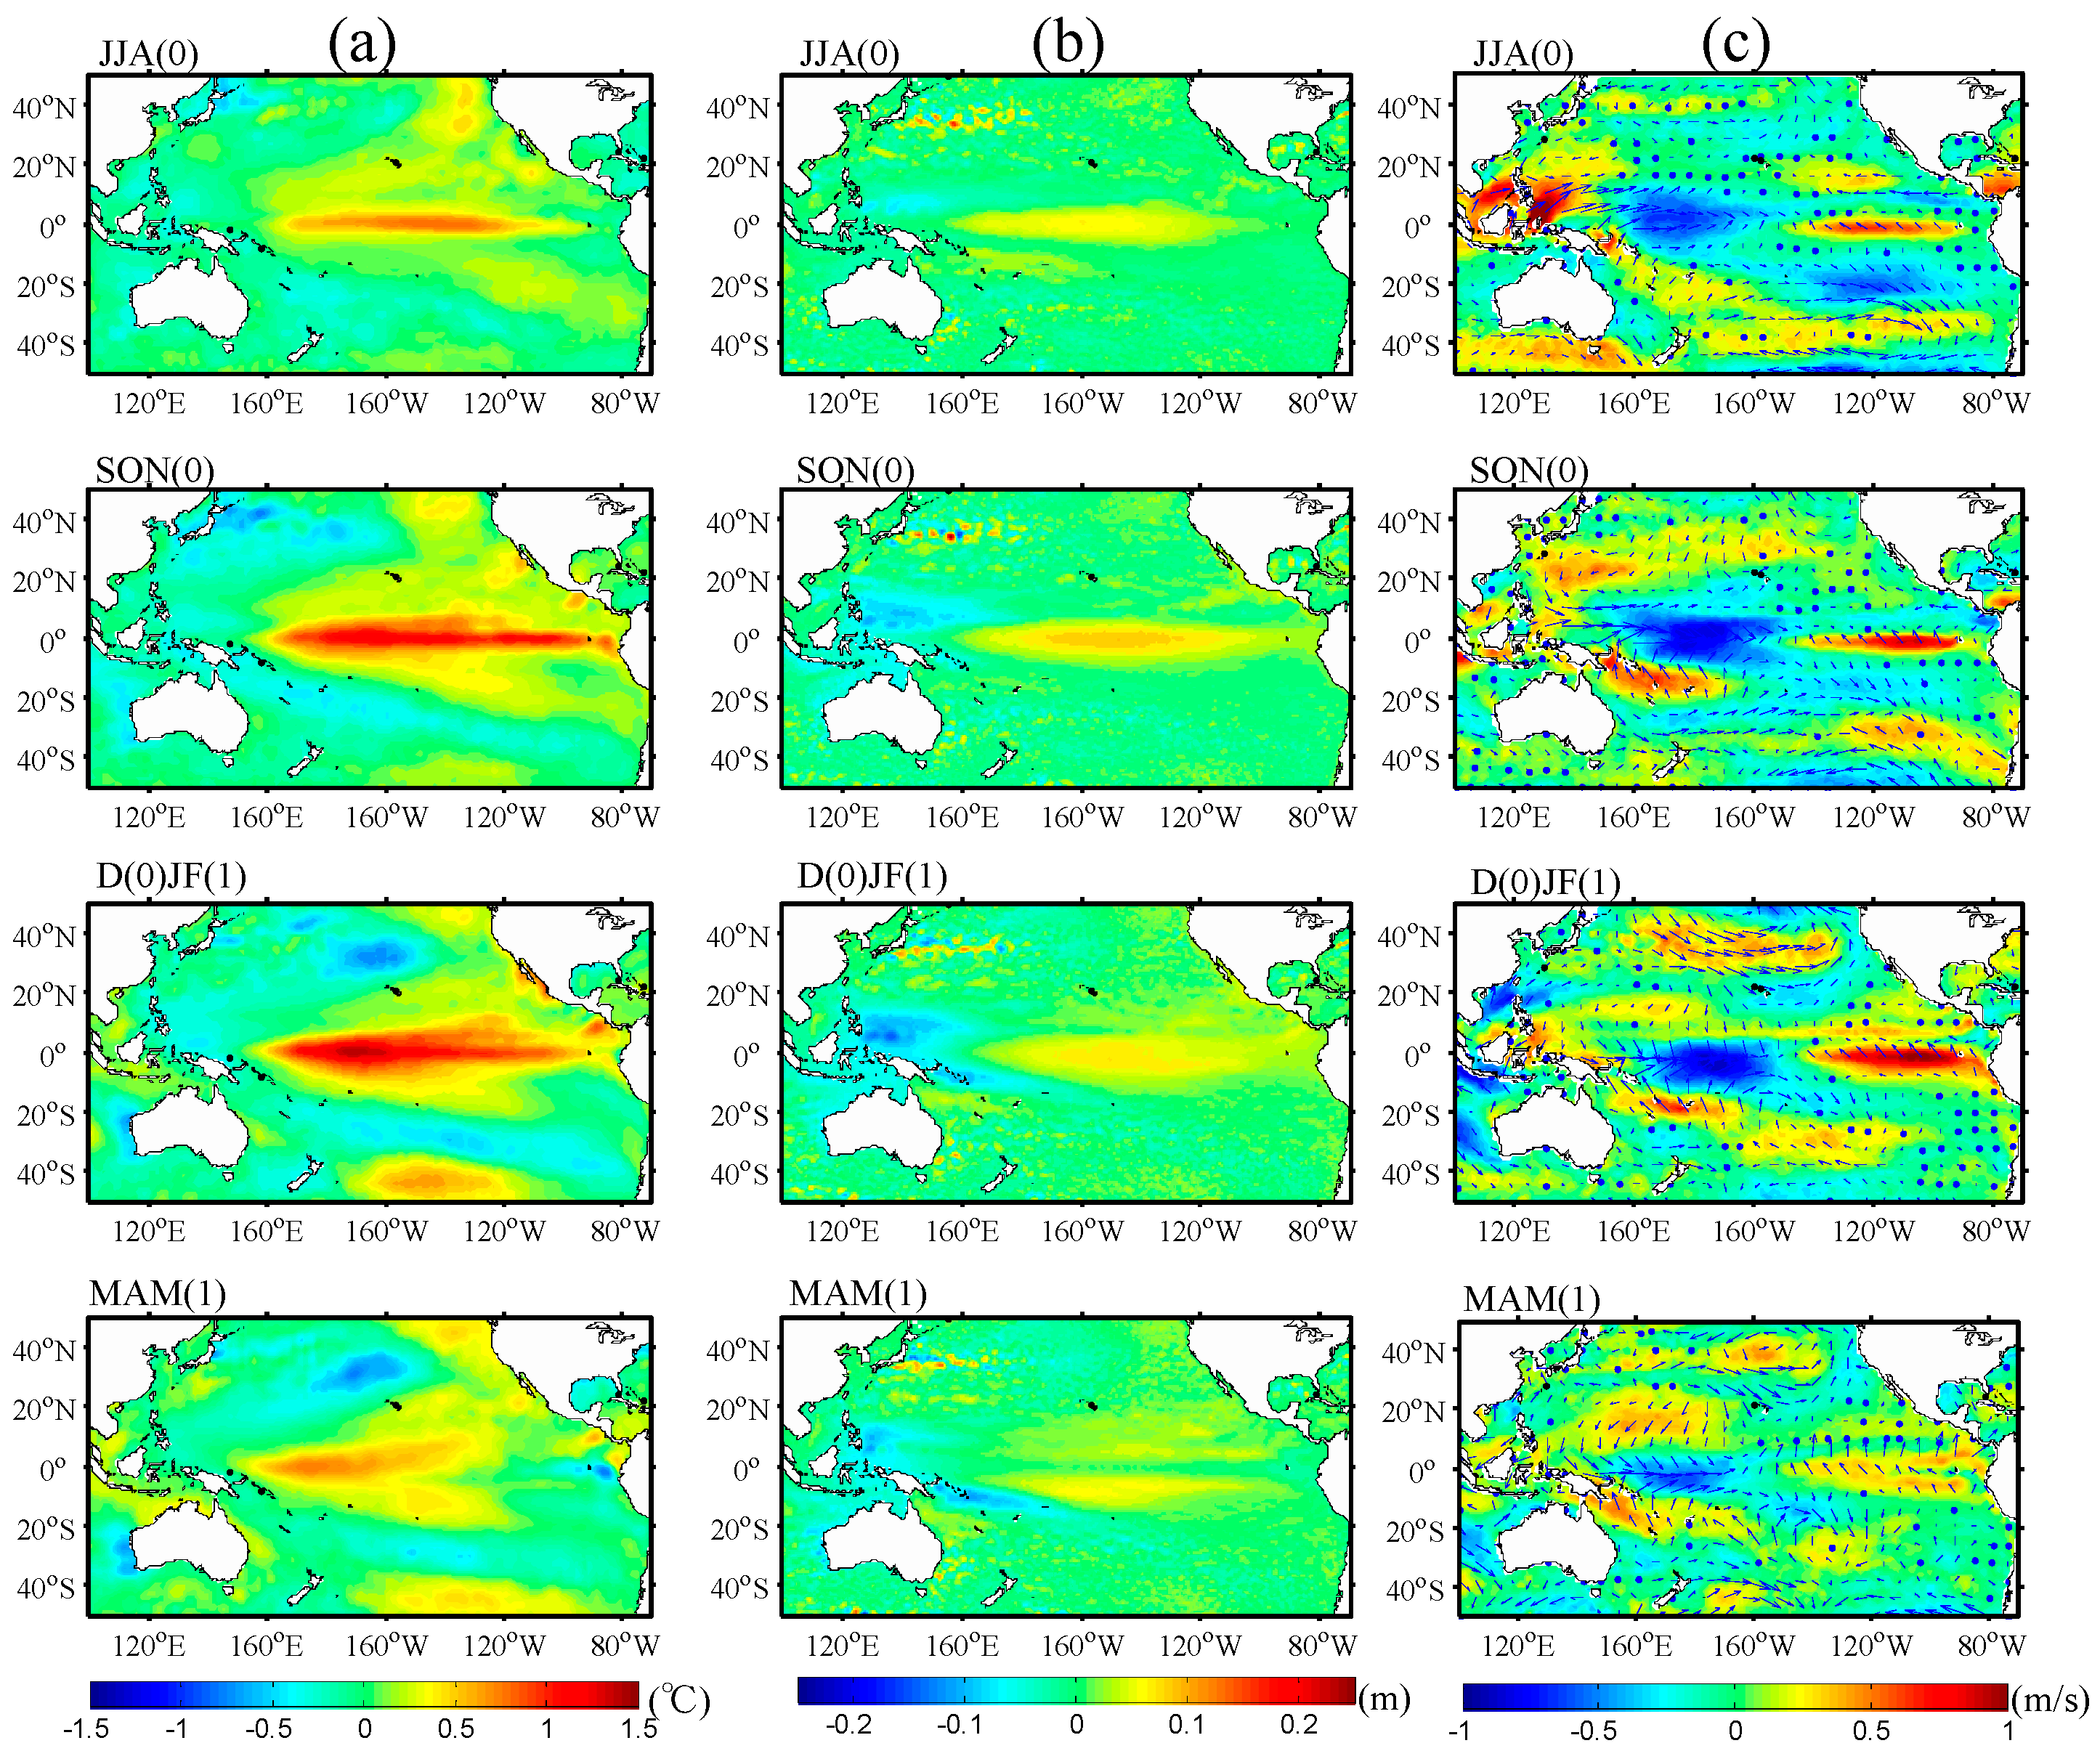
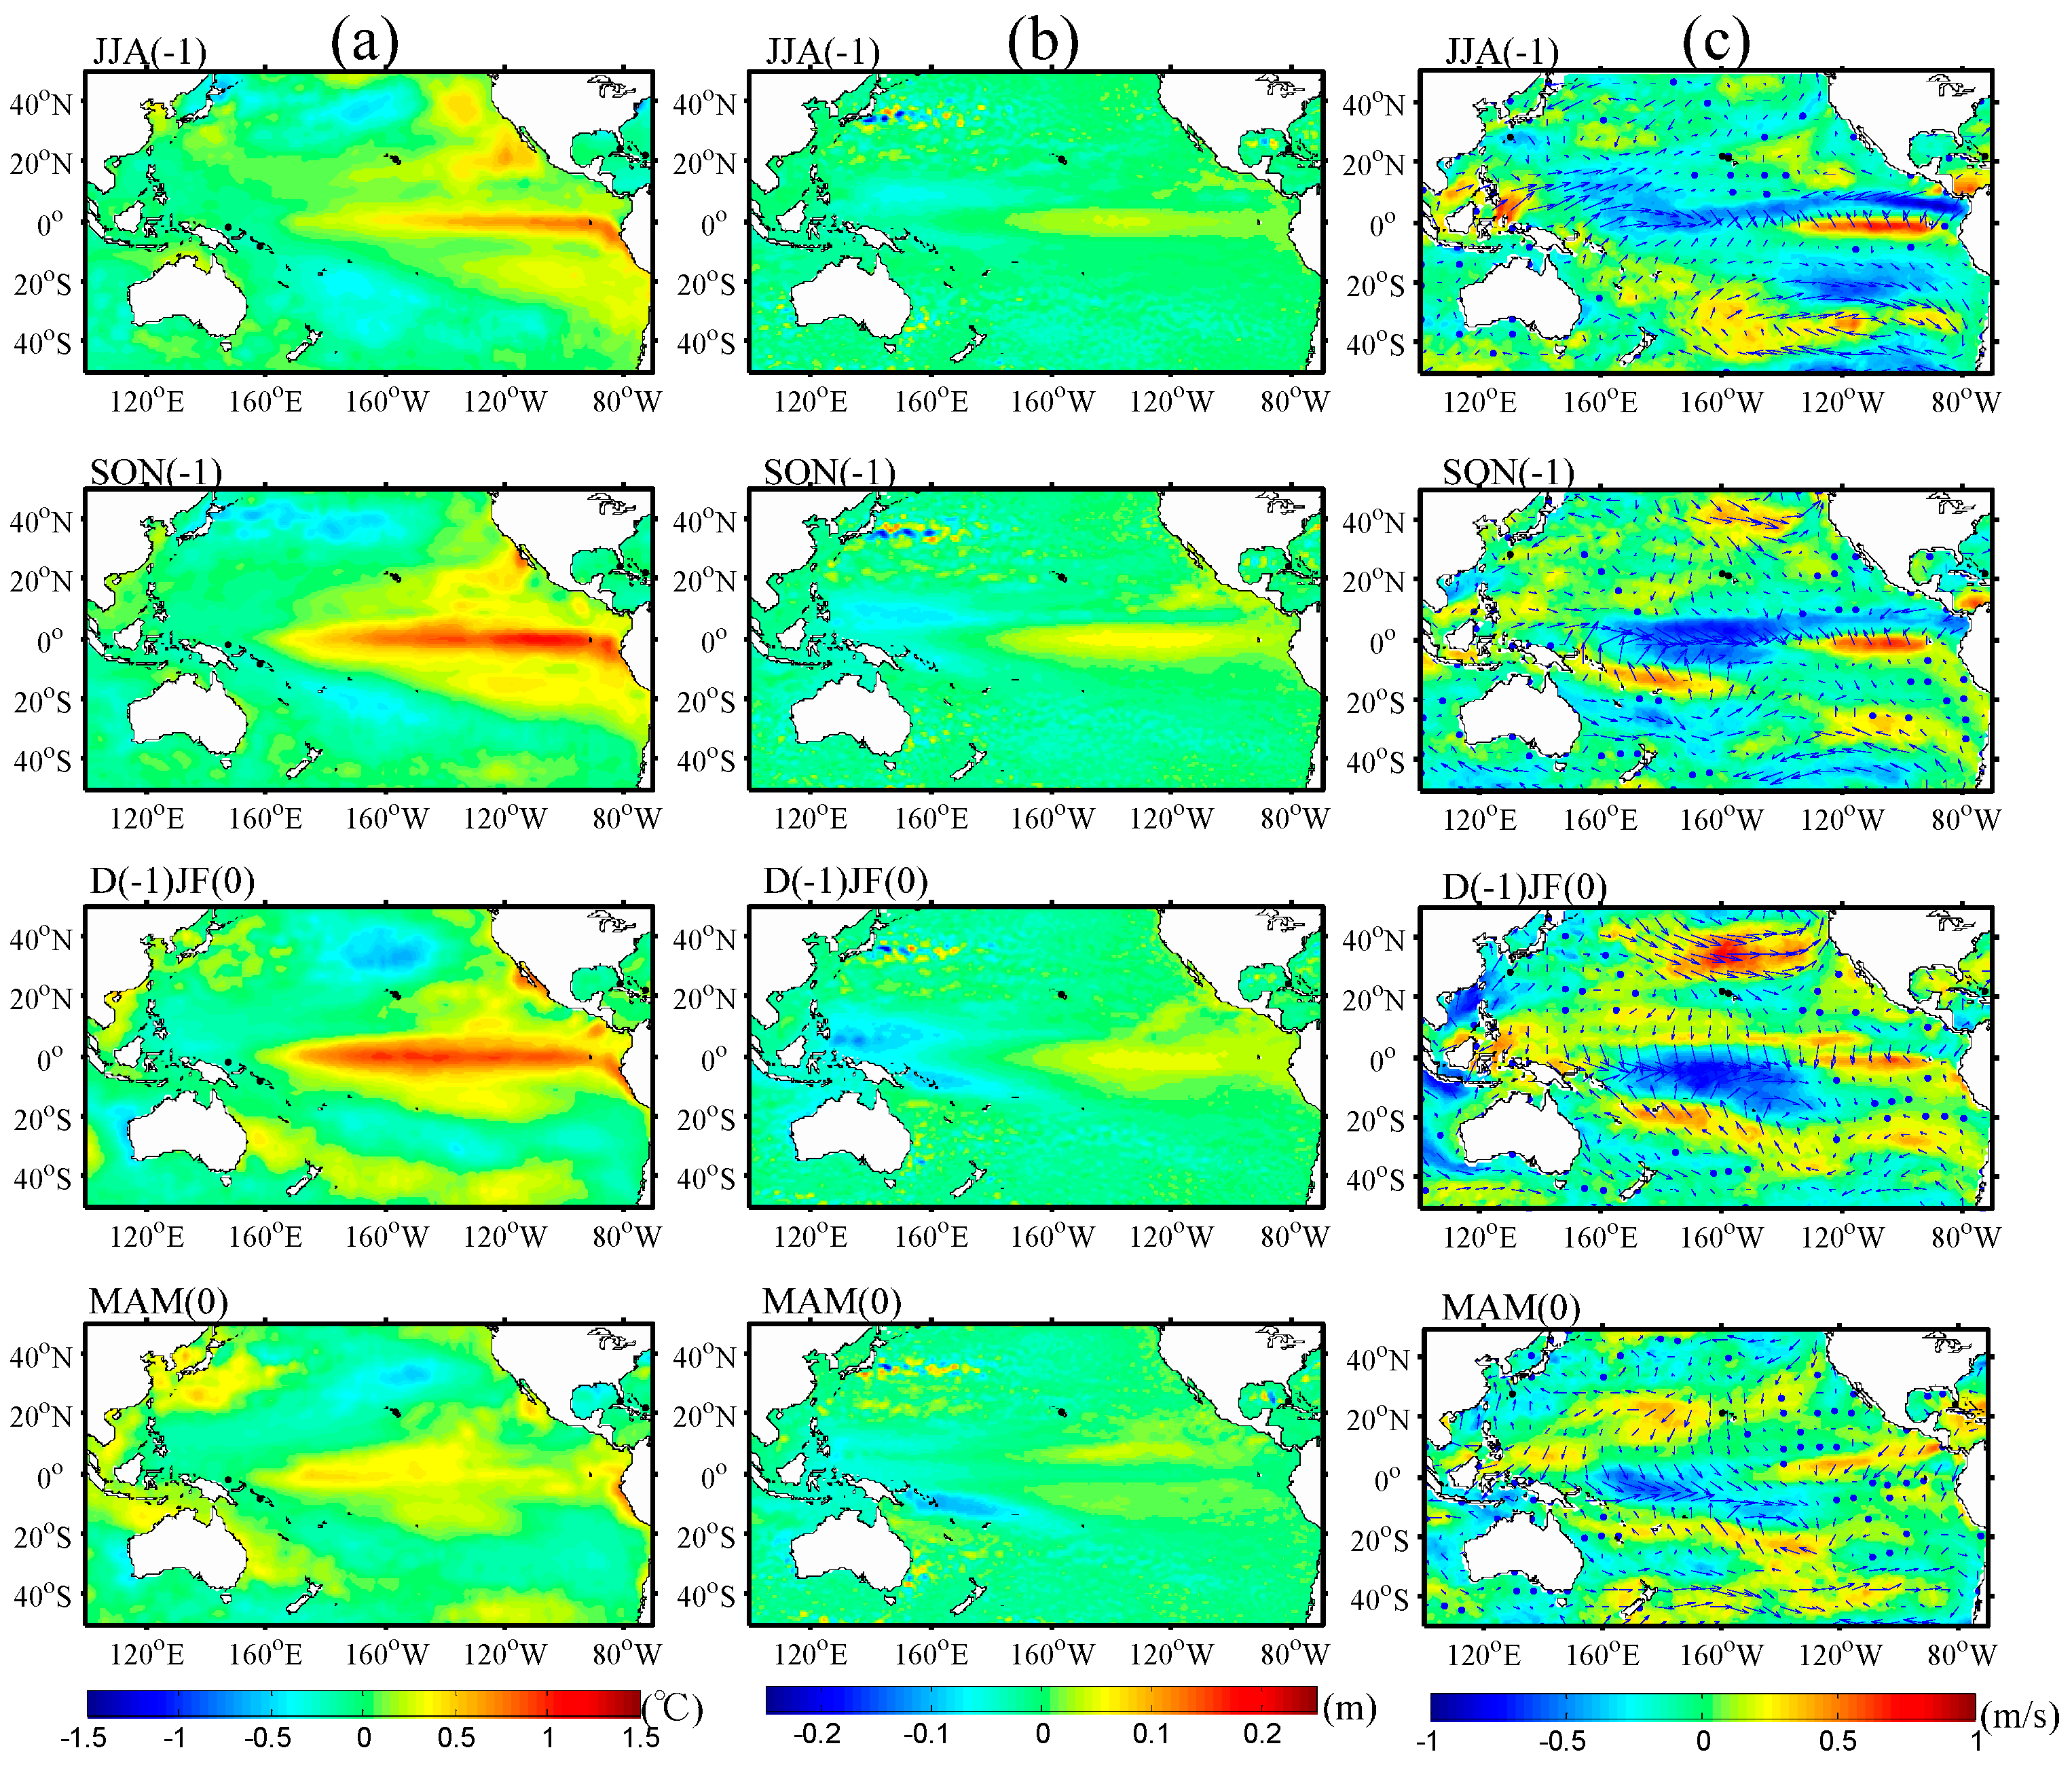
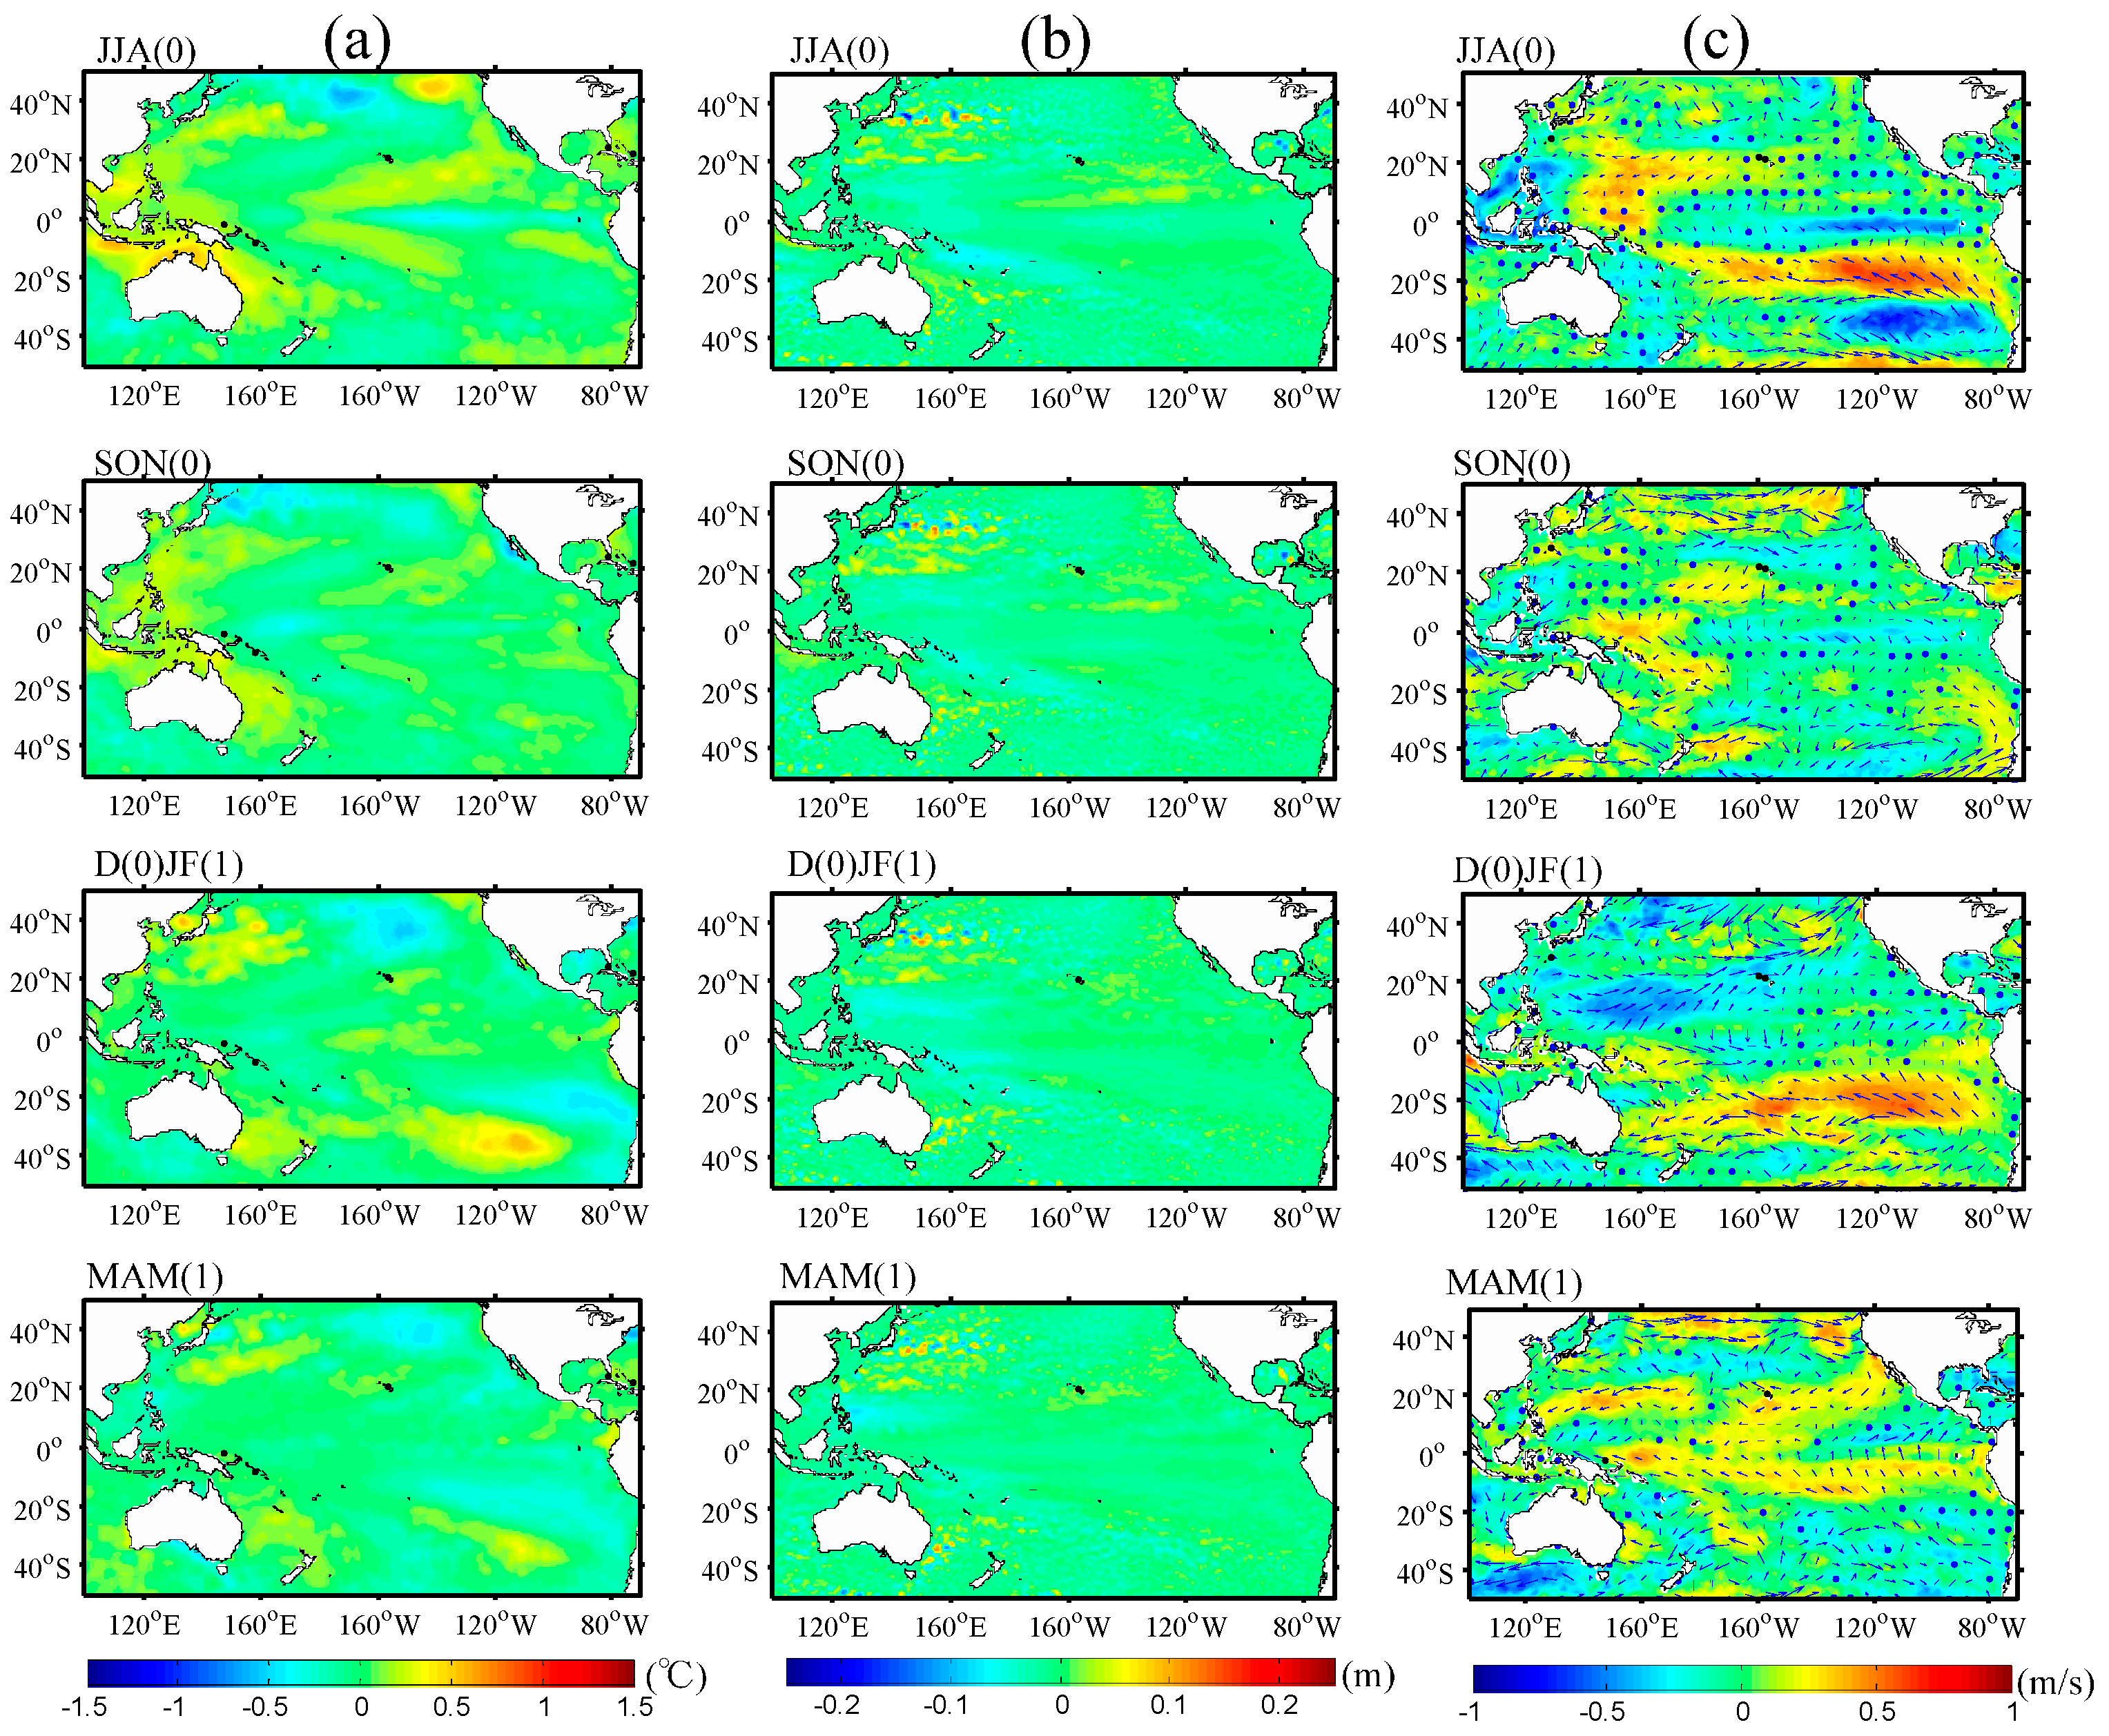
3.4. Seasonally Evolving Patterns of Ocean Dynamic Anomalies Associated with SEOF Modes of Precipitation

The seasonally evolving patterns of ocean dynamic factors (SST, SLA and SSW) in the Pacific associated with the first two SEOF modes of precipitation are shown in Figure 6, Figure 7 and Figure 8. The anomalies of these factors were regressed upon the SEOF-PC time series. To include the lagged correlations between SEOF modes and ENSO, we exhibit the simultaneous ocean dynamic patterns associated with SEOF1 in Figure 6, the one-year-leading ocean dynamic patterns associated with SEOF2 in Figure 7, and the simultaneous ocean dynamic patterns associated with SEOF2 in Figure 8.

3.4.1. SEOF1

The seasonally evolving patterns of SST anomalies from boreal summer, i.e., JJA(0), to the following spring, i.e., MAM(1), are shown in Figure 6a. These anomalies demonstrate the development of the El Niño event, most likely El Niño Modoki, with strong anomalous warming starting in the central tropical Pacific [26]. Specifically, this figure shows the seasonal evolution of El Niño Modoki as it initiates during JJA(0), develops during SON(0), peaks in D(0)JF(1) and decays in MAM(1). In the boreal summer, i.e., JJA(0), the positive SST anomaly pattern is centered mainly on the central equatorial Pacific and the western American coast, while the negative SST anomaly is less apparent and only appears east of Japan and in the midlatitude South Pacific. In boreal autumn, i.e., SON(0), El Niño develops with positive SST anomalies extending eastward along the equator toward the South American coast and negative anomalies expanding to the Kuroshio extension, the Maritime Continent, and southeastward in a band to the subtropical South Pacific. In the boreal winter, i.e., D(0)JF(1), El Niño reaches its mature phase, which is characterized by the most significant expansion of positive SST anomalies in the central and eastern equatorial Pacific. Note that the SST pattern of the PDO warm phase is also depicted, i.e., the anomalously cold SSTs in the central North Pacific and anomalously warm SSTs along the west coast of the Americas [49]. During the spring of the following year, i.e., MAM(1), positive SST anomalies in the tropics start to decay, but the warm phase of PDO continues to dominate the North Pacific. The significant PDO pattern in the North Pacific could only be seen from SON(0) to MAM(1), which is consistent with the conclusion revealed by Figure 5a that the SEOF1 is significantly correlated with the PDO index only from SON(0) to JJA(1). In fact, PDO experiences its highest energetic fluctuation during boreal winter and spring [49,50]. Therefore, the first SEOF mode of precipitation was associated with the development of El Niño and the warm phase of PDO.
The simultaneous seasonally evolving patterns of SLA regressed with the SEOF-PC1 are shown in Figure 6b. This figure exhibits the typical SLA structure of El Niño, i.e., the sea level was lower than average in the western tropical Pacific basin and higher than average in the central and eastern tropical Pacific basin [51,52]. More specifically, the negative SLA expands eastward toward 160°E, and the center of the positive anomaly also moves eastward from the boreal summer to winter. During the decaying phase of El Niño in the following spring, sea level starts to recover to its normal conditions, as shown by declines in the sizes and magnitudes of both the positive and negative SLA regions. This SLA pattern resembles the composite SLA for the central Pacific El Niño, i.e., El Niño Modoki, described by Chang et al. [53] (see their Figure 5b and Figure 7), from which we can further infer that the first SEOF mode of precipitation is more likely associated with El Niño Modoki rather than with the traditional El Niño.
Figure 6c depicts the seasonally evolving patterns of wind anomalies from the boreal summer to the following spring in relation to the precipitation SEOF1. In general, this figure reveals the ENSO patterns related to the Walker circulation cells over the tropical Pacific and wind variability over the midlatitudes [54,55]. During the boreal summer, i.e., JJA(0), westerly winds strengthen in the western basin of the warm pool, mainly over the South China Sea and the Maritime Continent, while wind speeds weaken and reverse direction within 160°E–160°W along the equator. From JJA(0) to D(0)JF(1), the ongoing wind anomalies help to reinforce the warm SSTs in the central and eastern equatorial Pacific and therefore lead to the maturation of El Niño. Overall, the weakened trade winds in the central tropical Pacific coincide with the increasing precipitation. The negative wind anomaly that extends northeastward and southeastward to the North and South American coasts is also consistent with the positive precipitation anomaly in the ITCZ and SPCZ shown in Figure 4a. Note that a band of strong easterly winds occurs in the eastern Pacific along the equator. This band appears during the boreal summer, develops during autumn and extends to the Peruvian coast during the boreal winter. However, these strong winds vanish during the decaying period of El Niño in the following spring when a negative precipitation anomaly emerges in the band region. In the boreal autumn and winter, the subtropical anticylone develops and dominates the northwestern Pacific. During winter, a southwesterly wind anomaly over the East China Sea and the South China Sea weakens the prevailing winds, which is associated with an increase in precipitation over the coastal waters of southeastern China. An anomalous cyclone occupies the midlatitude North Pacific during the boreal winter and following spring when the precipitation is below average. The reverse of these anomalies appears during La Niña events.

3.4.2. SEOF2

The seasonally evolving oceanic dynamic variables associated with the second SEOF mode are shown in Figure 7 and Figure 8. Figure 7 shows the one-year-ahead evolution patterns of SST, sea level and SSW anomalies, which are significantly correlated with ENSO. The one-year-leading seasonally evolving SST anomalies associated with the SEOF2 from JJA in Year (−1) to MAM in Year(0) are shown in Figure 7a. This SST anomaly pattern represents the development of a conventional El Niño event, i.e., the eastern Pacific (EP) El Niño. SSTs become warmer in the eastern equatorial Pacific during the boreal summer, continue to develop in the eastern and central equatorial Pacific in the boreal autumn until ENSO reaches the mature phase in the boreal winter, and finally return to normal in the boreal spring. Because the SEOF2 corresponds to the post-ENSO years in Figure 5b, we further infer that the second SEOF mode of precipitation is associated with post-EP El Niño years. Moreover, a warm PDO pattern with cold SSTs in the North Pacific and warm SSTs along the western American coast is shown in Figure 7a from SON(−1) and MAM(0). Therefore, although the lagged correlation between the SEOF2-PC and the PDO index is not statistically significant in Figure 5b, PDO may be an important factor, nonetheless, and may dominate ocean precipitation in the year after an ENSO event.
Figure 7b shows the seasonally evolving pattern of SLA one year prior to the second SEOF mode of precipitation. This pattern depicts similar SLA structure to that shown in Figure 6b but with anomalously high SLAs in the eastern equatorial Pacific. Figure 7c shows the seasonally evolving pattern of wind anomalies from summer to the following spring one year prior to the second SEOF mode. Similar to Figure 6c, Figure 7c exhibits a westerly wind anomaly in the western tropical Pacific and anomalously weak winds in the central equatorial Pacific. In the midlatitude North Pacific, the westerly winds also strengthen from the boreal autumn to winter. The main difference is that the negative wind speed anomalies associated with the SEOF2 are focused not only on the central equatorial Pacific, but extend east during JJA(−1) and SON(−1). Furthermore, the cyclone vanishes during the decaying phase of EP El Niño in MAM(0) in Figure 7c, but is maintained during the decaying phase of CP El Niño in MAM(0) in Figure 6c. Overall, both Figure 7b,c confirm the interpretation that the second SEOF mode of precipitation is associated with the years after EP El Niño events.
Figure 8a shows the seasonally evolving SST anomalies simultaneously associated with the second SEOF mode of precipitation, i.e., from JJA in Year (0) to MAM in Year(1). In general, the SSTs recover to the normal conditions. North of New Guinea in the western Pacific, precipitation decreases and the easterly trade winds strengthens in JJA(0) after EP El Niño, but the SST does not decrease significantly during JJA(0). This finding indicates that precipitation and wind respond to ENSO more quickly than does SST and that decreasing precipitation is more closely related to strengthening wind than to SST cooling. However, over the central tropical Pacific, the positive precipitation anomalies in zonal bands along the equator are more strongly correlated with warmer SSTs. Overall, the seasonal evolution of precipitation in the tropics is positively correlated with SST after EP El Niño. Furthermore, the subtropical anticyclone that occupies the northwestern Pacific is associated with higher precipitation in this region during the summer after an EP El Niño event. The Northeasterly trade winds are strong within 0–20°N and 140–170°E in the boreal summer but decay in autumn and reach their minimum strength in the winter. In the South Pacific around 10–30°S, the Southeasterly trade winds are strong in both the boreal summer and winter. In the eastern equatorial Pacific, wind speeds are weak in the boreal spring and start to recover in the boreal winter. Altogether, these simultaneous, seasonally evolving patterns of ocean dynamic variables represent the ocean-surface conditions after El Niño events, and contribute to the evolution of precipitation patterns.

4. Discussion

4.1. Which Type of El Niño Dominates the Seasonal Evolution of Precipitation?

Our results have demonstrated that the first two SEOF modes of precipitation were associated with El Niño development and post-El Niño years, respectively. However, types of El Niño could not be separated confidently based only on the regressed spatial patterns of SST, SLA and SSW shown in Figure 6 and Figure 7. To identify which type of ENSO event most affects the dominant SEOF modes of precipitation, the lagged correlations between the first two SEOF modes with the El Niño Modoki index (EMI) and Niño3 index for each season were calculated, and the results are shown in Figure 9.
Figure 9a shows that the first SEOF mode has significant correlation with both the EMI and the Niño3 index for Year(0). The simultaneous correlation coefficients between the SEOF1 and EMI were 0.77, 0.90, 0.97 and 0.91 in JJA, SON, DJF and MAM, respectively, which are higher than those between the SEOF1 and Niño3 index (Table 2). Therefore, the first SEOF mode of precipitation is associated with the combination of EP El Niño and CP El Niño events, but more likely coincided with the CP El Niño. This inference is further supported by the SST pattern shown in Figure 6a with anomalously warm SSTs mainly in the central equatorial Pacific, and by the similarity between the spatial pattern of precipitation in the boreal winter for SEOF1 shown in Figure 4a and the correlation map of precipitation with the EMI shown in Figure 11a of Ashok et al. [26].
Both Figure 2a and Figure 4a reveal the striking ITCZ and SPCZ bands with positive precipitation anomalies that extend eastward and southeastward from the Solomon Islands, as well as the dry conditions over the Maritime Continent. Although different from Figure 2a, Figure 4a shows the seasonal evolution of precipitation associated with the development of El Niño. The responses of precipitation patterns to the development of El Niño from the boreal summer to winter include the following: the ITCZ becomes progressively wetter and moves southward toward the equator, the SPCZ also receives more precipitation and shifts northeastward, and the location of maximum precipitation along the equator moves east. The opposite patterns of variation in precipitation occur during La Niña, as described by Chung and Power [21]. Overall, precipitation in the western basin of the warm pool experiences dry conditions with the development of either EP or CP El Niño events, and both the SPCZ and IPCZ move toward the equator during El Niño years. During La Niña events, these trends are reversed.
For the SEOF2 of precipitation, the lagged correlation coefficients between the SEOF2 and Niño3 index were significant in Year(−1), whereas the correlation between the SEOF2 and EMI did not reach the 5% significance level. These findings strongly indicate that the second SEOF mode of precipitation was associated with the decaying year of EP-type ENSO events. Therefore, we may conclude that Figure 4a,b demonstrate the consecutive seasonal evolution pattern of precipitation anomalies over the entire development of EP El Niño events, as well as the subsequent recovery and return of normal conditions after EP El Niño.

4.2. Impact of PDO on the ENSO-Induced Precipitation Seasonal Evolution

As an interdecadal climate oscillation, the impact of PDO on the variation of precipitation is accompanied by ENSO. As was indicated by the lagged correlation shown in Figure 5, significant correlation between the PDO and precipitation SEOFs exists only when the MEI correlates significantly with the SEOFs. Moreover, these indices were in the same phase in influencing precipitation. Therefore, PDO may impact precipitation over the Pacific primarily by strengthening and prolonging the effects of ENSO. In addition, Figure 5a shows that PDO still correlated significantly with the precipitation SEOF1 mode in the El Niño decaying summer, which is consistent with the SST anomaly pattern of the PDO warm phase in JJA(0) shown in Figure 8a. This correlation indicates that the precipitation pattern in JJA(0) of Figure 4b is also influenced by PDO, i.e., precipitation is still dominated by SST anomalies in the North Pacific during the decaying summer of EP El Niño.

5. Conclusions

Compared with previous studies, we provide a more integrated perspective on the seasonal and interannual variability of precipitation over the Pacific Ocean as well as the seasonal evolution of precipitation associated with the ENSO during the period of 1998–2014. In addition, lagged correlation analysis is applied to derive the lead–lag correlations between the first two SEOF modes for precipitation and climate-related air–sea phenomena, i.e., ENSO and PDO, and further to reveal the large-scale oceanic patterns associated with the distributions of high and low precipitation over the Pacific Ocean. These findings may be useful for seasonal precipitation anomaly predictions for the Pacific Ocean during El Niño years and the following recovery years.
Using EOF analysis, we have examined the spatiotemporal variability of precipitation, at seasonal and interannual timescales separately, to provide an overview of precipitation variability. The combination of the first two seasonal EOF modes represents the consecutive annual cycle of precipitation variations of the Pacific Ocean. Specifically, a double ITCZ exists in boreal spring, with one north and the other south of the equator; during boreal summer, the northern zone moves northward to 10°N, and the southern one vanishes. The SPCZ is drier than average during the austral autumn and winter, but wetter during the austral spring and summer. In terms of the interannual variability of precipitation, the first EOF mode for 13-month running mean precipitation datasets represents the spatiotemporal variation associated with ENSO. During El Niño, global conditions are characterized by significantly positive wedge-shaped anomalies in the central Pacific along the equator toward the ITCZ and the northern part of the SPCZ, as well as negative anomalies over the South China Sea, the Maritime Continent, and the southern part of the SPCZ. The reverse patterns exist during La Niña.
Using SEOF and lagged correlation analyses, we have revealed two dominant seasonally evolving modes of precipitation anomalies and their relationships with ENSO and PDO. The principal component of the first SEOF mode reflects El Niño and La Niña events, with the positive (negative) values corresponding to El Niño (La Niña) years. The lagged correlation between the SEOF PCs and MEI indicates that the first SEOF mode is simultaneously associated with ENSO developing episodes, while SEOF2 lagged behind ENSO by one year and is associated with post-ENSO years. In addition, PDO modulates the precipitation variability significantly only when ENSO occurs. More specifically, PDO could impact the precipitation over the Pacific primarily by strengthening and prolonging the impact of ENSO on the precipitation during the ENSO decaying summer. By using lagged correlation analysis on the first two SEOF modes with the El Niño Modoki index and Nino3 index, respectively, we further distinguish different associations of two types of El Niño (i.e. EP El Niño and CP El Niño) with the two dominant SEOF modes. It is revealed that the first SEOF mode of precipitation is associated with both EP and CP El Niño years, but more likely coincides with the CP type, while the second SEOF mode is associated with the years after EP El Niño occurs.
In fact, the spatial seasonally evolving pattern of the first two SEOF modes (Figure 4) describes the consecutive seasonal evolution pattern of precipitation anomaly associated with the entire developing episodes of EP El Niño as well as the recovering to normal episodes afterwards. The significant variation pattern mainly exists on the tropical Pacific, especially ITCZ and SPCZ regions. Regressed anomalies of ocean dynamic variables (SST, SLA, and WIND) associated with the first two SEOF modes depict the synchronously spatial variation of ocean and climate dynamics. During the developing episodes of either EP or CP El Niño, the western basin of warm pool experiences dry conditions while both SPCZ and IPCZ become progressively wetter and move toward the equator. This precipitation pattern during the mature phase of El Niño is associated with warm SSTs in the central tropical Pacific and a subtropical anticyclone dominating conditions over the northwestern Pacific.
In this study, the asymmetric responses of precipitation to El Niño and La Niña SST anomalies are not distinguished. Therefore, the direction for future work is to investigate the spatiotemporal variations in precipitation during the warm and cold phase of ENSO as well as the underlying oceanic and atmospheric mechanisms.

Acknowledgments

This work was supported by the National Natural Science Foundation of China under Grants No. 91437214 and No. 71461010701.

Author Contributions

Xueyan Hou carried out the research and prepared the manuscript under the guidance of Di Long and Yang Hong. Hongjie Xie contributed to the preparation of the paper through review, editing, and comments. All authors made substantial intellectual contributions to the paper and the findings reported herein.

Conflicts of Interest

The authors declare no conflict of interest.

References

  1. Curtis, S.; Adler, R. ENSO Indices Based on Patterns of Satellite-Derived Precipitation. J. Clim. 2000, 13, 2786–2793. [Google Scholar] [CrossRef]
  2. Kodama, Y.; Tamaoki, A. A Re-examination of precipitation activity in the subtropics and the mid-latitudes based on satellite-derived data. J. Meteorol. Soc. Jpn. Ser. II 2002, 80, 1261–1278. [Google Scholar] [CrossRef]
  3. Huang, P.; Xie, S. Mechanisms of change in enso-induced tropical pacific rainfall variability in a warming climate. Nat. Geosci. 2015, 8, 922–926. [Google Scholar] [CrossRef]
  4. Curtis, S. The El Niño–southern oscillation and global precipitation. Geogr. Compass 2008, 2, 600–619. [Google Scholar] [CrossRef]
  5. Trenberth, K.E.; Hoar, T.J. El Niño and climate change. Geophys. Res. Lett. 1997, 24, 3057–3060. [Google Scholar] [CrossRef]
  6. Ropelewski, C.F.; Halpert, M.S. Precipitation patterns associated with the high index phase of the southern oscillation. J. Clim. 1989, 2, 268–284. [Google Scholar] [CrossRef]
  7. Ropelewski, C.F.; Halpert, M.S. Global and regional scale precipitation patterns associated with the El Niño/southern oscillation. Mon. Weather Rev. 1987, 115, 1606–1626. [Google Scholar] [CrossRef]
  8. Adler, R.F.; Huffman, G.J.; Chang, A.; Ferraro, R.; Xie, P.; Janowiak, J.; Rudolf, B.; Schneider, U.; Curtis, S.; Bolvin, D.; et al. The Version-2 Global Precipitation Climatology Project (GPCP) monthly precipitation analysis (1979–present). J. Hydrometeorol. 2003, 4, 1147–1167. [Google Scholar] [CrossRef]
  9. Xie, P.; Arkin, P.A. Global Precipitation: A 17-Year monthly analysis based on gauge observations, satellite estimates, and numerical model outputs. Bull. Am. Meteorol. Soc. 1997, 78, 2539–2558. [Google Scholar] [CrossRef]
  10. Huffman, G.J.; Bolvin, D.T.; Nelkin, E.J.; Wolff, D.B.; Adler, R.F.; Gu, G.; Hong, Y.; Bowman, K.P.; Stocker, E.F. The TRMM Multisatellite Precipitation Analysis (TMPA): Quasi-global, multiyear, combined-sensor precipitation estimates at fine scales. J. Hydrometeorol. 2007, 8, 38–55. [Google Scholar] [CrossRef]
  11. Dai, A.; Wigley, T.M.L. Global patterns of ENSO-induced precipitation. Geophys. Res. Lett. 2000, 27, 1283–1286. [Google Scholar] [CrossRef]
  12. Chou, C.; Tu, J.; Yu, J. Interannual variability of the western north pacific summer monsoon: Differences between ENSO and Non-ENSO Years. J. Clim. 2003, 16, 2275–2287. [Google Scholar] [CrossRef]
  13. Curtis, S.; Adler, R.F. Evolution of El Niño-precipitation relationships from satellites and gauges. J. Geophys. Res. Atmos. 2003, 108. [Google Scholar] [CrossRef]
  14. Haddad, Z.S.; Meagher, J.P.; Adler, R.F.; Smith, E.A.; Im, E.; Durden, S.L. Global variability of precipitation according to the Tropical Rainfall Measuring Mission. J. Geophys. Res. Atmos. 2004, 109, D17. [Google Scholar] [CrossRef]
  15. Chou, C.; Huang, L.; Tu, J.; Tseng, L.; Hsueh, Y. El Niño impacts on precipitation in the Western North Pacific–East Asian Sector. J. Clim. 2009, 22, 2039–2057. [Google Scholar] [CrossRef]
  16. Wu, Z.; Wang, B.; Li, J.; Jin, F. An empirical seasonal prediction model of the east asian summer monsoon using ENSO and NAO. J. Geophys. Res. Atmos. 2009, 114. [Google Scholar] [CrossRef]
  17. Curtis, S.; Salahuddin, A.; Adler, R.F.; Huffman, G.J.; Gu, G.; Hong, Y. precipitation extremes estimated by GPCP and TRMM: ENSO relationships. J. Hydrometeorol. 2007, 8, 678–689. [Google Scholar] [CrossRef]
  18. Dayem, K.E.; Noone, D.C.; Molnar, P. Tropical Western Pacific warm pool and maritime continent precipitation rates and their contrasting relationships with the walker circulation. J. Geophys. Res. Atmos. 2007, 112, D06101. [Google Scholar] [CrossRef]
  19. Yang, S.; Smith, E.A. Convective–stratiform precipitation variability at seasonal scale from 8 years of TRMM observations: Implications for multiple modes of diurnal variability. J. Clim. 2008, 21, 4087–4114. [Google Scholar] [CrossRef]
  20. Dorman, C.E.; Bourke, R.H. Precipitation over the Pacific Ocean, 30°S to 60°N. Mon. Weather Rev. 1979, 107, 896–910. [Google Scholar] [CrossRef]
  21. Chung, C.Y.; Power, S. Precipitation response to La Niña and global warming in the Indo-Pacific. Clim. Dyn. 2014, 43, 3293–3307. [Google Scholar] [CrossRef]
  22. Trenberth, K.E.; Caron, J.M. the southern oscillation revisited: Sea level pressures, surface temperatures, and precipitation. J. Clim. 2000, 13, 4358–4365. [Google Scholar] [CrossRef]
  23. Adler, R.F.; Gu, G.; Wang, J.; Huffman, G.J.; Curtis, S.; Bolvin, D. Relationships between global precipitation and surface temperature on interannual and longer timescales (1979–2006). J. Geophys. Res. Atmos. 2008, 113, D22. [Google Scholar] [CrossRef]
  24. Liu, C.; Allan, R.P. Multisatellite observed responses of precipitation and its extremes to interannual climate variability. J. Geophys. Res. Atmos. 2012, 117. [Google Scholar] [CrossRef]
  25. Back, L.E.; Bretherton, C.S. The relationship between wind speed and precipitation in the Pacific ITCZ. J. Clim. 2005, 18, 4317–4328. [Google Scholar] [CrossRef]
  26. Ashok, K.; Behera, S.K.; Rao, S.A.; Weng, H.; Yamagata, T. El Niño modoki and its possible teleconnection. J. Geophys. Res. Oceans 2007, 112. [Google Scholar] [CrossRef]
  27. Yeh, S.; Kug, J.; Dewitte, B.; Kwon, M.; Kirtman, B.P.; Jin, F. El Niño in a changing climate. Nature 2009, 461, 511–514. [Google Scholar] [CrossRef] [PubMed]
  28. Kug, J.; Jin, F.; An, S. Two types of El Niño events: Cold tongue El Niño and warm pool El Niño. J. Clim. 2009, 22, 1499–1515. [Google Scholar] [CrossRef]
  29. Gu, G.; Adler, R.F.; Huffman, G.J.; Curtis, S. Tropical rainfall variability on interannual-to-interdecadal and longer time scales derived from the gpcp monthly product. J. Clim. 2007, 20, 4033–4046. [Google Scholar] [CrossRef]
  30. Huang, P.; Xie, S.; Hu, K.; Huang, G.; Huang, R. Patterns of the seasonal response of tropical rainfall to global warming. Nat. Geosci. 2013, 6, 357–361. [Google Scholar] [CrossRef]
  31. Lau, K.; Wu, H.T. Principal modes of rainfall–sst variability of the Asian summer monsoon: A reassessment of the monsoon–enso relationship. J. Clim. 2001, 14, 2880–2895. [Google Scholar] [CrossRef]
  32. Reynolds, R.W.; Rayner, N.A.; Smith, T.M.; Stokes, D.C.; Wang, W. An improved in situ and satellite SST analysis for climate. J. Clim. 2002, 15, 1609–1625. [Google Scholar] [CrossRef]
  33. AVISO. Available online: http://www.aviso.altimetry.fr/en/data/products/sea-surface-height-products/global/msla-mean-climatology.html#c10358 (accessed on 1 October 2016).
  34. Atlas, R.; Hoffman, R.N.; Ardizzone, J.; Leidner, S.M.; Jusem, J.C.; Smith, D.K.; Gombos, D. A Cross-calibrated, multiplatform ocean surface wind velocity product for meteorological and oceanographic applications. Bull. Am. Meteorol. Soc. 2011, 92, 157–174. [Google Scholar] [CrossRef]
  35. Multivariate ENSO Index (MEI). Available online: http://www.esrl.noaa.gov/psd/enso/mei/ (accessed on 1 October 2016).
  36. The Pacific Decadal Oscillation (PDO). Available online: http://research.jisao.washington.edu/pdo (accessed on 1 October 2016).
  37. MODOKI ENSO: A New Phenomenon is Found in the Tropical Pacific. Available online: http://www.jamstec.go.jp/frsgc/research/d1/iod/modoki_home.html.en (accessed on 1 October 2016).
  38. Climate Indices: Monthly Atmospheric and Ocean Time Series. Available online: http://www.esrl.noaa.gov/psd/data/climateindices/list/ (accessed on 1 October 2016).
  39. Venegas, S.A.; Mysak, L.A.; Straub, D.N. Atmosphere–ocean coupled variability in the South Atlantic. J. Clim. 1997, 10, 2904–2920. [Google Scholar] [CrossRef]
  40. Wang, B.; An, S. A method for detecting season-dependent modes of climate variability: S-EOF analysis. Geophys. Res. Lett. 2005, 32, L15710. [Google Scholar] [CrossRef]
  41. Messié, M.; Chavez, F.P. Physical-biological synchrony in the global ocean associated with recent variability in the central and Western Equatorial Pacific. J. Geophys. Res. Oceans 2013, 118, 3782–3794. [Google Scholar] [CrossRef]
  42. Spencer, H. Role of the atmosphere in seasonal phase locking of El Niño. Geophys. Res. Lett. 2004, 31. [Google Scholar] [CrossRef]
  43. Yasunari, T. The monsoon year—A new concept of the climatic year in the tropics. Bull. Am. Meteorol. Soc. 1991, 72, 1331–1338. [Google Scholar] [CrossRef]
  44. North, G.R.; Bell, T.L.; Cahalan, R.F.; Moeng, F.J. Sampling errors in the estimation of empirical orthogonal functions. Mon. Weather Rev. 1982, 110, 699–706. [Google Scholar] [CrossRef]
  45. Messié, M.; Chavez, F.P. A global analysis of ENSO synchrony: The Oceans’ biological response to physical forcing. J. Geophys. Res. 2012, 117. [Google Scholar] [CrossRef]
  46. Lee, T.; McPhaden, M.J. Increasing intensity of El Niño in the Central-Equatorial Pacific. Geophys. Res. Lett. 2010, 37. [Google Scholar] [CrossRef]
  47. Singh, A.; Delcroix, T.; Cravatte, S. Contrasting the flavors of El Niño-Southern oscillation using sea surface salinity observations. J. Geophys. Res. Oceans 2011, 116. [Google Scholar] [CrossRef]
  48. Neelin, J.D.; Jin, F.; Syu, H. Variations in ENSO phase locking. J. Clim. 2000, 13, 2570–2590. [Google Scholar] [CrossRef]
  49. Mantua, N.J.; Hare, S.R.; Zhang, Y.; Wallace, J.M.; Francis, R.C. A pacific interdecadal climate oscillation with impacts on salmon production. Bull. Am. Meteorol. Soc. 1997, 78, 1069–1079. [Google Scholar] [CrossRef]
  50. Minobe, S. Resonance in bidecadal and pentadecadal climate oscillations over the North Pacific: Role in climatic regime shifts. Geophys. Res. Lett. 1999, 26, 855–858. [Google Scholar] [CrossRef]
  51. Delcroix, T. Observed surface oceanic and atmospheric variability in the tropical Pacific at seasonal and ENSO timescales: A tentative overview. J. Geophys. Res. 1998, 103, 18611–18633. [Google Scholar] [CrossRef]
  52. Hou, X.; Dong, Q.; Xue, C.; Wu, S. Seasonal and interannual variability of chlorophyll-a and associated physical synchronous variability in the western tropical Pacific. J. Mar. Syst. 2016, 158, 59–71. [Google Scholar] [CrossRef]
  53. Chang, Y.; Du, L.; Zhang, S.; Huang, P. Sea level variations in the tropical Pacific ocean during two types of recent El Niño events. Glob. Planet. Chang. 2013, 108, 119–127. [Google Scholar] [CrossRef]
  54. Pan, J.Y.; Yan, X.H.; Zheng, Q.; Liu, W.T. Vector empirical orthogonal function modes of the ocean surface wind variability derived from satellite scatterometer data. Geophys. Res. Lett. 2001, 28, 3951–3954. [Google Scholar] [CrossRef]
  55. Pan, J.Y.; Yan, X.H.; Zheng, Q.N.; Liu, W.T.; Klemas, V.V. Interpretation of scatterometer ocean surface wind vector EOFs over the Northwestern Pacific. Remote Sens. Environ. 2002, 84, 53–68. [Google Scholar] [CrossRef]
Figure 1. Seasonal variability of precipitation in the Pacific Ocean characterized by the first two empirical orthogonal function (EOF) modes: (a,b) are the spatial patterns of EOF modes (Unit: mm/h); (c,d) are the time series of normalized principal components (PC).
Remotesensing 08 00833 g001
Figure 2. The EOF mode of interannual variability of precipitation in the Pacific Ocean. (a) Spatial distribution (Unit: mm/h); (b) green line represents the normalized principal component (PC) of the first EOF mode; red line represents the Multivariate ENSO index (MEI).
Remotesensing 08 00833 g002
Figure 3. (a) Normalized PCs of the first season-reliant empirical orthogonal function (SEOF) mode for precipitation in the Pacific Ocean from summer 1998 to spring 2014; (b) as in (a), but for the second mode.
Remotesensing 08 00833 g003
Figure 4. (a) Spatial patterns of the first SEOF mode (SEOF1) of seasonal precipitation anomalies from June–July–August of year 0 (JJA(0)) to March–April–May of the following year (MAM(1)); (b) as in (a), but for the second mode (SEOF2). Units: mm/h.
Remotesensing 08 00833 g004
Figure 5. (a) Lead–lag correlations between the first SEOF PC and the MEI (red line) and PDO index (blue line); (b) As in (a), but for the second mode. The dashed lines indicate at the 5% significance level of the Student’s t-test. Year(−1) (Year(1)) denotes that the PC lags behind (leads) its counterpart by one year; Year(0) denotes simultaneous correlation. JJA is boreal summer, SON is boreal autumn, DJF is boreal winter, and MAM is boreal spring.
Remotesensing 08 00833 g005
Figure 6. Seasonally evolving patterns of (a) SST; (b) sea level; and (c) SSW anomalies from JJA(0) to MAM(1) regressed with the PC of the first SEOF mode of precipitation.
Remotesensing 08 00833 g006
Figure 7. Seasonally evolving patterns of (a) SST; (b) sea level; and (c) SSW anomalies from one year prior to precipitation, i.e., JJA(−1) to MAM(0), regressed with the PC of the second SEOF mode of precipitation.
Remotesensing 08 00833 g007
Figure 8. Seasonally evolving patterns of (a) SST; (b) sea level; and (c) SSW anomalies from JJA(0) to MAM(1) regressed with the PC of the second SEOF mode of precipitation.
Remotesensing 08 00833 g008
Figure 9. (a) Lagged correlations of the first SEOF PC with the EMI (red line) and Niño3 index (blue line); (b) lagged correlations between the second SEOF PC and the EMI (red line) and Niño3 index (blue line). Year(−1) (Year(1)) denotes that the PC lags behind (leads) its counterpart by one year; Year(0) denotes simultaneous correlation. JJA is boreal summer, SON is boreal autumn, DJF is boreal winter, and MAM is boreal spring.
Remotesensing 08 00833 g009
Table 1. The sources, timespans, and spatial and temporal resolutions of the datasets.
VariableData SourceTimespanResolution
PrecipitationTRMM_3B43 V7January 1998–present0.25°, monthly
SSTOI SST V2December 1981–present1°, monthly
SLAAVISODecember 1992–present0.25°, monthly
WindCCMP V1.1July 1987–December 20110.25°, monthly
Table 2. Significant lagged correlation coefficients of the PCs of the SEOF modes and the El Niño Modoki Index (EMI) and Niño3 index.
CorrelationsSeasonEMINiño3 Index
corr(SEOF1, EMI, & Niño3)SEOF1-JJA0.770.69
SEOF1-SON0.900.86
SEOF1-DJF0.970.88
SEOF1-MAM0.910.52
corr(SEOF2, EMI, & Niño3)SEOF2-JJA*0.57
SEOF2-SON*0.59
SEOF2-DJF*0.57
SEOF2-MAM*0.57
* Correlation that did not reach the 5% significance level.

