
Representation of Block-Based Image Features in a Multi-Scale Framework for Built-Up Area Detection


Abstract
:
1. Introduction
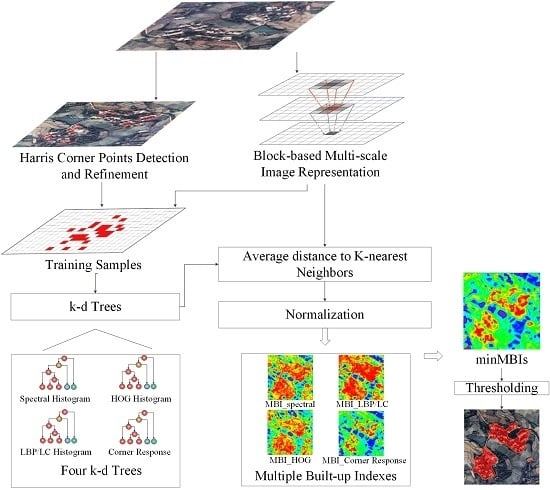
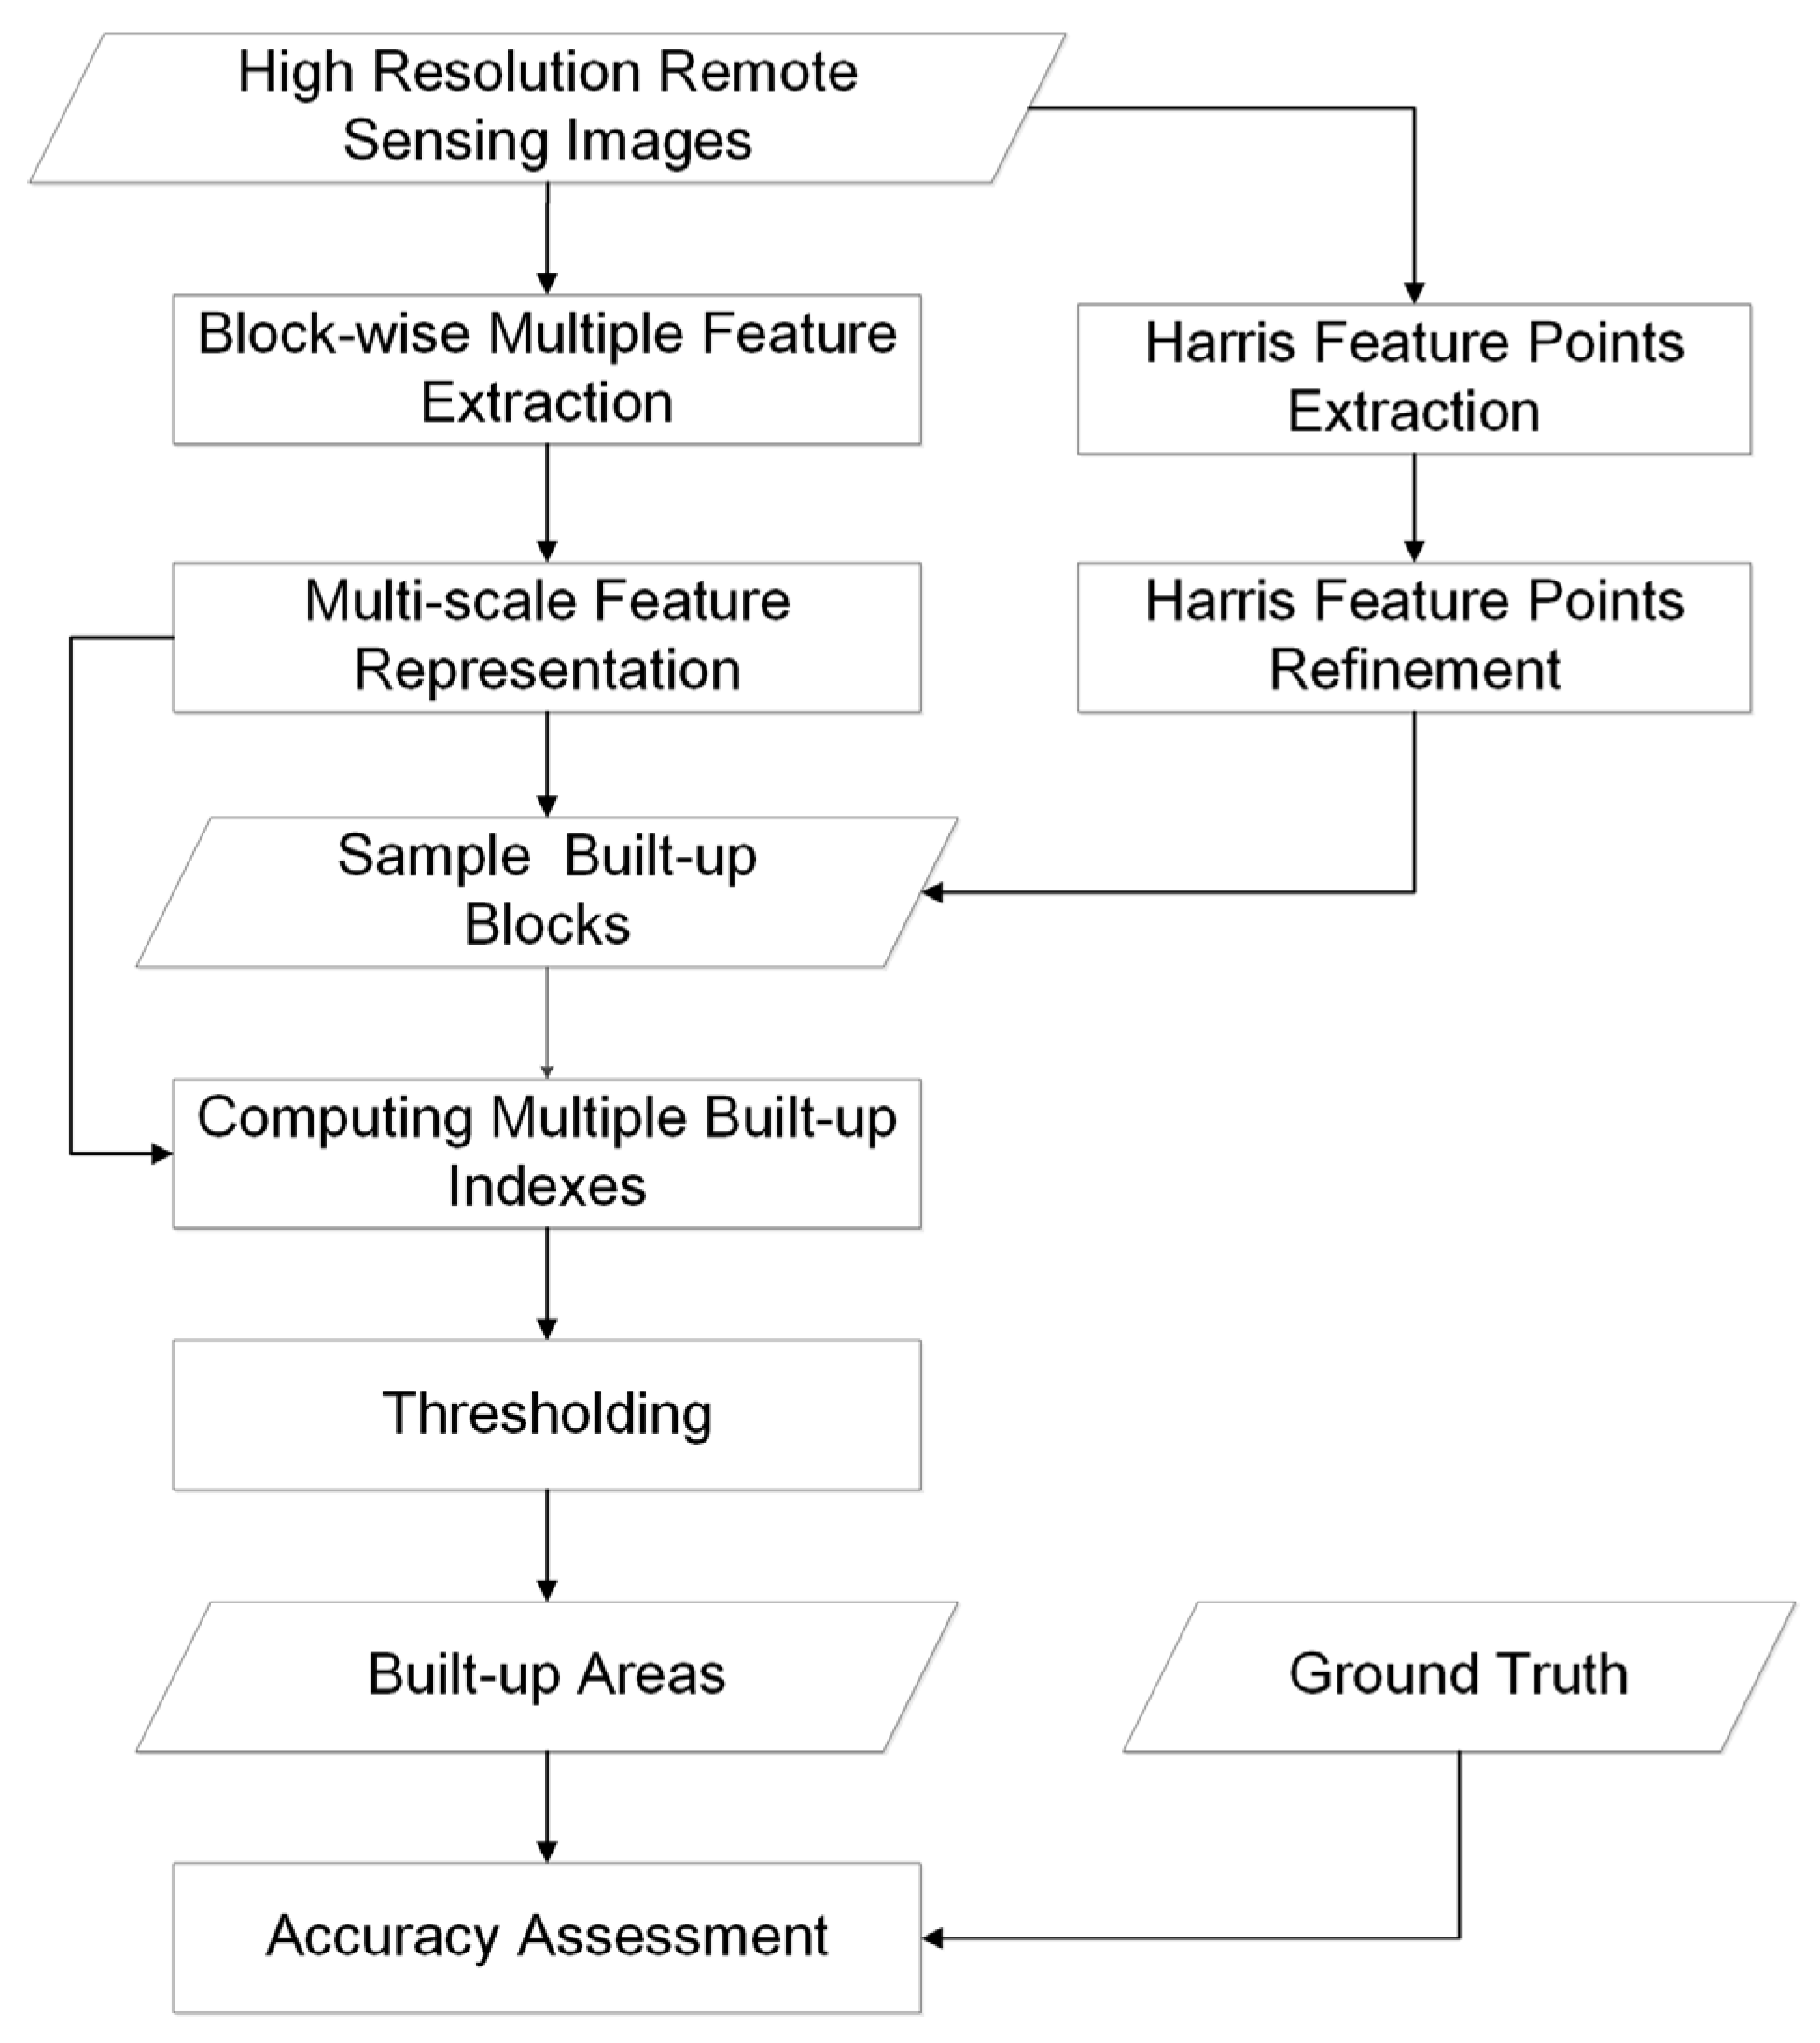
2. Proposed Method
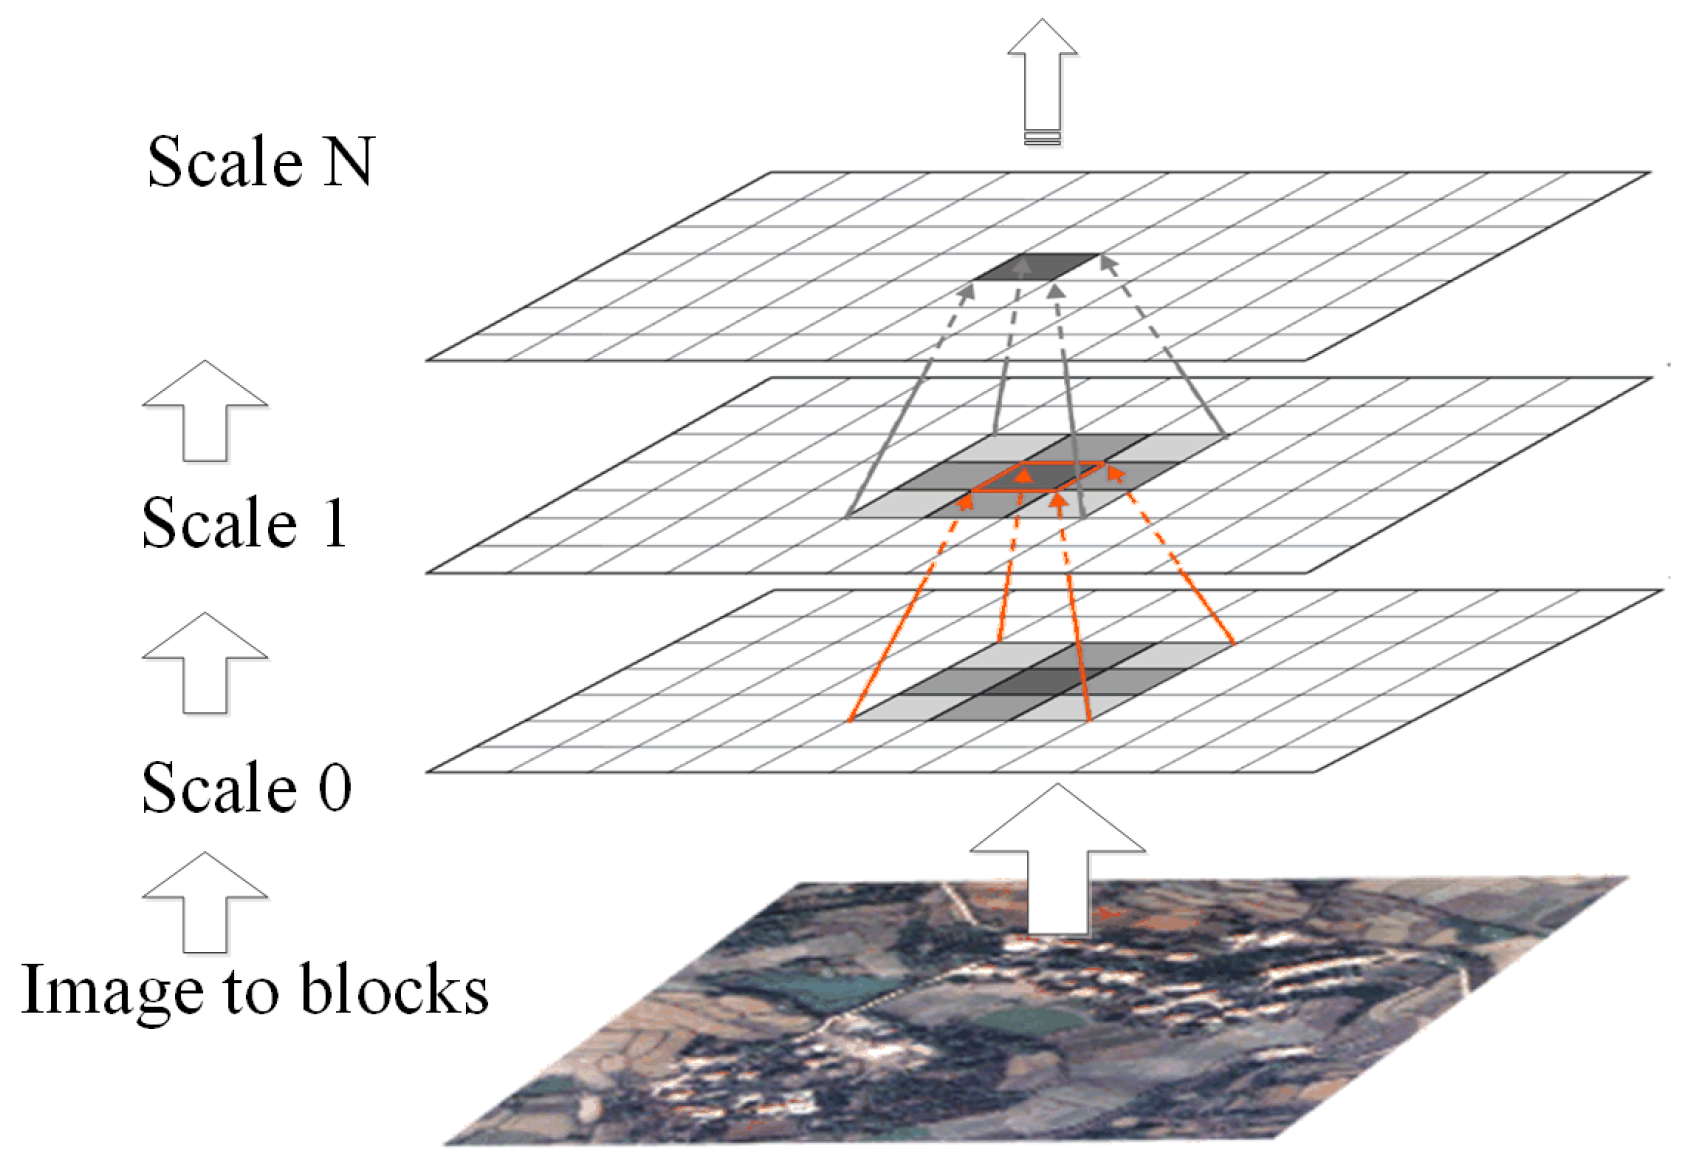
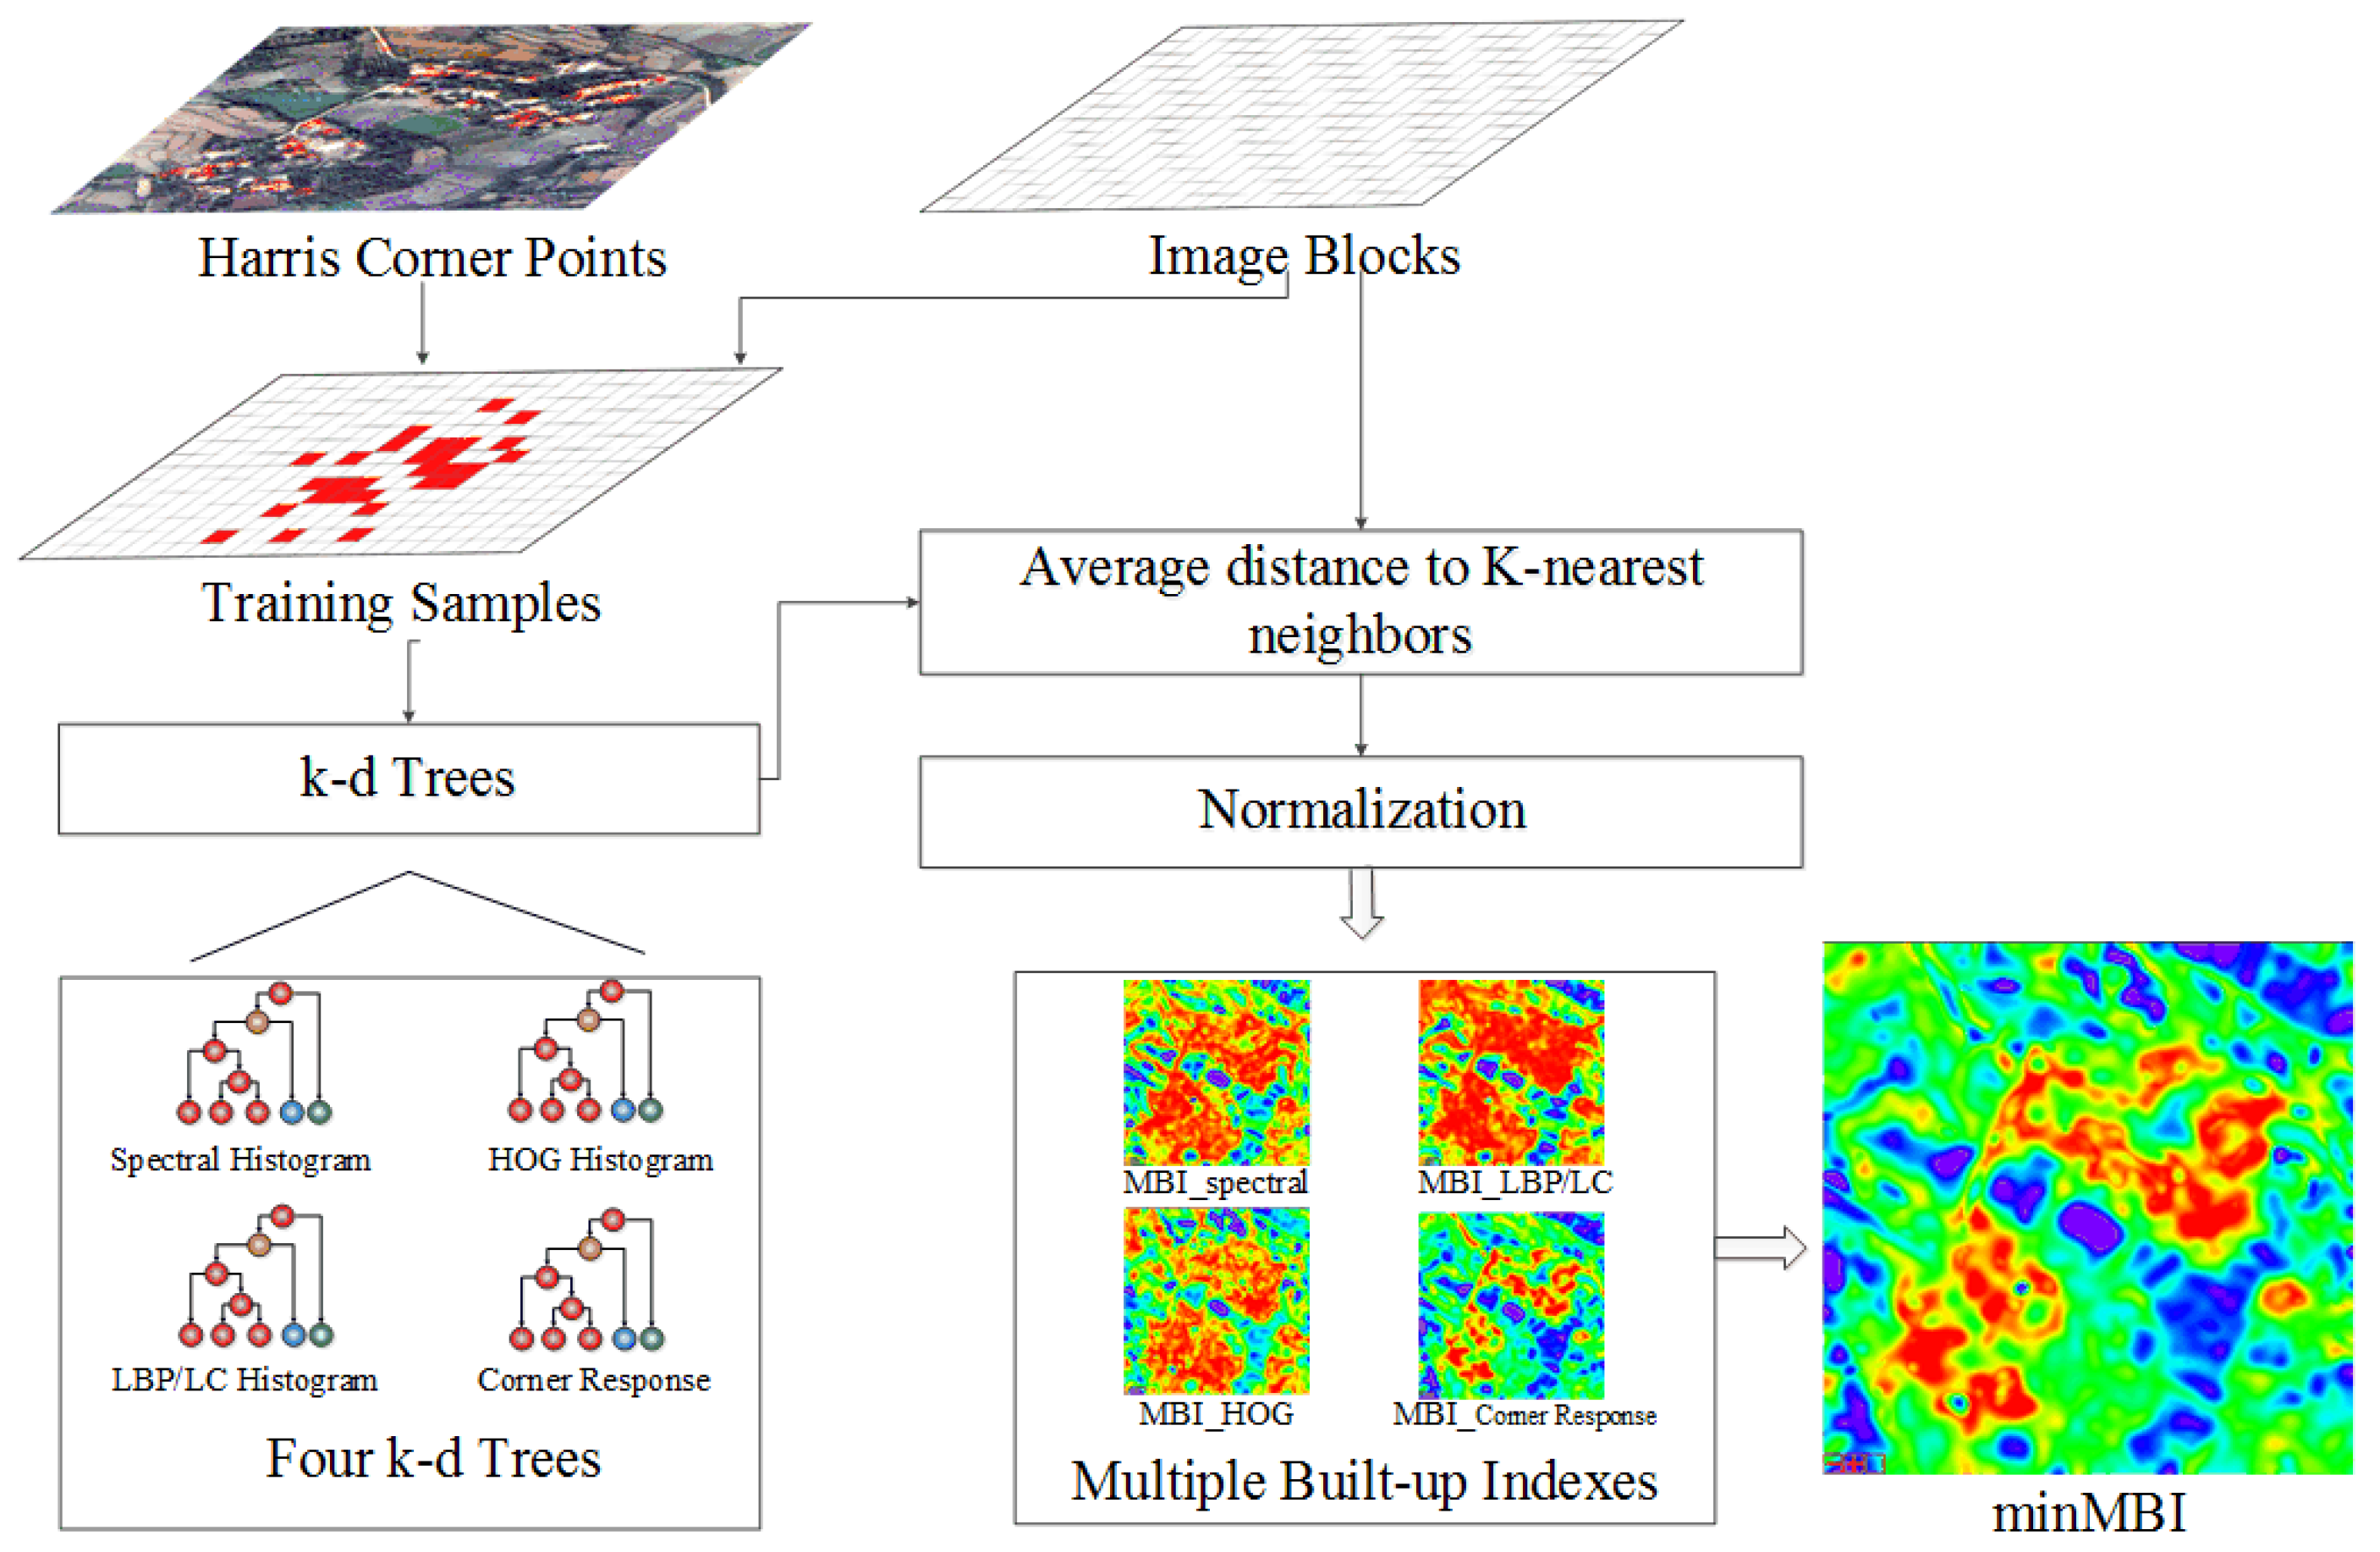
2.1. Feature Extraction and Multi-Scale Representation
2.1.1. Block-Based Feature Extraction
- •
- Spectral Histogram: Built-up areas cannot be accurately modeled using only spectral means due to their complex mixtures of buildings, trees, grass, and shadows, and thus the color histogram is used. The color histogram records the distribution of the spectral signatures and is one of the most commonly used descriptors. The number of bins depends on the quantization of the color space. In our work, the color space is quantized into 32 bins, and thus the histogram has 32 bins for each image channel.
- •
- RILBP/LC Histogram: The textural features of a block can be modeled from two aspects: texture pattern and intensity. In this paper, the texture pattern and intensity are modeled using rotation-invariant local binary patterns (RILBP) and local contrast (LC) [36], respectively. RILBP/LC describes the textural features using the joint distribution histogram of the RILBP and LC. There are 10 patterns for the RILBP, and we quantize the LC to eight bins. Thus, a joint distribution histogram of 10 × 8 bins is employed to describe the textural features.
- •
- HOG Histogram: The structural features of built-up areas are one of their essential differences from other areas. In this paper, the histogram of oriented gradients (HOG) [37] is used to describe the structural features of the blocks. The HOG measures the structural features using the statistics of local orientation and intensity obtained from the image gradient. It is recorded using an orientation histogram, which is weighted by the intensity. Differing from the approach presented in [37], the HOG descriptor is obtained by computing the orientation histogram in a single block. The number of orientations is quantified to 12 bins, and thus the feature vector has 12 bins for each block.
- •
- Corner Response: The value of the corner function describes the response of an image structure to a corner, which is a specific structure of man-made objects. There are many corners in built-up areas, such as the corners of buildings and road intersections. Thus, the response to the corner function should be high over these buildings and intersections. In this paper, the Harris corner function [26] is employed, and its response is anisotropic. The responses are computed pixel by pixel, and then the maximum in each block is used to describe the block.
2.1.2. Multi-Scale Feature Representation
2.2. Multiple Built-Up Indexes (MBIs)
2.2.1. Automatic Corner Point Detection
2.2.2. Calculation of the Multiple Built-Up Indexes
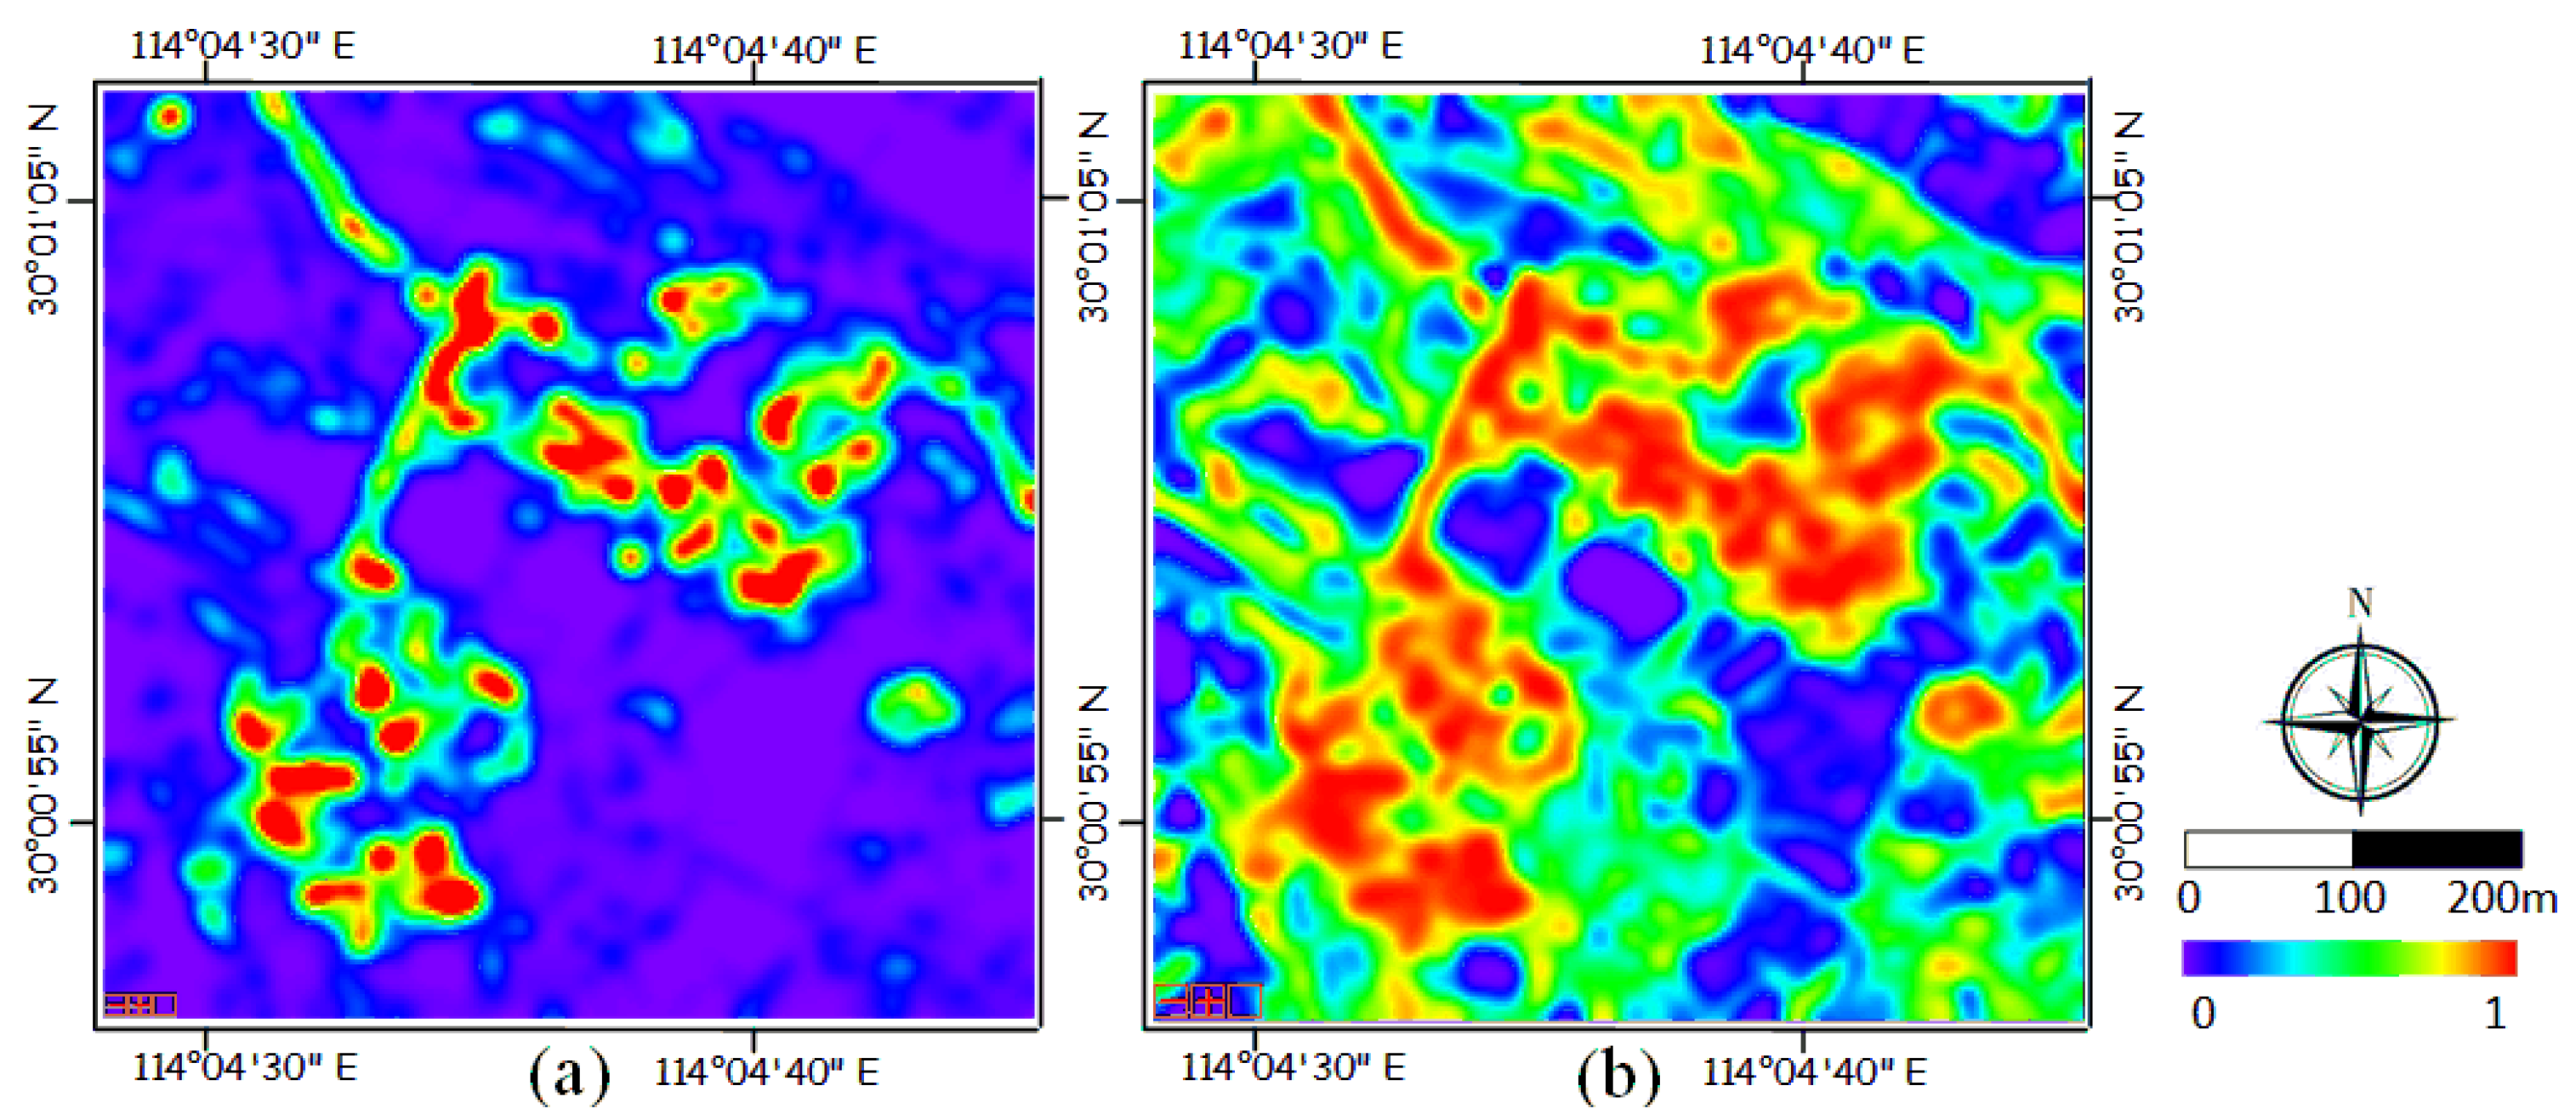
2.2.3. The Minimum of the MBIs
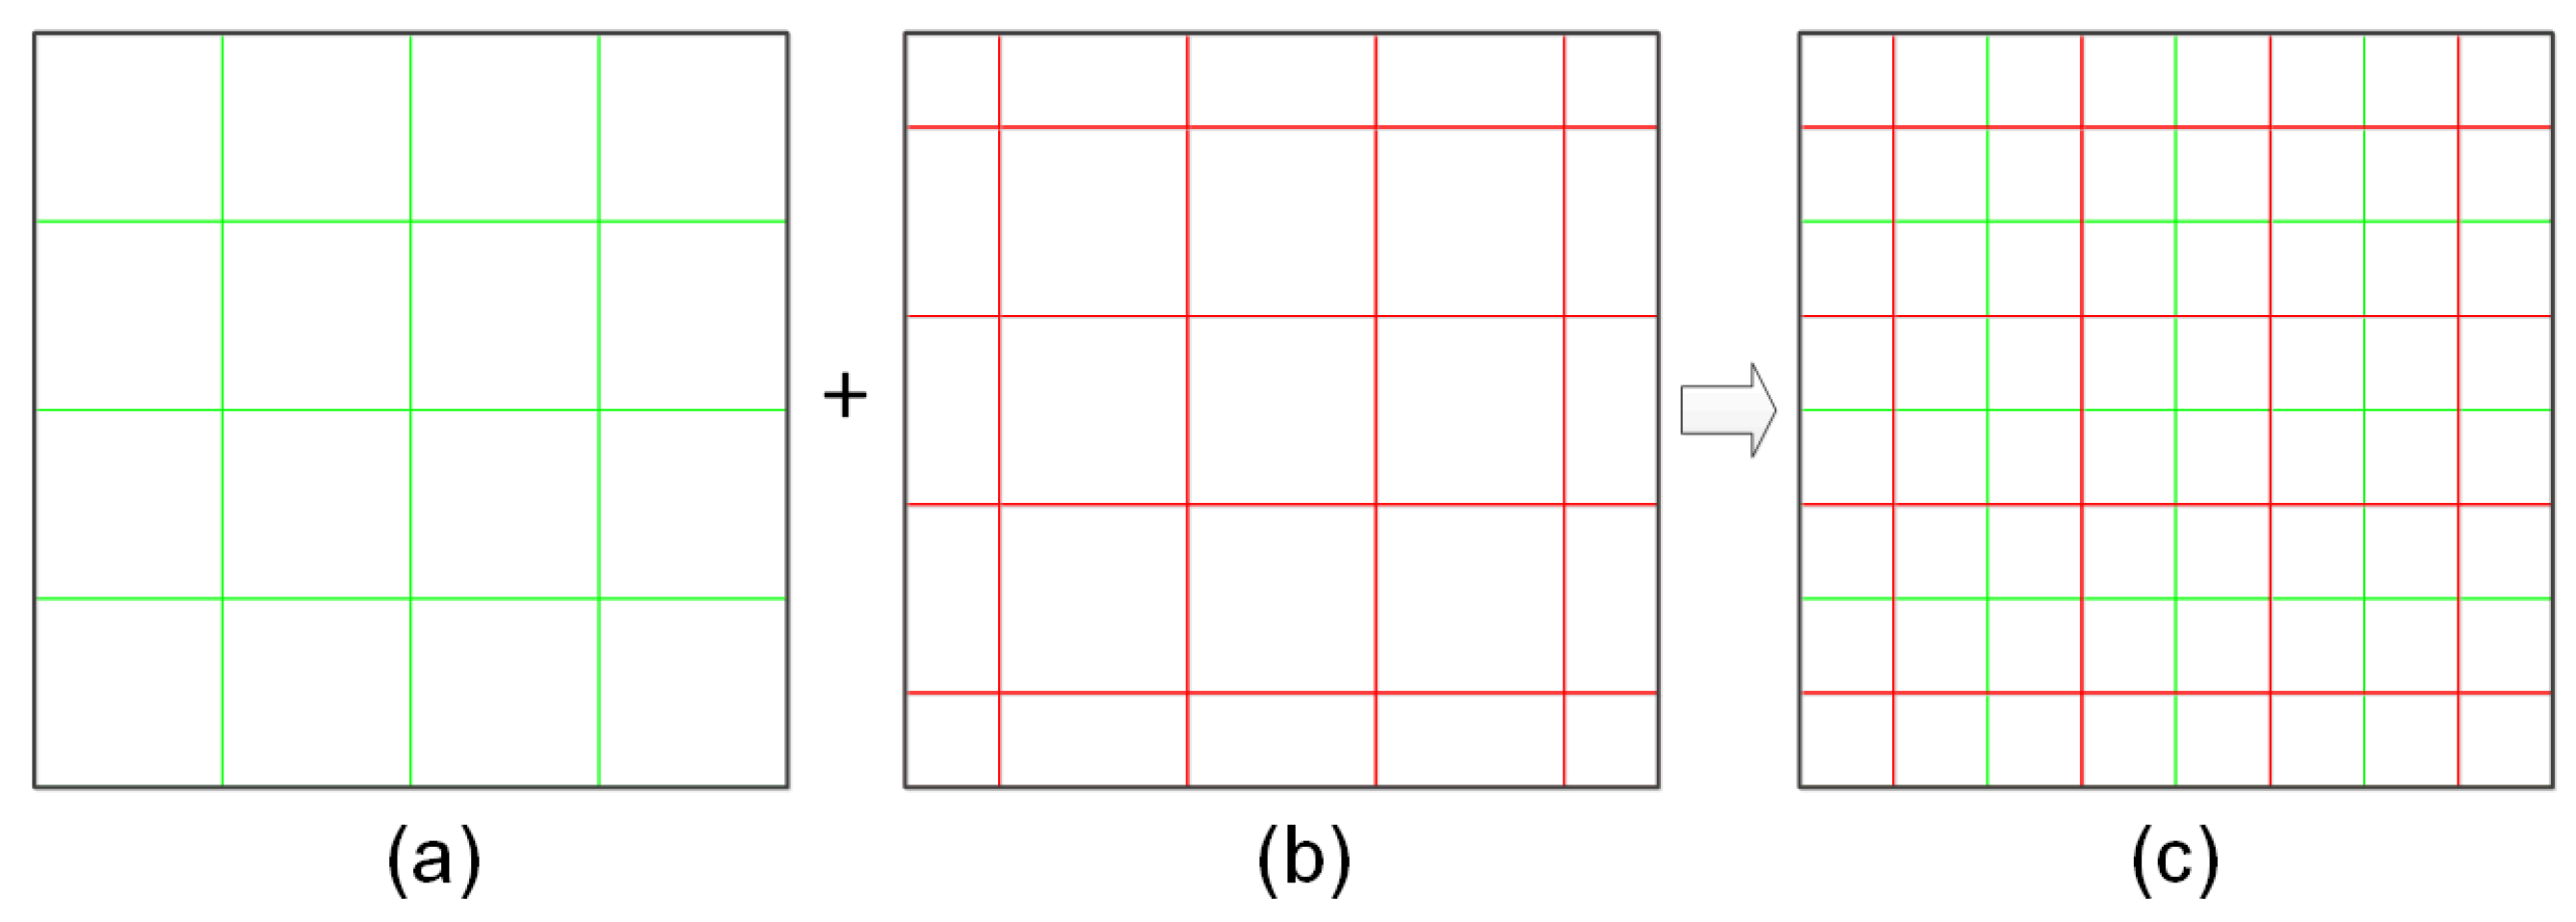
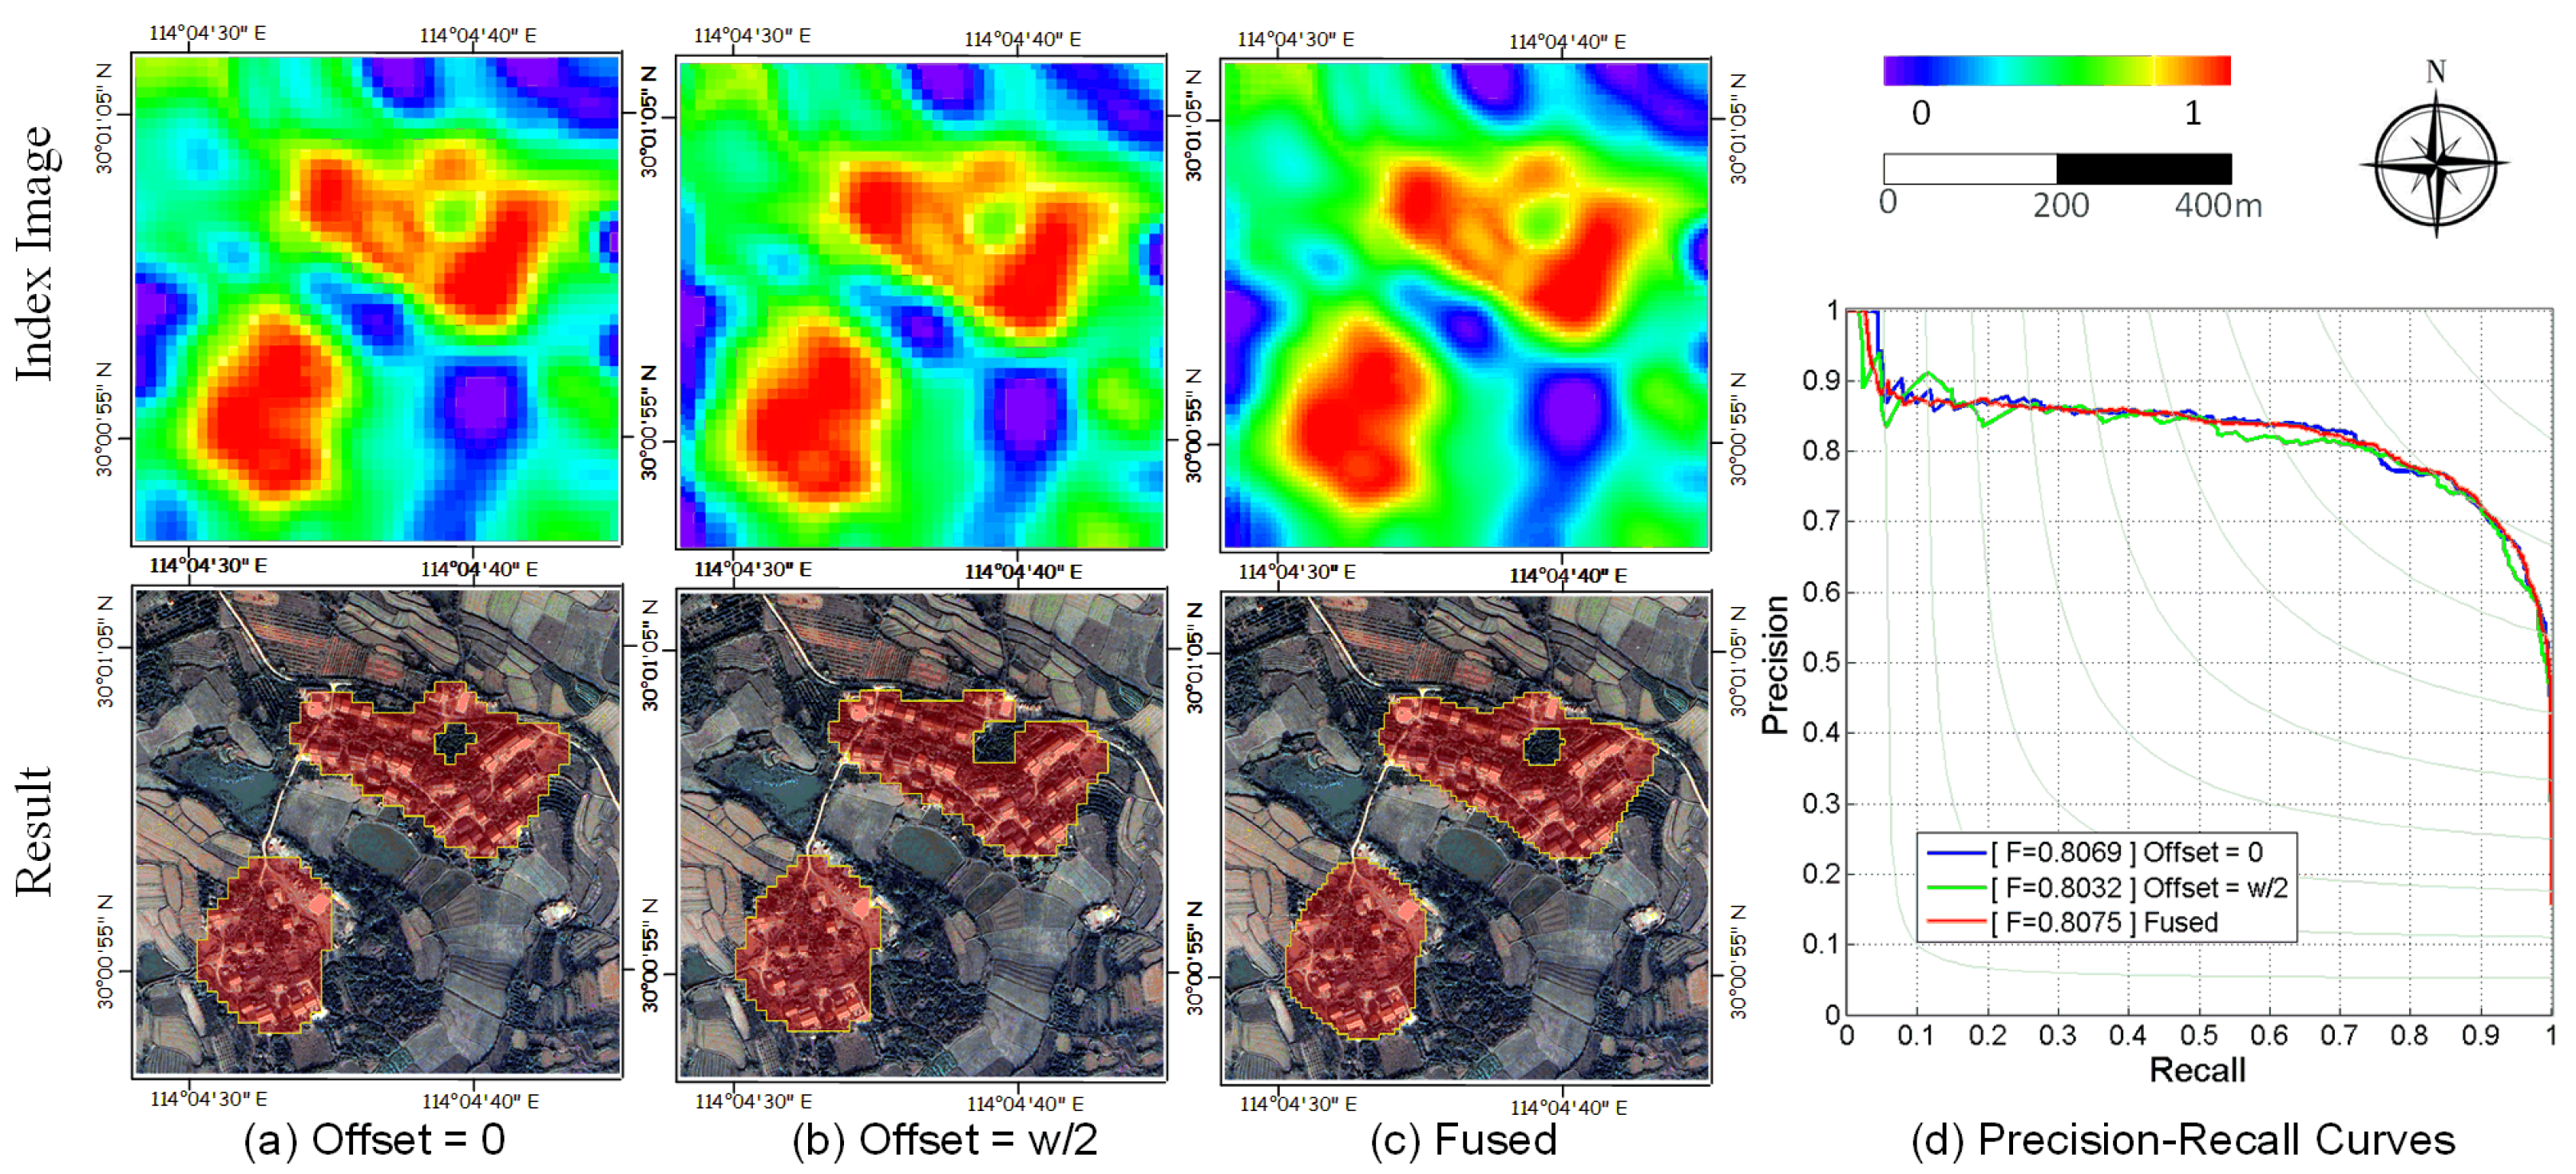
2.3. Block Offset and Data Fusion
2.4. Parameter Settings
3. Experiments
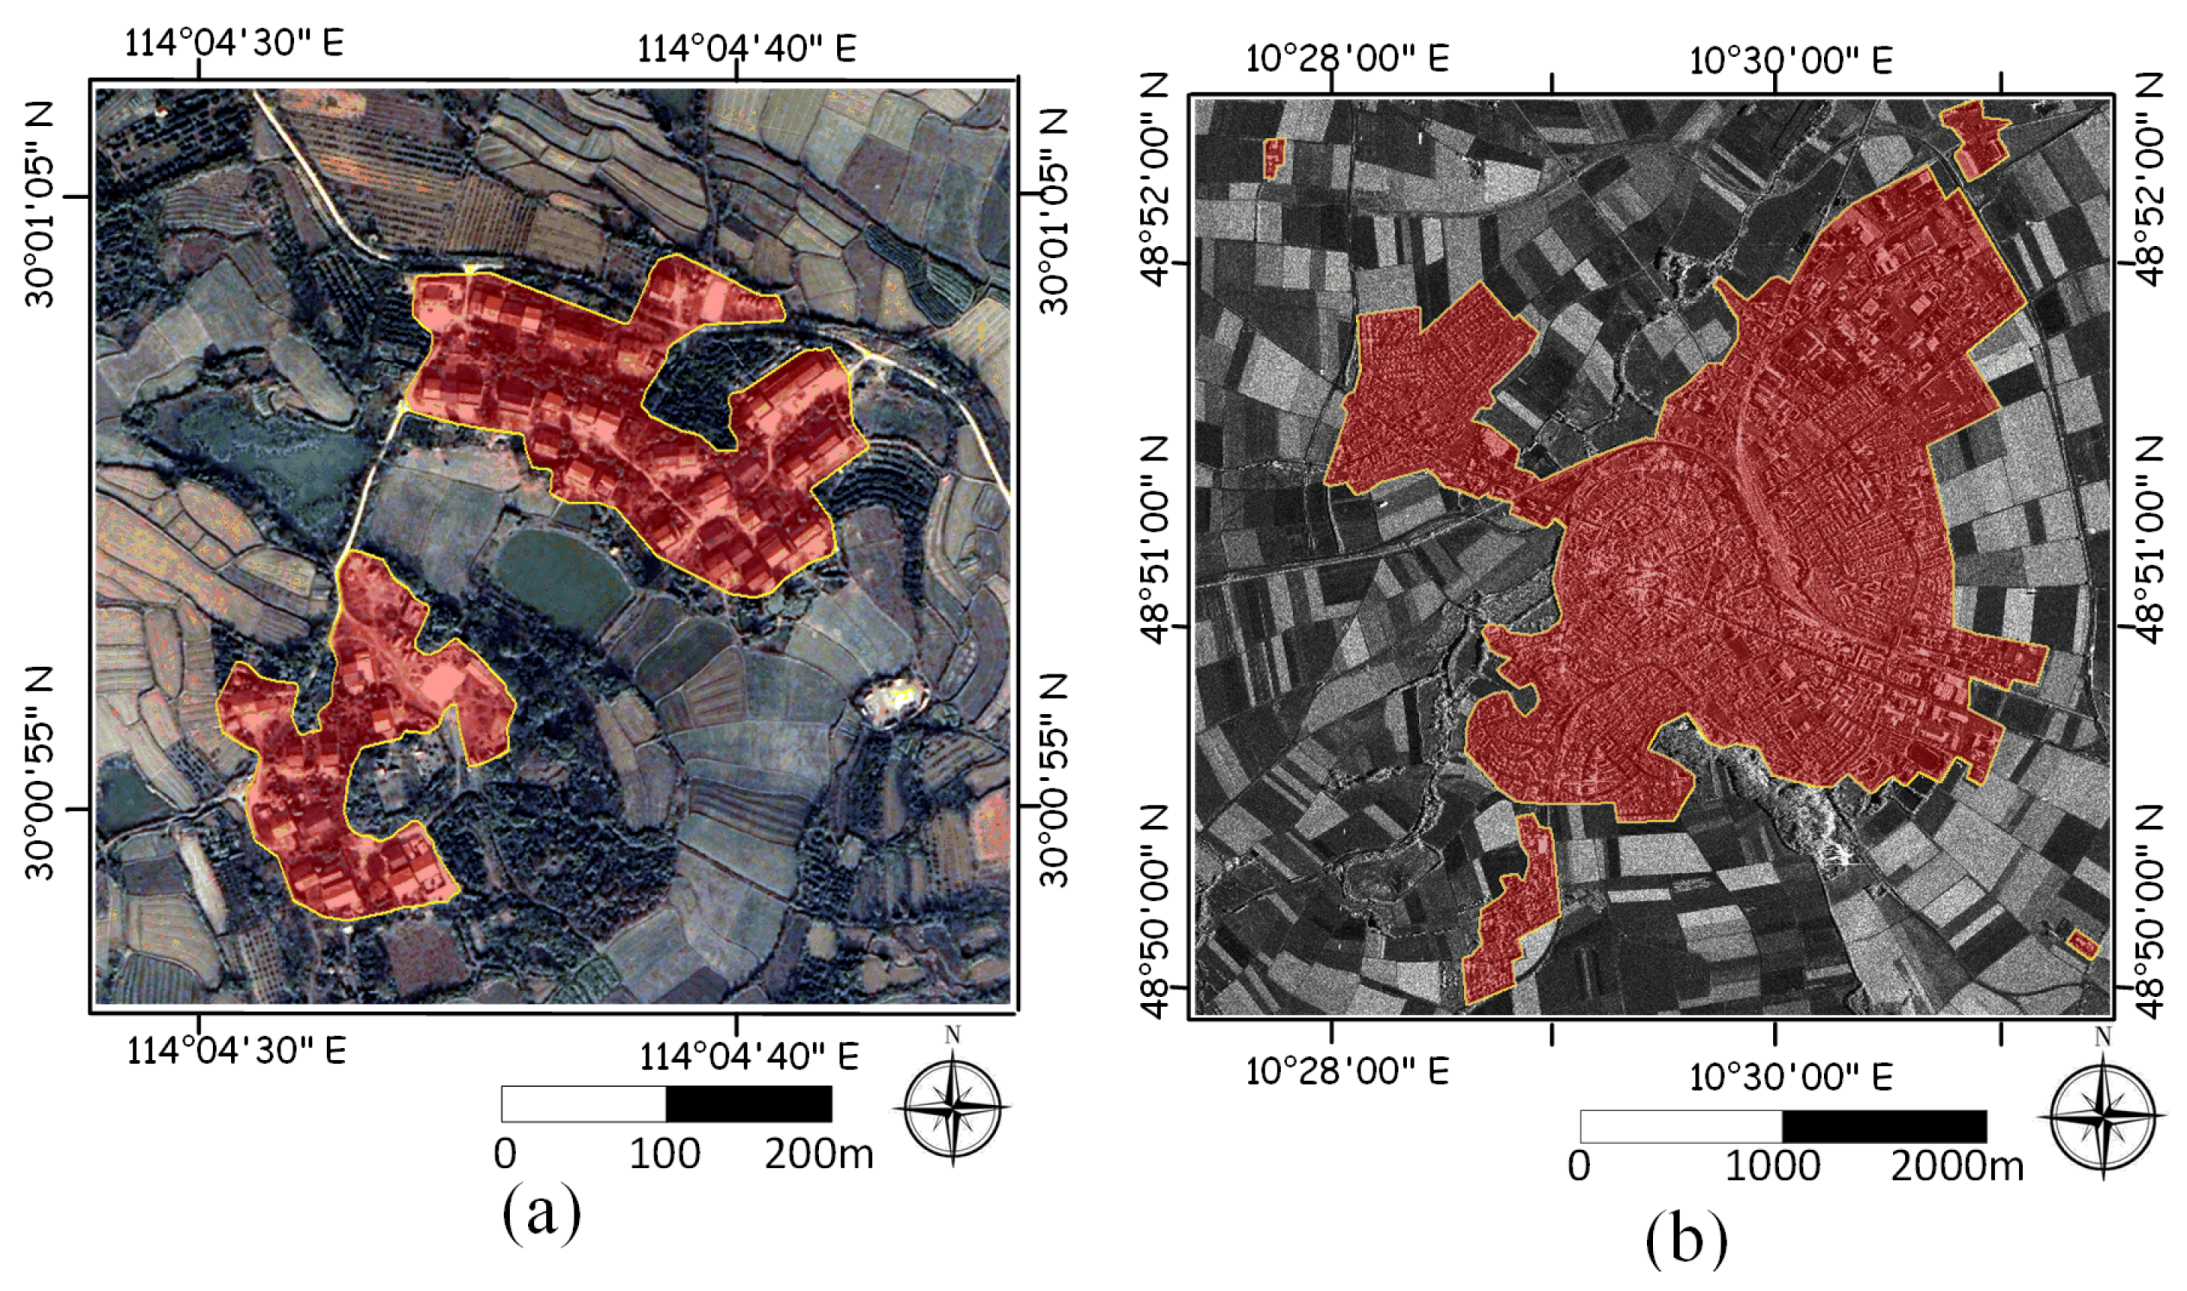
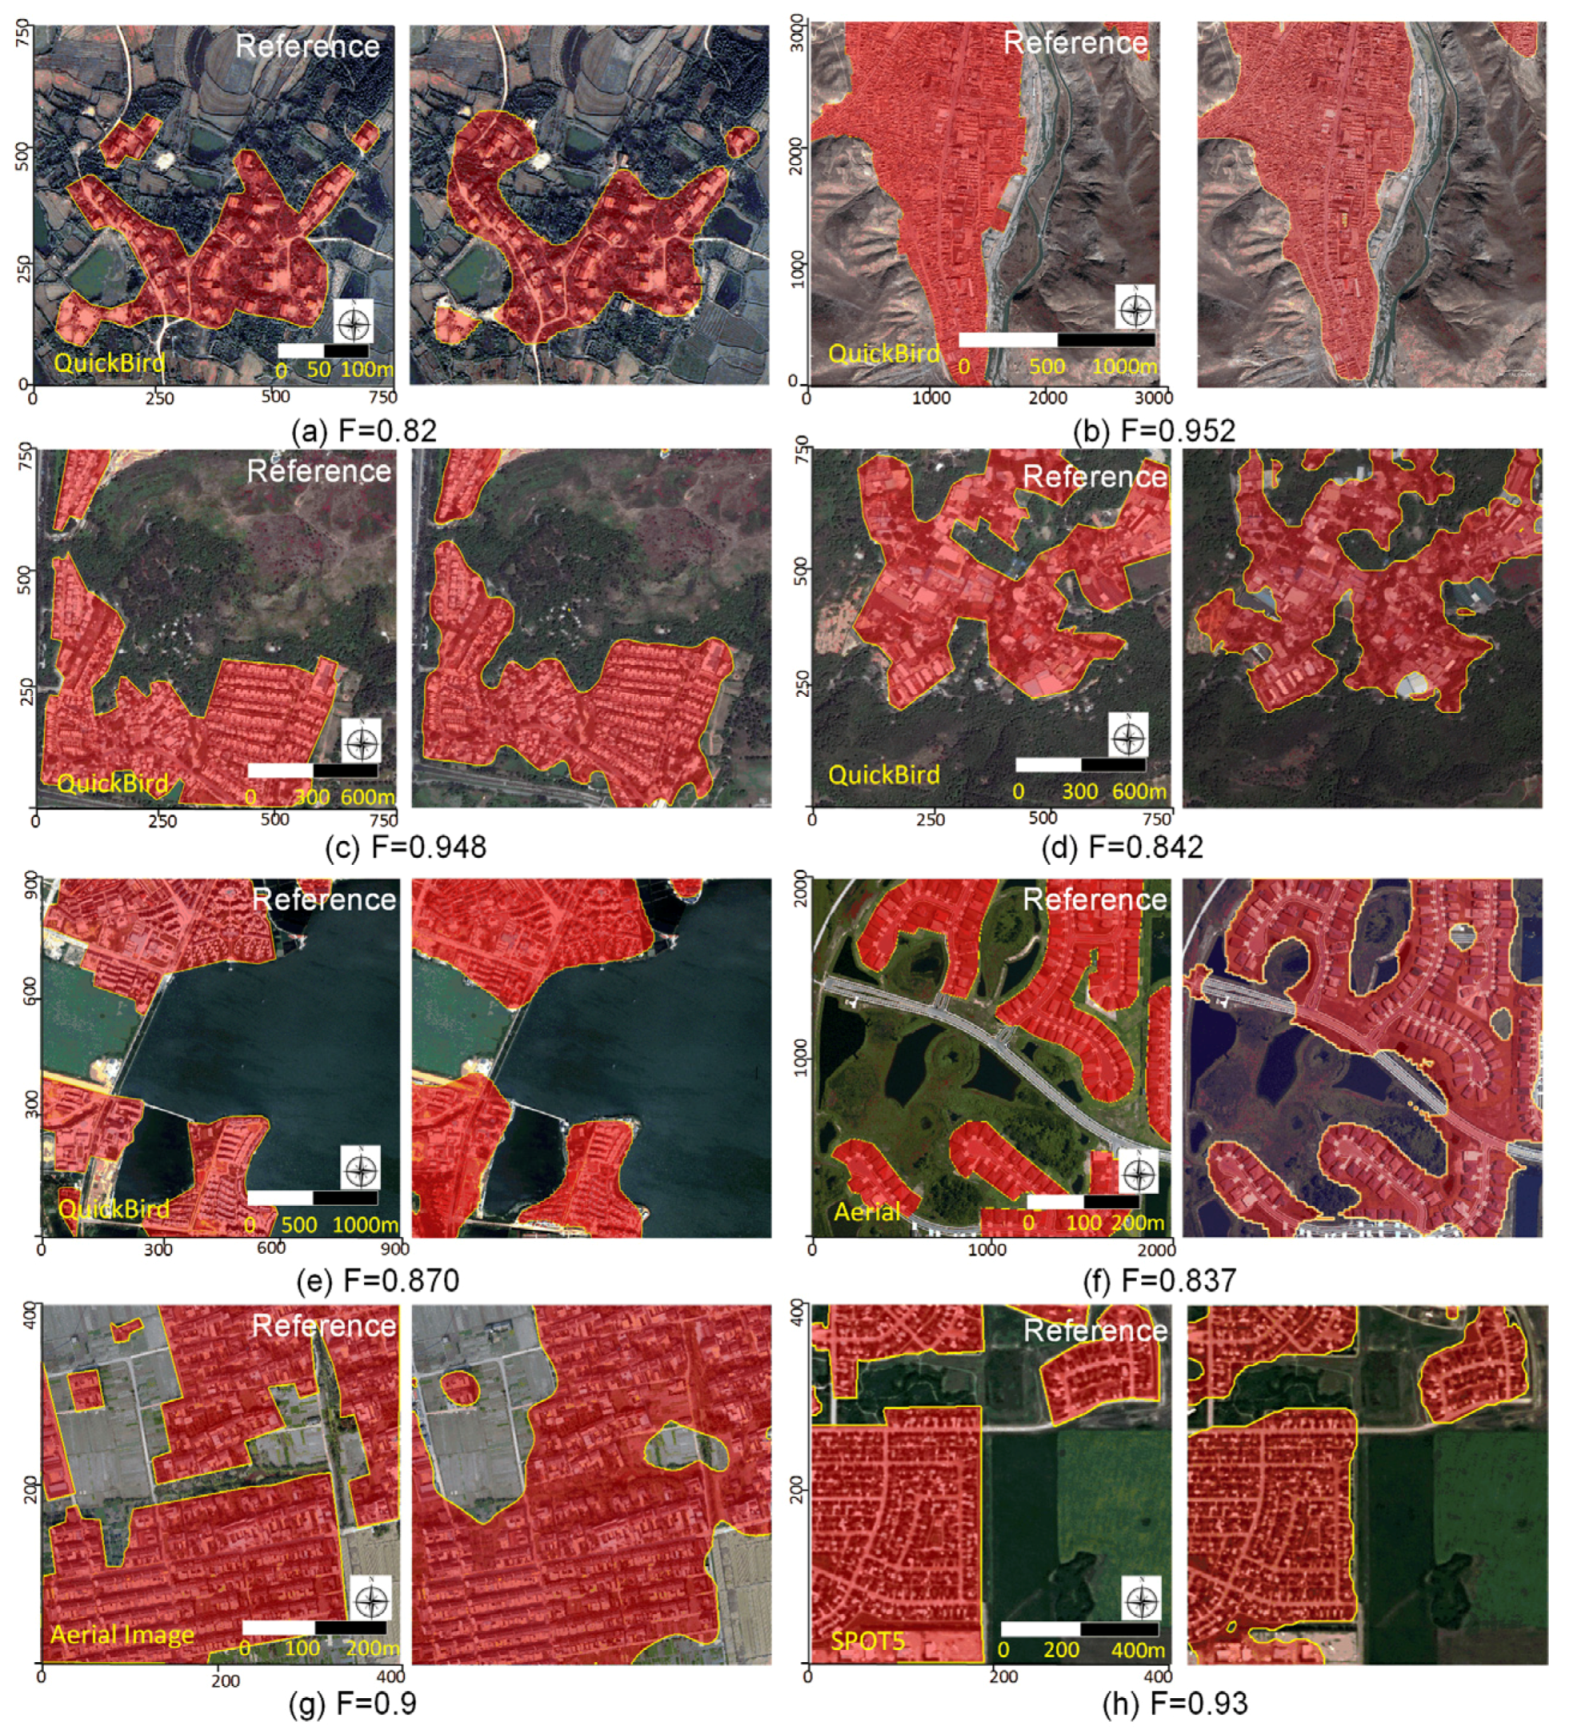
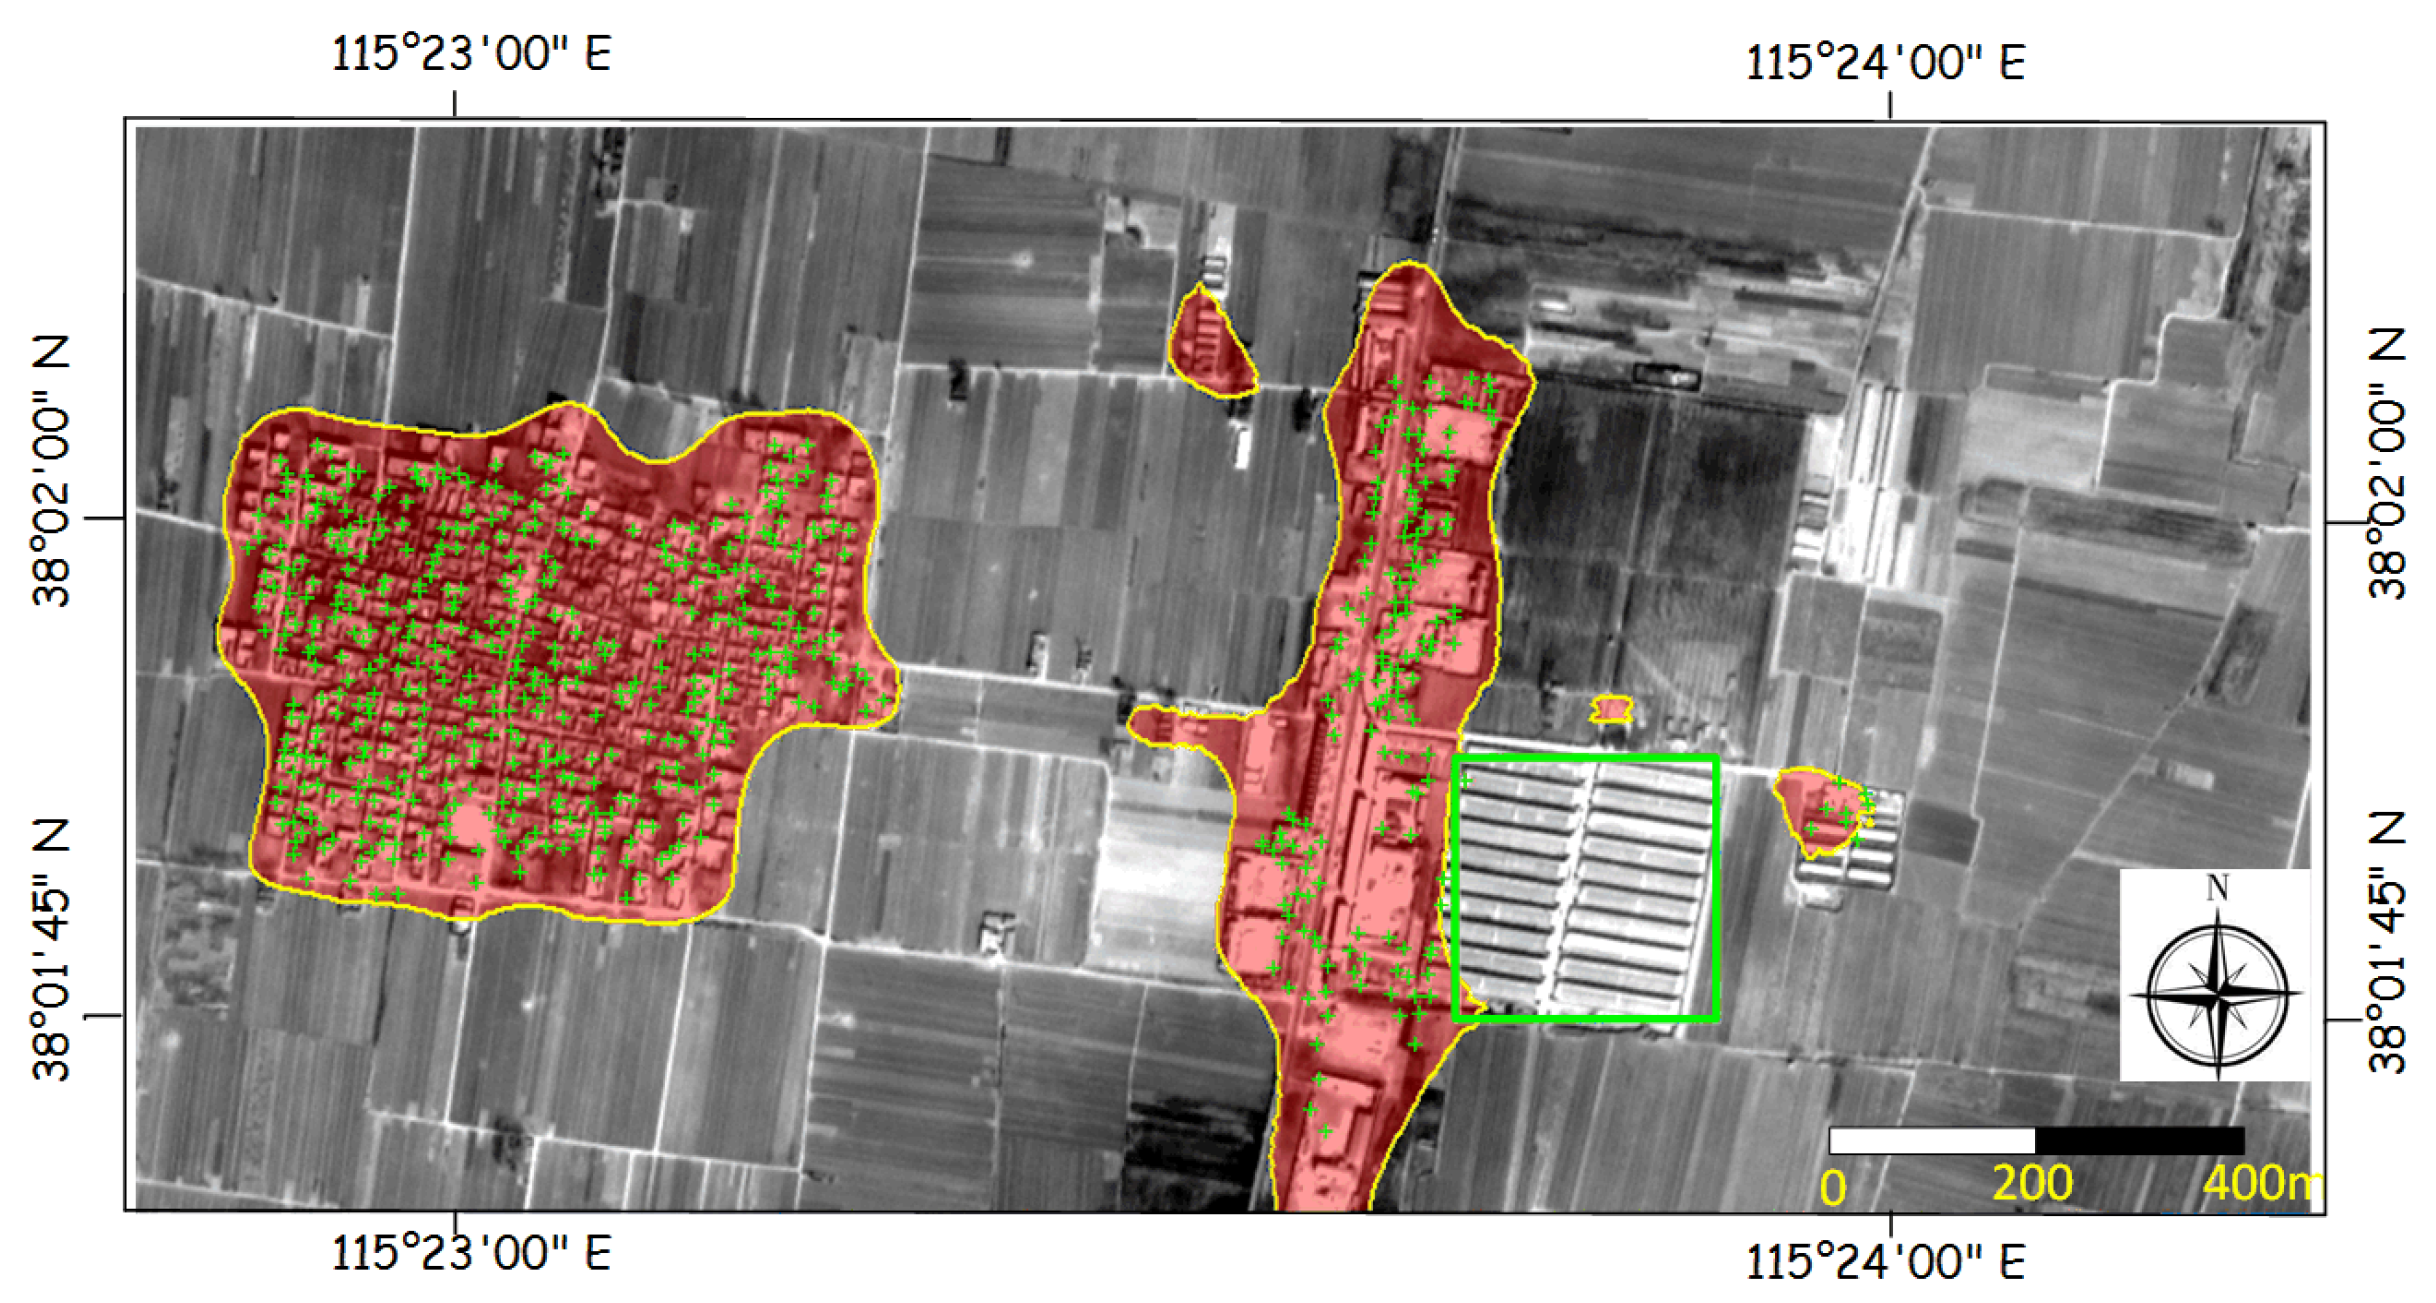
3.1. Experiments and Dataset Description
3.2. Evaluation Metrics
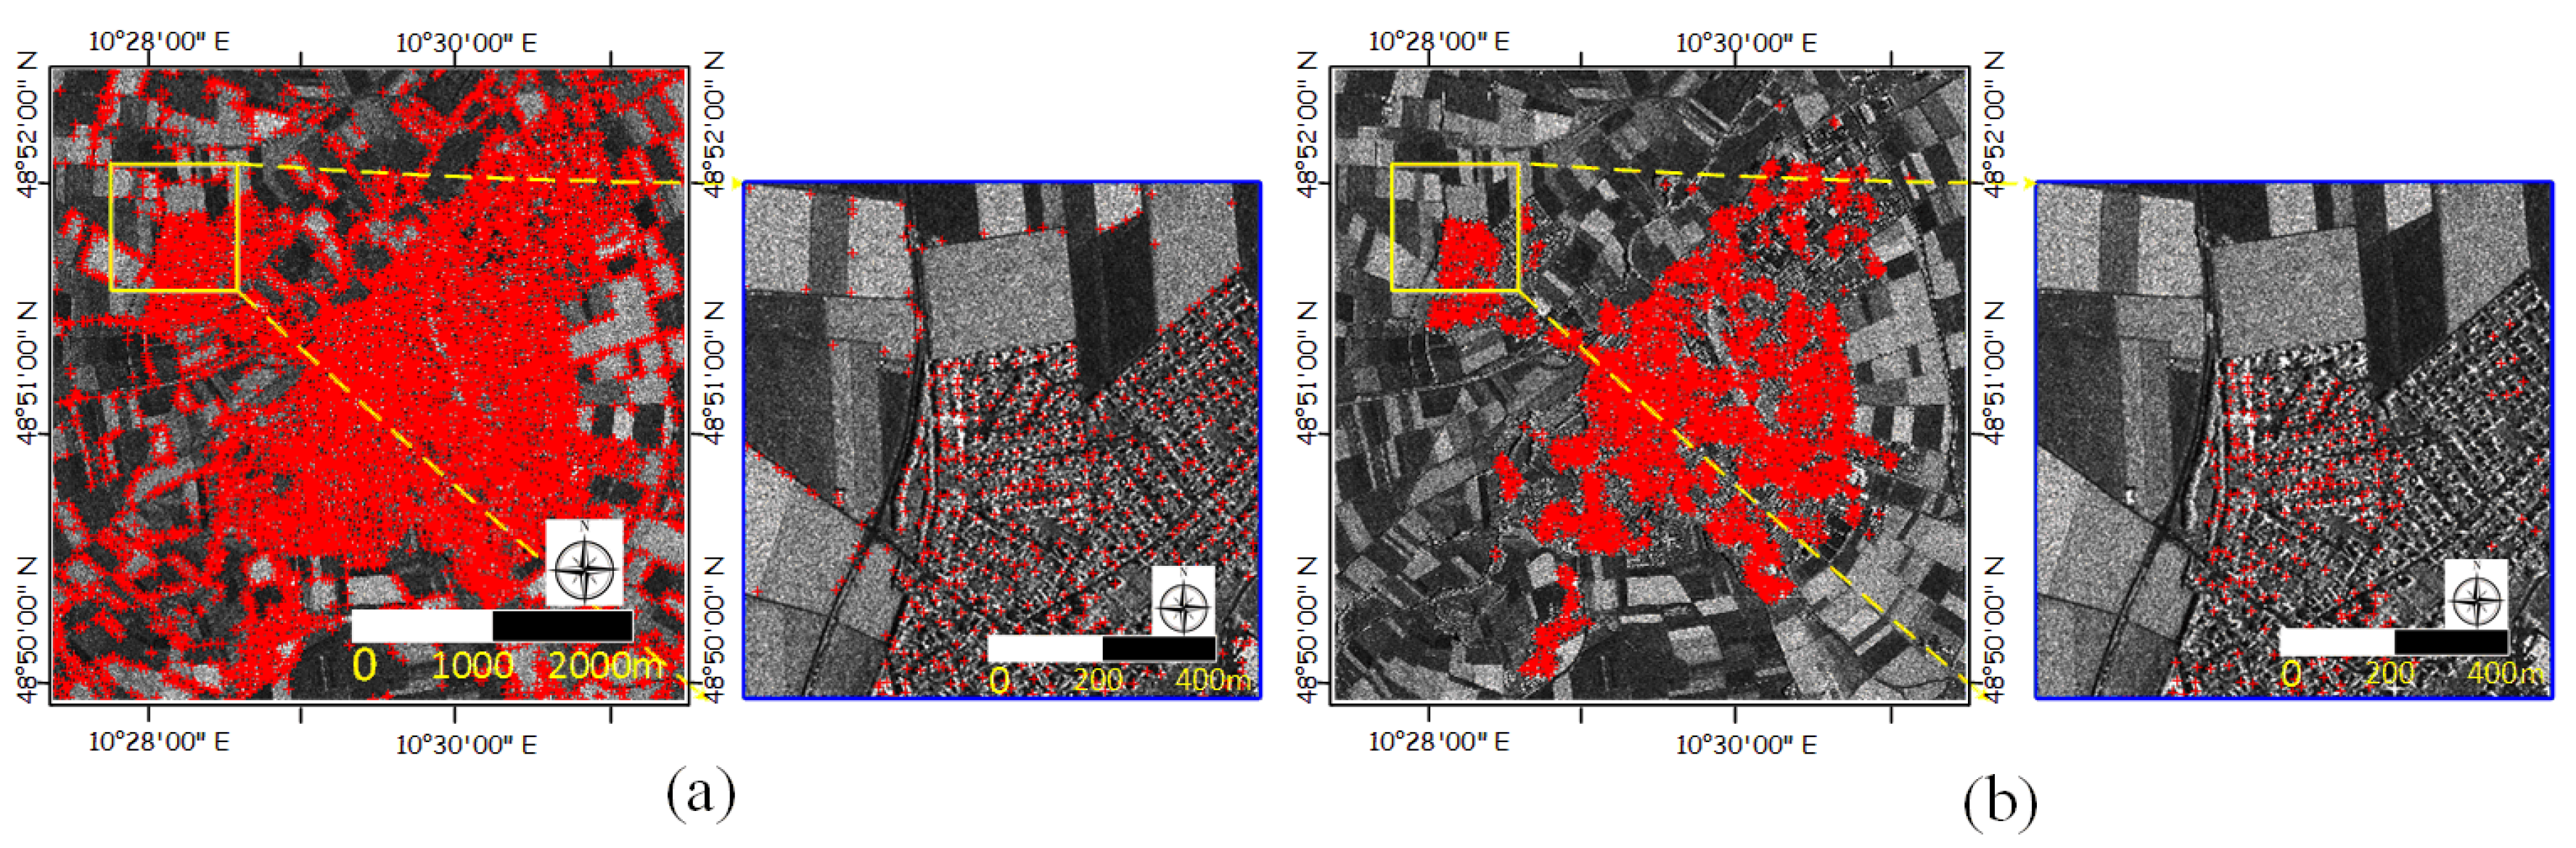
3.3. Effectiveness of the Block Offset and Data Fusion Procedure
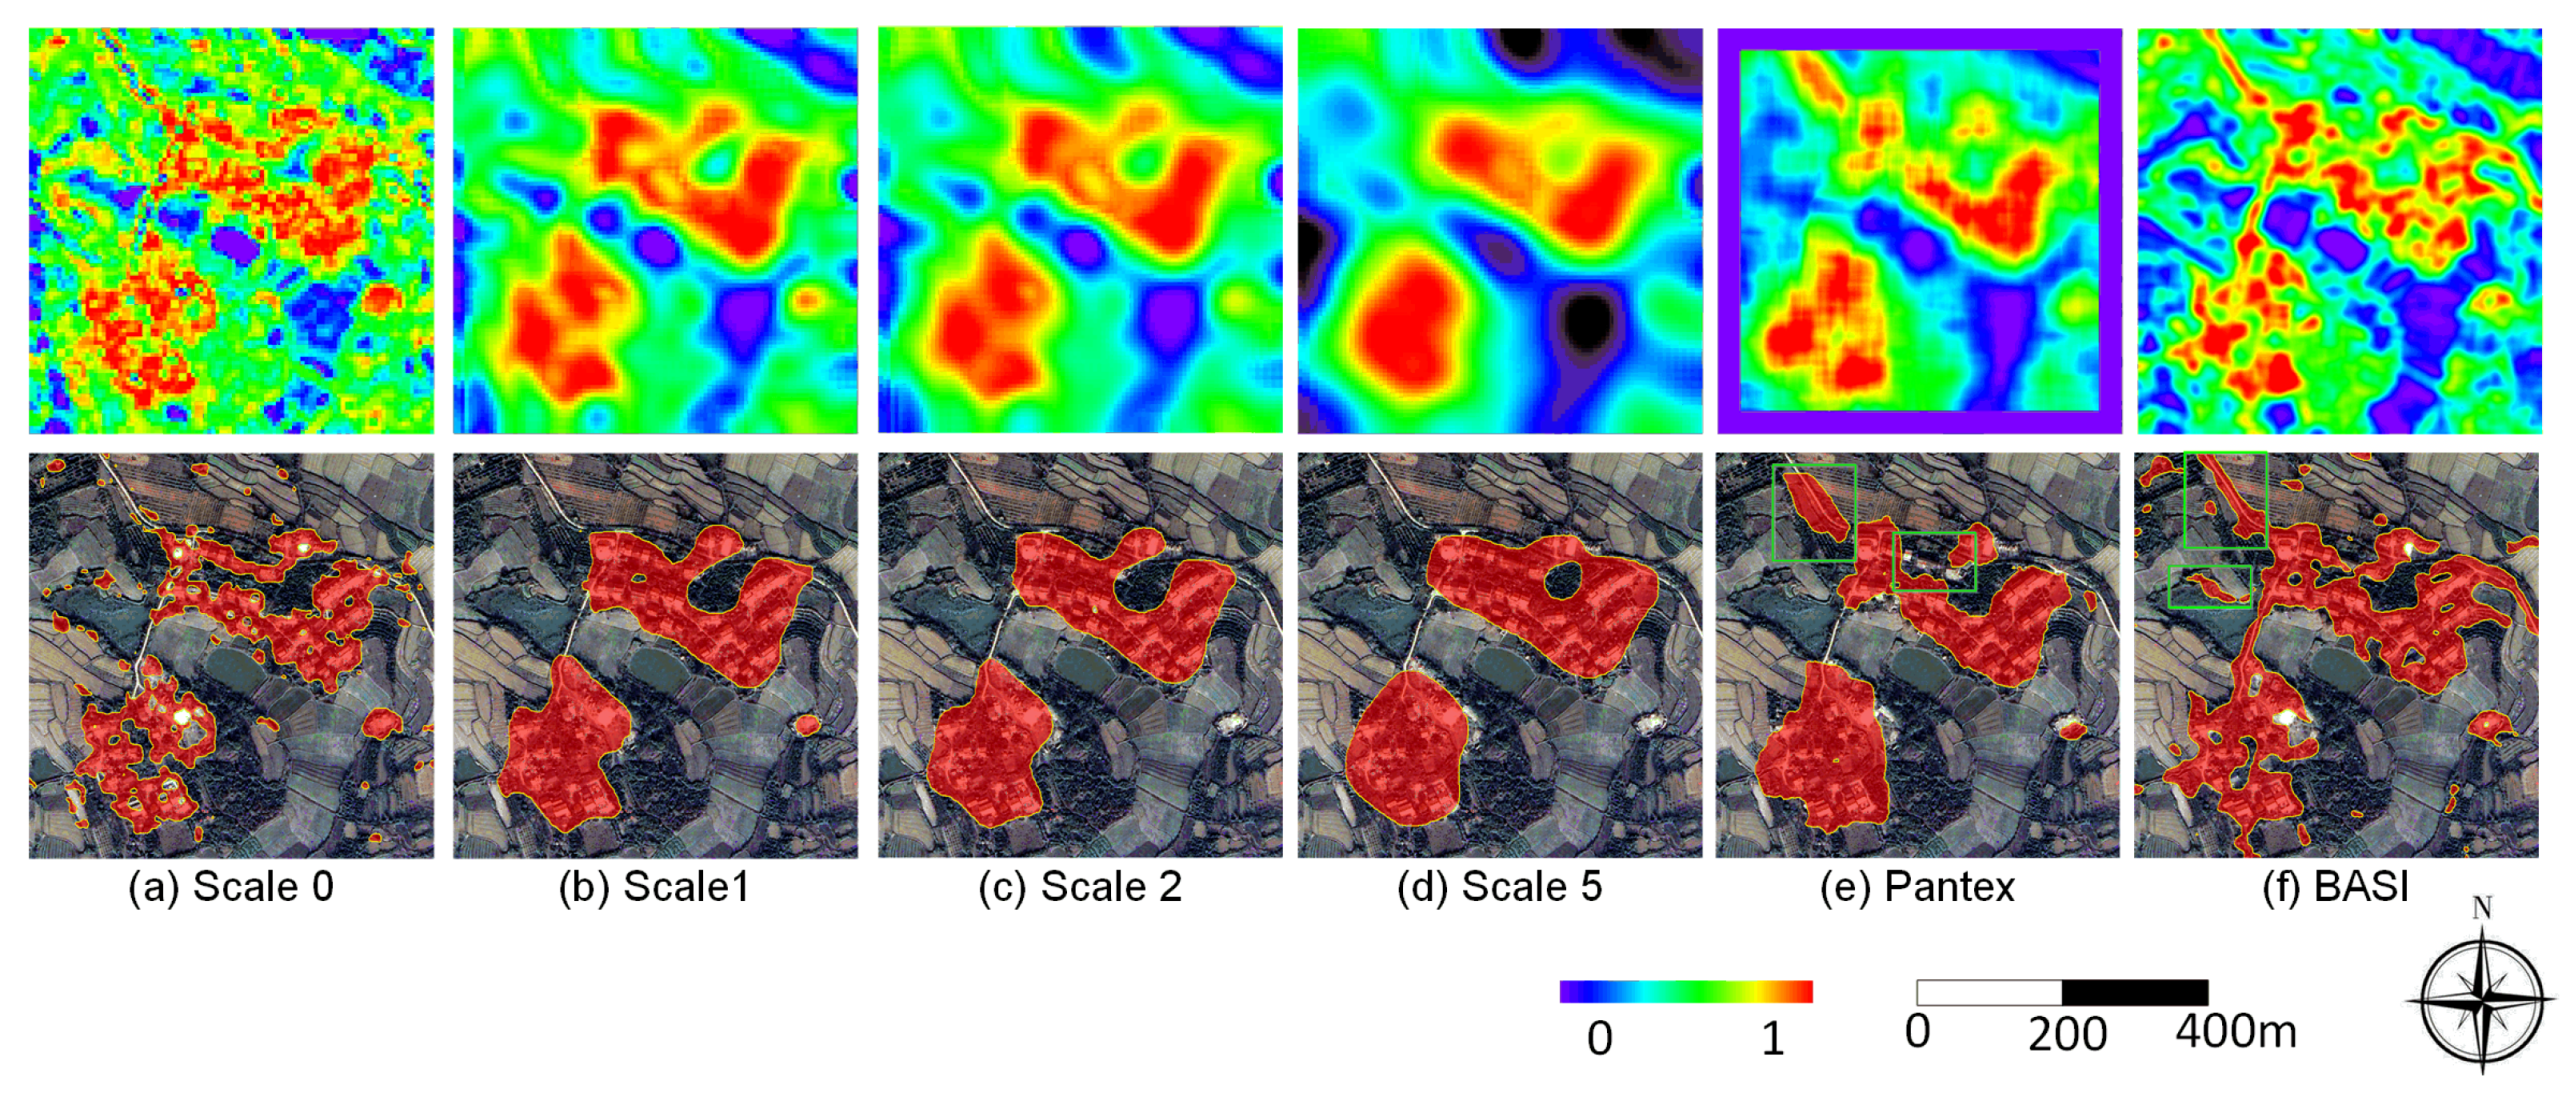
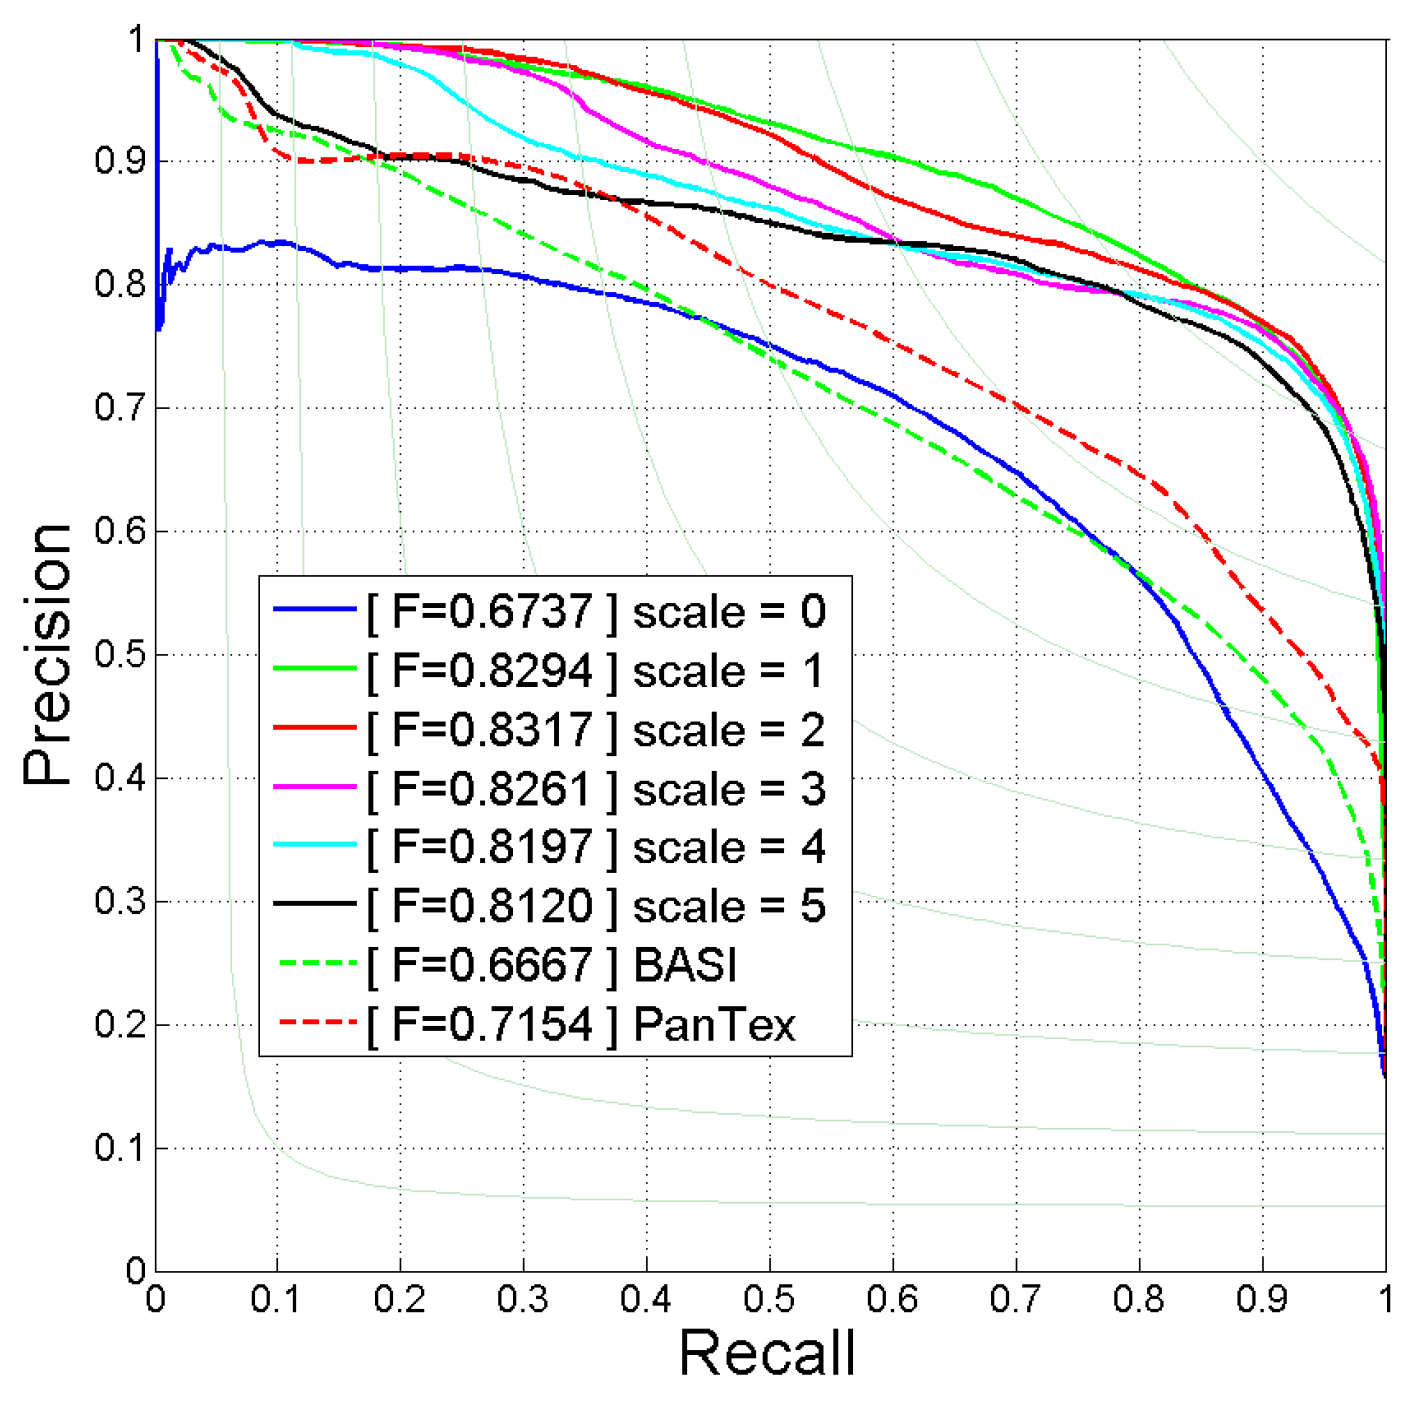
3.4. Effectiveness of the Multi-Scale Feature Representation
3.4.1. Qualitative Evaluation
3.4.2. Quantitative Evaluation
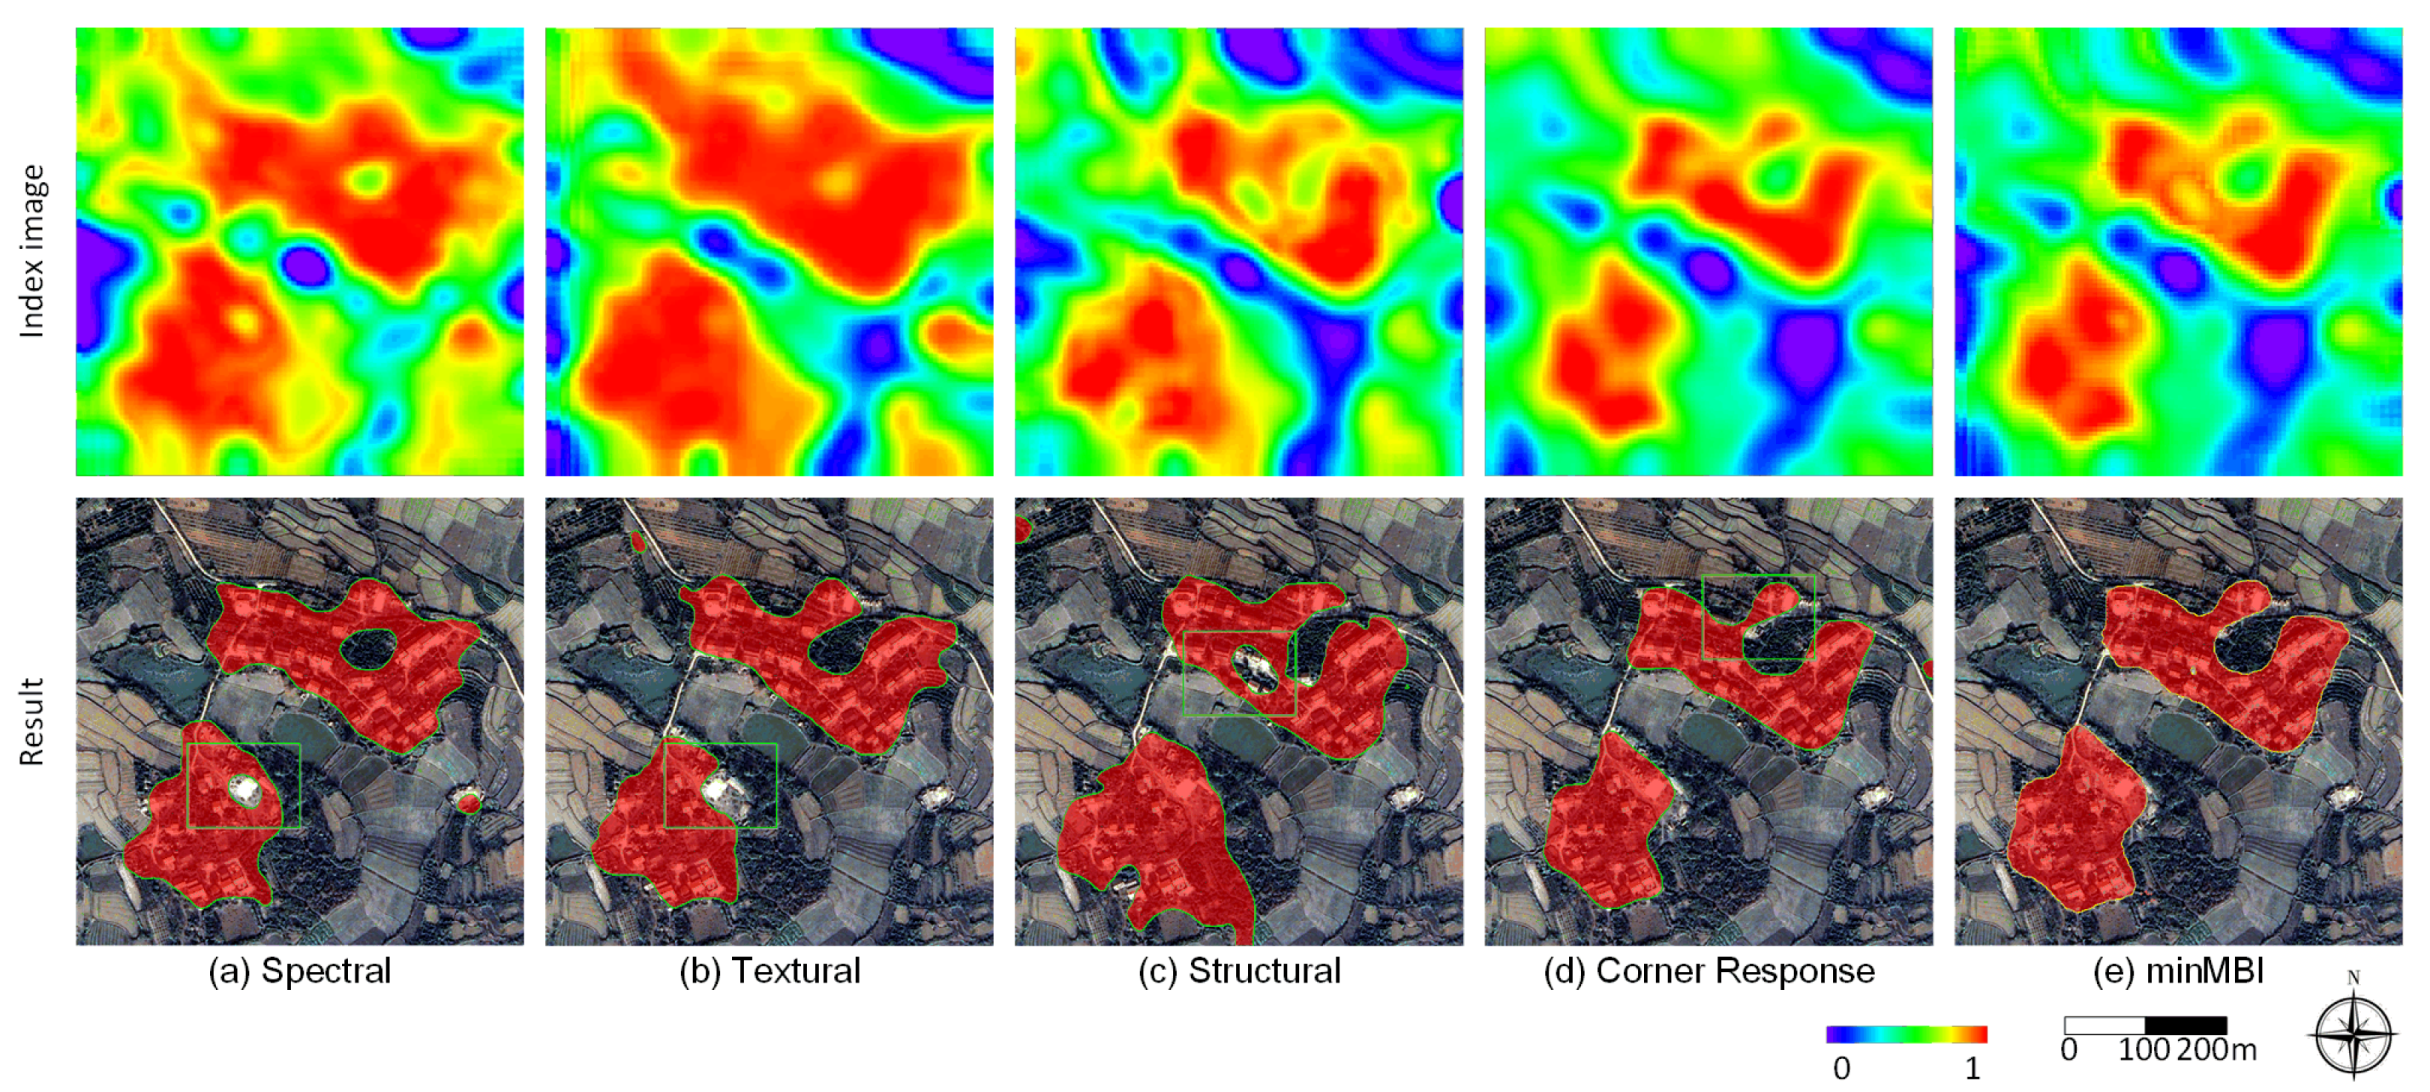
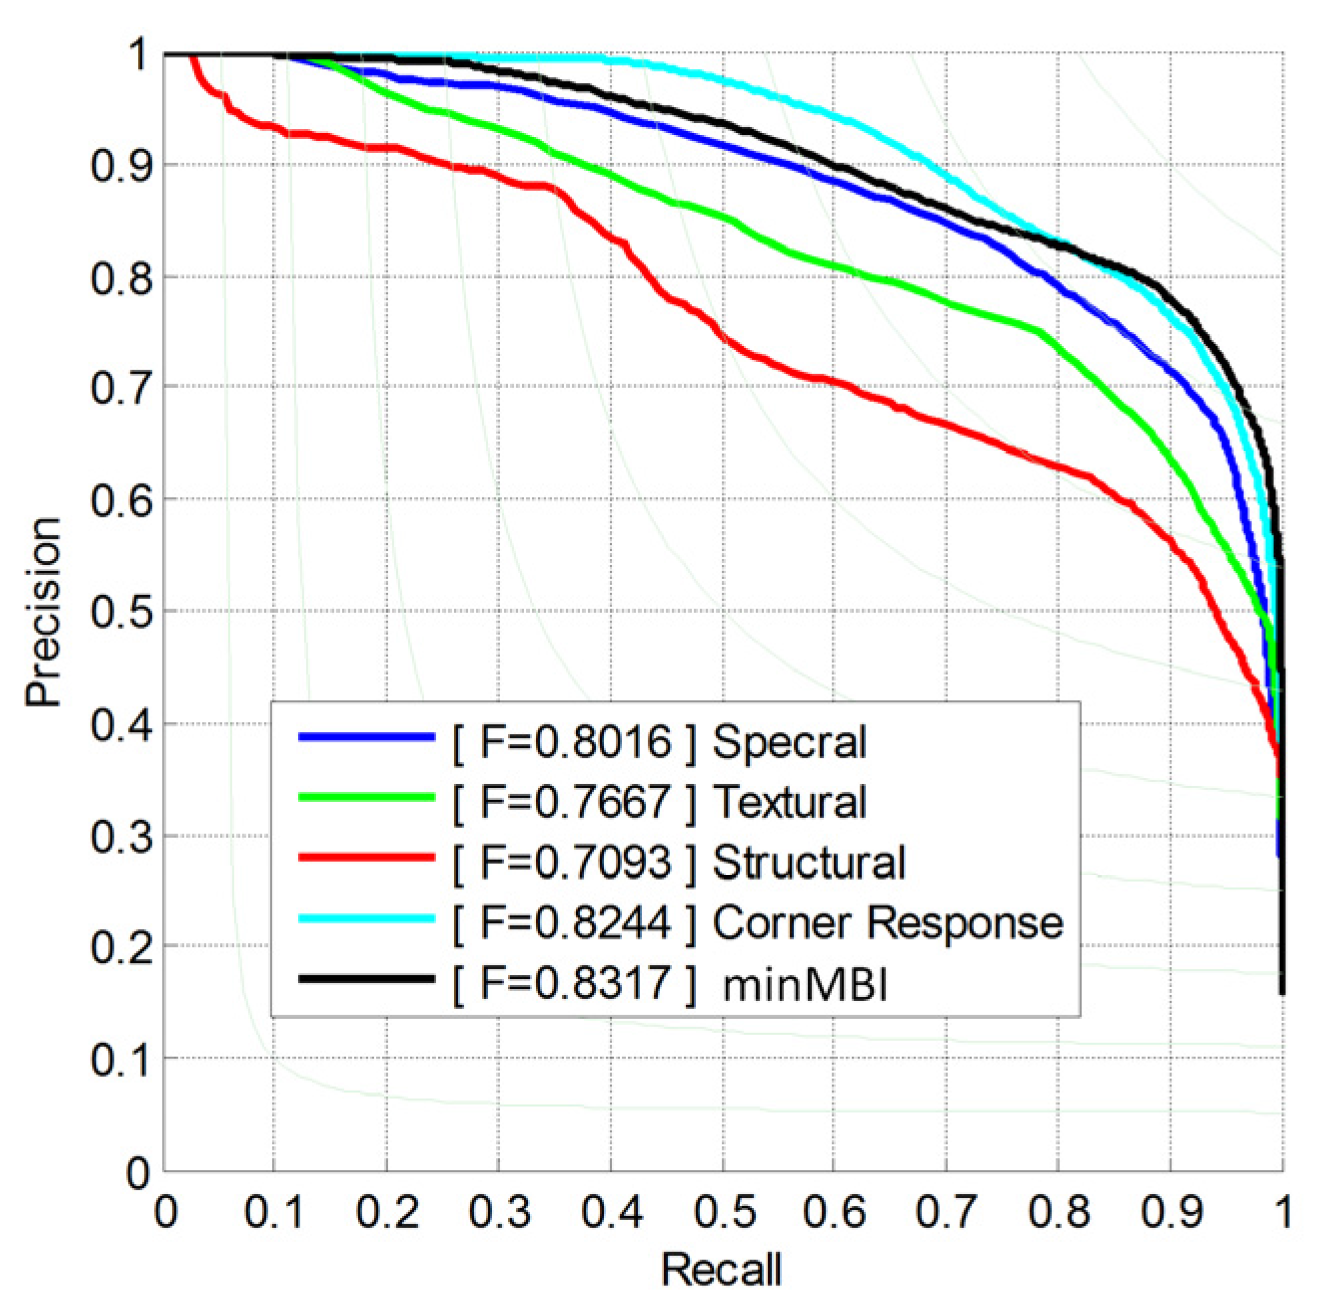
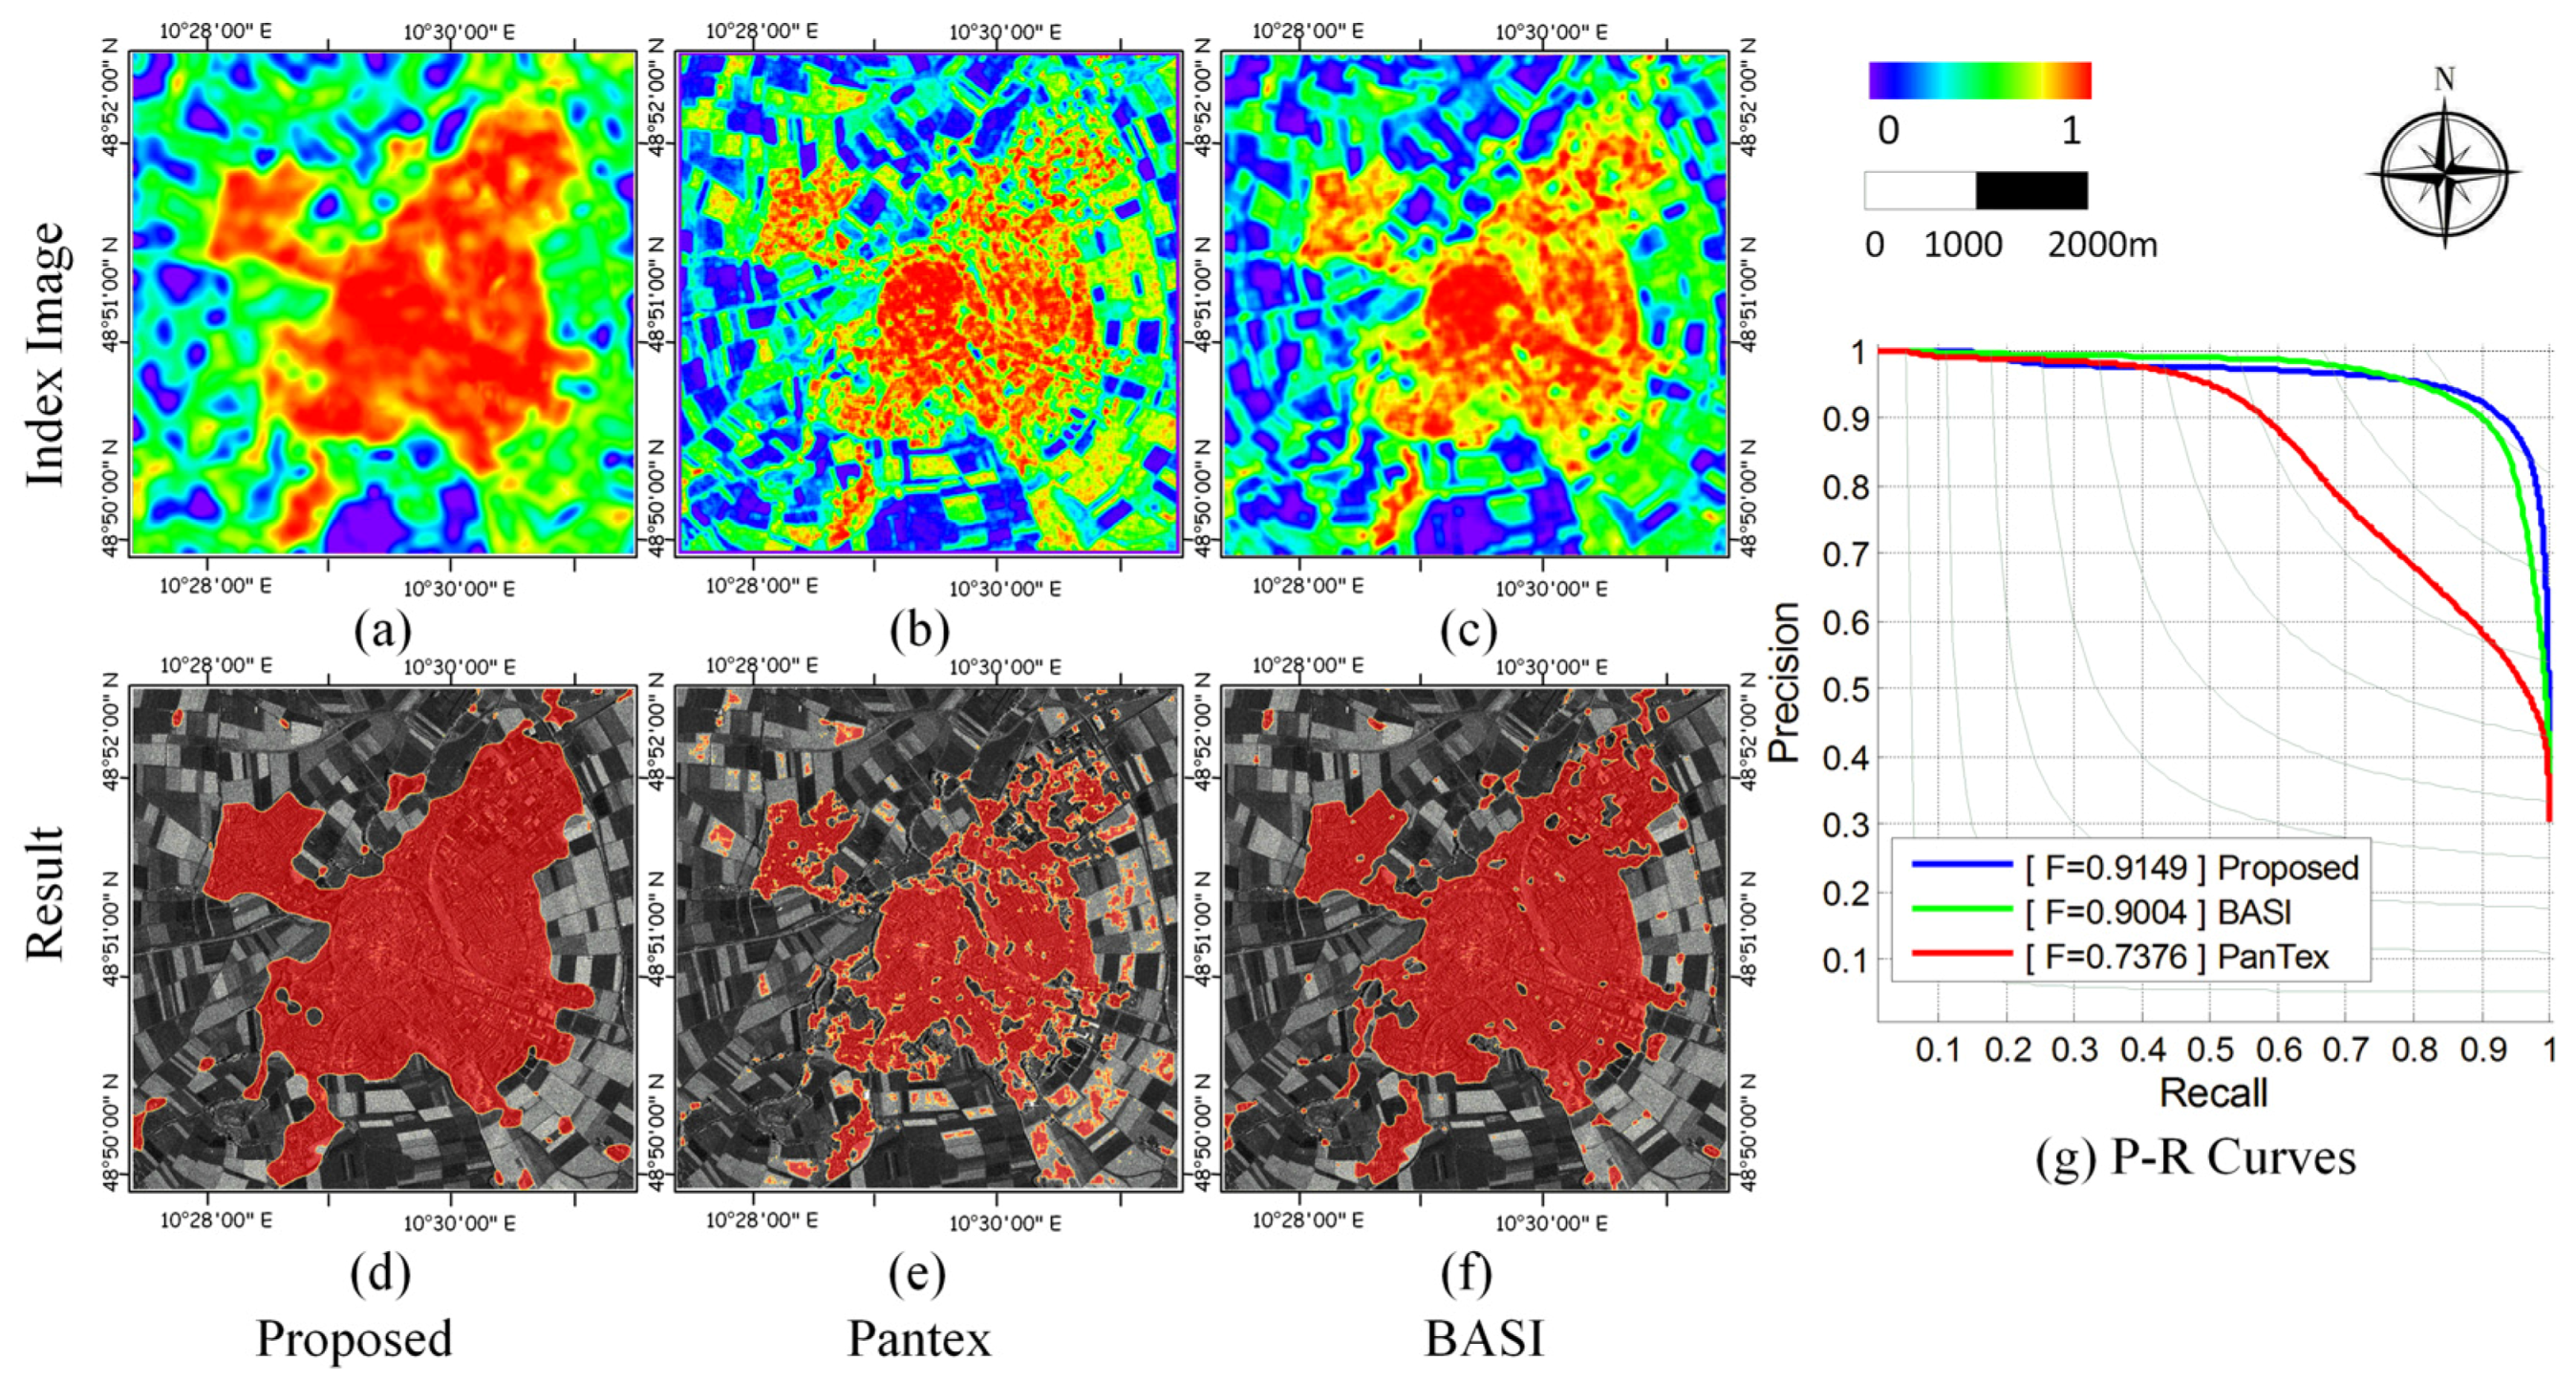
3.5. Effectiveness of the Multiple Features
3.6. Effectiveness of SAR Images
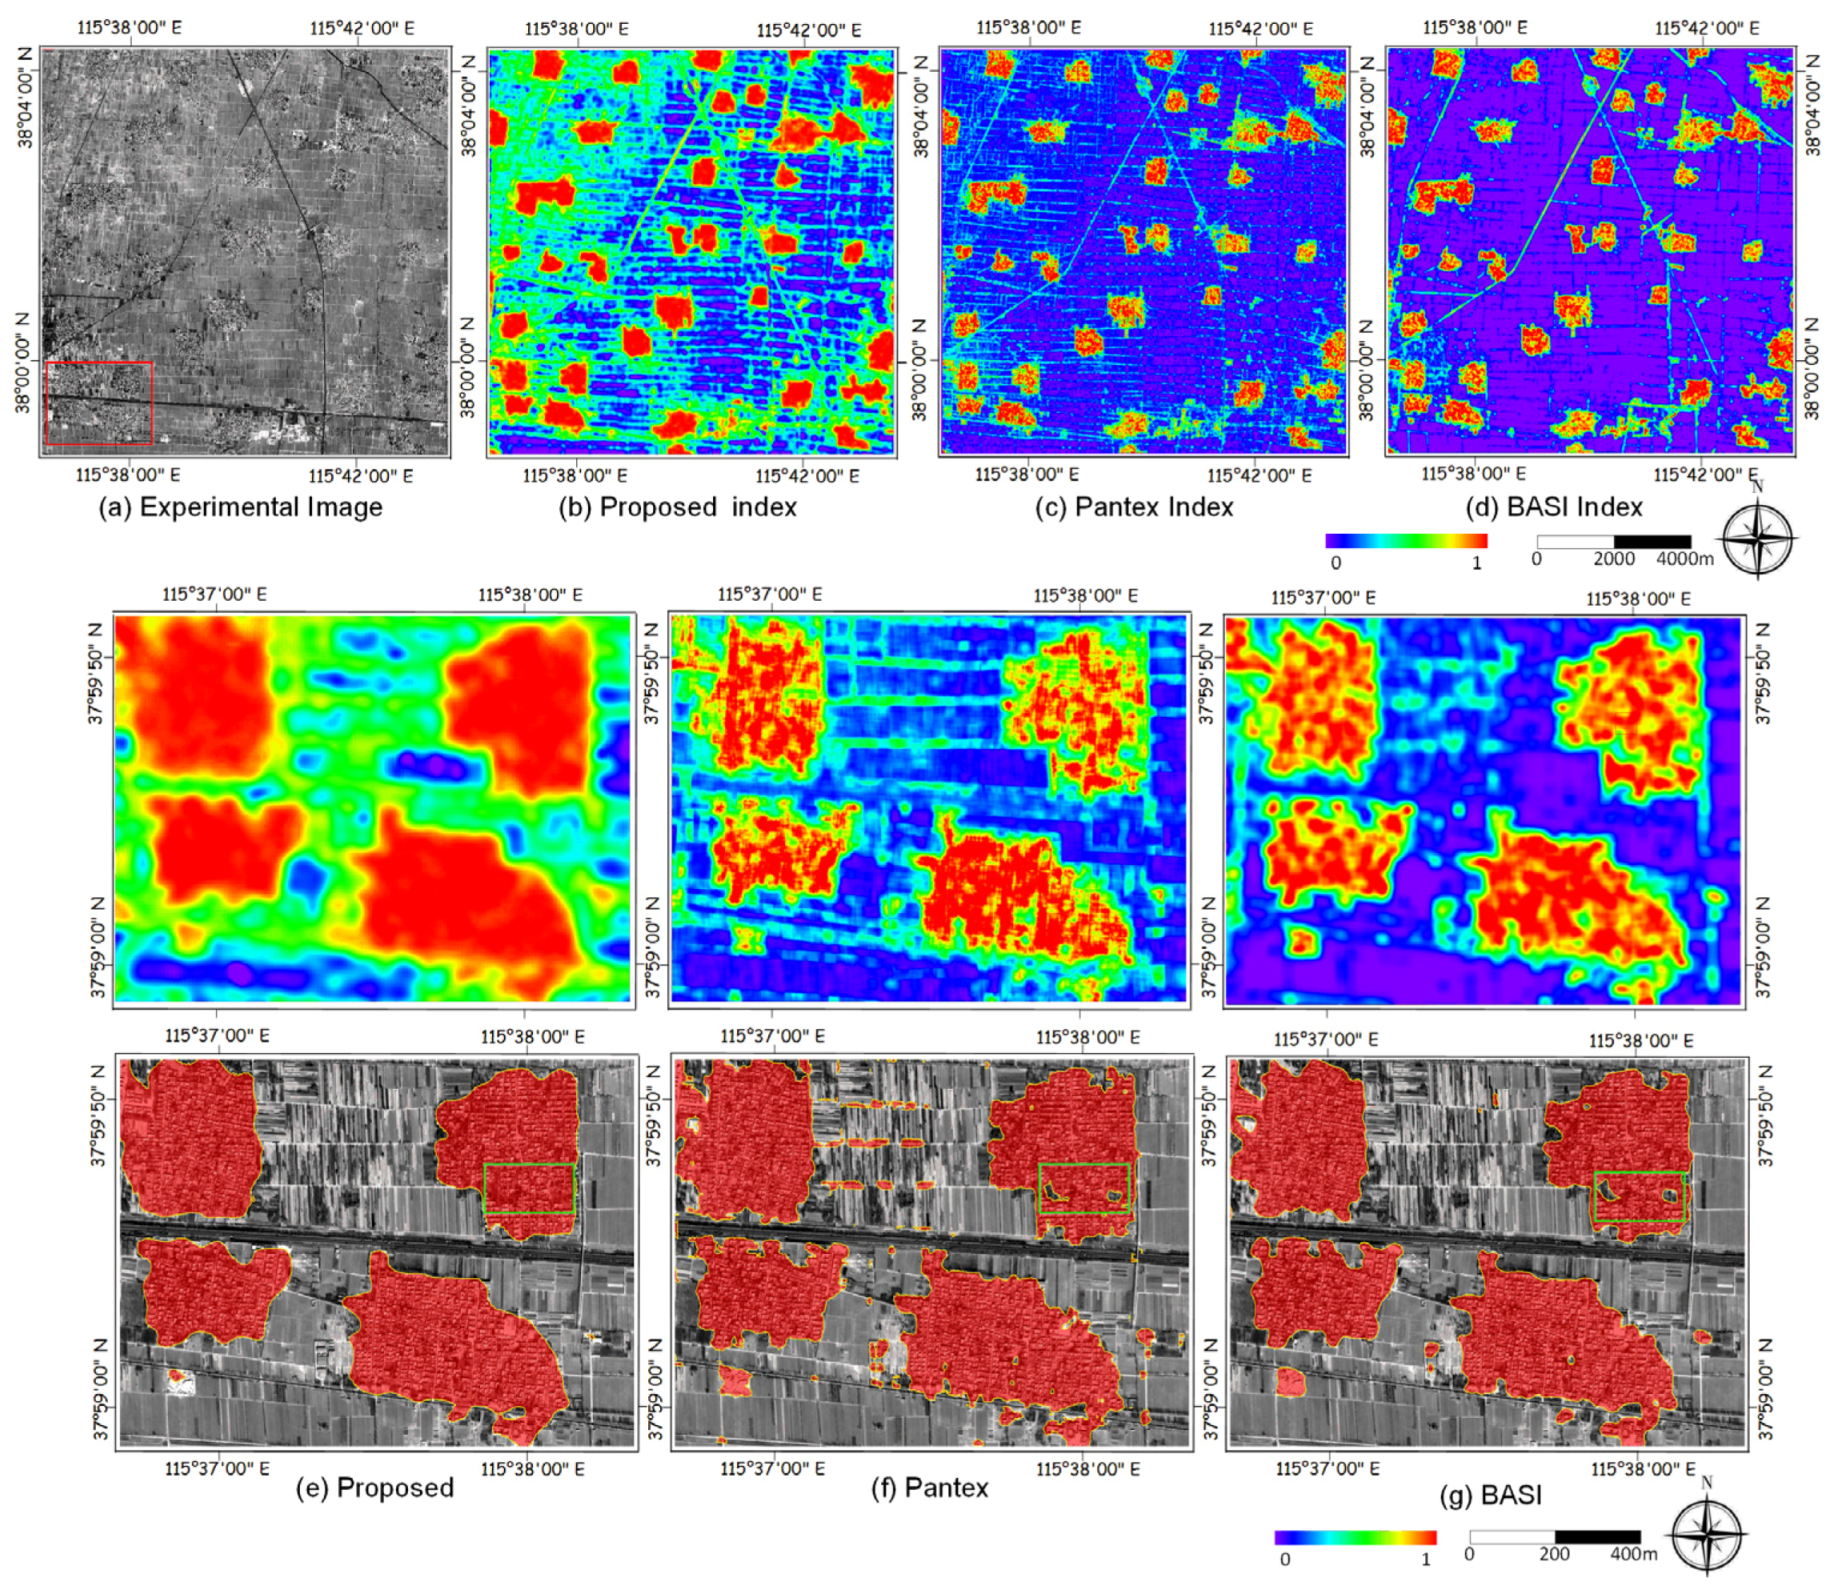
3.7. Effectiveness of ZY-3 Image
3.8. Effectiveness in Different Scenes and Different Spatial Resolutions
4. Discussion
4.1. Selection of Training Samples
4.2. Fusion of Multi-Scale Information
4.3. Acceleration and Parallel Processing
5. Conclusions
Acknowledgments
Author Contributions
Conflicts of Interest
Abbreviations
| MODIS | moderate resolution imaging spectroradiometer |
| MERIS | medium resolution imaging spectrometer |
| TM | thematic mapper |
| ETM+ | enhanced thematic mapper plus |
| NDBI | normalized difference built-up index |
| SAR | synthetic aperture radar |
| MRF | Markov random field |
| SIFT | scale-invariant feature transform |
| GLCM | gray-level co-occurrence matrix |
| NSCT | non-sampled contourlet transform |
| DFID | discrete field of image descriptors |
| RILBP | rotation-invariant local binary patterns |
| LC | local contrast |
| HOG | histogram of oriented gradients |
| BASI | built-up areas saliency index |
| MBIs | multiple built-up indexes |
| minMBI | minimum of the MBIs |
References
- Svensson, M.K.; Eliasson, I. Diurnal air temperatures in built-up areas in relation to urban planning. Landsc. Urban Plann. 2002, 61, 37–54. [Google Scholar] [CrossRef]
- Kasanko, M.; Barredo, J.I.; Lavalle, C.; McCormick, N.; Demicheli, L.; Sagris, V.; Brezger, A. Are European cities becoming dispersed? A comparative analysis of 15 European urban areas. Landsc. Urban Plann. 2006, 77, 111–130. [Google Scholar] [CrossRef]
- Pauleit, S.; Ennos, R.; Golding, Y. Modeling the environmental impacts of urban land use and land cover change—A study in Merseyside, UK. Landsc. Urban Plann. 2005, 71, 295–310. [Google Scholar] [CrossRef]
- Pesaresi, M.; Gerhardinger, A.; Haag, F. Rapid damage assessment of built-up structures using VHR satellite data in tsunami-affected areas. Int. J. Remote Sens. 2007, 28, 3013–3036. [Google Scholar] [CrossRef]
- Potere, D.; Schneider, A.; Angel, S.; Civco, D.L. Mapping urban areas on a global scale: which of the eight maps now available is more accurate? Int. J. Remote Sens. 2009, 30, 6531–6558. [Google Scholar] [CrossRef]
- Tatem, A.J.; Noor, A.M.; Hay, S.I. Defining approaches to settlement mapping for public health management in Kenya using medium spatial resolution satellite imagery. Remote Sens. Environ. 2004, 93, 42–52. [Google Scholar] [CrossRef] [PubMed]
- Lu, D.; Tian, H.; Zhou, G.; Ge, H. Regional mapping of human settlements in southeastern China with multisensor remotely sensed data. Remote Sens. Environ. 2008, 112, 3668–3679. [Google Scholar] [CrossRef]
- Wang, L.; Gong, P.; Ying, Q.; Yang, Z.; Cheng, X.; Ran, Q. Settlement extraction in the North China Plain using Landsat and Beijing-1 multispectral data with an improved watershed segmentation algorithm. Int. J. Remote Sens. 2010, 31, 1411–1426. [Google Scholar] [CrossRef]
- Pesaresi, M.; Huadong, G.; Blaes, X.; Ehrlich, D.; Ferri, S.; Gueguen, L.; Halkia, M.; Kauffmann, M.; Kemper, T.; Lu, L.; et al. A Global Human Settlement Layer from Optical HR/VHR RS Data: Concept and First Results. IEEE J. Sel. Top. Appl. Earth Obs. Remote Sens. 2013, 6, 2102–2131. [Google Scholar] [CrossRef]
- Blaschke, T. Object based image analysis for remote sensing. ISPRS J. Photogramm. Remote Sens. 2010, 65, 2–16. [Google Scholar] [CrossRef]
- Zha, Y.; Gao, J.; Ni, S. Use of normalized difference built-up index in automatically mapping urban areas from TM imagery. Int. J. Remote Sens. 2003, 24, 583–594. [Google Scholar] [CrossRef]
- Xu, H. A new index for delineating built-up land features in satellite imagery. Int. J. Remote Sens. 2008, 29, 4269–4276. [Google Scholar] [CrossRef]
- He, C.; Shi, P.; Xie, D.; Zhao, Y. Improving the normalized difference built-up index to map urban built-up areas using a semiautomatic segmentation approach. Remote Sens. Lett. 2010, 1, 213–221. [Google Scholar] [CrossRef]
- Pesaresi, M.; Gerhardinger, A.; Kayitakire, F. A robust built-up area presence index by anisotropic rotation-invariant textural measure. IEEE J. Sel. Top. Appl. Earth Obs. Remote Sens. 2008, 1, 180–192. [Google Scholar] [CrossRef]
- Sirmacek, B.; Unsalan, C. Urban-area and building detection using SIFT keypoints and graph theory. IEEE Trans. Geosci. Remote Sens. 2009, 47, 1156–1167. [Google Scholar] [CrossRef]
- Tao, C.; Tan, Y.; Zou, Z.R.; Tian, J. Unsupervised detection of built-up areas from multiple high-resolution remote sensing images. IEEE Geosci. Remote Sens. Lett. 2013, 10, 1300–1304. [Google Scholar] [CrossRef]
- Weizman, L.; Goldberger, J. Urban-area segmentation using visual words. IEEE Geosci. Remote Sens. Lett. 2009, 6, 388–392. [Google Scholar] [CrossRef]
- Shi, H.; Chen, L.; Bi, F.K.; Chen, H.; Yu, Y. Accurate Urban Area Detection in Remote Sensing Images. IEEE Geosci. Remote Sens. Lett. 2015, in press. [Google Scholar]
- Hofmann, P. Detecting Informal Settlements from IKONOS Image Data Using Methods of Object Oriented Image Analysis—An Example from Cape Town (South Africa). Available online: http://www.ecognition.com/sites/default/files/395_hofmann.pdf (accessed on 24 August 2015).
- Hofmann, P.; Strobl, J.; Blaschke, T.; Kux, H. Detecting informal settlements from QuickBird data in Rio de Janeiro using an object based approach. In Object-Based Image Analysis; Springer: London, UK, 2008; pp. 531–553. [Google Scholar]
- Jacquin, A.; Misakova, L.; Gay, M. A hybrid object-based classification approach for mapping urban sprawl in periurban environment. Landsc. Urban Plann. 2008, 84, 152–165. [Google Scholar] [CrossRef]
- Zhou, Y.; Wang, Y. Extraction of impervious surface areas from high spatial resolution imagery by multiple agent segmentation and classification. Photogramm. Eng. Remote Sens. 2008, 74, 857–868. [Google Scholar] [CrossRef]
- Hu, X.; Weng, Q. Impervious surface area extraction from IKONOS imagery using an object-based fuzzy method. Geocarto Int. 2011, 26, 3–20. [Google Scholar] [CrossRef]
- Zheng, C.; Wang, L.; Zhao, H.; Chen, X. Urban area detection from high-spatial resolution remote sensing imagery using Markov random field-based region growing. J. A. Remote Sens. 2014, 8, 083566. [Google Scholar] [CrossRef]
- Lowe, D.G. Distinctive image features from scale-invariant keypoints. Int. J. Comp. Vis. 2004, 60, 91–110. [Google Scholar] [CrossRef]
- Harris, C.; Stephens, M. A combined corner and edge detector. Alvey Vis. Conf. 1988, 15, 50. [Google Scholar]
- Sirmaçek, B.; Ünsalan, C. Urban area detection using local feature points and spatial voting. IEEE Geosci. Remote Sen. Lett. 2010, 7, 146–150. [Google Scholar] [CrossRef]
- Kovacs, A.; Szirányi, T. Improved Harris feature point set for orientation-sensitive urban-area detection in aerial images. IEEE Geosci. Remote Sens. Lett. 2013, 10, 796–800. [Google Scholar] [CrossRef]
- Li, Y.; Tan, Y.; Deng, J.; Wen, Q.; Tian, J. Cauchy Graph Embedding Optimization for Built-Up Areas Detection From High-Resolution Remote Sensing Images. IEEE J. Sel. Top. Appl. Earth Obs. Remote Sens. 2015, in press. [Google Scholar] [CrossRef]
- Gueguen, L.; Soille, P.; Pesaresi, M. A new built-up presence index based on density of corners. In Proceedings of the 2012 IEEE International Geoscience and Remote Sensing Symposium (IGARSS), Munich, Germany, 22–27 July 2012; pp. 5398–5401.
- Gamba, P.; Aldrighi, M.; Stasolla, M. Robust extraction of urban area extents in HR and VHR SAR images. IEEE J. Sel. Top. Appl. Earth Obs. Remote Sens. 2011, 4, 27–34. [Google Scholar] [CrossRef]
- Li, N.; Bruzzone, L.; Chen, Z.; Liu, F. A Novel Technique Based on the Combination of Labeled Co-Occurrence Matrix and Variogram for the Detection of Built-up Areas in High-Resolution SAR Images. Remote Sens. 2014, 6, 3857–3878. [Google Scholar] [CrossRef]
- Shao, Z.; Tian, Y.; Shen, X. BASI: A new index to extract built-up areas from high-resolution remote sensing images by visual attention model. Remote Sens. Lett. 2014, 5, 305–314. [Google Scholar] [CrossRef]
- Da Cunha, A.L.; Zhou, J.; Do, M.N. The nonsubsampled contourlet transform: Theory, design, and applications. IEEE Trans. Image Process. 2006, 15, 3089–3101. [Google Scholar] [CrossRef] [PubMed]
- Gueguen, L. Classifying compound structures in satellite images: A compressed representation for fast queries. IEEE Trans. Geosci. Remote Sens. 2015, 53, 1803–1818. [Google Scholar] [CrossRef]
- Ojala, T.; Pietikainen, M.; Maenpaa, T. Multiresolution gray-scale and rotation-invariant texture classification with local binary patterns. IEEE Trans. Pattern Anal. Mach. Intell. 2002, 24, 971–987. [Google Scholar] [CrossRef]
- Dalal, N.; Triggs, B. Histograms of Oriented Gradients for Human Detection. Available online: https://lear.inrialpes.fr/people/triggs/pubs/Dalal-cvpr05.pdf (accessed on 24 August 2015).
- Zhong, P.; Wang, R. A multiple conditional random fields ensemble model for urban area detection in remote sensing optical images. IEEE Trans. Geosci. Remote Sens. 2007, 45, 3978–3988. [Google Scholar] [CrossRef]
- Lindeberg, T. Scale-Space Theory in Computer Vision; Springer: London, UK, 1993. [Google Scholar]
- Otsu, N. A threshold selection method from gray-level histograms. Automatica 1975, 11, 23–27. [Google Scholar]
- Kittler, J.; Illingworth, J. Minimum error thresholding. Patt. Recogn. 1986, 19, 41–47. [Google Scholar] [CrossRef]


© 2016 by the authors; licensee MDPI, Basel, Switzerland. This article is an open access article distributed under the terms and conditions of the Creative Commons by Attribution (CC-BY) license (http://creativecommons.org/licenses/by/4.0/).
Share and Cite
Hu, Z.; Li, Q.; Zhang, Q.; Wu, G. Representation of Block-Based Image Features in a Multi-Scale Framework for Built-Up Area Detection. Remote Sens. 2016, 8, 155. https://0-doi-org.brum.beds.ac.uk/10.3390/rs8020155
Hu Z, Li Q, Zhang Q, Wu G. Representation of Block-Based Image Features in a Multi-Scale Framework for Built-Up Area Detection. Remote Sensing. 2016; 8(2):155. https://0-doi-org.brum.beds.ac.uk/10.3390/rs8020155
Chicago/Turabian StyleHu, Zhongwen, Qingquan Li, Qian Zhang, and Guofeng Wu. 2016. "Representation of Block-Based Image Features in a Multi-Scale Framework for Built-Up Area Detection" Remote Sensing 8, no. 2: 155. https://0-doi-org.brum.beds.ac.uk/10.3390/rs8020155