
Monitoring and Assessing the 2012 Drought in the Great Plains: Analyzing Satellite-Retrieved Solar-Induced Chlorophyll Fluorescence, Drought Indices, and Gross Primary Production


Abstract
:
1. Introduction
2. Data
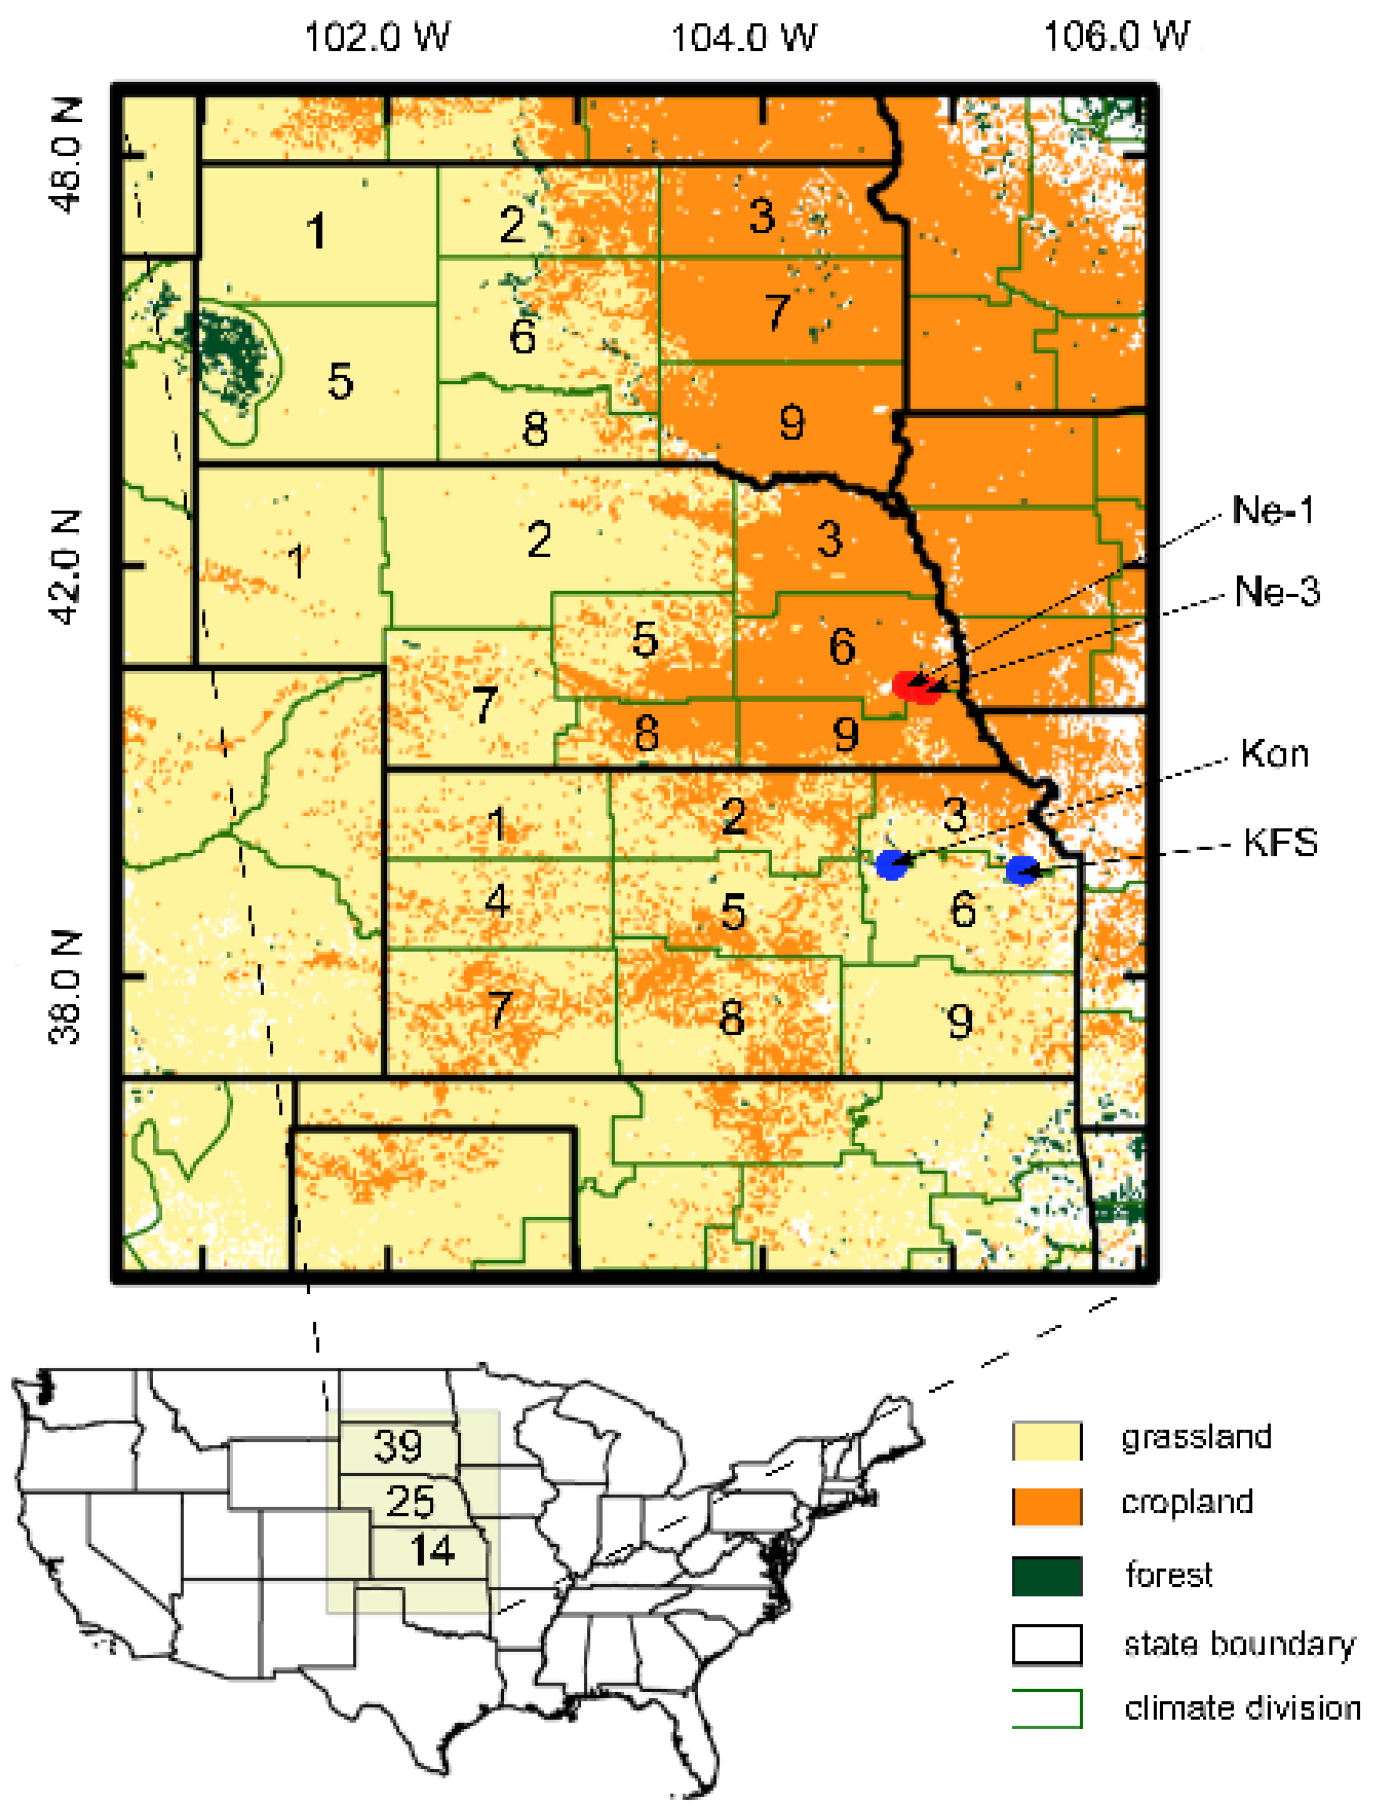
2.1. Study Area
2.2. Drought Indices

2.3. GOME-2 SIF and MODIS VIs
2.4. Flux Tower GPP

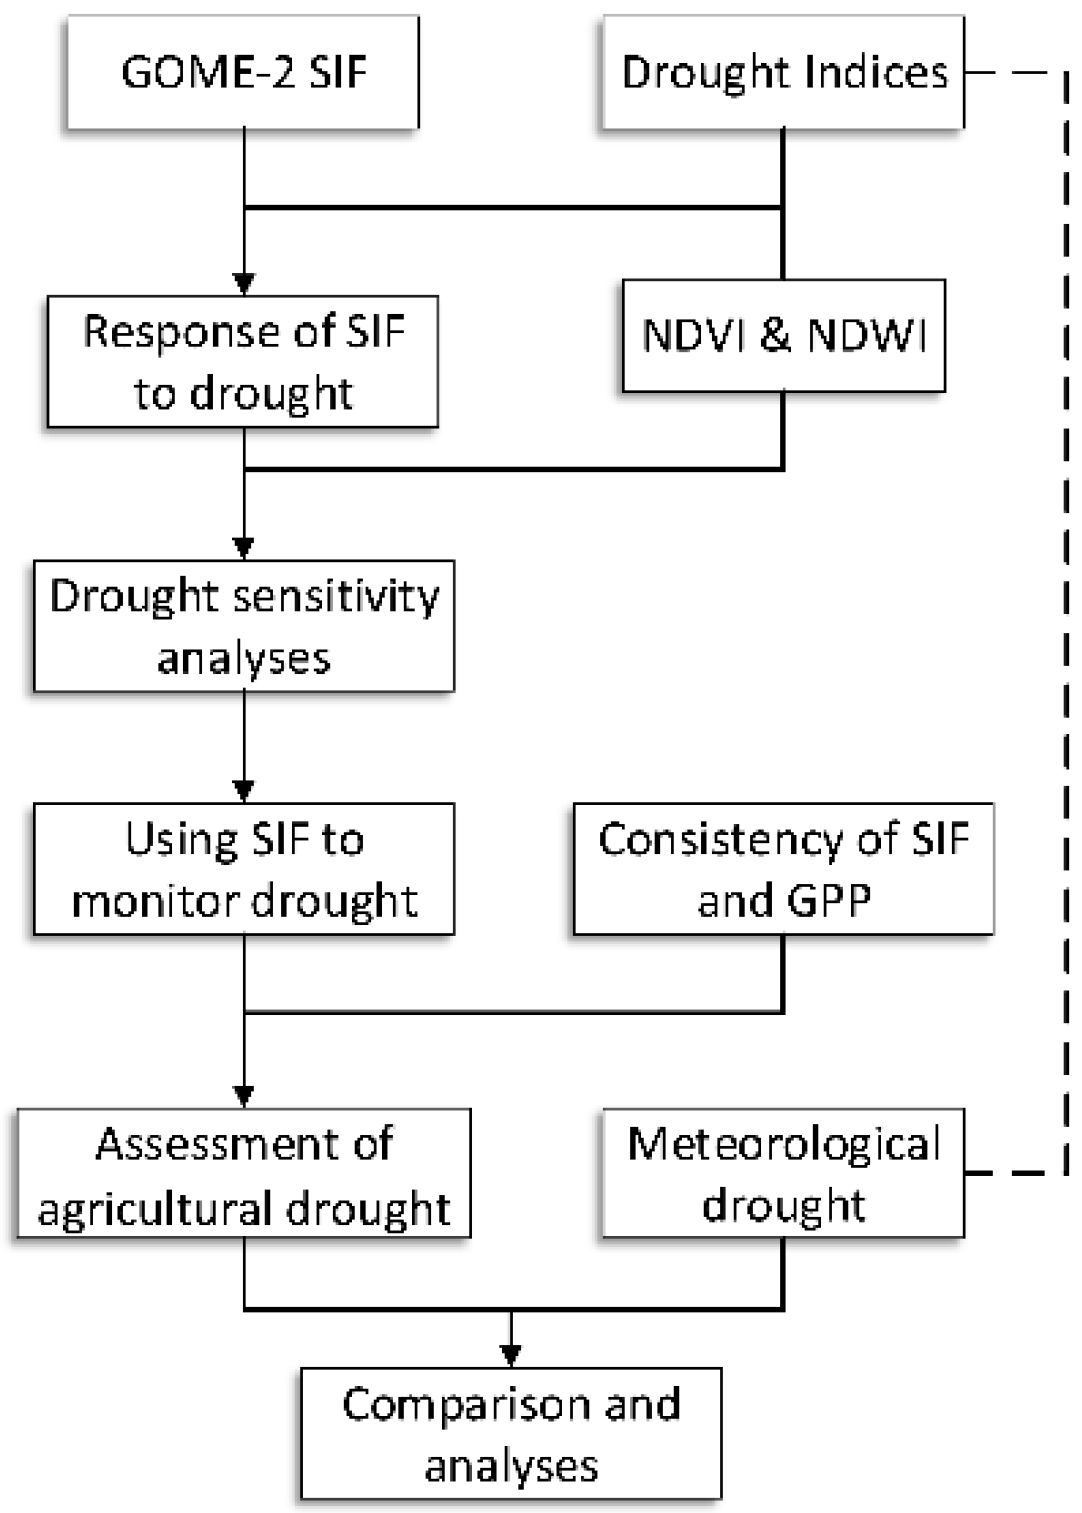
3. Methodology

4. Results
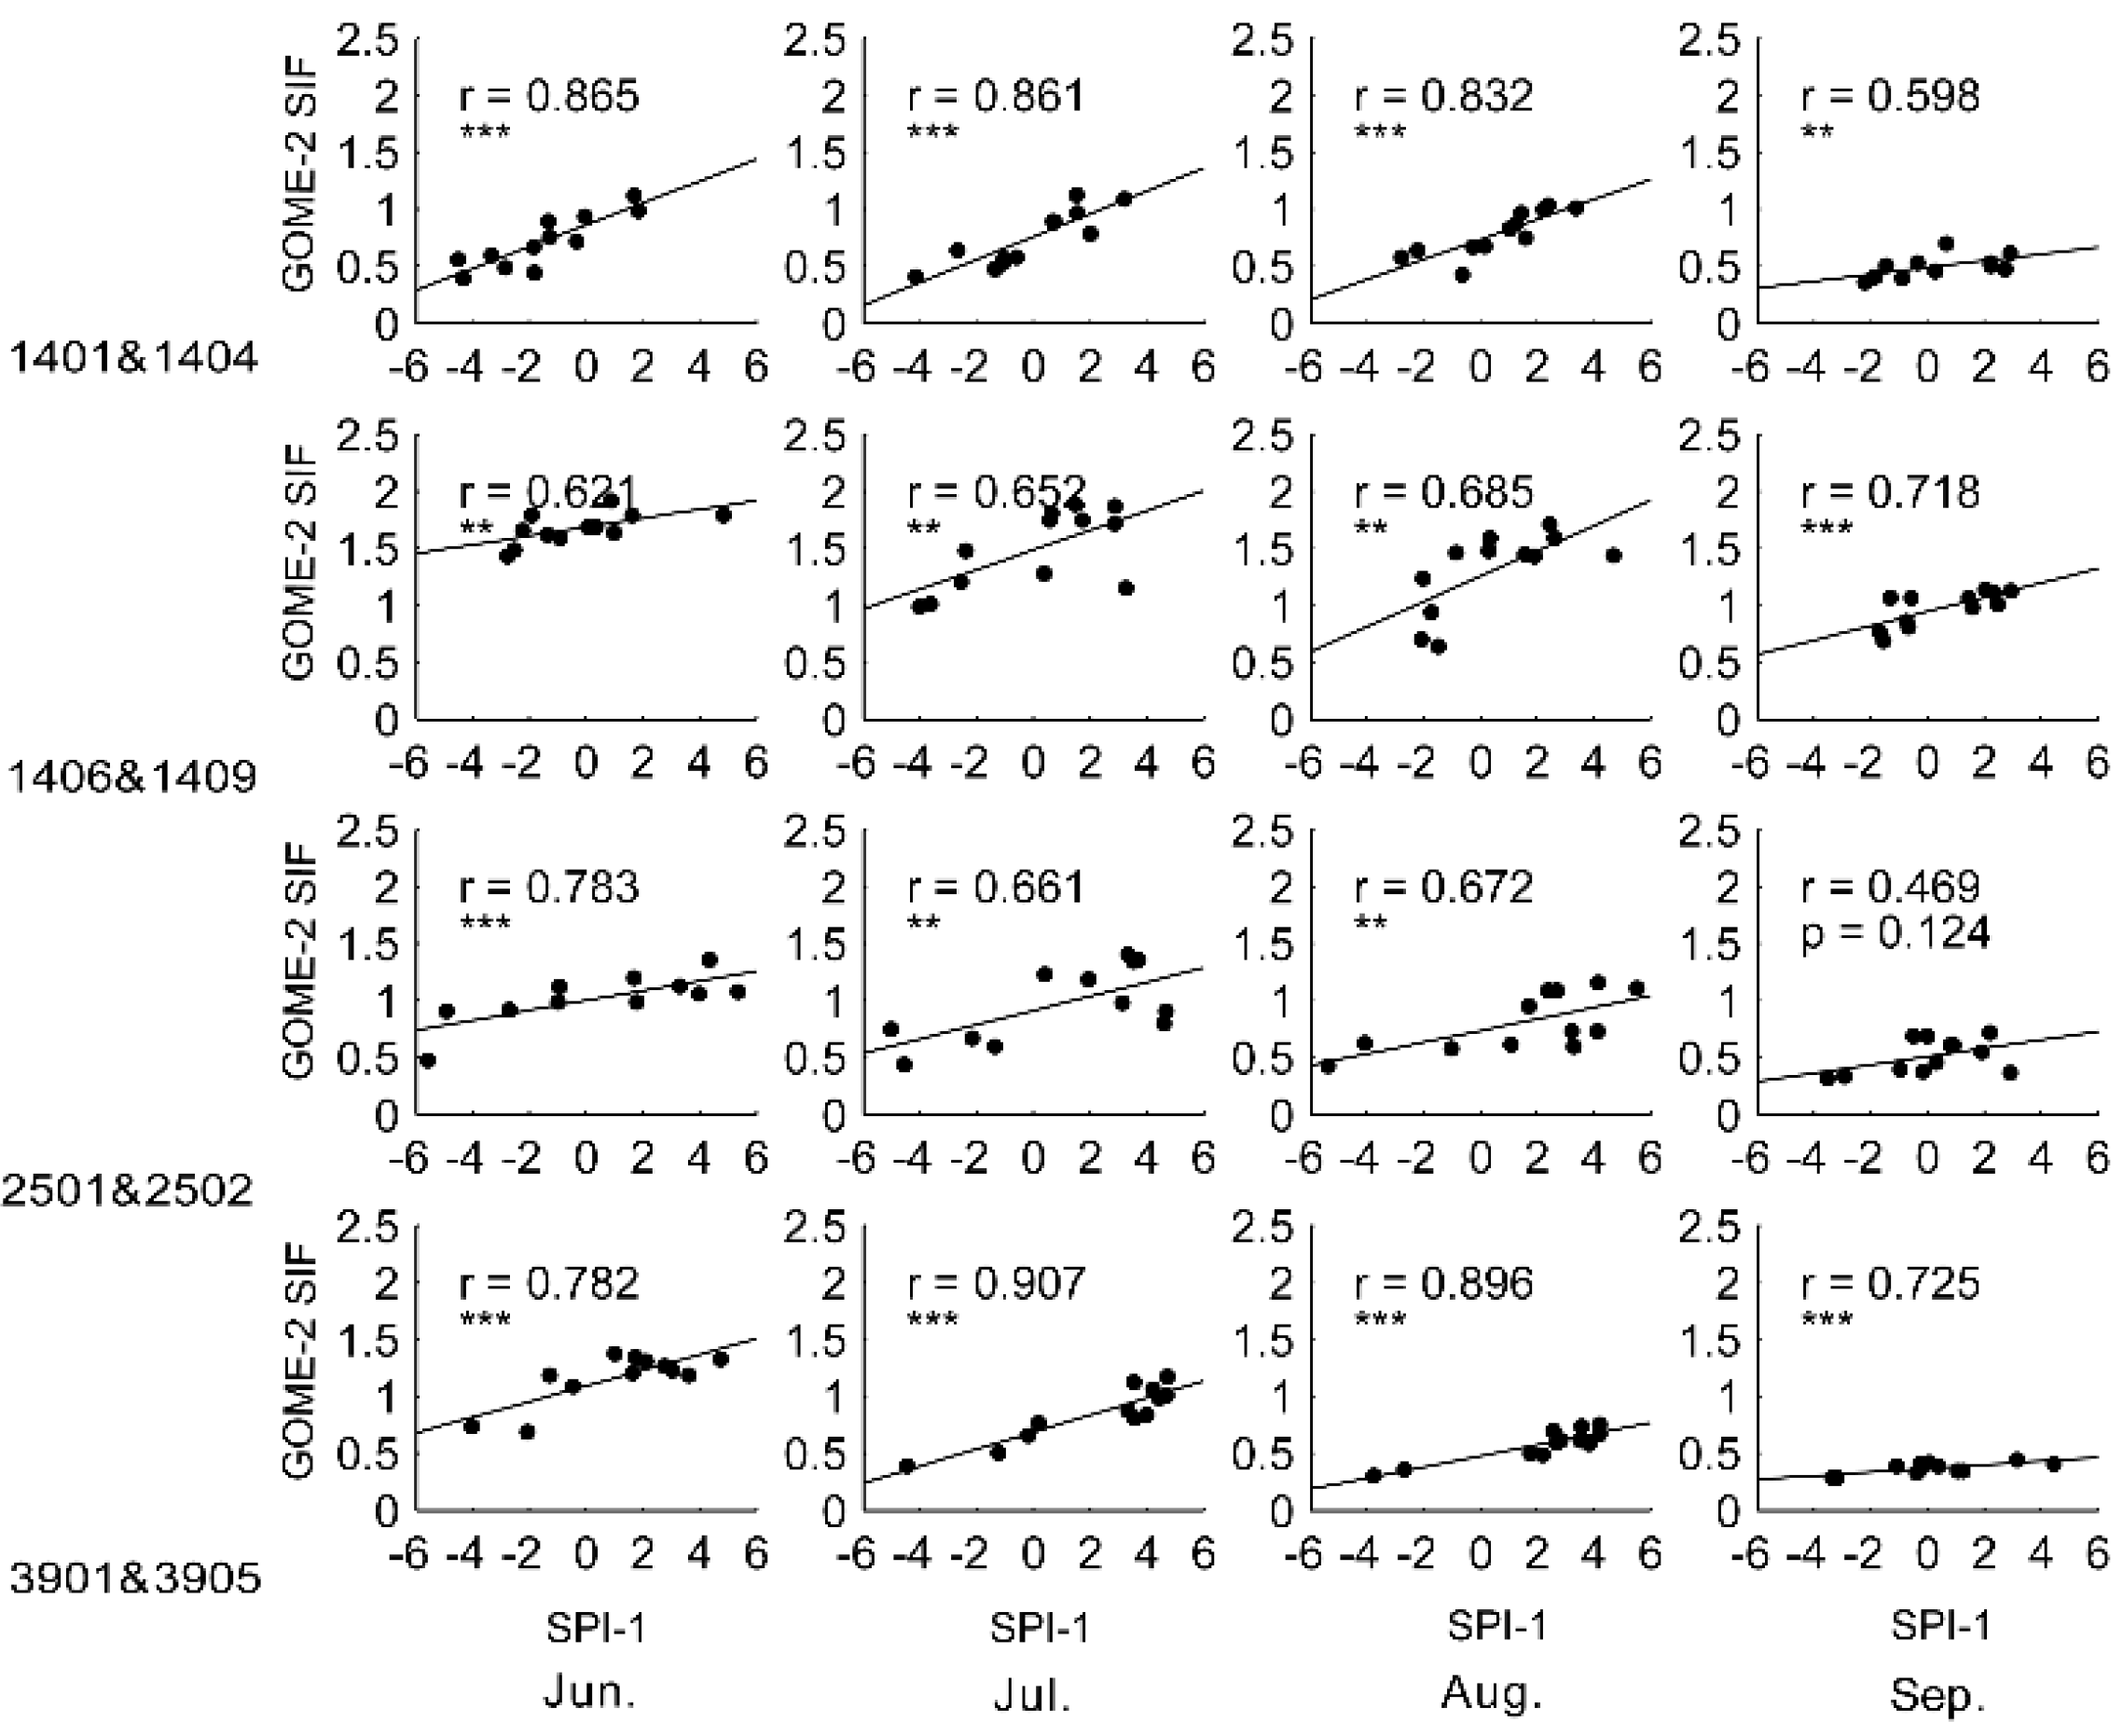
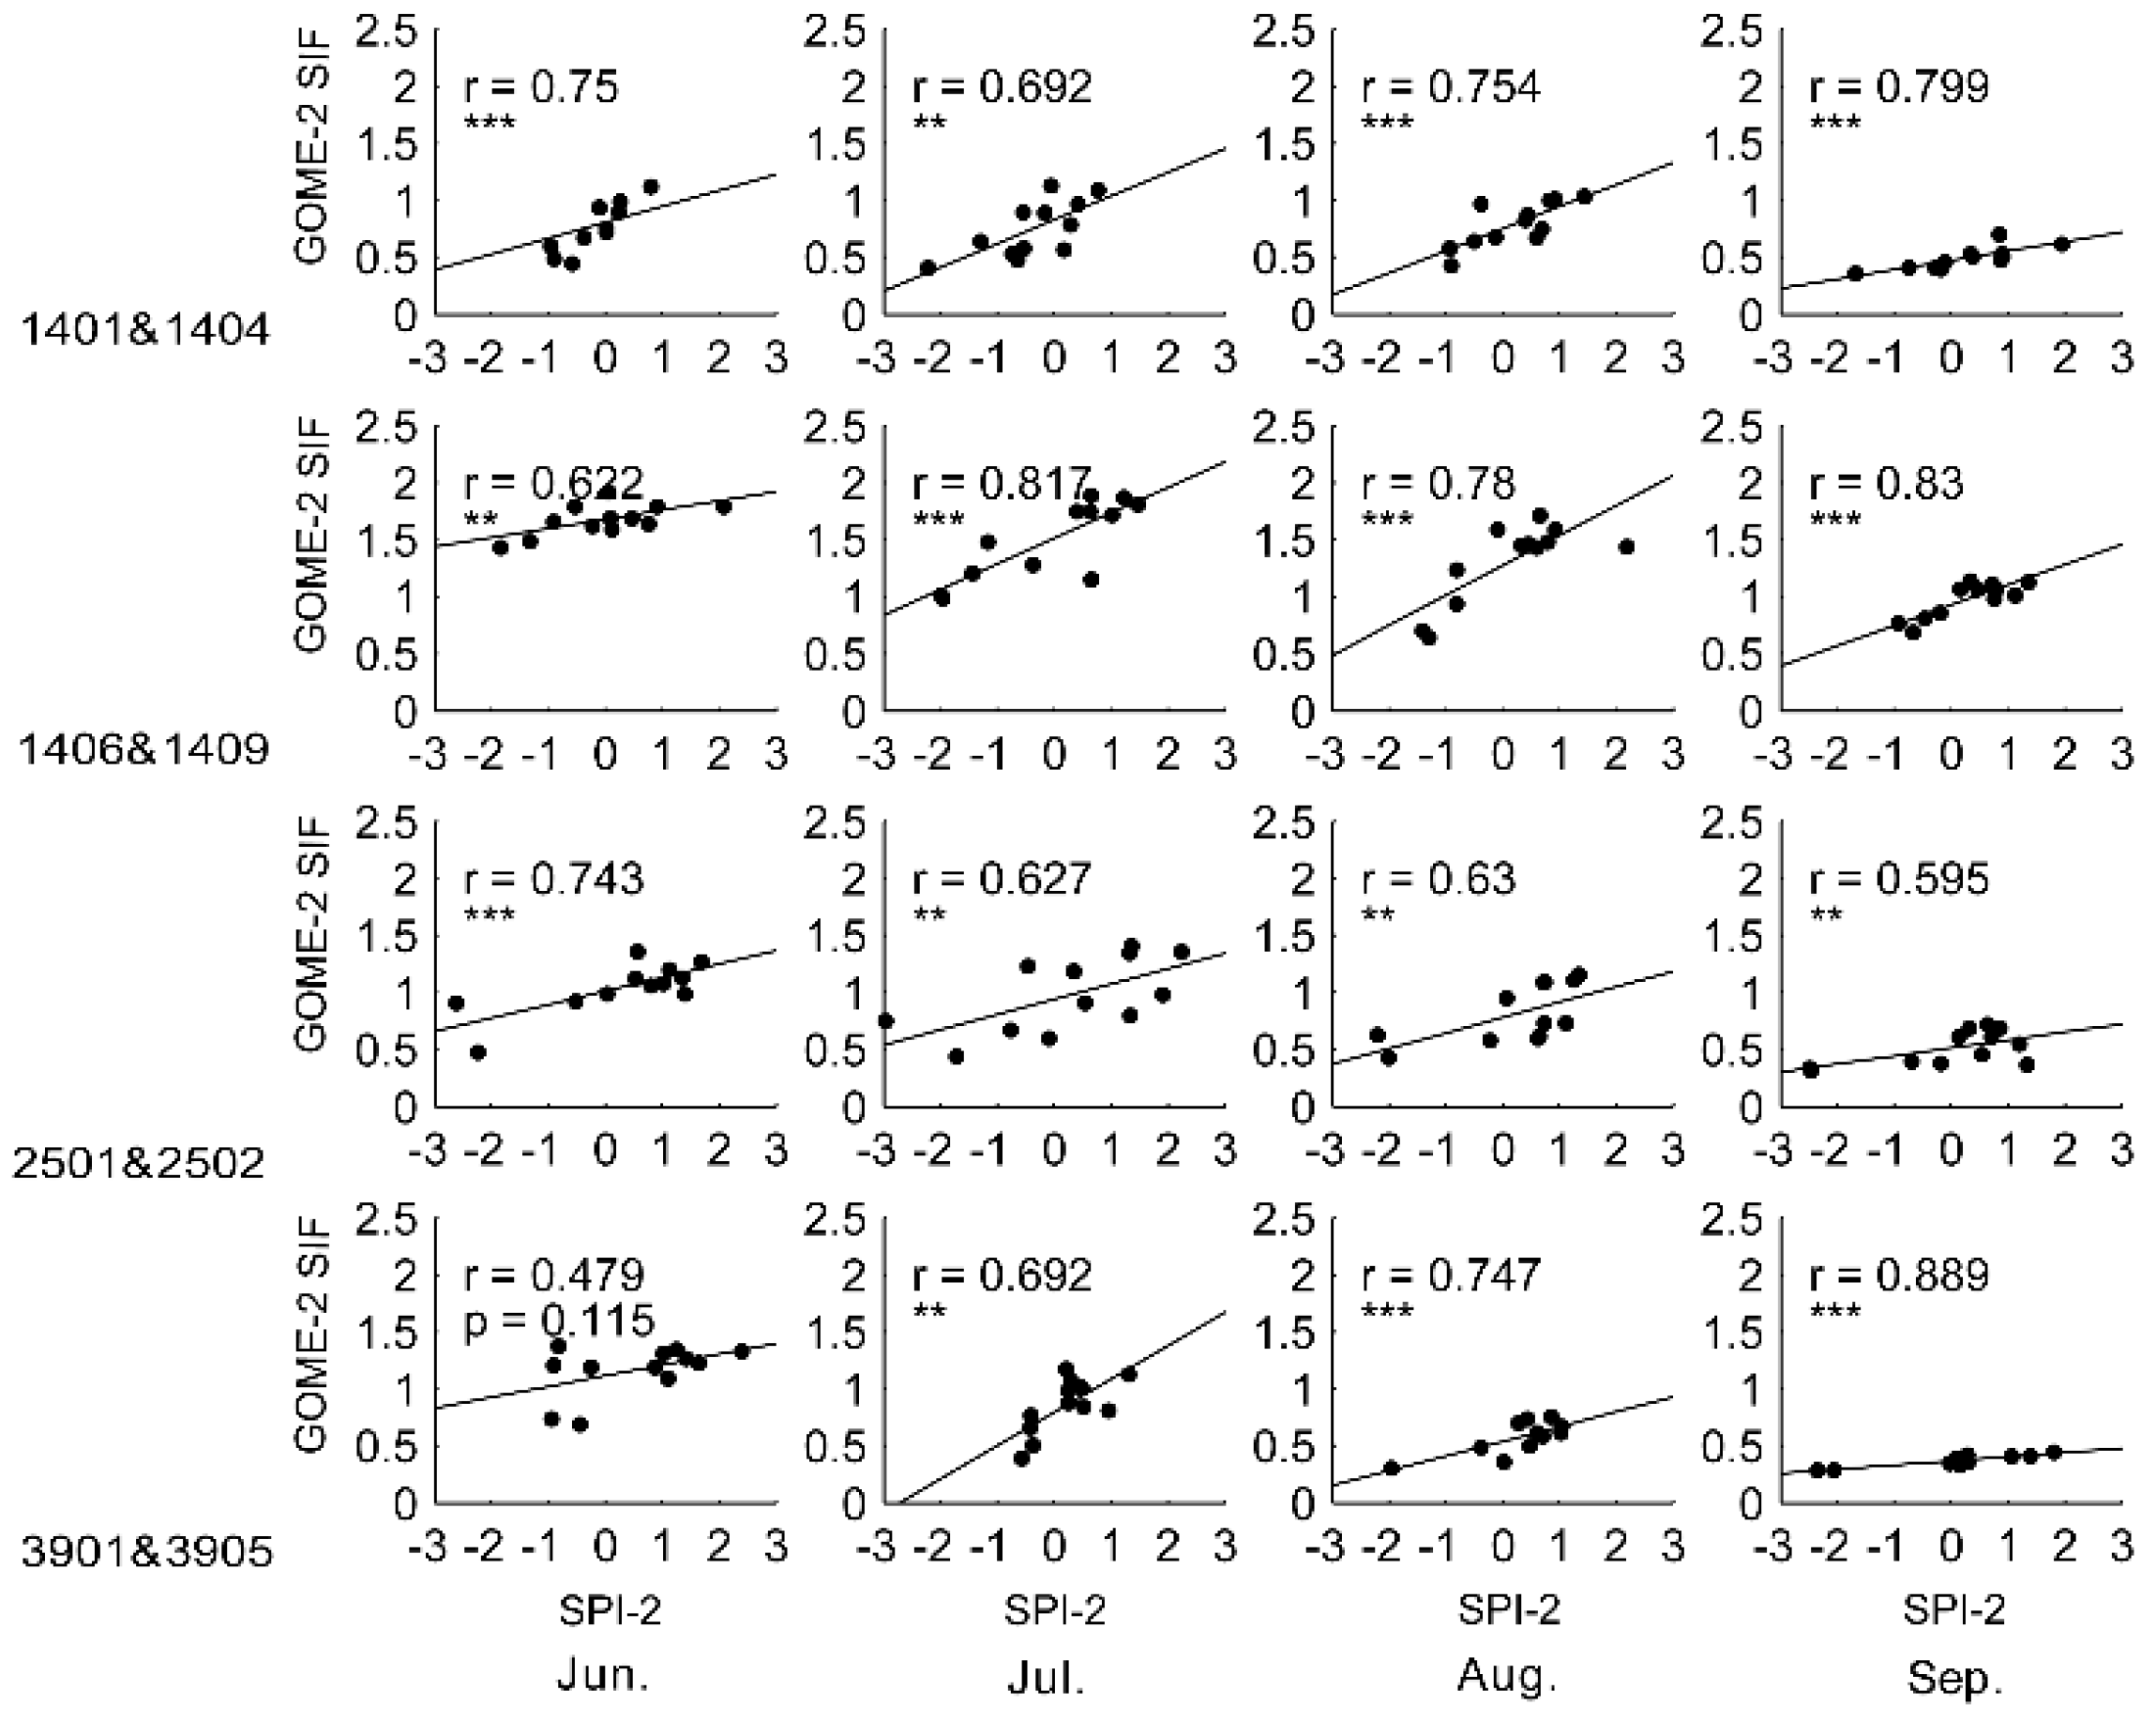
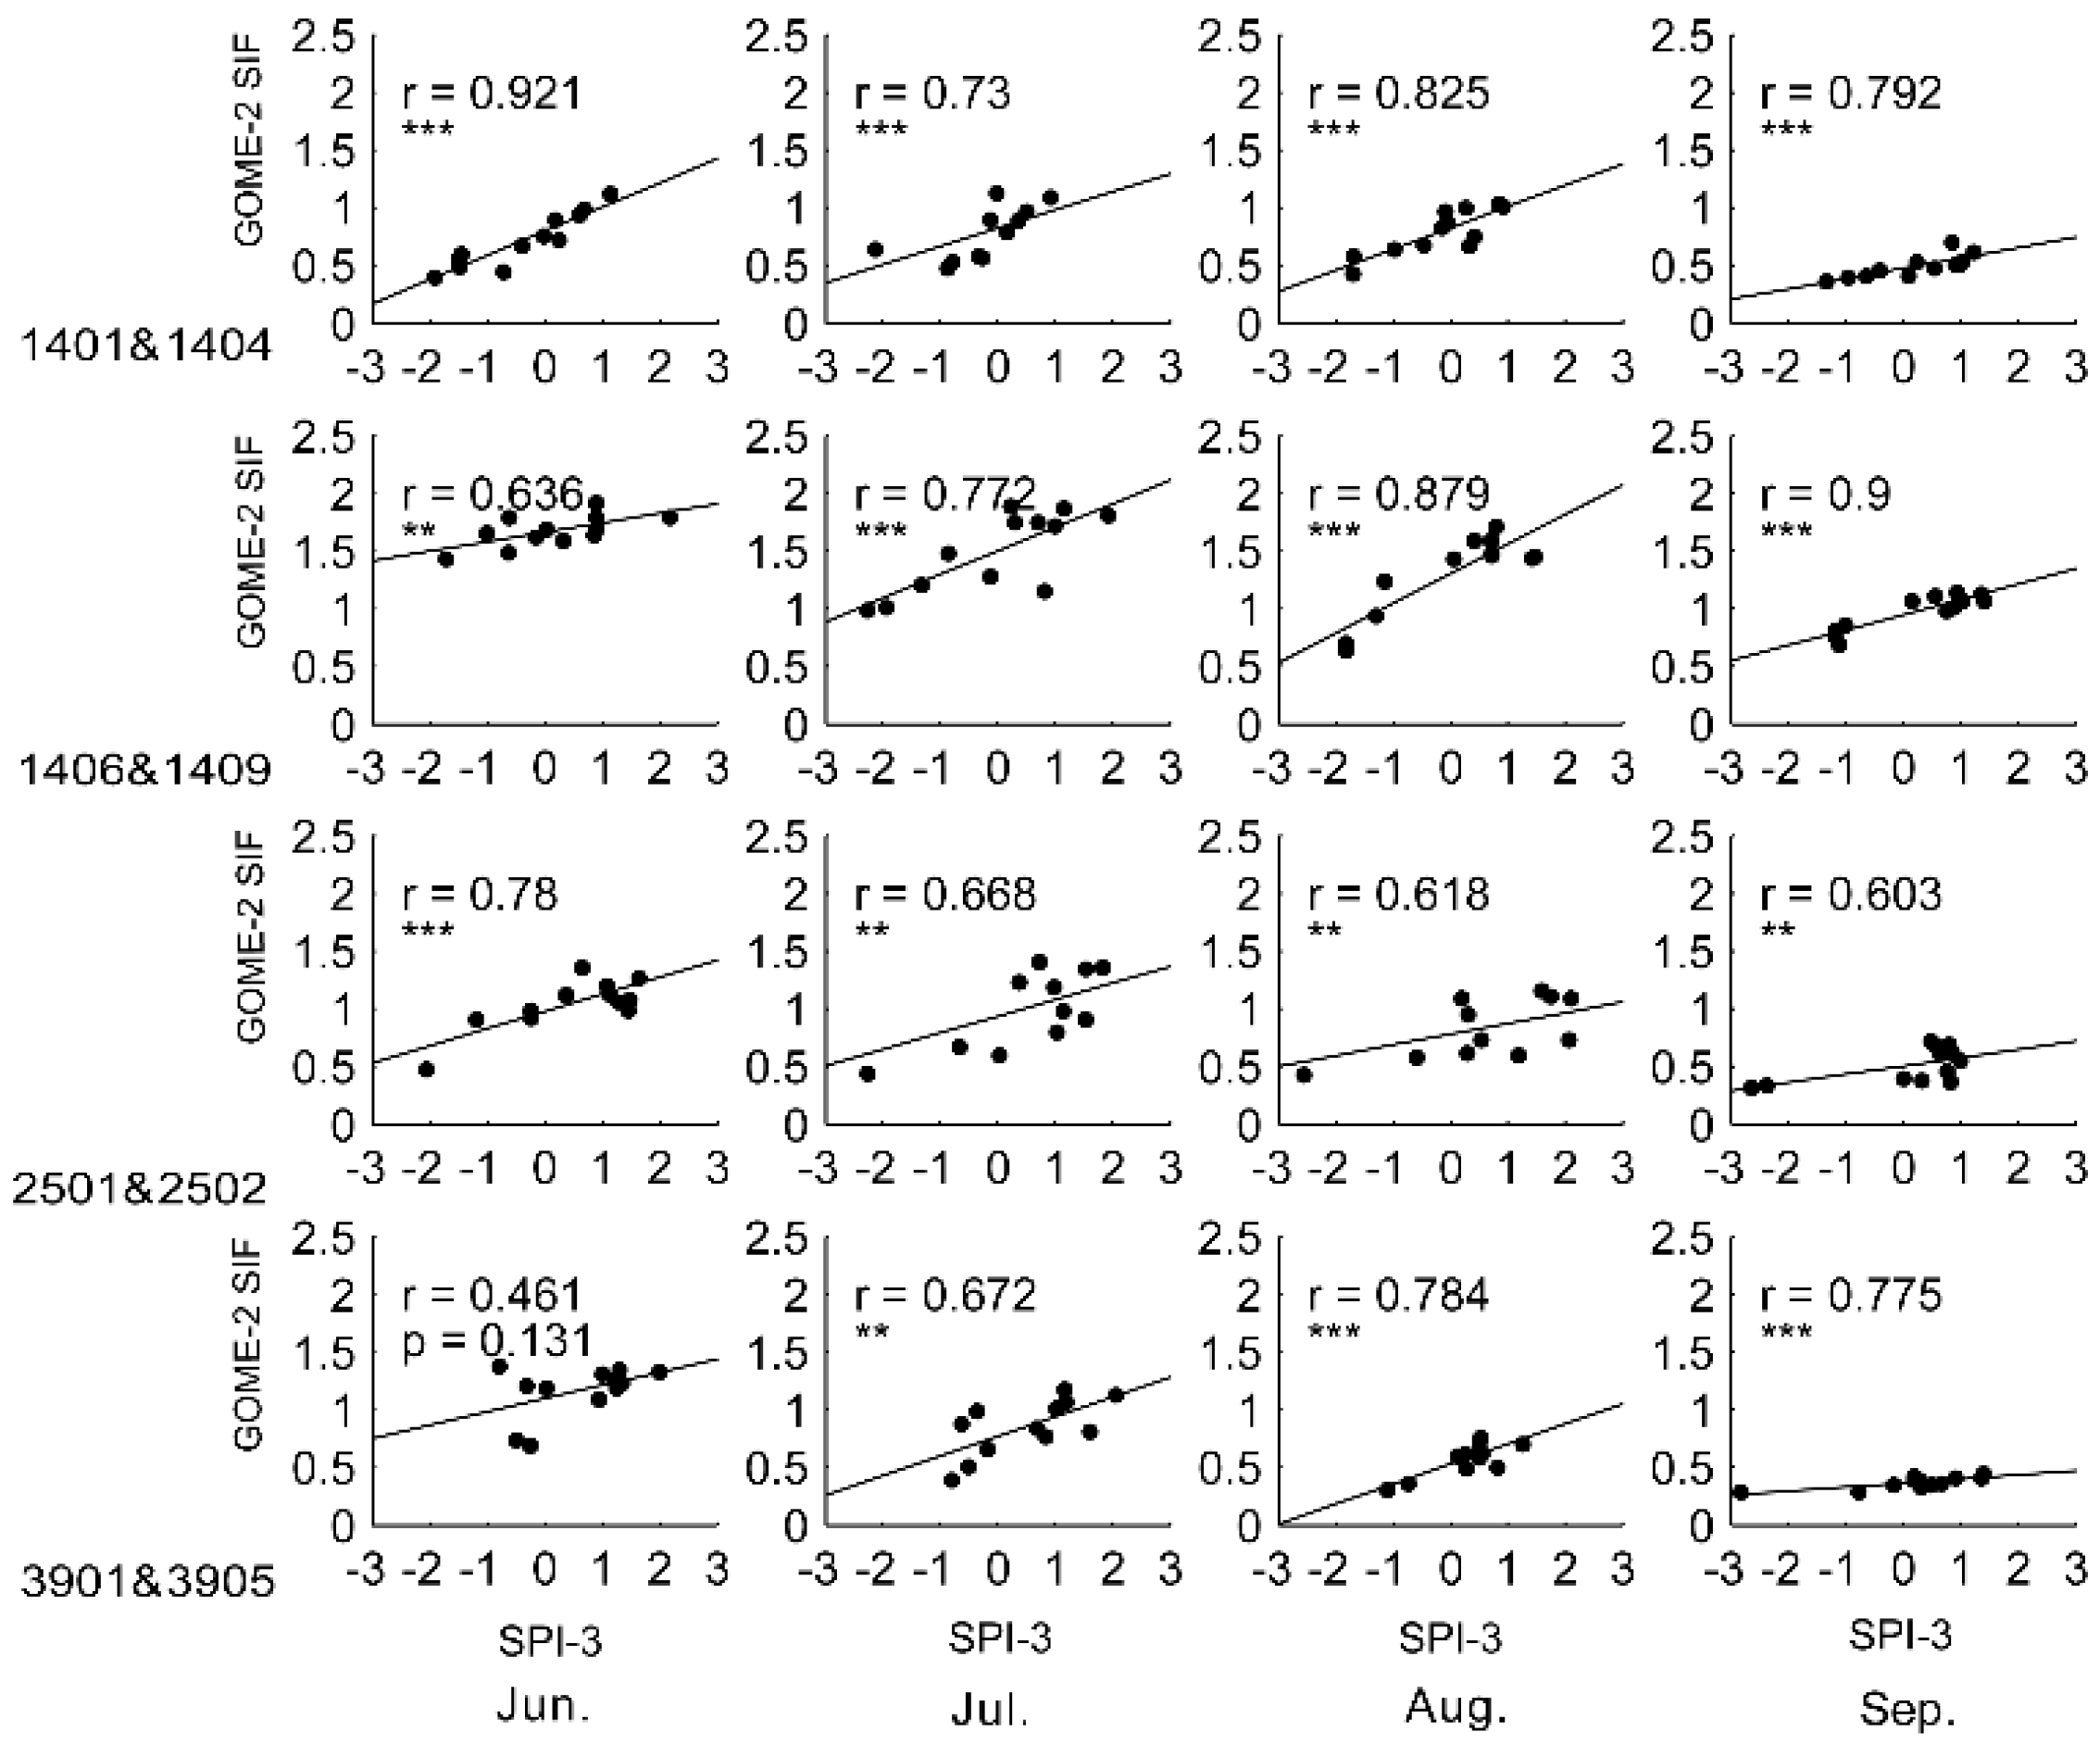
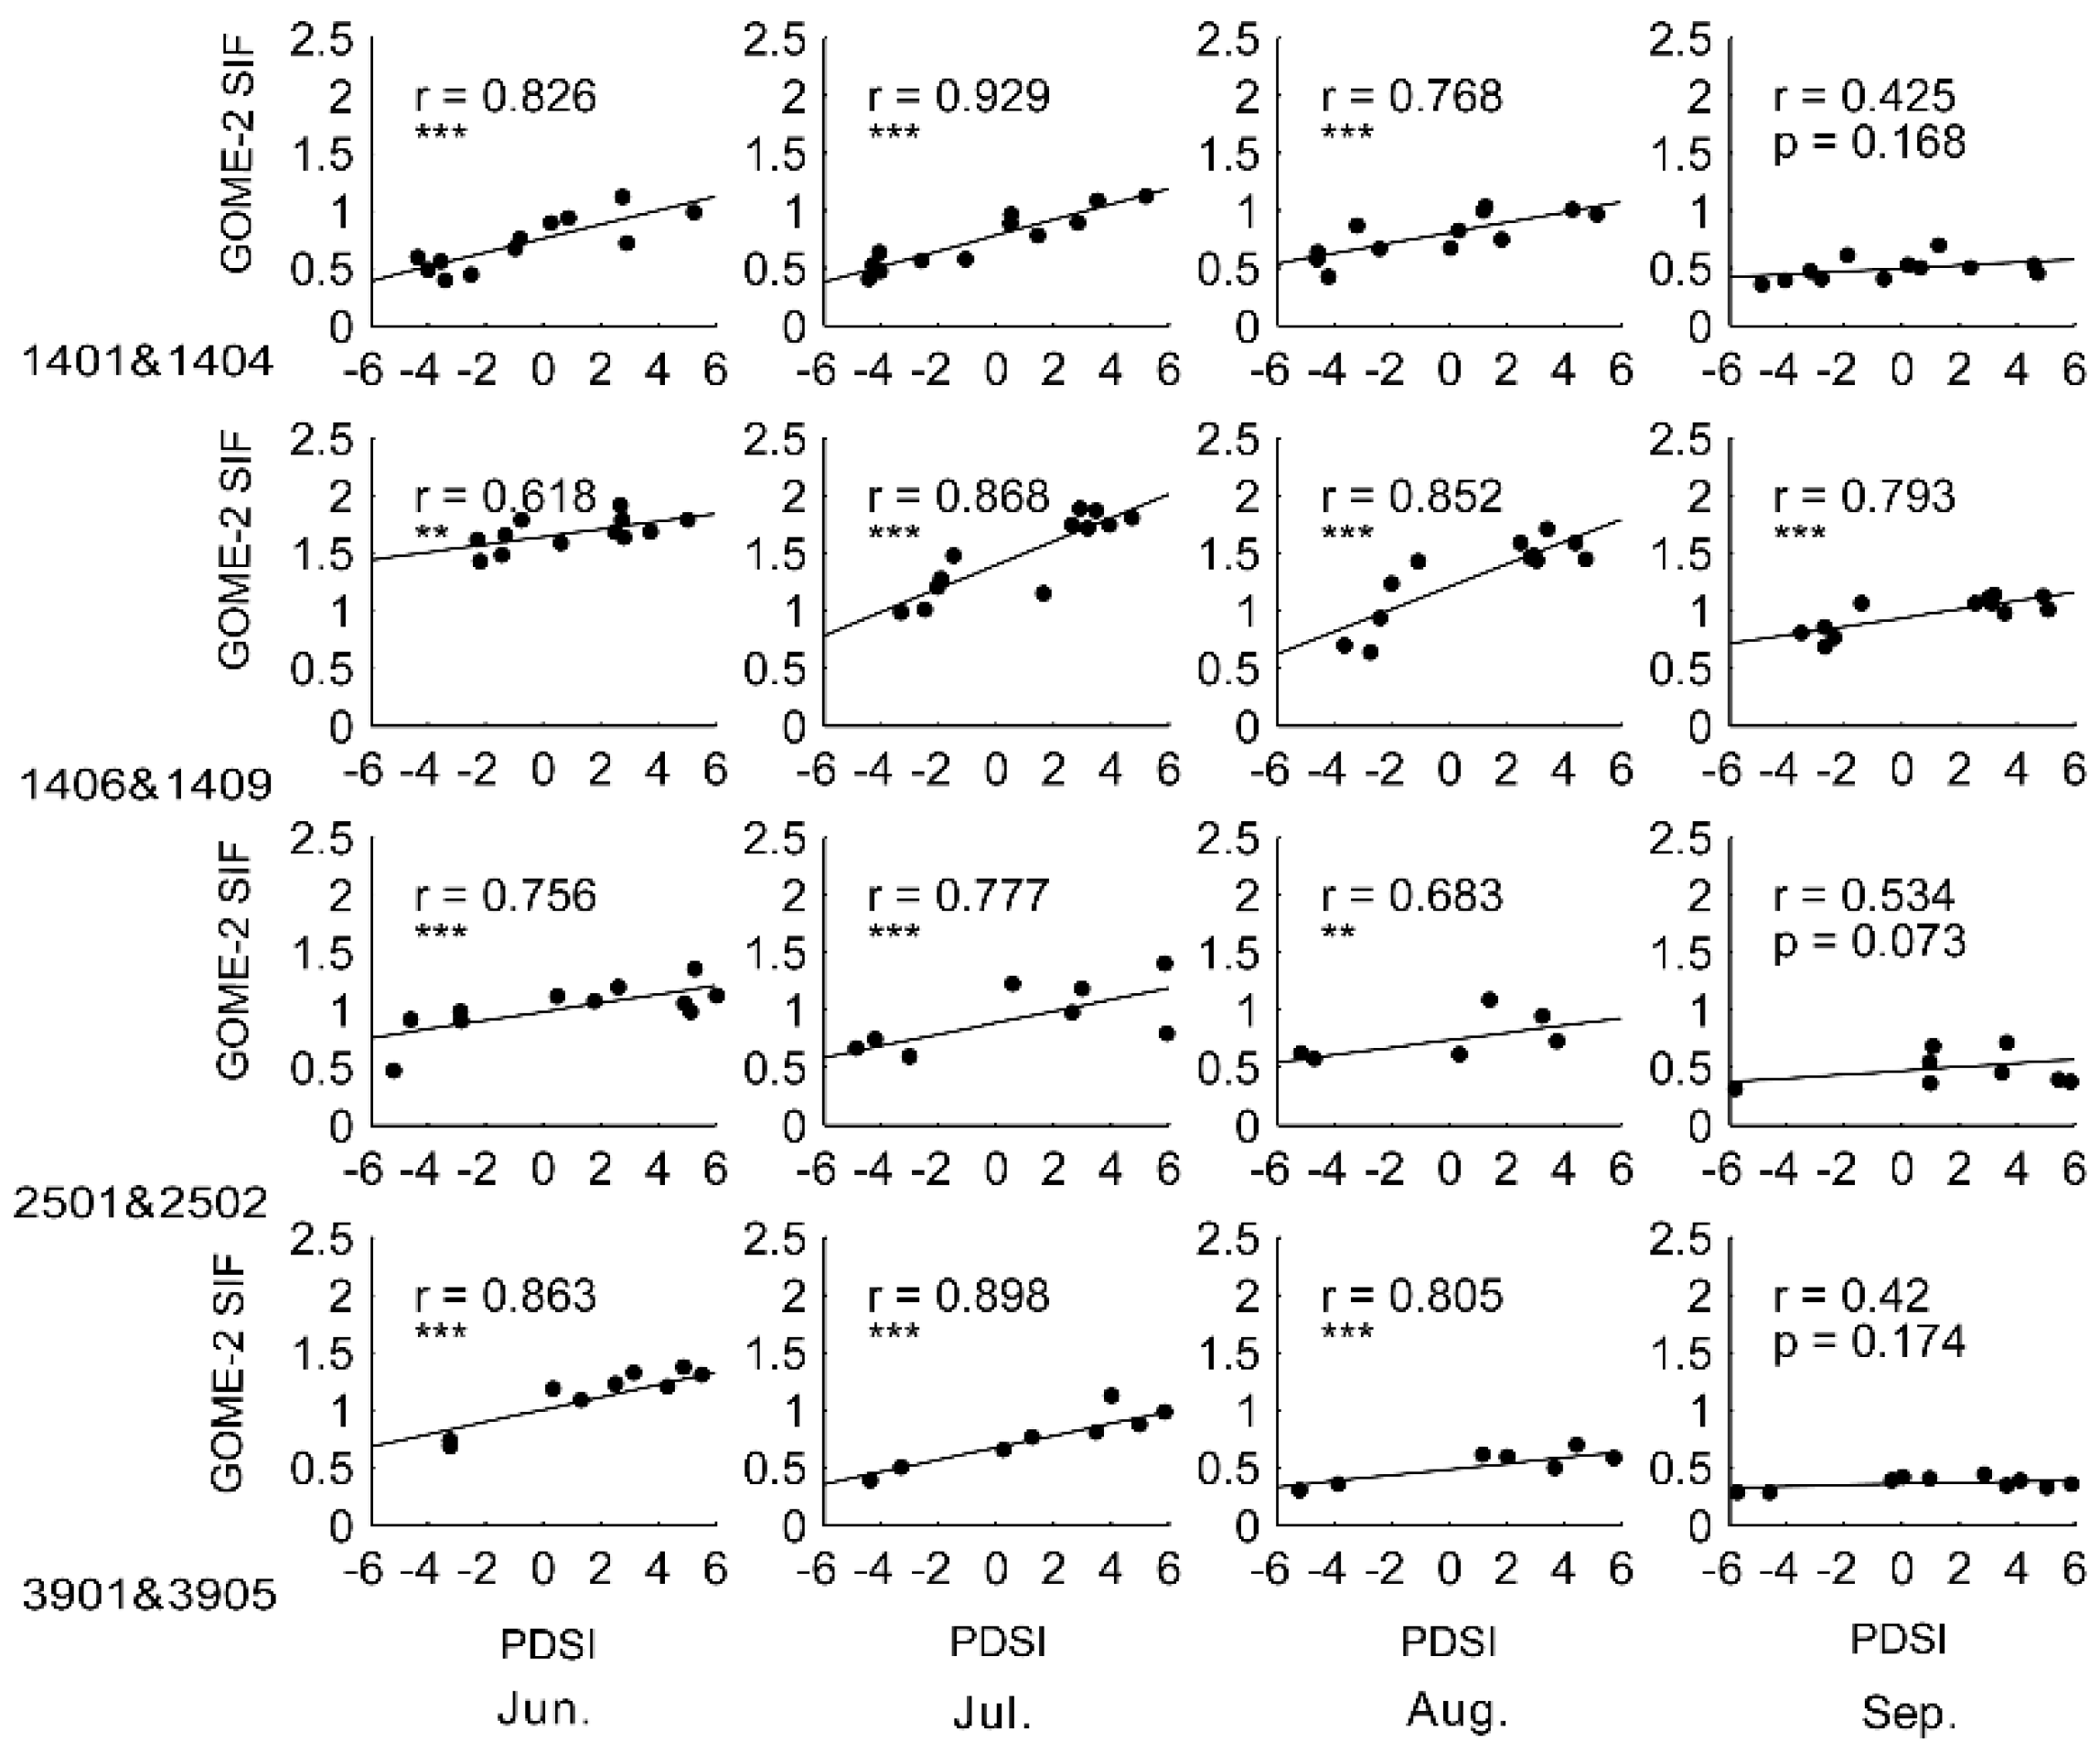
4.1. Response of SIF to Drought


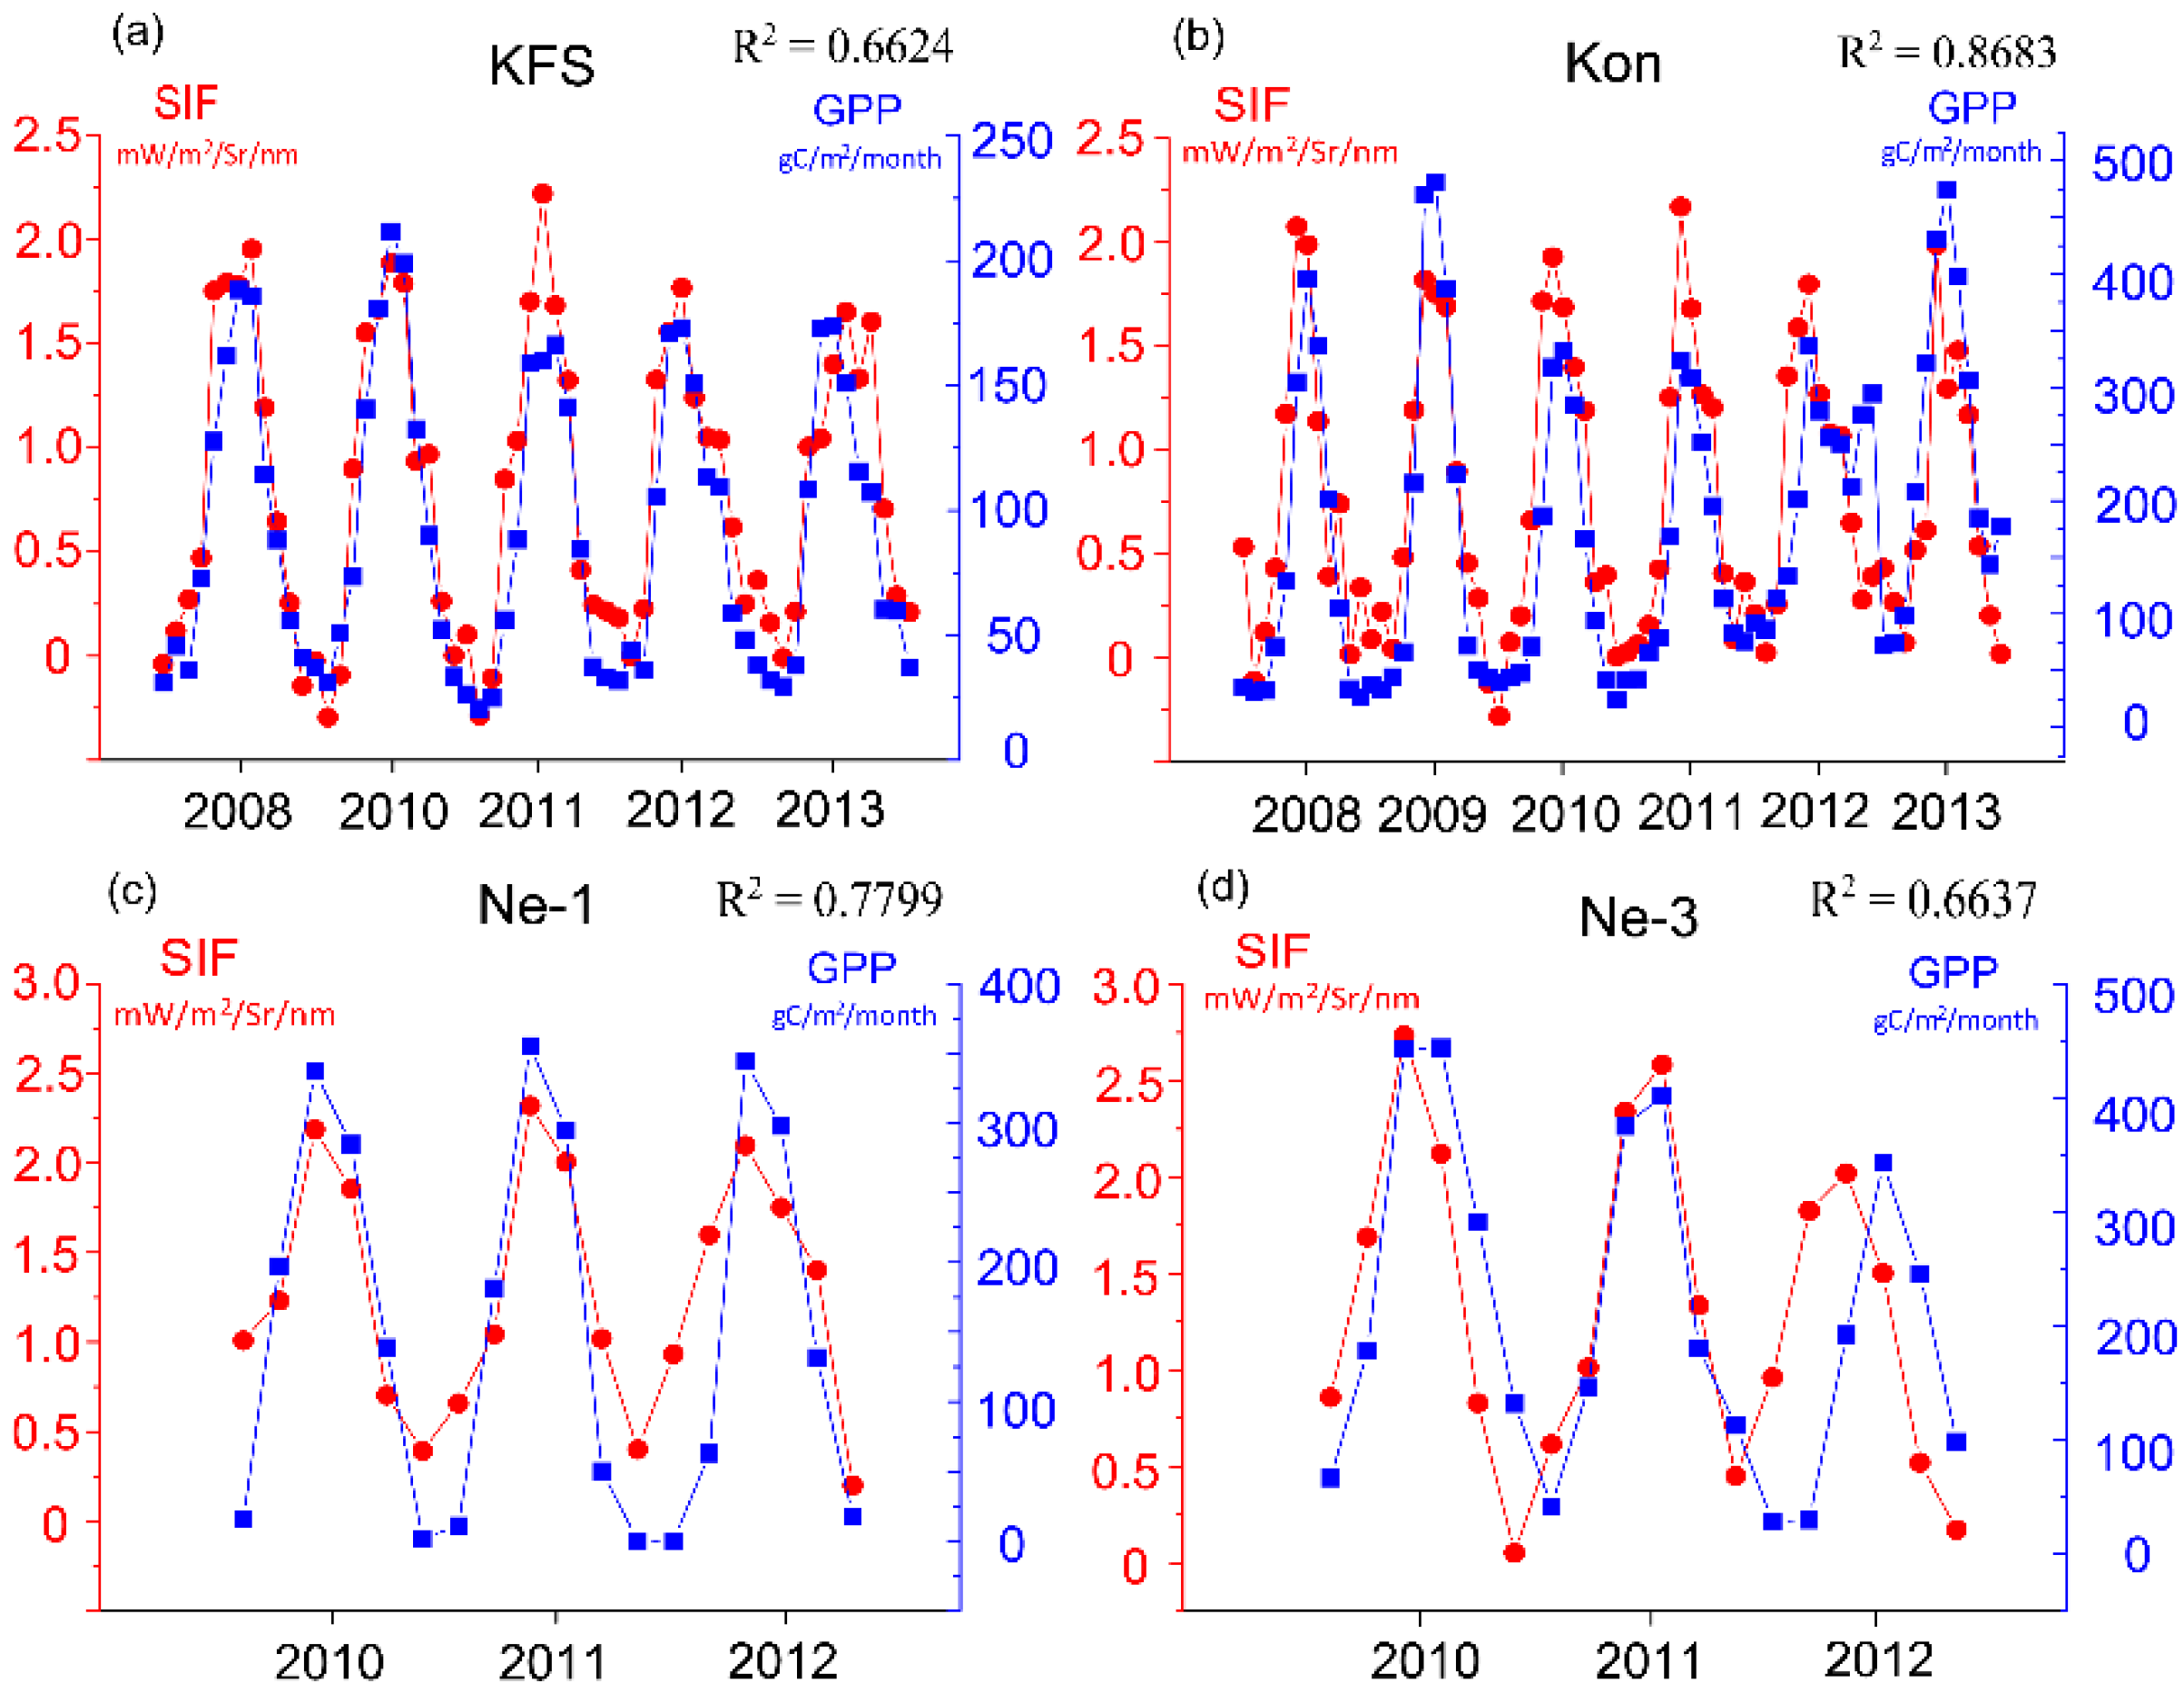
4.2. Consistency of SIF and GPP

| Site Name | Percentage Decline Compared to 2010 | |||
|---|---|---|---|---|
| SIF (July) | GPP (July) | SIF (August) | GPP (August) | |
| KFS | 29 | 34 | 43 | 41 |
| Kon | 25 | 23 | 16 | 10 |
| Ne-3 | 26 | 57 | 29 | 23 |
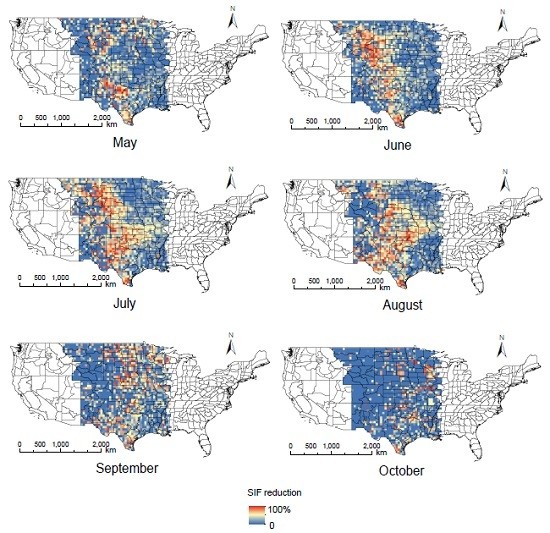
4.3. Monitoring and Assessing the 2012 Drought


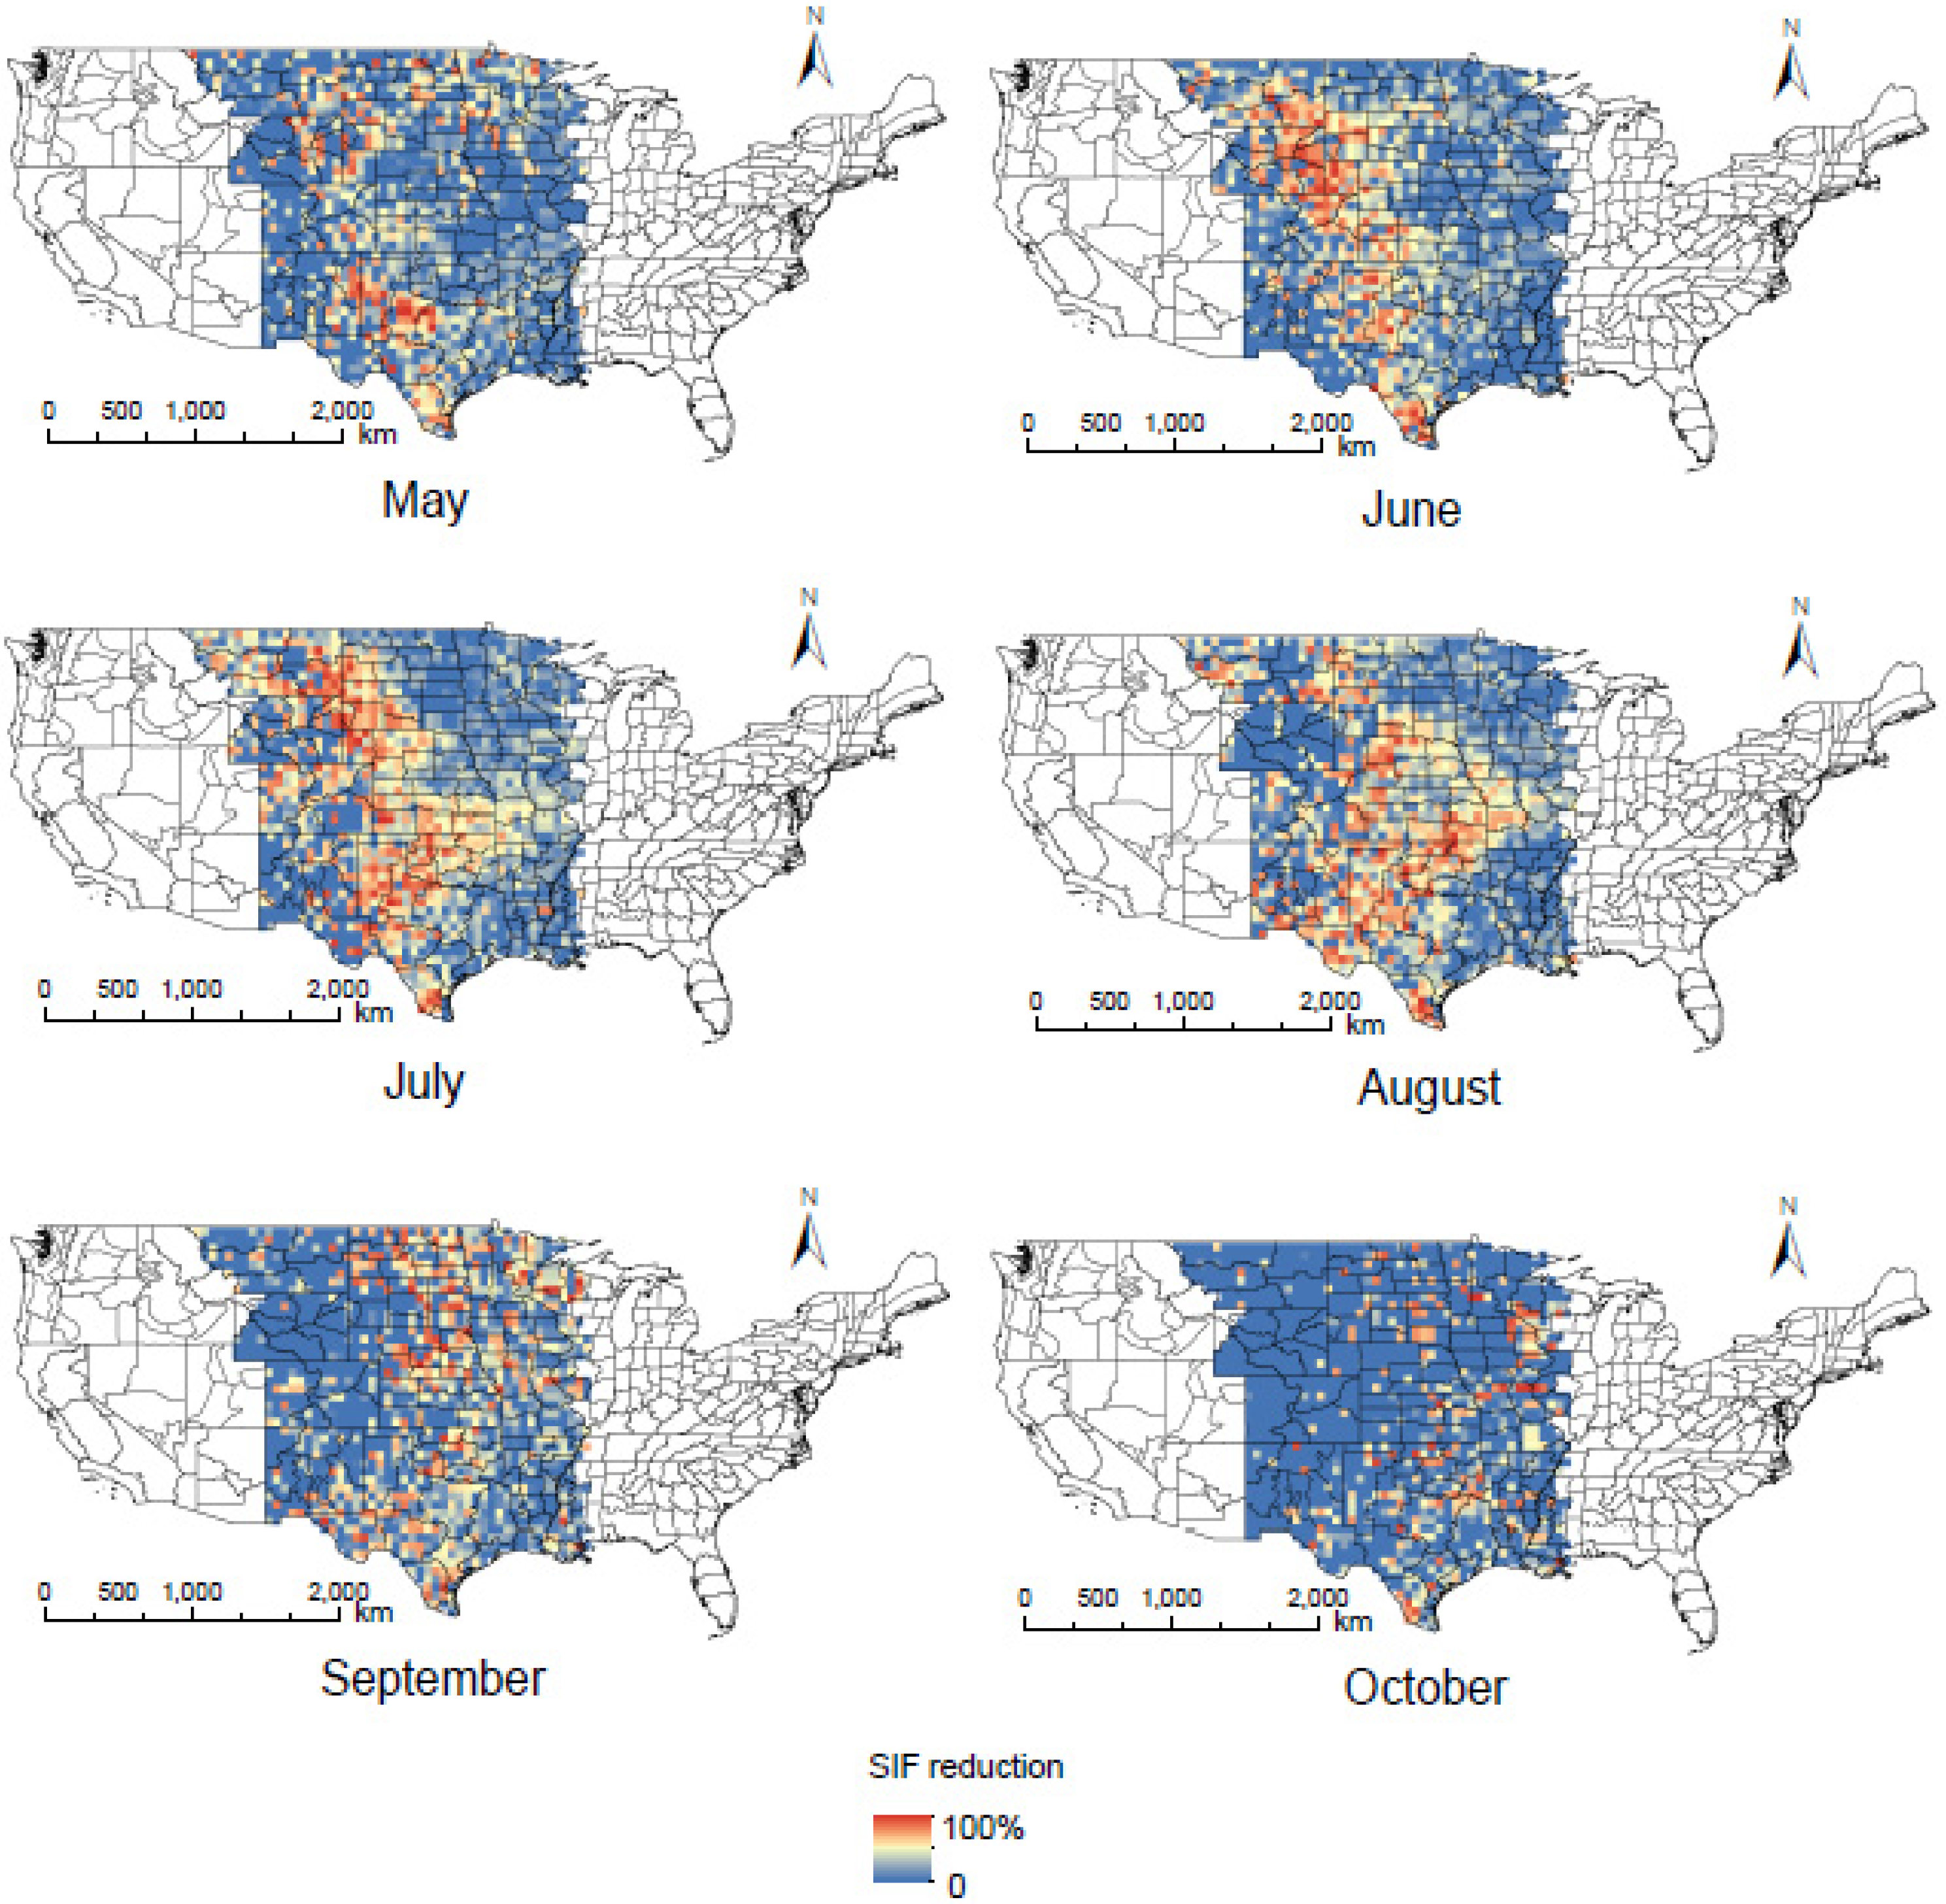
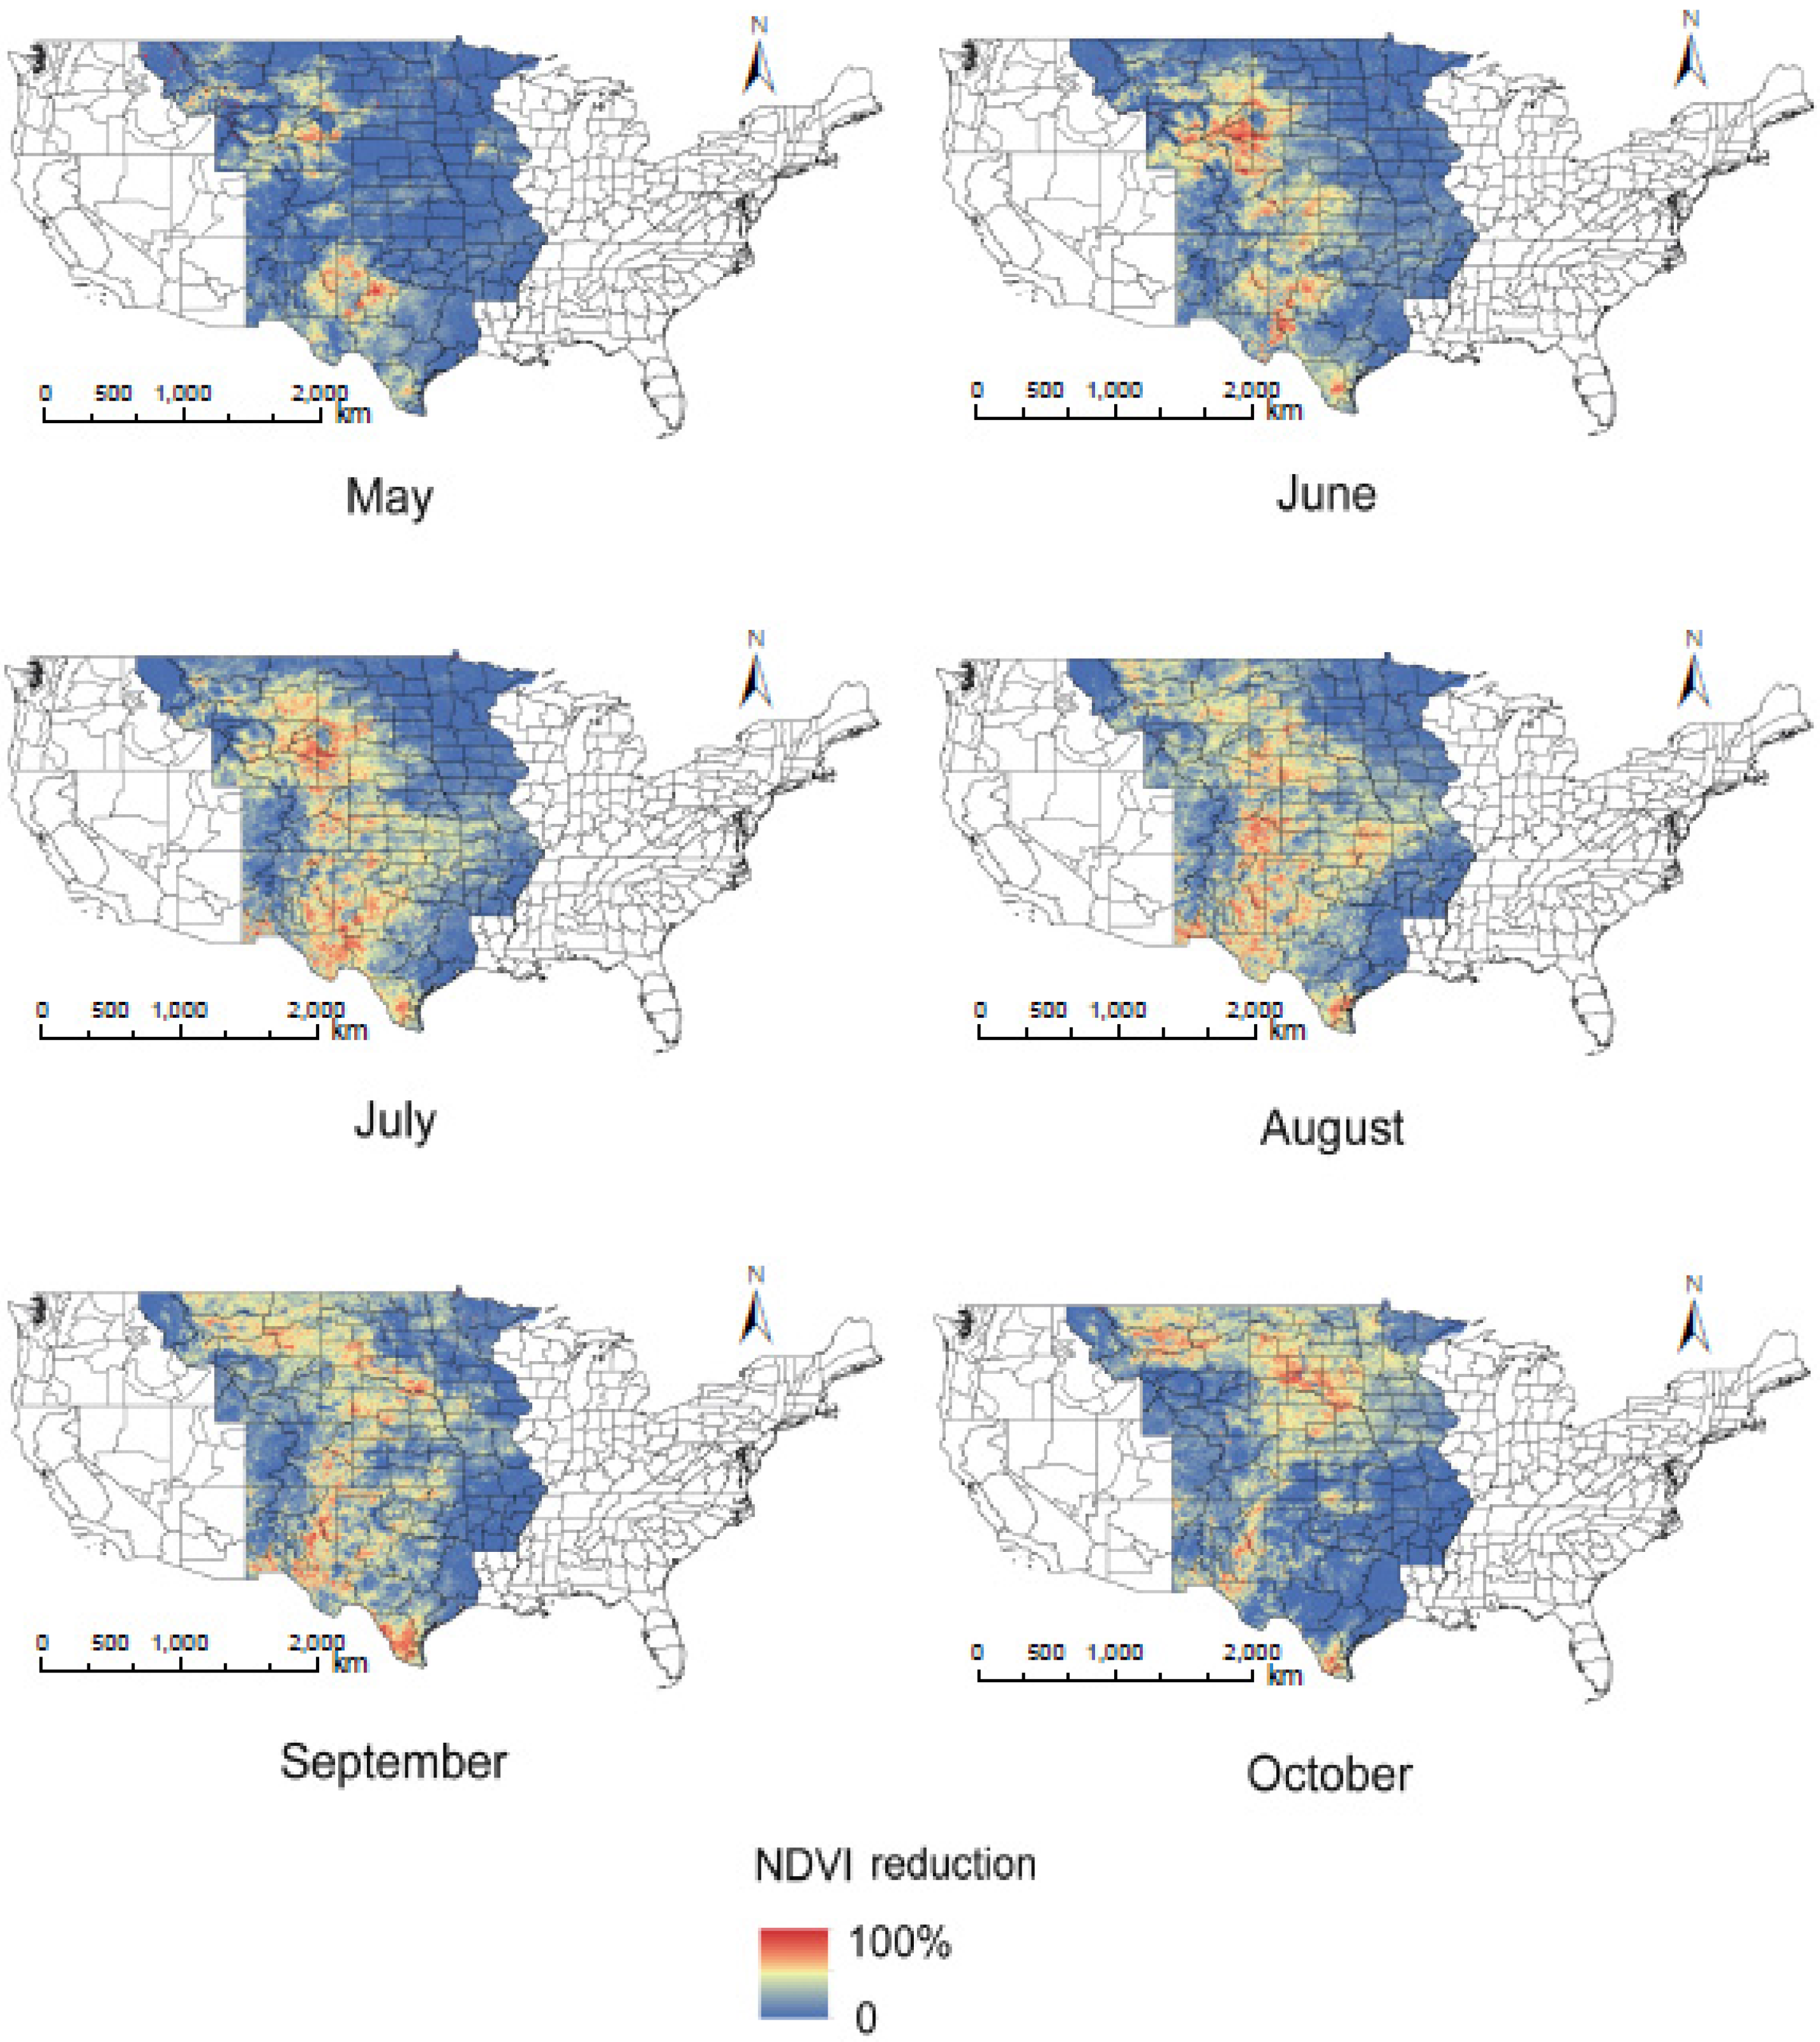
- First, Figure 10 is redder than Figure 11, which indicates that SIF declined more significantly during the drought. The saturation effect of the NDVI has been widely discussed (e.g., [46,47]), while SIF and APAR are reported to be better indicators for vegetation production [23]. Asner et al. [46]. indicated that an NDVI-driven NPP model failed to capture differences in vegetation production caused by drought stress at the beginning and end of the dry season because of the NDVI saturation effect. The results in Figure 10 and Figure 11 suggest that SIF might be more appropriate than NDVI to precisely indicate the agricultural drought level.
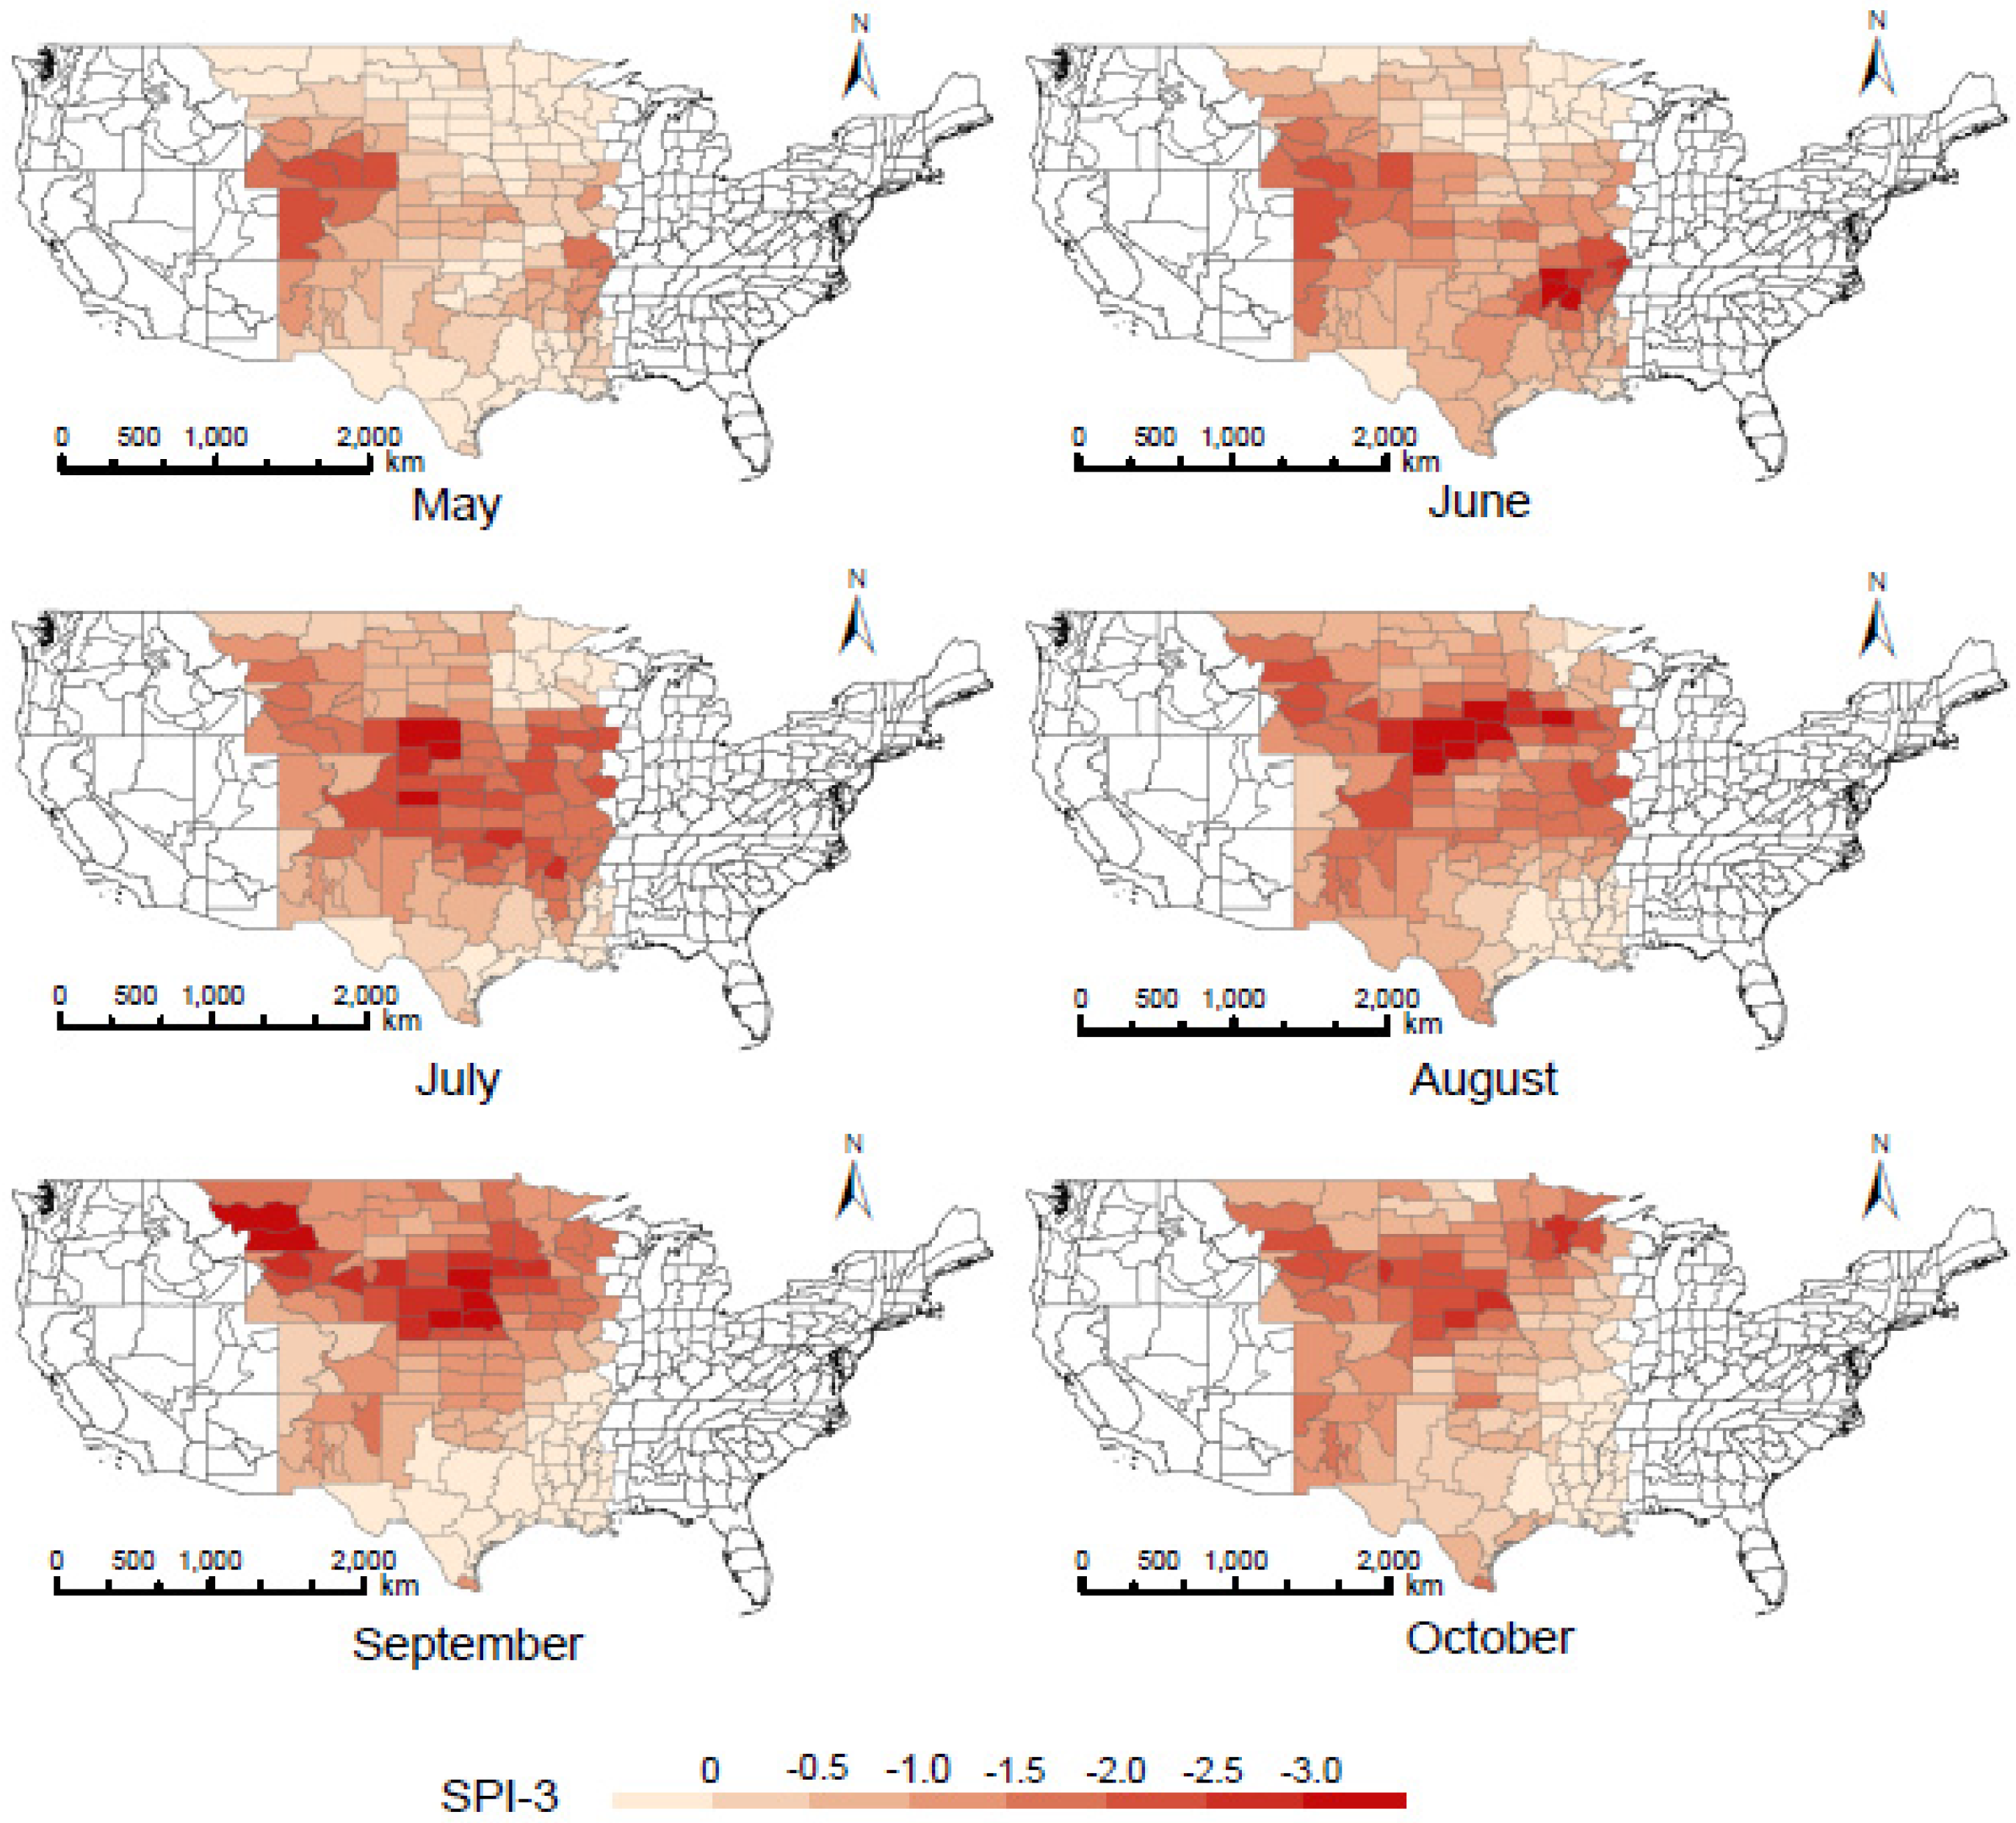
- Second, the spatiotemporal reduction map for the NDVI was more similar to SPI-3, especially in September and October. Ji and Peters [6] found that the most significant correlation between the NDVI and SPI occurred for the SPI-3, while Figure 3, Figure 4, Figure 5 and Figure 6 in this study show that SIF was more sensitive to shorter-term SPIs. It has been demonstrated that the 2012 drought in the Great Plains eased in September and October. In addition, the recovery of GPP in these two months (Figure 8) also indicates an easing of the agricultural drought, although this is not obvious in Figure 11.

5. Discussions
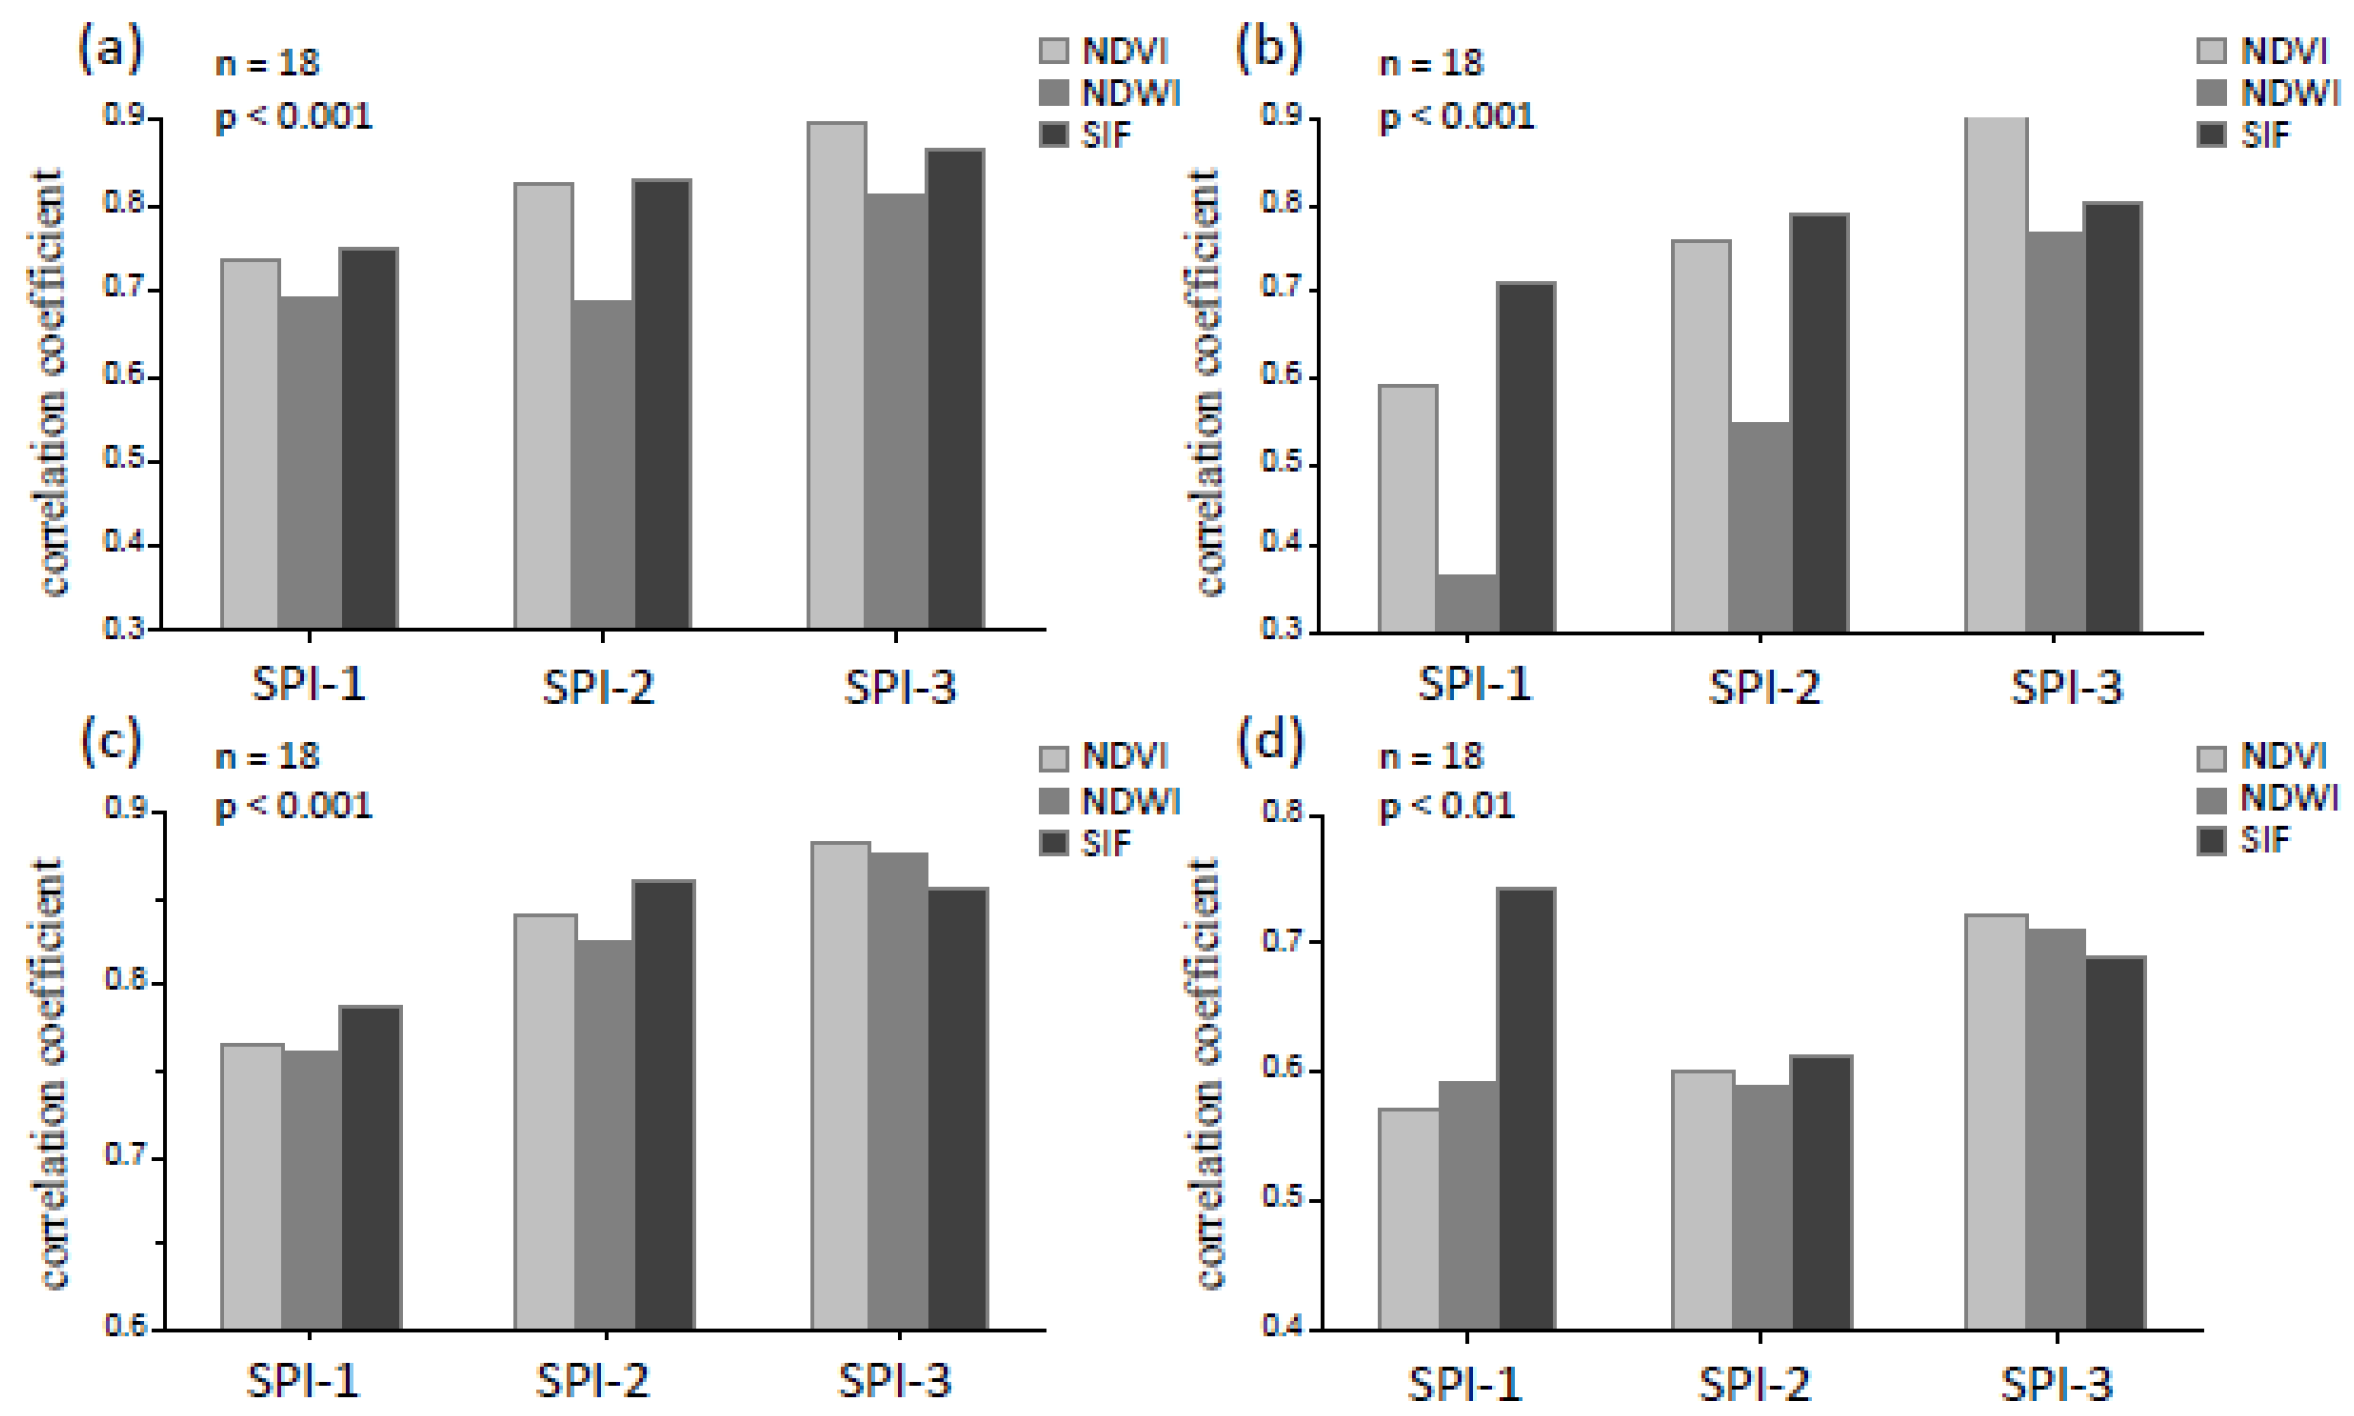
5.1. Drought Sensitivity of SIF and VIs
| Correlation Coefficients | June | July | August | ||||||
|---|---|---|---|---|---|---|---|---|---|
| SPI-1 | SPI-2 | SPI-3 | SPI-1 | SPI-2 | SPI-3 | SPI-1 | SPI-2 | SPI-3 | |
| 1401 & 1404 | 0.682 | 0.736 | 0.928 | 0.687 | 0.865 | 0.862 | 0.477 | 0.699 | 0.807 |
| 1406 & 1409 | 0.690 | 0.710 | 0.695 | 0.805 | 0.888 | 0.867 | 0.450 | 0.814 | 0.898 |
| 2501 & 2502 | 0.622 | 0.724 | 0.781 | 0.687 | 0.659 | 0.762 | 0.743 | 0.744 | 0.711 |
| 3901 & 3905 | 0.494 | 0.545 | 0.552 | 0.440 | 0.518 | 0.636 | 0.829 | 0.806 | 0.811 |
5.2. Difference of the Spatial Pattern for Meteorological and Agricultural Drought
6. Conclusions
Acknowledgments
Author Contributions
Conflicts of Interest
References
- Easterling, D.R. Climate extremes: Observations, modeling, and impacts. Science 2000, 289, 2068–2074. [Google Scholar] [CrossRef] [PubMed]
- Breshears, D.D.; Cobb, N.S.; Rich, P.M.; Price, K.P.; Allen, C.D.; Balice, R.G.; Romme, W.H.; Kastens, J.H.; Floyd, M.L.; Belnap, J.; et al. Regional vegetation die-off in response to global-change-type drought. Proc. Natl. Acad. Sci. USA 2005, 102, 15144–15148. [Google Scholar] [CrossRef] [PubMed]
- Zhao, M.; Running, S.W. Drought-induced reduction in global terrestrial net primary production from 2000 through 2009. Science 2010, 329, 940–943. [Google Scholar] [CrossRef] [PubMed]
- Heim, R.R., Jr. A review of twentieth-century drought indices used in the United States. Bull. Am. Meteorol. Soc. 2002, 83, 1149–1165. [Google Scholar]
- Wilhite, D.A. Drought as a natural hazard: Concepts and definitions. Drought 2000, 1, 3–18. [Google Scholar]
- Ji, L.; Peters, A.J. Assessing vegetation response to drought in the northern great plains using vegetation and drought indices. Remote Sens. Environ. 2003, 87, 85–98. [Google Scholar] [CrossRef]
- Palmer, W.C. Meteorological Drought; US Department of Commerce: Weather Bureau Washington, DC, USA, 1965. [Google Scholar]
- McKee, T.B.; Doesken, N.J.; Kleist, J. Drought Monitoring with Multiple Time Scales; American Meteorological Society: Boston, MA, USA, 1995. [Google Scholar]
- McKee, T.B.; Doesken, N.J.; Kleist, J. The Relationship of Drought Frequency and Duration to Time Scales; American Meteorological Society: Boston, MA, USA, 1993; pp. 179–183. [Google Scholar]
- Rhee, J.; Im, J.; Carbone, G.J. Monitoring agricultural drought for arid and humid regions using multi-sensor remote sensing data. Remote Sens. Environ. 2010, 114, 2875–2887. [Google Scholar] [CrossRef]
- Gao, B.-C. NDWI—A normalized difference water index for remote sensing of vegetation liquid water from space. Remote Sens. Environ. 1996, 58, 257–266. [Google Scholar] [CrossRef]
- Kogan, F.N. Droughts of the late 1980s in the United States as derived from noaa polar-orbiting satellite data. Bull. Am. Meteorol. Soc. 1995, 76, 655–668. [Google Scholar] [CrossRef]
- Gu, Y.; Brown, J.F.; Verdin, J.P.; Wardlow, B. A five-year analysis of MODIS NDVI and NDWI for grassland drought assessment over the central great plains of the United States. Geophys. Res. Lett. 2007, 34. [Google Scholar] [CrossRef]
- Di, L.; Rundquist, D.C.; Han, L. Modelling relationships between NDVI and precipitation during vegetative growth cycles. Int. J. Remote Sens. 1994, 15, 2121–2136. [Google Scholar] [CrossRef]
- Yang, W.; Yang, L.; Merchant, J. An assessment of AVHRR/NDVI-ecoclimatological relations in Nebraska, USA. Int. J. Remote Sens. 1997, 18, 2161–2180. [Google Scholar] [CrossRef]
- Zeng, F.-W.; Collatz, G.; Pinzon, J.; Ivanoff, A. Evaluating and quantifying the climate-driven interannual variability in global inventory modeling and mapping studies (GIMMS) normalized difference vegetation index (NDVI3G) at global scales. Remote Sens. 2013, 5, 3918–3950. [Google Scholar] [CrossRef]
- Dobrowski, S.; Pushnik, J.; Zarcotejada, P.; Ustin, S. Simple reflectance indices track heat and water stress-induced changes in steady-state chlorophyll fluorescence at the canopy scale. Remote Sens. Environ. 2005, 97, 403–414. [Google Scholar] [CrossRef]
- Joiner, J.; Guanter, L.; Lindstrot, R.; Voigt, M.; Vasilkov, A.P.; Middleton, E.M.; Huemmrich, K.F.; Yoshida, Y.; Frankenberg, C. Global monitoring of terrestrial chlorophyll fluorescence from moderate-spectral-resolution near-infrared satellite measurements: Methodology, simulations, and application to GOME-2. Atmos. Meas. Tech. 2013, 6, 2803–2823. [Google Scholar] [CrossRef]
- Köhler, P.; Guanter, L.; Joiner, J. A linear method for the retrieval of sun-induced chlorophyll fluorescence from GOME-2 and SCIAMACHY data. Atmos. Meas. Tech. 2015, 8, 2589–2608. [Google Scholar] [CrossRef]
- Joiner, J.; Yoshida, Y.; Vasilkov, A.P.; Yoshida, Y.; Corp, L.A.; Middleton, E.M. First observations of global and seasonal terrestrial chlorophyll fluorescence from space. Biogeosciences 2011, 8, 637–651. [Google Scholar] [CrossRef] [Green Version]
- Pérez-Priego, O.; Zarco-Tejada, P.J.; Miller, J.R.; Sepulcre-Cantó, G.; Fereres, E. Detection of water stress in orchard trees with a high-resolution spectrometer through chlorophyll fluorescence in-filling of the O2-A band. Geosci. Remote Sens. IEEE Trans. 2005, 43, 2860–2869. [Google Scholar] [CrossRef]
- Zarco-Tejada, P.J.; Berni, J.A.; Suárez, L.; Sepulcre-Cantó, G.; Morales, F.; Miller, J. Imaging chlorophyll fluorescence with an airborne narrow-band multispectral camera for vegetation stress detection. Remote Sens. Environ. 2009, 113, 1262–1275. [Google Scholar] [CrossRef]
- Yang, X.; Tang, J.; Mustard, J.F.; Lee, J.-E.; Rossini, M.; Joiner, J.; Munger, J.W.; Kornfeld, A.; Richardson, A.D. Solar-induced chlorophyll fluorescence that correlates with canopy photosynthesis on diurnal and seasonal scales in a temperate deciduous forest. Geophys. Res. Lett. 2015, 42, 2977–2987. [Google Scholar] [CrossRef]
- Porcar-Castell, A.; Tyystjarvi, E.; Atherton, J.; van der Tol, C.; Flexas, J.; Pfundel, E.E.; Moreno, J.; Frankenberg, C.; Berry, J.A. Linking chlorophyll a fluorescence to photosynthesis for remote sensing applications: Mechanisms and challenges. J. Exp. Bot. 2014, 65, 4065–4095. [Google Scholar] [CrossRef] [PubMed]
- Yoshida, Y.; Joiner, J.; Tucker, C.; Berry, J.; Lee, J.E.; Walker, G.; Reichle, R.; Koster, R.; Lyapustin, A.; Wang, Y. The 2010 russian drought impact on satellite measurements of solar-induced chlorophyll fluorescence: Insights from modeling and comparisons with parameters derived from satellite reflectances. Remote Sens. Environ. 2015, 166, 163–177. [Google Scholar] [CrossRef]
- Guanter, L.; Zhang, Y.; Jung, M.; Joiner, J.; Voigt, M.; Berry, J.A.; Frankenberg, C.; Huete, A.R.; Zarco-Tejada, P.; Lee, J.E.; et al. Global and time-resolved monitoring of crop photosynthesis with chlorophyll fluorescence. Proc. Natl. Acad. Sci. USA 2014, 111, E1327–E1333. [Google Scholar] [CrossRef] [PubMed]
- Guan, K.; Berry, J.; Zhang, Y.; Joiner, J.; Guanter, L.; Badgley, G.; Lobell, D.B. Improving the monitoring of crop production using spaceborne solar-induced fluorescence. Glob. Chang. Boil. 2015, 10. [Google Scholar] [CrossRef]
- Lee, J.E.; Frankenberg, C.; van der Tol, C.; Berry, J.A.; Guanter, L.; Boyce, C.K.; Fisher, J.B.; Morrow, E.; Worden, J.R.; Asefi, S.; et al. Forest production and water stress in Amazonia: Observations from GOSAT chlorophyll fluorescence. Proc. Biol. Sci. 2013, 280. [Google Scholar] [CrossRef] [PubMed]
- Zhang, Y.; Guanter, L.; Berry, J.A.; Joiner, J.; van der Tol, C.; Huete, A.; Gitelson, A.; Voigt, M.; Kohler, P. Estimation of vegetation photosynthetic capacity from space-based measurements of chlorophyll fluorescence for terrestrial biosphere models. Glob. Chang. Boil. 2014, 20, 3727–3742. [Google Scholar] [CrossRef] [PubMed]
- Sun, Y.; Fu, R.; Dickinson, R.; Joiner, J.; Frankenberg, C.; Gu, L.; Xia, Y.; Fernando, N. Drought onset mechanisms revealed by satellite solar-induced chlorophyll fluorescence: Insights from two contrasting extreme events. J. Geophys. Res. 2015, 120, 2427–2440. [Google Scholar] [CrossRef]
- Anderson, M.C.; Hain, C.; Wardlow, B.; Pimstein, A.; Mecikalski, J.R.; Kustas, W.P. Evaluation of drought indices based on thermal remote sensing of evapotranspiration over the continental United States. J. Climate 2011, 24, 2025–2044. [Google Scholar] [CrossRef]
- Joiner, J.; Yoshida, Y.; Vasilkov, A.P.; Schaefer, K.; Jung, M.; Guanter, L.; Zhang, Y.; Garrity, S.; Middleton, E.M.; Huemmrich, K.F.; et al. The seasonal cycle of satellite chlorophyll fluorescence observations and its relationship to vegetation phenology and ecosystem atmosphere carbon exchange. Remote Sens. Environ. 2014, 152, 375–391. [Google Scholar] [CrossRef]
- Logan, K.E.; Brunsell, N.A. Influence of drought on growing season carbon and water cycling with changing land cover. Agric. Forest Meteorol. 2015, 213, 217–225. [Google Scholar] [CrossRef]
- Brunsell, N.; Nippert, J.; Buck, T. Impacts of seasonality and surface heterogeneity on water-use efficiency in mesic grasslands. Ecohydrology 2014, 7, 1223–1233. [Google Scholar] [CrossRef]
- Wagle, P.; Xiao, X.; Suyker, A.E. Estimation and analysis of gross primary production of soybean under various management practices and drought conditions. ISPRS J. Photogramm. Remote Sens. 2015, 99, 70–83. [Google Scholar] [CrossRef]
- Suyker, A.E.; Verma, S.B.; Burba, G.G.; Arkebauer, T.J.; Walters, D.T.; Hubbard, K.G. Growing season carbon dioxide exchange in irrigated and rainfed maize. Agric. For. Meteorol. 2004, 124, 1–13. [Google Scholar] [CrossRef]
- Kramer, P.J.; Boyer, J.S. Water Relations of Plants and Soils; Academic press: Cambridge, MA, USA, 1995. [Google Scholar]
- Teare, I.D.; Peet, M.M. Crop-Water Relations; John Wiley & Sons: New York, NY, USA, 1983. [Google Scholar]
- Ginestar, C.; Castel, J. Responses of young clementine citrus trees to water stress during different phenological periods. J. Hortic. Sci. 1996, 71, 551–560. [Google Scholar]
- Souza, R.P.; Machado, E.C.; Silva, J.A.B.; Lagôa, A.M.M.A.; Silveira, J.A.G. Photosynthetic gas exchange, chlorophyll fluorescence and some associated metabolic changes in cowpea (Vigna unguiculata) during water stress and recovery. Environ. Exp. Bot. 2004, 51, 45–56. [Google Scholar] [CrossRef]
- Briantais, J.M.; Dacosta, J.; Goulas, Y.; Ducruet, J.M.; Moya, I. Heat stress induces in leaves an increase of the minimum level of chlorophyll fluorescence, Fo: A time-resolved analysis. Photosynth. Res. 1996, 48, 189–196. [Google Scholar] [CrossRef] [PubMed]
- Panigada, C.; Rossini, M.; Meroni, M.; Cilia, C.; Busetto, L.; Amaducci, S.; Boschetti, M.; Cogliati, S.; Picchi, V.; Pinto, F.; et al. Fluorescence, PRI and canopy temperature for water stress detection in cereal crops. Int. J. Appl. Earth Obs. Geoinform. 2014, 30, 167–178. [Google Scholar] [CrossRef]
- Meroni, M.; Rossini, M.; Guanter, L.; Alonso, L.; Rascher, U.; Colombo, R.; Moreno, J. Remote sensing of solar-induced chlorophyll fluorescence: Review of methods and applications. Remote Sens. Environ. 2009, 113, 2037–2051. [Google Scholar] [CrossRef]
- Ač, A.; Malenovský, Z.; Olejníčková, J.; Gallé, A.; Rascher, U.; Mohammed, G. Meta-analysis assessing potential of steady-state chlorophyll fluorescence for remote sensing detection of plant water, temperature and nitrogen stress. Remote Sens. Environ. 2015, 168, 420–436. [Google Scholar] [CrossRef]
- Hoerling, M.; Eischeid, J.; Kumar, A.; Leung, R.; Mariotti, A.; Mo, K.; Schubert, S.; Seager, R. Causes and predictability of the 2012 great plains drought. Bull. Am. Meteorol. Soc. 2014, 95, 269–282. [Google Scholar] [CrossRef]
- Asner, G.P.; Nepstad, D.; Cardinot, G.; Ray, D. Drought stress and carbon uptake in an amazon forest measured with spaceborne imaging spectroscopy. Proc. Natl. Acad. Sci. USA 2004, 101, 6039–6044. [Google Scholar] [CrossRef] [PubMed]
- Gu, Y.; Wylie, B.K.; Howard, D.M.; Phuyal, K.P.; Ji, L. NDVI saturation adjustment: A new approach for improving cropland performance estimates in the greater platte river basin, USA. Ecol. Indic. 2013, 30, 1–6. [Google Scholar] [CrossRef]
- Daumard, F.; Champagne, S.; Fournier, A.; Goulas, Y.; Ounis, A.; Hanocq, J.-F.; Moya, I. A field platform for continuous measurement of canopy fluorescence. Geosci. Remote Sens. IEEE Trans. 2010, 48, 3358–3368. [Google Scholar] [CrossRef]
- Middleton, E.M.; Huemmrich, K.F.; Cheng, Y.-B.; Margolis, H.A. Chapter 12. Spectral bioindicators of photosynthetic efficiency and vegetation stress. In Hyperspectral Remote Sensing of Vegetation; CRC Press: Boca Raton, FL, USA, 2011; pp. 265–288. [Google Scholar]
- DeAngelis, A.; Dominguez, F.; Fan, Y.; Robock, A.; Kustu, M.D.; Robinson, D. Evidence of enhanced precipitation due to irrigation over the great plains of the United States. J. Geophys. Res. 2010, 115. [Google Scholar] [CrossRef]
© 2016 by the authors; licensee MDPI, Basel, Switzerland. This article is an open access article distributed under the terms and conditions of the Creative Commons by Attribution (CC-BY) license (http://creativecommons.org/licenses/by/4.0/).
Share and Cite
Wang, S.; Huang, C.; Zhang, L.; Lin, Y.; Cen, Y.; Wu, T. Monitoring and Assessing the 2012 Drought in the Great Plains: Analyzing Satellite-Retrieved Solar-Induced Chlorophyll Fluorescence, Drought Indices, and Gross Primary Production. Remote Sens. 2016, 8, 61. https://0-doi-org.brum.beds.ac.uk/10.3390/rs8020061
Wang S, Huang C, Zhang L, Lin Y, Cen Y, Wu T. Monitoring and Assessing the 2012 Drought in the Great Plains: Analyzing Satellite-Retrieved Solar-Induced Chlorophyll Fluorescence, Drought Indices, and Gross Primary Production. Remote Sensing. 2016; 8(2):61. https://0-doi-org.brum.beds.ac.uk/10.3390/rs8020061
Chicago/Turabian StyleWang, Siheng, Changping Huang, Lifu Zhang, Yi Lin, Yi Cen, and Taixia Wu. 2016. "Monitoring and Assessing the 2012 Drought in the Great Plains: Analyzing Satellite-Retrieved Solar-Induced Chlorophyll Fluorescence, Drought Indices, and Gross Primary Production" Remote Sensing 8, no. 2: 61. https://0-doi-org.brum.beds.ac.uk/10.3390/rs8020061