Article

Evaluation of Continuous VNIR-SWIR Spectra versus Narrowband Hyperspectral Indices to Discriminate the Invasive Acacia longifolia within a Mediterranean Dune Ecosystem

by
André Große-Stoltenberg
1,*,
Christine Hellmann
2,3,
Christiane Werner
2,
Jens Oldeland
4 and
Jan Thiele
1
1
Institute of Landscape Ecology, University of Münster, Heisenbergstraße 2, 48149 Münster, Germany
2
Ecosystem Physiology, University of Freiburg, Georges-Köhler-Allee 53/54, 79110 Freiburg, Germany
3
Experimental and Systems Ecology, University of Bielefeld, Universitätsstraße 25, 33615 Bielefeld, Germany
4
Biodiversity, Ecology and Evolution of Plants, Biocentre Klein Flottbek and Botanical Garden, University of Hamburg, Ohnhorststraße 18, 22609 Hamburg, Germany
*
Author to whom correspondence should be addressed.
Submission received: 1 December 2015 / Revised: 5 April 2016 / Accepted: 5 April 2016 / Published: 15 April 2016
(This article belongs to the Special Issue Field Spectroscopy and Radiometry)

Abstract

:
Hyperspectral remote sensing is an effective tool to discriminate plant species, providing vast potential to trace plant invasions for ecological assessments. However, necessary baseline information for the use of remote sensing data is missing for many high-impact invaders. Furthermore, the identification of the suitable classification algorithms and spectral regions for successfully classifying species remains an open field of research. Here, we tested the separability of the invasive tree Acacia longifolia from adjacent exotic and native vegetation in a Natura 2000 protected Mediterranean dune ecosystem. We used continuous visible, near-infrared and short wave infrared (VNIR-SWIR) data as well as vegetation indices at the leaf and canopy level for classification, comparing five different classification algorithms. We were able to successfully distinguish A. longifolia from surrounding vegetation based on vegetation indices. At the leaf level, radial-basis function kernel Support Vector Machine (SVM) and Random Forest (RF) achieved both a high Sensitivity (SVM: 0.83, RF: 0.78) and a high Positive Predicted Value (PPV) (0.86, 0.83). At the canopy level, RF was the classifier with an optimal balance of Sensitivity (0.75) and PPV (0.75). The most relevant vegetation indices were linked to the biochemical parameters chlorophyll, water, nitrogen, and cellulose as well as vegetation cover, which is in line with biochemical and ecophysiological properties reported for A. longifolia. Our results highlight the potential to use remote sensing as a tool for an early detection of A. longifolia in Mediterranean coastal ecosystems.

Graphical Abstract

1. Introduction

Invasive plant species are a major threat to many ecosystems worldwide [1], causing high ecological impacts and high economic costs [2]. Thus, early detection and monitoring of distribution and abundance of invasive species is desirable as a basis for impact assessment, prioritization of most harmful species, and targeting of invasive populations. As on-site data collection is difficult over large areas, remote sensing provides a promising tool to detect and to monitor invasive species at landscape scales [3,4,5]. To this end, it would be beneficial to identify band regions that separate invasive and native species by means of field spectra, and to assess their importance at different scales. However, few studies have compared the separability of plant species based on hyperspectral data on both, leaf and canopy level [6,7,8,9,10,11], while studies on invasive plants exclusively used either leaf [12,13] or canopy [14,15] field spectral data.
Further, there are several approaches to classify species using either the continuous spectrum from the visible (VIS) to the shortwave infrared (SWIR) [10,16,17], particular spectral curve shape-based features [8,18], or vegetation indices [8,19,20]. Linking spectral with biochemical and physiological ancillary data may increase classification accuracy. At the same time, it allows to relate the spectral separability of species to their characteristic ecophysiological traits [19,21]. In this regard, vegetation indices and spectral features can be considered semi-quantitative biochemical parameters of the reflectance spectrum [22] that may help to assess the physiological status of the vegetation [20]. In a recent study on the separability of native Mediterranean dune species, relevant absorption features were related to pigments, water, lignin and cellulose [23]. However, important wavelengths or bands to distinguish exotic from native species in a Mediterranean dune ecosystem still have to be identified.
Important predictors can be extracted by using wrapper functions such as recursive feature elimination and by choosing classifiers with embedded feature selection methods [16,19,24,25]. Powerful classifiers for high-dimensional data include Partial Least Squares Discriminant Analysis (PLSDA) [26] and sparse PLSDA [16], Support Vector Machines (SVM) [16,27], Linear Discriminant Analysis (LDA) [7,19] and Random Forest (RF) [8,19]. The relatively new High-Dimensional Discriminant analysis (HDDA) has been tested on simulated and real high-dimensional datasets [28], but not on vegetation data compared with common algorithms such as SVM and RF. However, previous studies show no agreement on the best classifier, the best data reduction technique, and the most important bands for species discrimination. Therefore, in the present study, we compared results from different types of classification algorithms (LDA, HDDA, sPLSDA, RF, SVM) and different methods for reducing data dimensionality.
A comprehensive spectral library for a diverse Mediterranean dune ecosystem has been published recently [23], though it does not include exotic invasive species. Some highly invasive shrub and tree species worldwide belong to the genus Acacia [29]. In European Mediterranean dune ecosystems, Acacia longifolia (Andrews) Willd. has been described as one of most problematic invaders. Its occurrence has been reported for most part of the western Atlantic coast of the Iberian Peninsula [30,31,32,33,34,35,36] and in coastal ecosystems worldwide [37,38,39,40]. Several studies have assessed its invasion strategy and impact in Mediterranean dune ecosystems in Portugal. It is considered a highly competitive plant as it has a high growth rate [41,42], an efficient nutrient acquisition [41,42], and it benefits from fire events [43]. The impacts on ecosystem functioning include alterations of the nitrogen cycle [30,44], water balance [45], carbon assimilation [45], vegetation and plant community structure [33], plant diversity [33], litter density [31], soil N content and C/N ratio [31], and the seed bank [46]. In spite of the numerous studies on its strategy, its impacts, as well as restoration and control, there is a lack of assessments of its invasion pattern at landscape level, i.e., by means of remote sensing. Furthermore, to our knowledge, assessing leaf and canopy spectral properties of invasive Acacia spp. as baseline information for detection at an early invasion state has not yet been achieved.
In this study, we tested the separability of A. longifolia from other exotic and native shrubs and trees in a Mediterranean dune ecosystem. In particular, we investigated: (i) if narrowband hyperspectral vegetation indices perform better than the full spectrum in distinguishing A. longifolia at leaf and canopy level from all other species; (ii) which type of classification algorithm provide the best classifier for A. longifolia; and (iii) which are the most important biophysical, biochemical, and ecophysiological parameters to distinguish A. longifolia from adjacent vegetation.

2. Materials and Methods
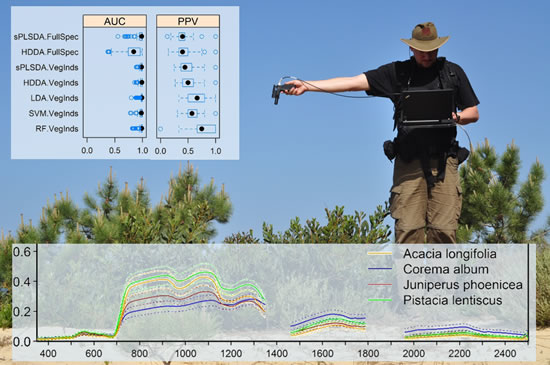
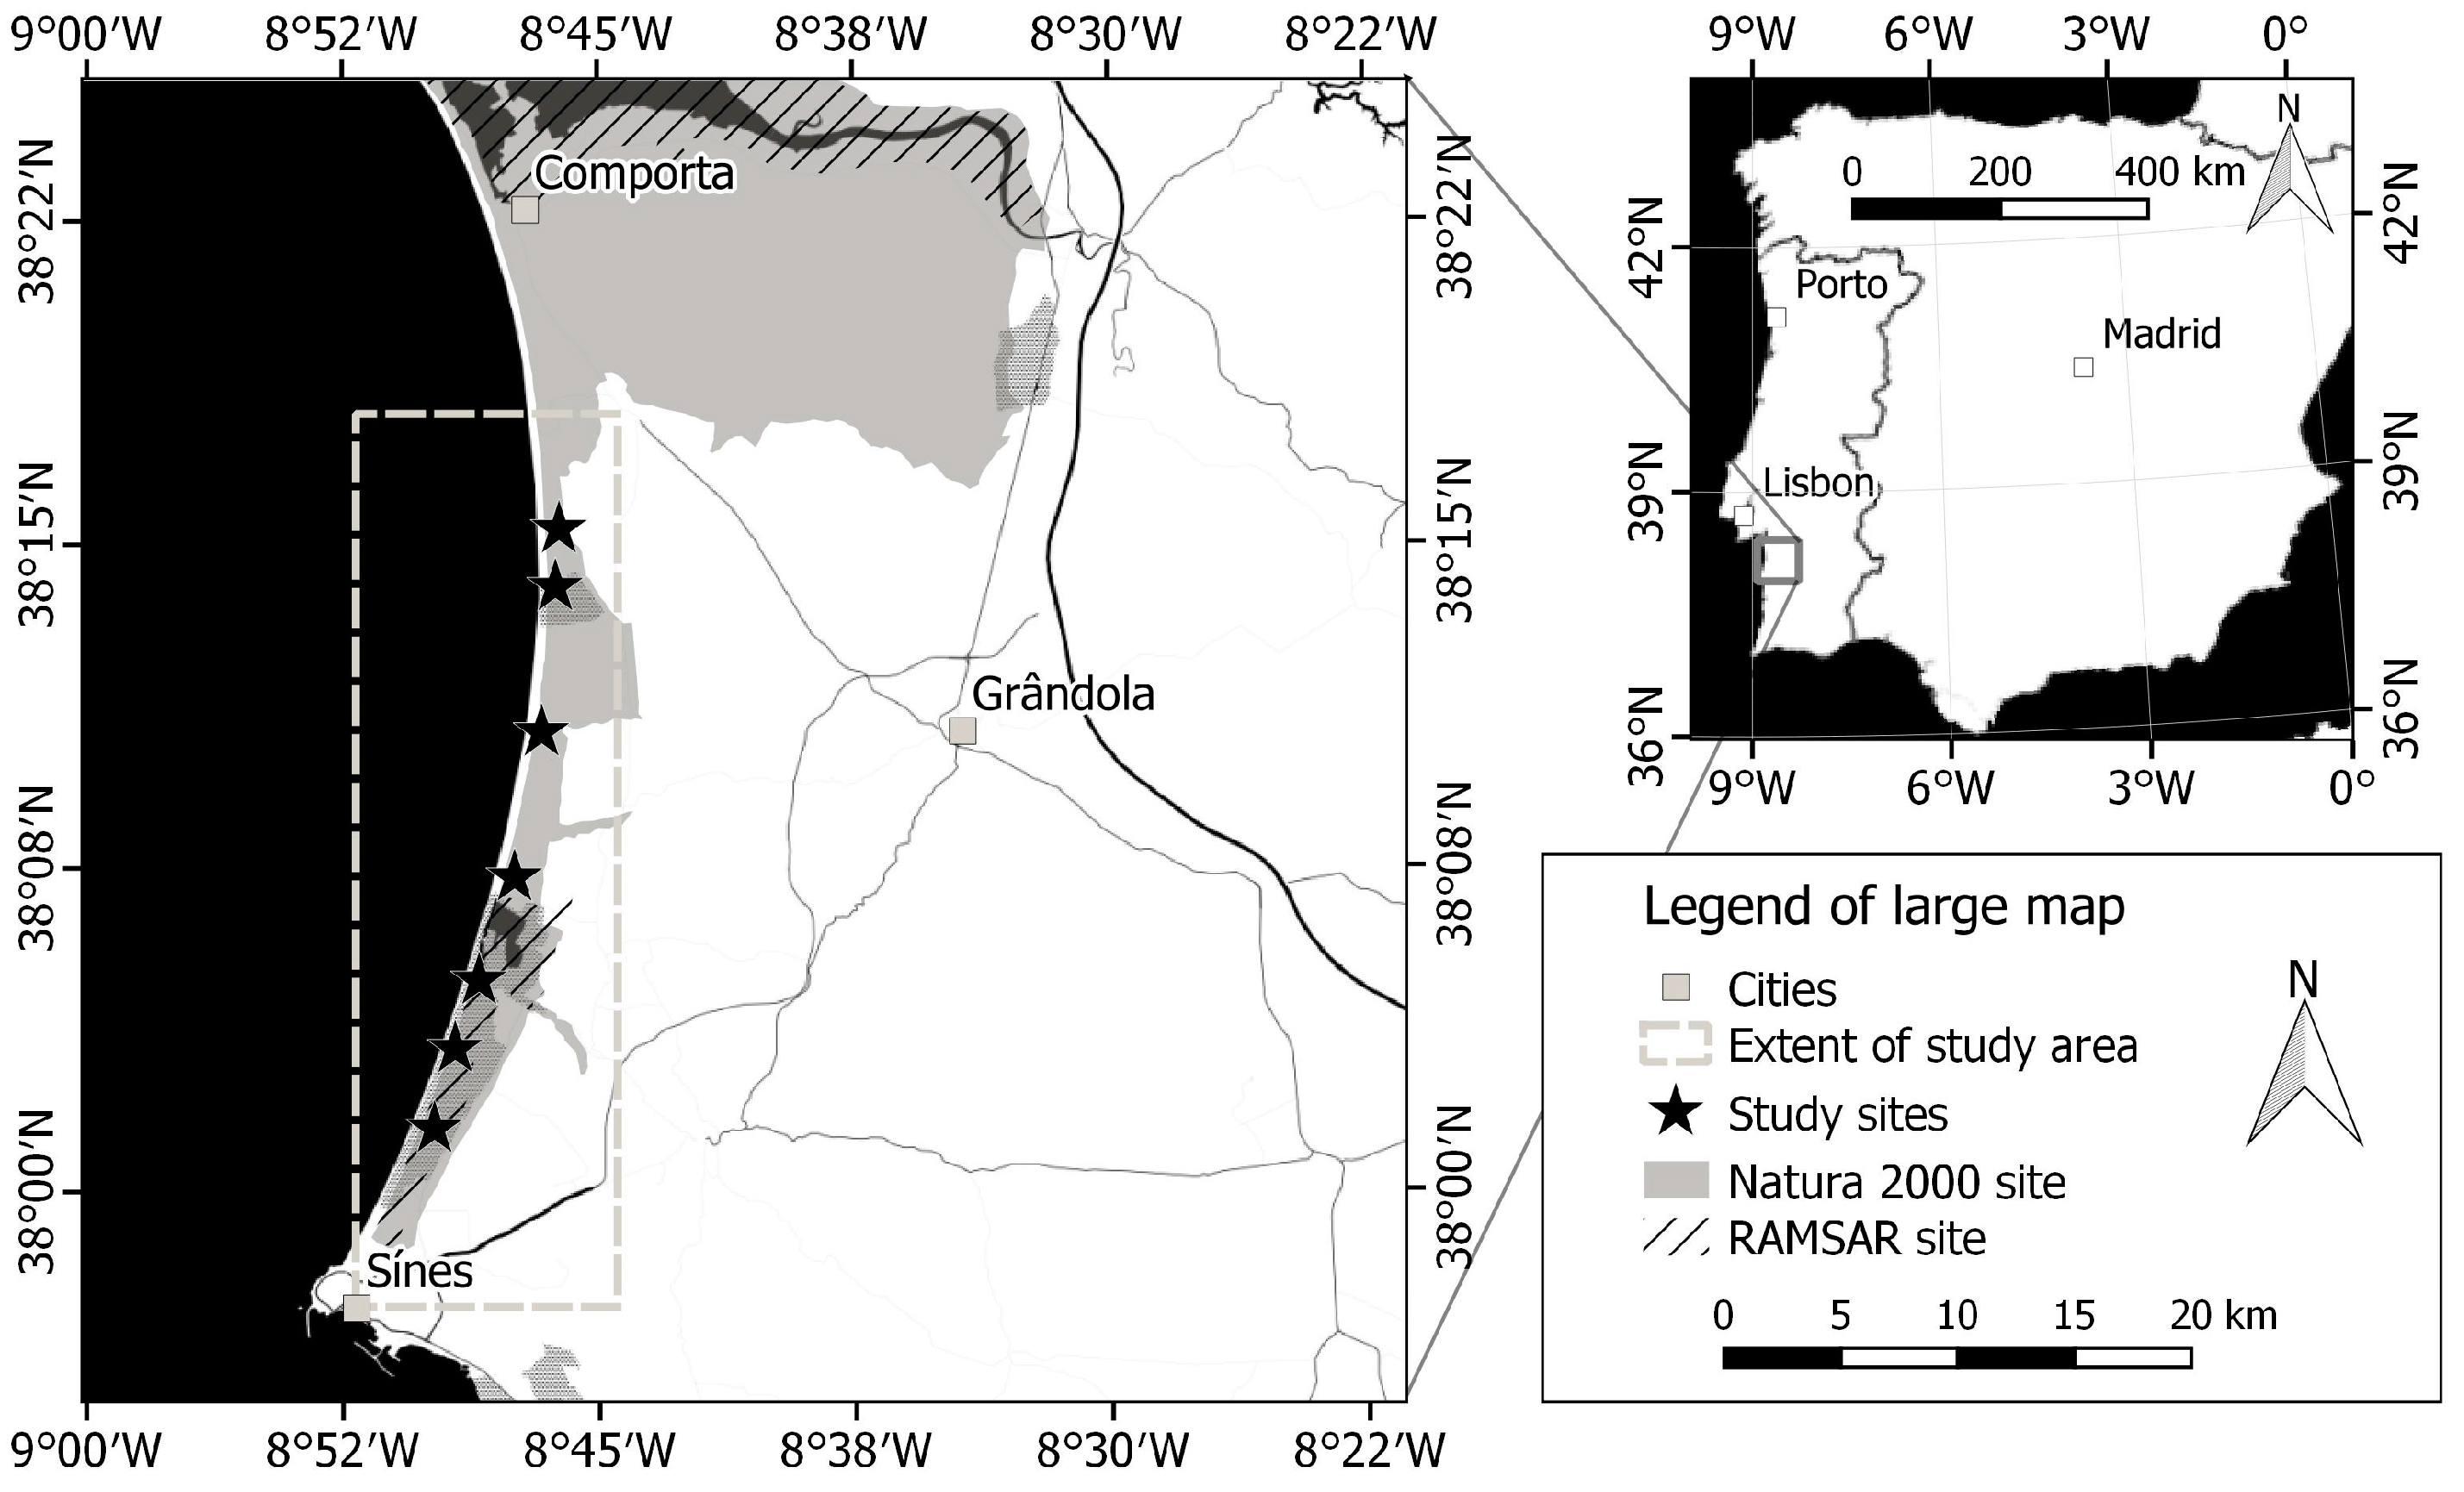
2.1. Study Area

The study was conducted at 7 sites along a coastal strip of 1 km × 35 km in the Natura 2000 site “Comporta/Galé” [47] in Southwest Portugal (see Figure 1). The study area is characterized by a mosaic of several natural and semi-natural shrub-dominated dune habitats comprising “Atlantic decalcified fixed dunes” (2150*), “coastal dunes with Juniperus spp.” (2250*), “dune sclerophyllous scrubs” (2260) as well as “wooded dunes with Pinus pinea and/or Pinus pinaster (2270*)”, including priority habitat types based on the Natura 2000 directive (indicated with “*”) [48]. For a further description of the Natura 2000 site and the nature reserve in particular see [47,49], respectively.
One of the management objectives for the aforementioned habitat types is the early detection and control of high-impact invasive species of the genus Acacia [47] such as A. longifolia [30,33,44,45]. The population structure of A. longifolia in the study area includes isolated adult trees without juvenile plants, locally regenerating populations, populations regenerating after disturbance and stable, impenetrable thickets. However, to date, comprehensive abundance and distribution data are not available.

2.2. Collection of Field Spectra

Leaf and canopy spectra were collected between 5 and 9 April 2011 and between 27 April and 12 May 2014. In 2011 we sampled spectra with an ASD FieldSpec 3 (see [50,51] for specifications). In 2014, we collected spectral data with an ASD FieldSpec 4 Hi-Res spectroradiometer (ASD Inc., Boulder, CO, USA) [52]. Spectral information was recorded from fresh samples in the field to avoid changes in spectral properties during storage and transportation [53]. Leaf spectra were recorded using a plant probe (ASD Inc., Boulder, CO, USA). Several leaves were used in case single leaf area was too small to cover the area of the contact probe. The plant probe’s white reference disk was used as in [50]. In 2014, we additionally used black, foamed rubber as dark background (see [26]). The canopy spectra were taken with a field of view of 25° [52]. Canopy spectra were sampled during days without cloud cover and with homogenous light conditions within a period of ca. 2 h before and after solar noon. The spectra were referenced against a calibrated Zenith LiteTM Diffuse Reflectance Target—95% R (SphereOptics®, Herrsching, Germany). Spectra average was set to 25 for plant targets and 50 for the white reference. Spectral collection rate was ten·s−1 for the ASD FieldSpec 3 and five·s−1 for the FieldSpec 4. Although two different spectrometers were used, we do not expect a significant difference of measured target reflectance as the effect has been shown to be minimal for calibrated devices when the same protocol is applied [54]. Here, both first-hand spectrometers were recently calibrated, and the sampling protocol as well as the operators and the white reference material were identical.
The measured target species were the most abundant shrub and tree species of the habitat types such as Corema album (L.) D. Don, Juniperus phoenicea subsp. turbinata (Guss.) Nyman and Pistacia lentiscus L., as well as exotic invasive species such as A. longifolia and Acacia saligna (Labill.) H.L. Wendl. Corema album is possibly the most frequent small shrub in the open dunes. Pistacia lentiscus is also very frequent, and it is the most similar species to A. longifolia regarding growth form, leaf type and habitat. Juniperus phoenicea has a different leaf type compared to A. longifolia, but growth form and habitat are similar. We also sampled chamaephytes including the invasive Carpobrotus edulis (L.) N.E.Br. and those of high-conservation value (e.g., Thymus sp.). Apart from different growth forms, leaf types and strategies, species such as C. album and A. longifolia confer a high degree of plasticity in response to microhabitat differences in environmental stress, such as fine scale differences in water accessibility in this heterogeneous system [55] which can affect the plant species’ spectral response [56,57]. Altogether, we used 607 leaf spectra (74 A. longifolia and 524 other plant species) and 293 canopy spectra (18 A. longifolia and 275 other plant species). As the main objective of this study was to discriminate the target species A. longifolia from any other species or combinations thereof, the samples were separated into two groups, “Acacia longifolia” and “other plant species”, be classified in a “one-versus-all” (OVA) approach. Although some studies showed constraints using a binary classifier for a potentially multiclass problem (e.g., [58]), the OVA approach has been applied successfully in various studies [59] including classification of remote sensing data using SVM [60,61], and for invasive plant species detection [62]. A full species list including growth form and the number of leaf and canopy samples can be found in Table 1.

2.3. Pre-Processing of Field Spectra

The spectra were corrected for the spectral discontinuities between the three sensors of the spectroradiometer using an additive correction as in [64] with the SWIR1 sensor as reference. The data were smoothed with the Savitzky–Golay filter using a window size of fifteen and a second order polynomial using the “hsdar” package version 0.3.1 [65] of R statistical software [66]. For the canopy spectra analysis, noisy bands with water absorption features (1350–1460 nm and 1790–1960 nm) were removed.

2.4. Calculation of Vegetation Indices and Red Edge Parameters

Hyperspectral narrowband vegetation indices and red edge parameters were calculated using the “hsdar” package, version 0.3.1 [65]. Variables with missing or infinite values or near zero variance were removed and indices for soil parameters (SWIR.FI, SWIR.SI, and SWIR.LI) were excluded. Pairwise correlations were calculated for the vegetation indices using Spearman rank correlation, and highly correlated predictors with a correlation coefficient higher than 0.6 were removed from the dataset, thus setting a slightly more conservative threshold than recommended [67].

2.5. Classification

Two approaches were compared to classify the spectral data: (1) the full spectrum together with classifiers specifically developed for high-dimensional data analysis; and (2) a reduced dataset consisting of vegetation indices. The number of vegetation indices was further reduced using recursive feature elimination (RFE) based on the receiver-operator curve (ROC) and considering variable importance [68].
To analyze the full spectrum, we chose sparse Partial Least Square Discriminant Analysis (sPLSDA) [69] and High-Dimensional Discriminant Analysis (HDDA) [28]. HDDA is a relatively new classifier [28,70] designed for high dimensional datasets. The vegetation index datasets were classified using sPLSDA and HDDA as well as Linear Discriminant Analysis (LDA) [71], Random Forest (RF) [72], and Support Vector Machine (SVM) [73]. LDA was chosen as it is a simple, fast and efficient classifier [9,74]. RF and SVM were included because they have been proven useful in classifying various kinds of datasets [75] and are among the most commonly used classifiers designed for hyperspectral data analysis [76].
We optimized the model parameters, i.e., the number of components, eta and kappa in sPLSDA, “mtry” in RF as well as sigma and the cost parameter for SVM with a radial basis function kernel. The predictors were centered and scaled to account for the different ranges of the vegetation indices and the red-edge parameters. During model training and recursive feature elimination, the models were validated using stratified tenfold cross validation with five repeats. We used the receiver operating characteristic (ROC) curve to maximize model performance and balance Sensitivity and Specificity. The specific packages for each classifier were as followed: sPLSDA (“spls”, version 2.2-1) [77], HDDA (“HDClassif”, version 1.3) [70], LDA (“MASS”, version 7.3-44) [71], RF (“randomForest”, version 4.6-12) [78], and SVM (“kernlab”, version 0.9-22) [79].
Each dataset was split into a training set (75%) for model fitting and a test set (25%) for model evaluation preserving class distribution. “A. longifolia” was up-sampled during training (Table 2) to avoid a high impact of the majority class on the classifier which could lead to poor identification of the minority class [68]. The test set was not up-sampled in order to produce a reliable evaluation of the training model.
Model performance can be negatively influenced by both between-class and within-class imbalances. As a result, minority classes or small data subclusters of one class might be misclassified [80]. Therefore, data splitting and model fitting was iterated a hundred times to address the within-class distribution. Model performance was assessed by boxplots of Sensitivity, Specificity, ROC area under curve (AUC) (R package “pROC”, version 1.8) [81] and Positive Predictive Value (PPV). Furthermore, we calculated the variable importance (VIP) and the frequency of occurrence for the predictors within each of the 100 iterations. A Mann–Whitney U-Test was performed to test for significant differences of important vegetation indices between the target species A. longifolia and the other species.
All analyses were conducted using the R package “caret”, version 6.0-52 [82] which supports a large variety of classification algorithms.

3. Results

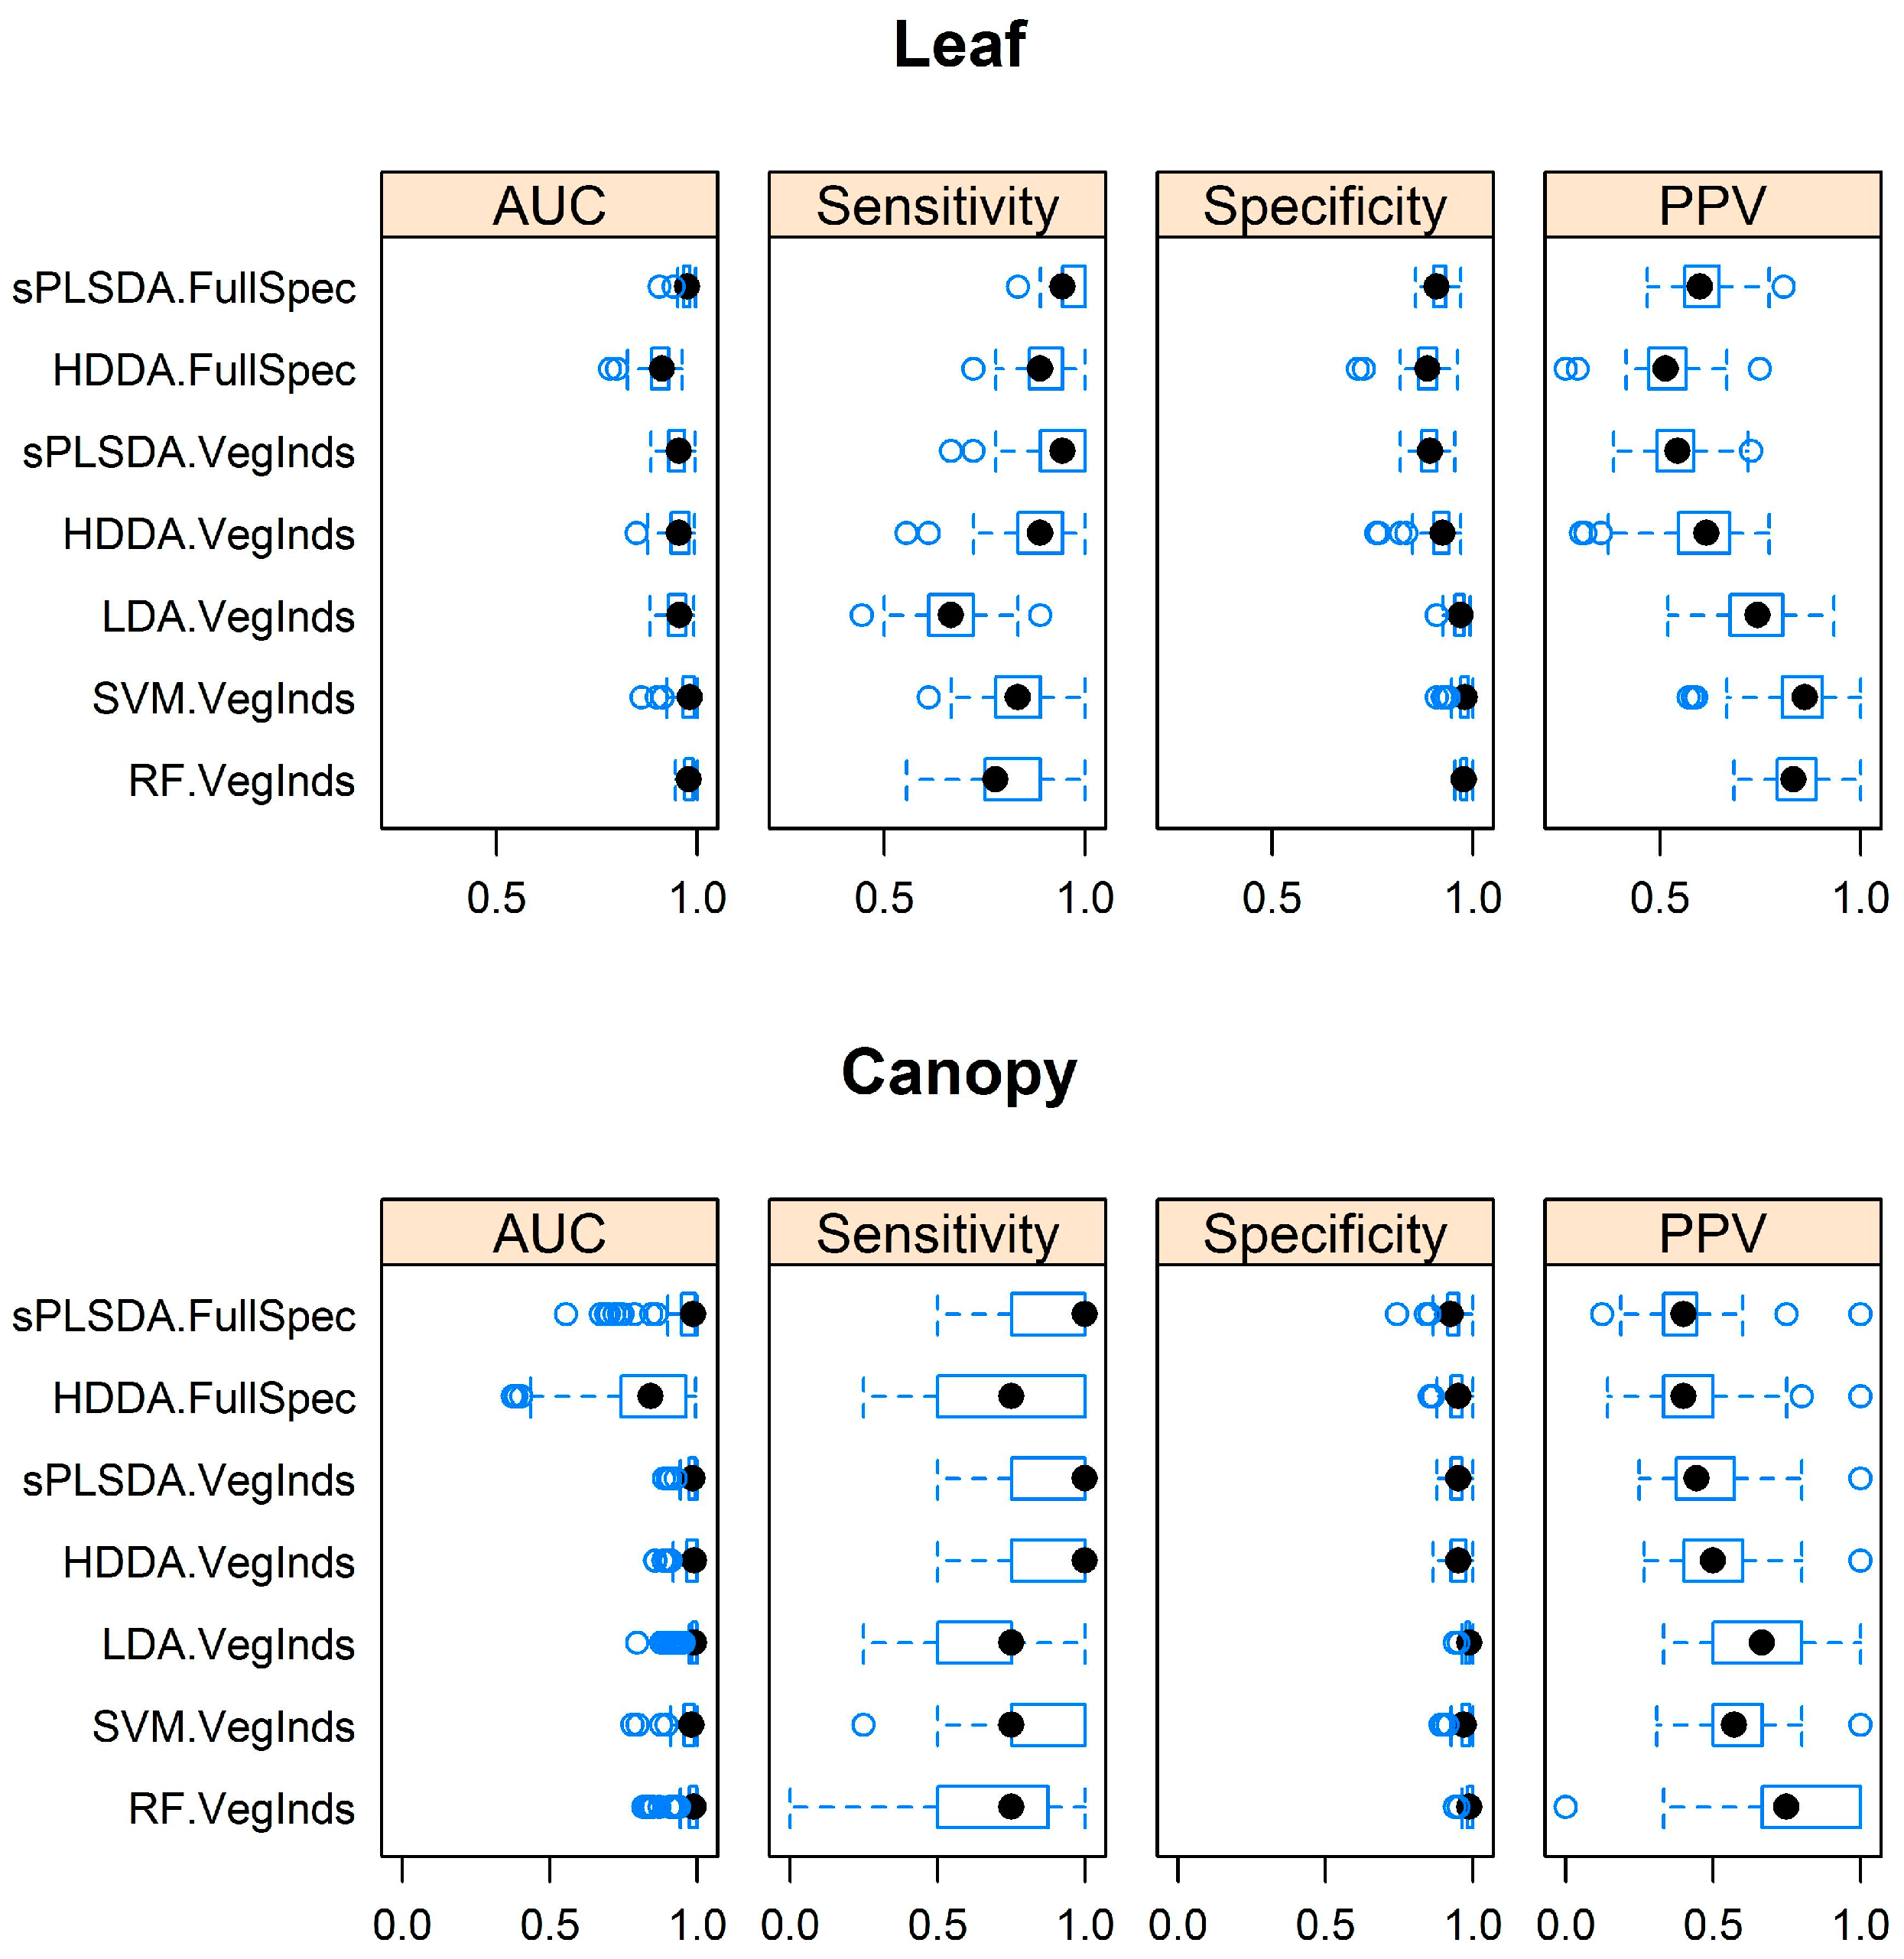
3.1. Separating Acacia longifolia from Adjacent Mediterranean Dune Vegetation at the Leaf and Canopy Level

After removing correlated variables, sixteen vegetation indices were used for the classification at the leaf scale and twelve at the canopy scale (Table 3). Regarding the classification accuracy at leaf level, the median of Area Under Curve (AUC) was between 0.91 (HDDAFullSpec) and 0.98 (RFVegInds, SVMVegInds). At the canopy scale, all classifiers apart from HDDAFullSpec reached a median AUC of 0.98 or 0.99 (Figure 2). Therefore, A. longifolia could be successfully identified at both leaf and canopy level. However, performance parameters directly related to the identification of A. longifolia, PPV (0.4–0.86) and Sensitivity (0.67–1), varied stronger than AUC (0.84–0.99) and Specificity (0.89–0.99).

3.2. Comparison of Model Performance Using Full Spectrum Data and Hyperspectral Narrowband Vegetation Indices

Models based on the full spectrum reached a similar accuracy regarding AUC (leaf: 0.97/canopy: 0.99), Sensitivity (0.94/1.00), and Specificity (0.94/1.00) compared to the highest median values using vegetation index data: AUC (0.98/0.99), Sensitivity (0.94/1.00) and Specificity (0.98/0.99) (Figure 2). Nevertheless, models based on vegetation indices revealed at least one classifier that reached or outperformed those based on the full spectrum with respect to AUC, Specificity, and PPV. In particular, the median values for PPV were lower for full spectrum data (0.60/0.40) compared with the best classifiers using vegetation indices (0.86/0.75). Thus, generally, accuracy was as high or even higher for the classifiers using the reduced dataset, especially regarding PPV.

3.3. Identification of the Optimal Algorithm to Distinguish Acacia longifolia from Adjacent Vegetation

An optimal algorithm can be characterized by a high true positive rate (Sensitivity) and a high reliability (PPV). At the leaf level, sPLSDAFullSpec and sPLSDAVegInds reached the highest median (0.94) with a relatively small interquartile range (0.06 and 0.11, respectively) regarding Sensitivity (Figure 2). HDDAFullSpec also produced relatively high Sensitivity values (0.89) and a small interquartile range compared to sPLSDAFullSpec, though a low PPV (0.52) indicated a high false positive rate. SVMVegInds and RFVegInds reached a moderate Sensitivity of 0.83 and 0.78 with a high PPV value of 0.86 and 0.83, respectively. In summary, sPLSDAFullSpec,VegInds performed best concerning Sensitivity, but overestimated the number of identified A. longifolia individuals. SVMVegInds and RFVegInds provided alternatives in terms of a balanced relation between Sensitivity and PPV.
At the canopy level, the values for Sensitivity had a low resolution and alternated between 0.75 and 1 due to the sample size. The best results regarding Sensitivity were achieved by sPLSDAFullSpec, sPLSDAVegInds and HDDAVegInds. The latter reached higher AUC and Specificity, and therefore a higher PPV, but the PPV was relatively low compared to all other classifiers using index data. Thus, despite the high Sensitivity, the amount of identified individuals of the target species, A. longifolia, was overestimated. On the contrary, LDAVegInds, SVMVegInds and RFVegInds had moderate Sensitivity, but a higher PPV. RFVegInds had the highest PPV of all classifiers, though it showed some extreme outliers.

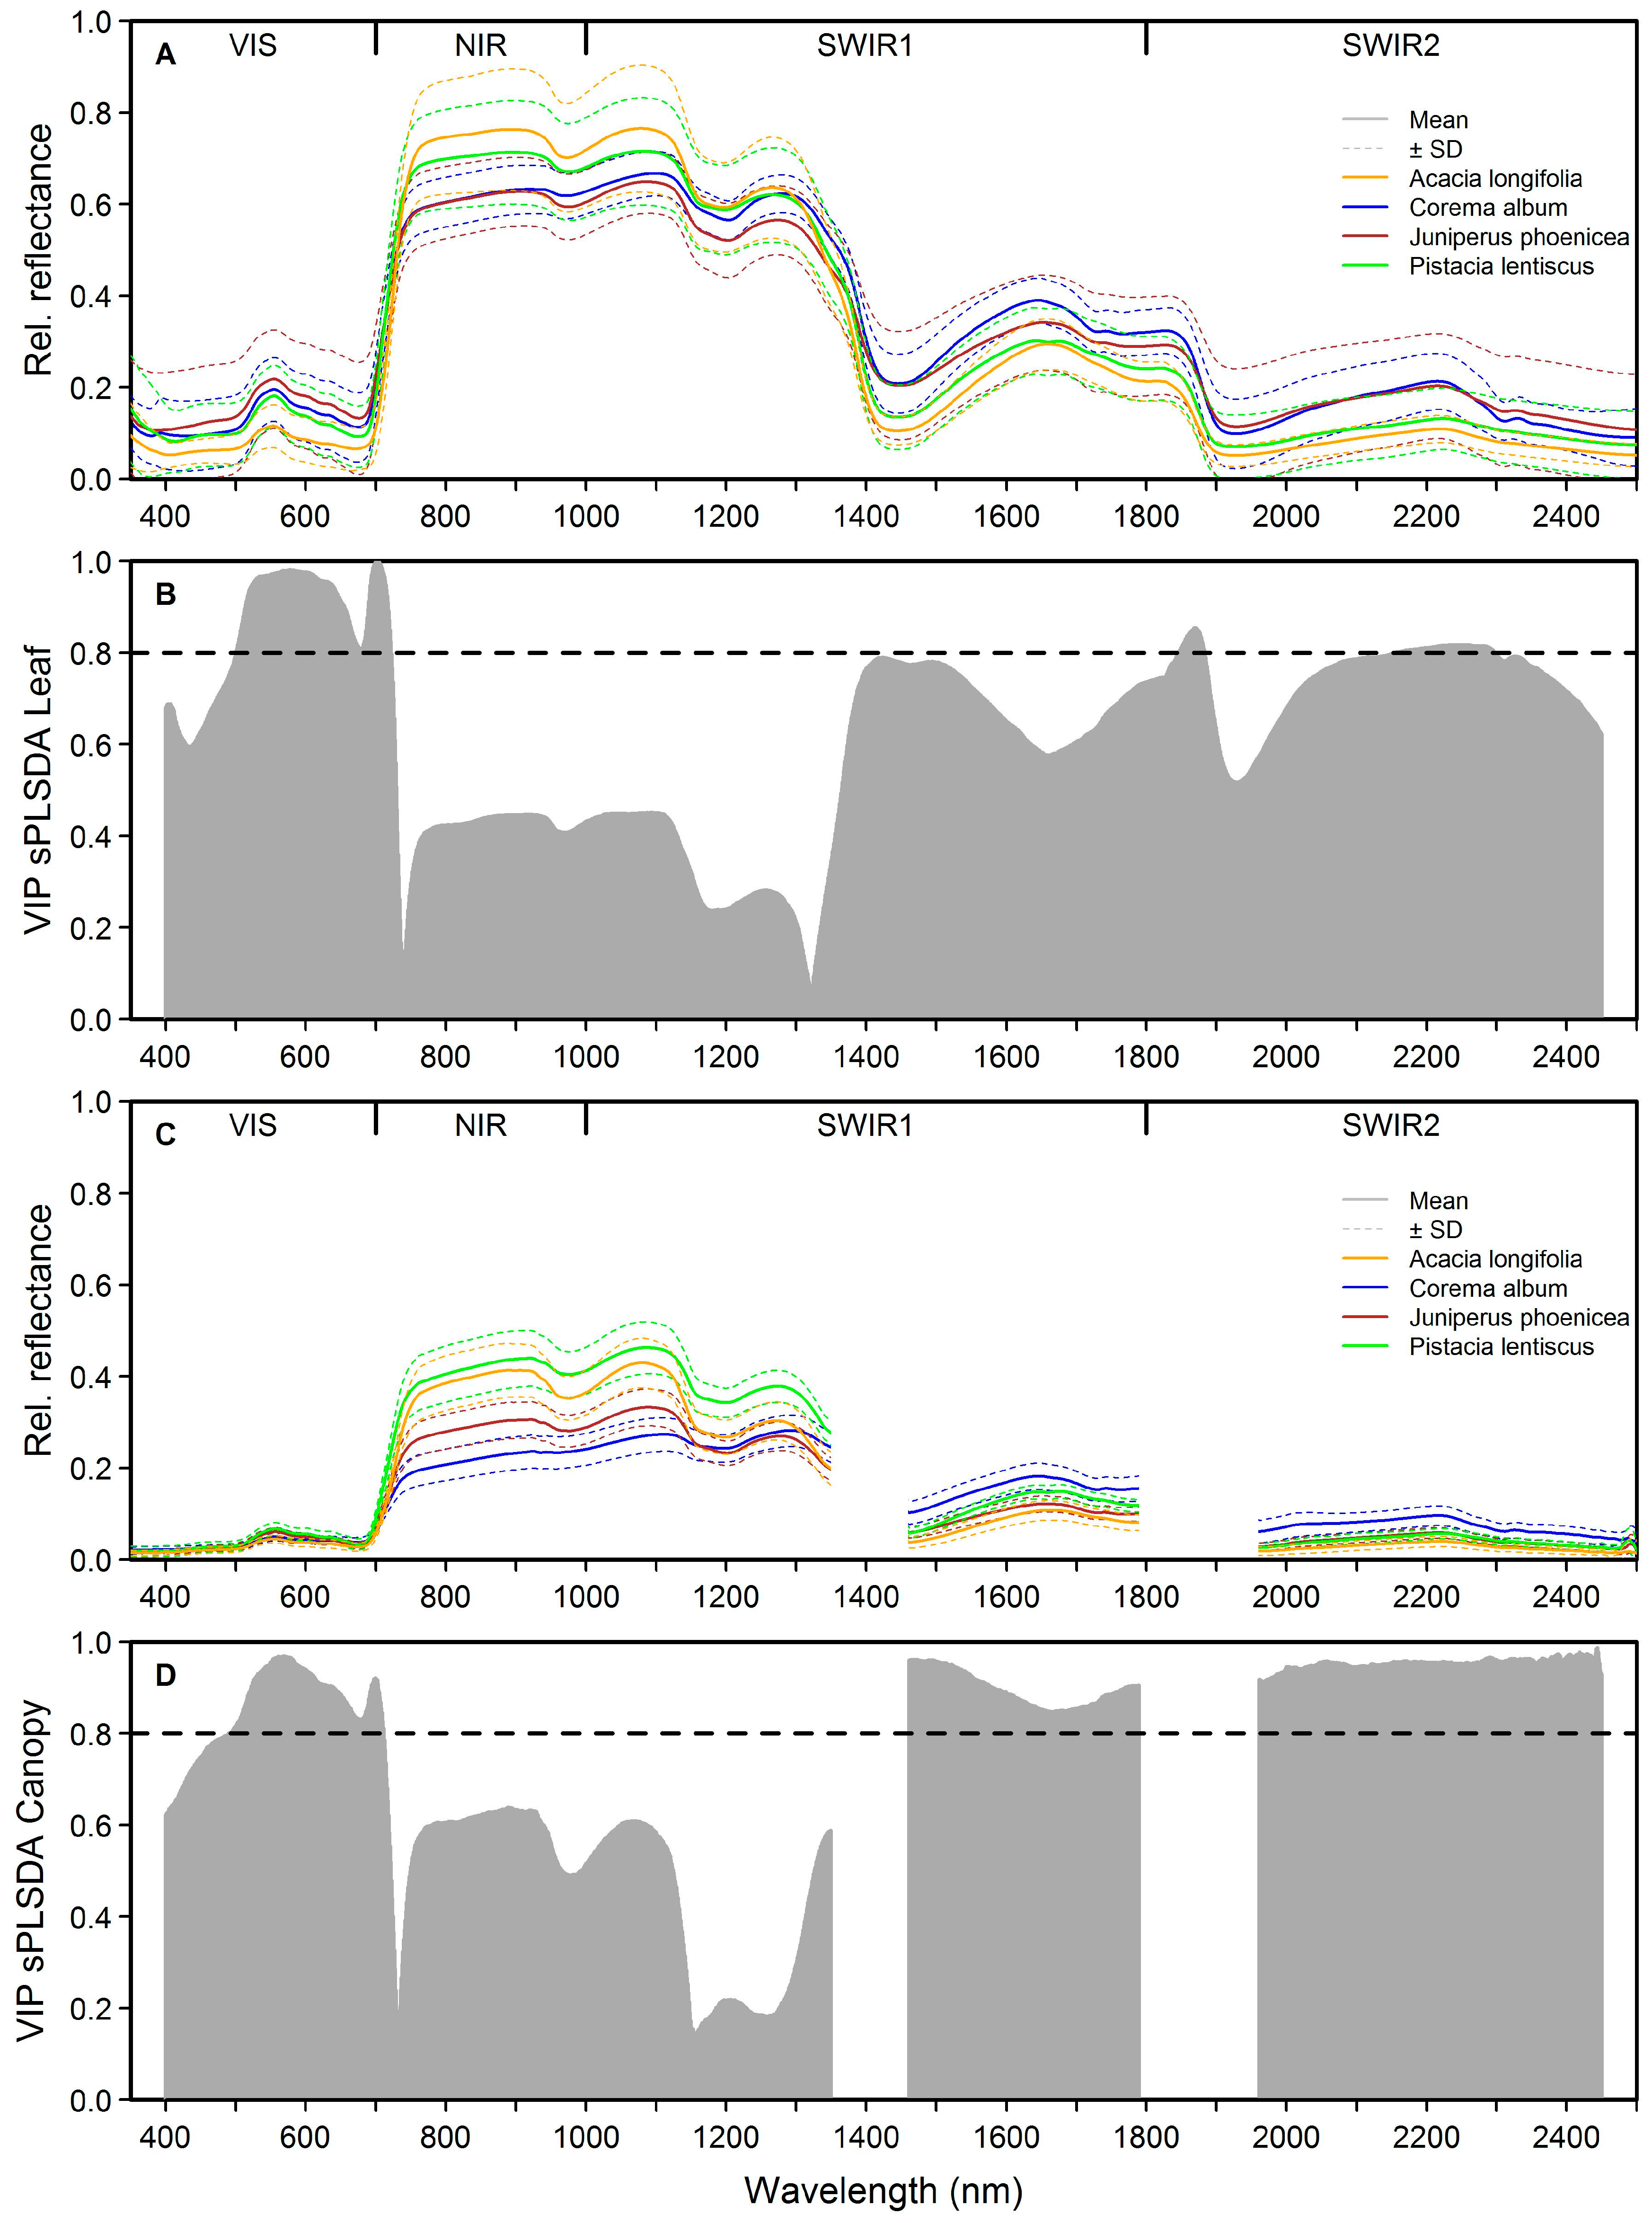
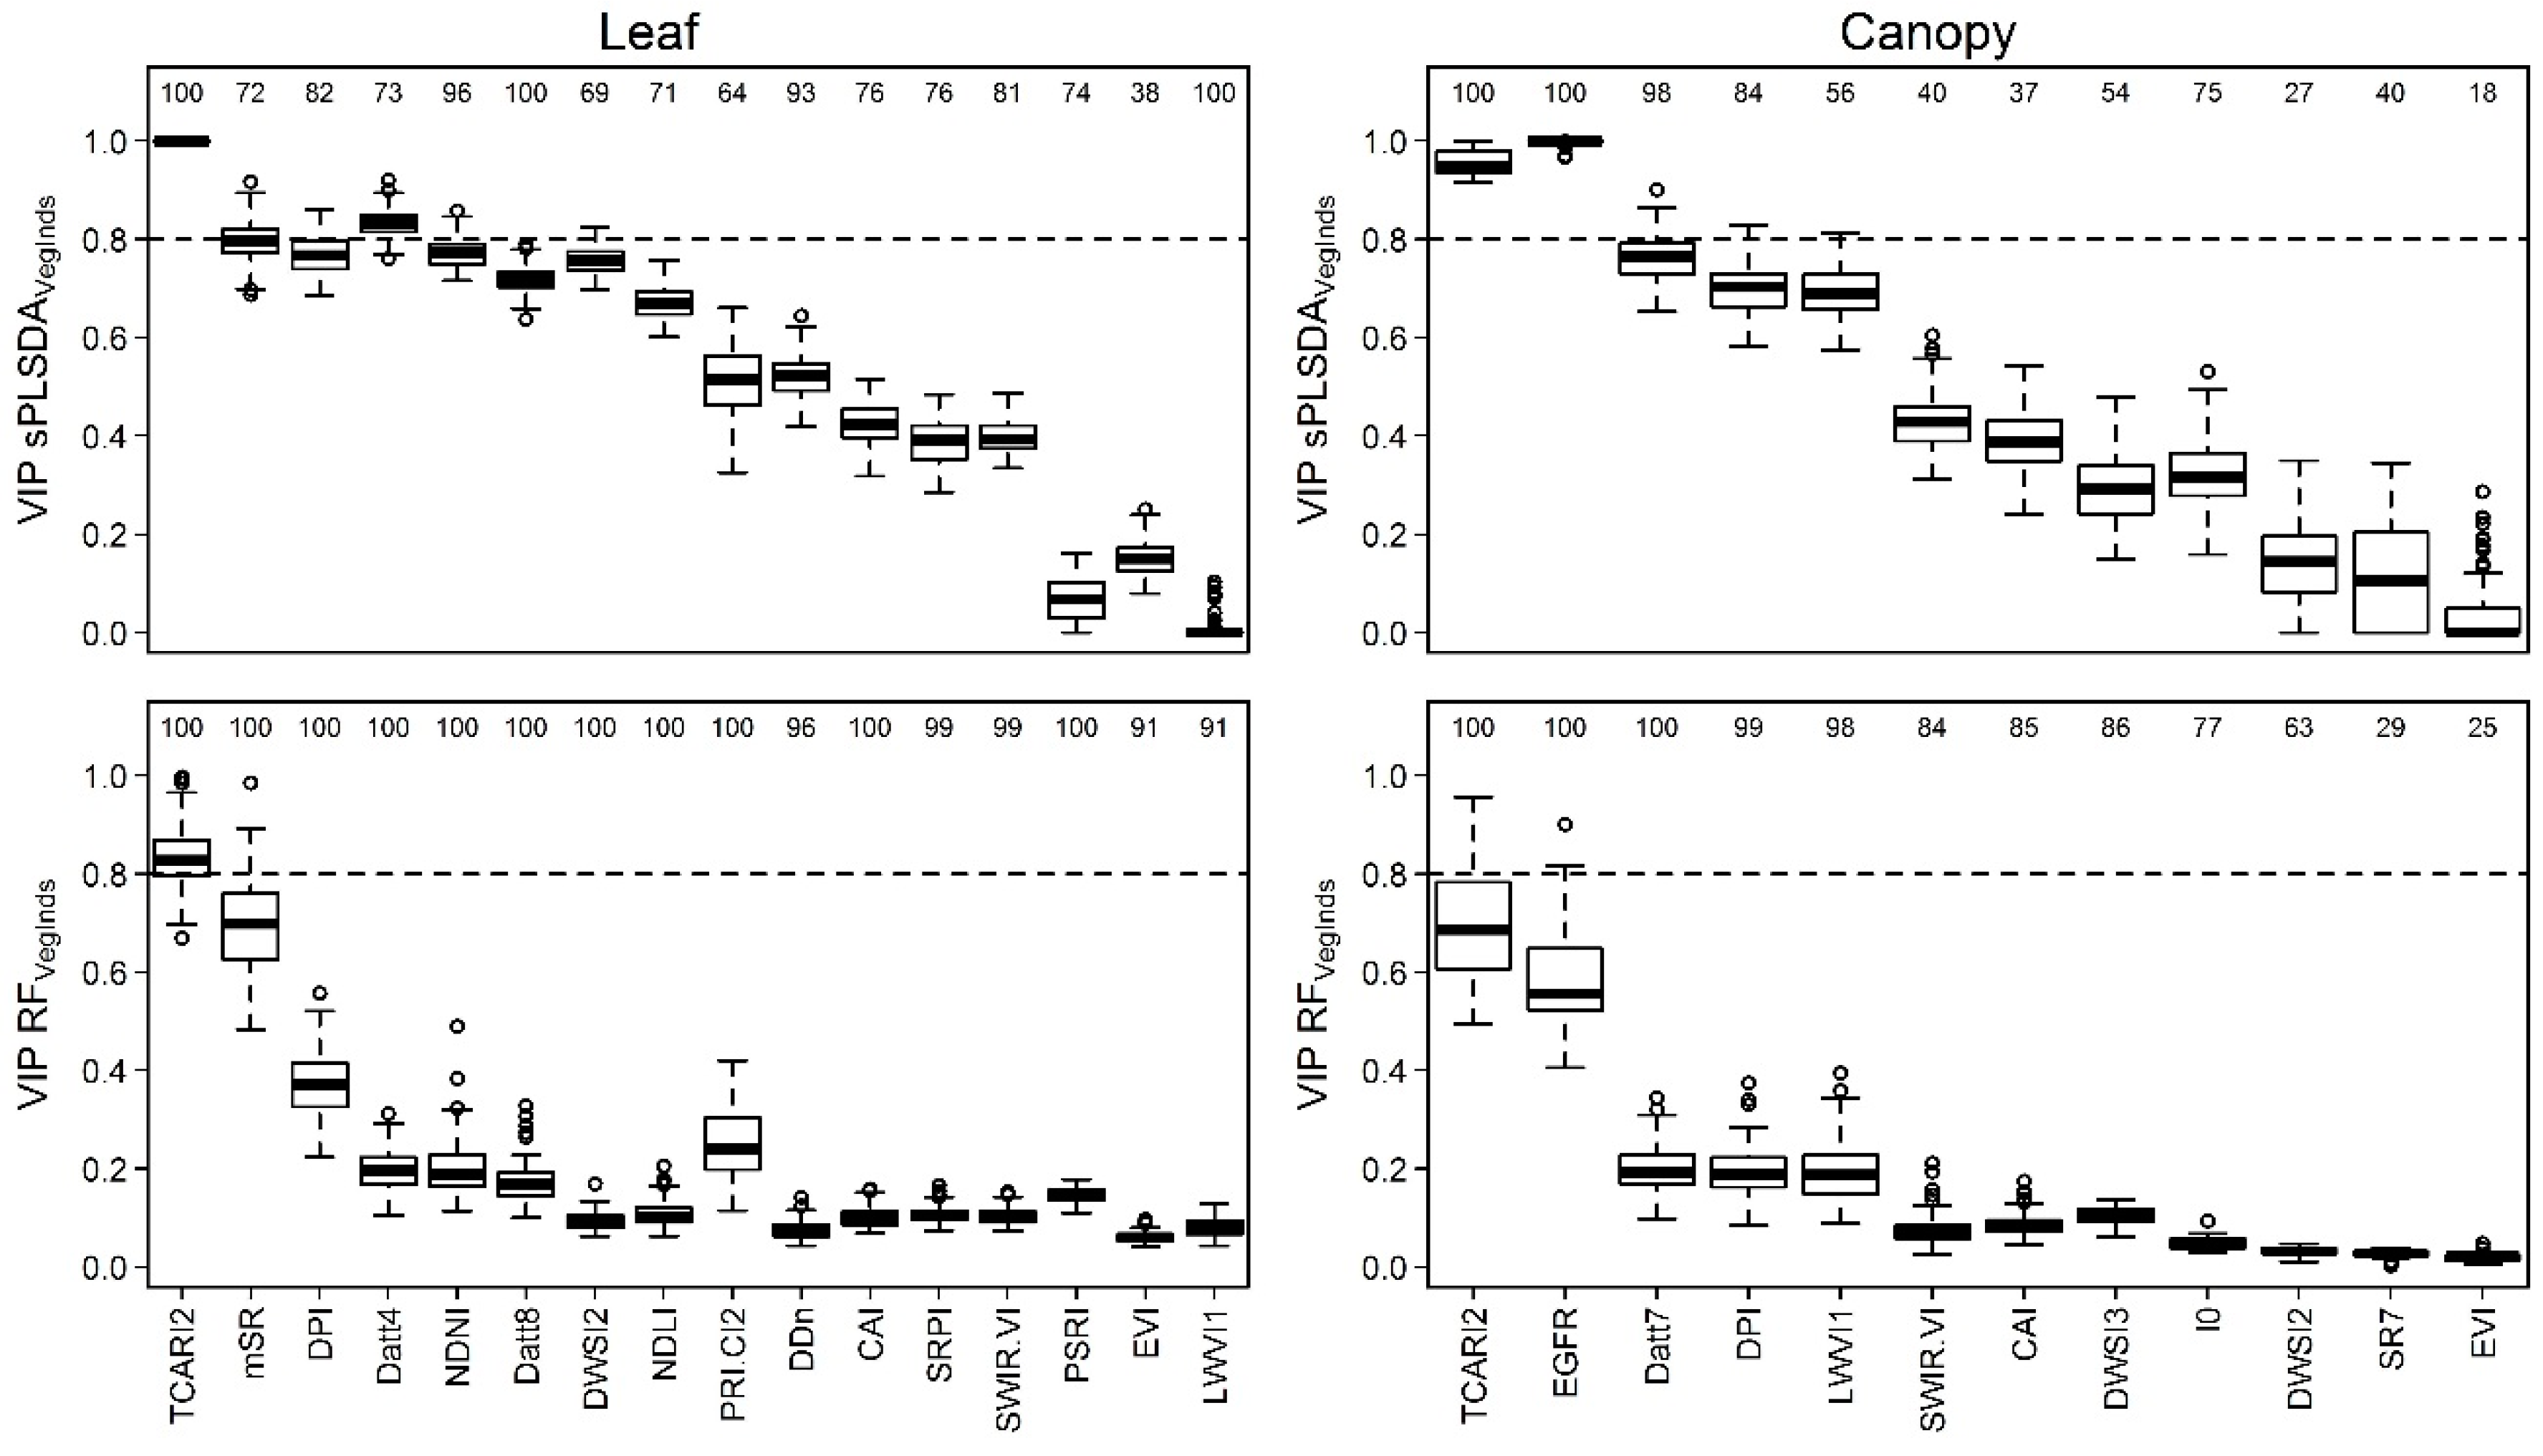
3.4. Identification of the Most Important Variables

Figure 3 shows mean spectra of the target species, A. longifolia, and three native species as well as variable importance (VIP) of classification using the full spectrum (sPLSDAFullSpec) at leaf and canopy level, while the variable importance of vegetation indices for two selected classifiers (sPLSDAVegInds, RFVegInds) is displayed in Figure 4. The mean spectra of A. longifolia and the three selected small and tall shrub species, C. album, P. lentiscus and J. phoenicea, differed. However, the standard deviations indicated overlap among the species.
The number of variables that were important to distinguish A. longifolia from adjacent vegetation varied depending on sampling method and model (Figure 3 and Figure 4). RFVegInds and sPLSDAVegInds used between 4–12 and 2–12 variables, respectively. The VIP and variable frequencies of the predictors differed between sPLSDAVegInds and RFVegInds (Figure 4). For example, in sPLSDAVegInds at canopy level five predictors (TCARI2, EGFR, Datt7, DPI, l0) occurred in more than 75% of the models, and five predictors (TCARI2, EGFR, Datt7, DPI, LWVI1) had a VIP higher than 0.5. RFVegInds had more predictors with a frequency higher than 0.75 (TCARI2, EGFR, Datt7, DPI, LWVI1, SWIR.VI, CAI, DWSI3, l0), but it had only two predictors (TCARI2, EGFR), which had a median VIP of higher than 0.5 (Figure 4). The classifiers showed a similar ranking of the VIPs, but absolute values and selection frequencies differed.
The vegetation indices used as predictors in the classification models both at the leaf and canopy scale were related to a range of biochemical and ecophysiological parameters such as leaf water (LWVI1) and water stress (DWSI2), biomass/LAI (EVI) and vegetation cover (SWIR.VI), cellulose (CAI), and greenness/chlorophyll (TCARI2, DPI). Vegetation indices that were only relevant at the leaf level were mainly related to chlorophyll and pigments. Vegetation indices that were important at the canopy level with significant differences between A. longifolia and the other species were related to greenness (TCARI2, DPI), cellulose (CAI), vegetation cover (SWIR.VI), leaf water content (LWVI1, Datt7) and water or nitrogen stress (EGFR) (Figure A1).

4. Discussion

4.1. Distinguishing Acacia longifolia from Adjacent Vegetation at the Leaf and Canopy Level

Identifying a high-impact invasive species at an early stage of invasion is an important task in conservation ecology. Hyperspectral remote sensing enables invasive species monitoring and predicting invasions at landscape scale. In the present study, we were able to successfully distinguish the Australian tree A. longifolia, an invader with high impact on ecosystem services and functioning in Mediterranean ecosystems [30,31,32,33,44,45,101], at leaf and at canopy level using field spectral data. At the leaf level, the non-linear classifiers SVM and RF achieved the best results in terms of Sensitivity and Positive Predicted Value using a reduced dataset based on vegetation indices. Similar to the leaf level, selecting vegetation indices for species separation based on canopy spectra resulted in higher PPV than using the full spectrum dataset. However, RFVegInds also produced a few extreme outliers possibly due to misclassifications in the highest nodes [19]. Even though RFVegInds did underestimate the number of A. longifolia individuals due to its lower Sensitivity, it revealed the highest reliability as indicated by the highest PPV. As adjacent bands are highly correlated, removing unnecessary bands while maintaining the predictive power of a hyperspectral dataset is an important processing step [102]. The classification accuracy can be increased if only band regions are retained that are linked to important biochemical parameters. For example, it has been shown that at leaf level, using bands related to leaf tannin content were also suitable to distinguish A. longifolia from native and other Acacia species [51]. Moreover, a higher number of bands as predictors requires more observations to achieve the same classification accuracy (“Hughes phenomenon”, e.g., [103]). RF and SVM can achieve higher accuracies when redundant predictors are removed from a high-dimensional dataset [104,105]. In addition, radial basis-function kernel SVMs and RF are less sensitive to the Hughes effect than traditional discriminant classifiers such as LDA [102,106]. While LDA, for example, requires regularization to reach high accuracies [107], SVMs and RF are state-of-the-art classifiers for hyperspectral data when their parameters are optimized properly [106,107]. Therefore, at both scales, applying vegetation indices using a non-linear classifier that can deal with high-dimensional data provides an efficient method to extract meaningful information and to achieve an optimized and balanced ratio of Sensitivity and PPV.

4.2. Identifying the Optimal Classifier

The definition of the best classifier in a comparative approach depends on the selected accuracy measure. For invasive species detection and management, a compromise between Sensitivity and PPV has to be made (e.g., [108]). In our case, at the canopy scale, for example, the highest Sensitivity and, thus, the highest detection rate of A. longifolia was reached by sPLSDAFullSpec,VegInds and HDDAVegInds, but at the expense of a relatively high amount of false positives. Hence, in cases where the reliability of results is an important selection criterion and false detection is not acceptable, RFVegInds would deliver the best classification accuracy. This may be the case, e.g., for reporting cover values of invasive species in monitoring networks, where reliable distribution data are required to decide on management priorities and strategies. In contrast, other approaches such as screening studies of early warning systems aiming at detection of early stages of invasion require the identification of every single invasive individual. In this case, false detection may be acceptable and HDDAVegInds would provide the better alternative. Therefore, the choice of classifier and accuracy measure depends on the management objective.
The performance of SVM (leaf scale) and RF (both scales) agrees well with recent studies of plant species discrimination [16,19] including a recent meta-study comparing a large set of classification algorithms [75]. However, accuracy can also depend on the species combination rather than the algorithm [108], and classifier performance can vary between functional groups [23]. There are clear differences between classifiers regarding accuracy while using the same species combination. Therefore, for diverse ecosystems such as Mediterranean-type systems covering species with different leaf types presented here and elsewhere [23], an extensive spectral library is required to find the best possible model for a reliable classification result.

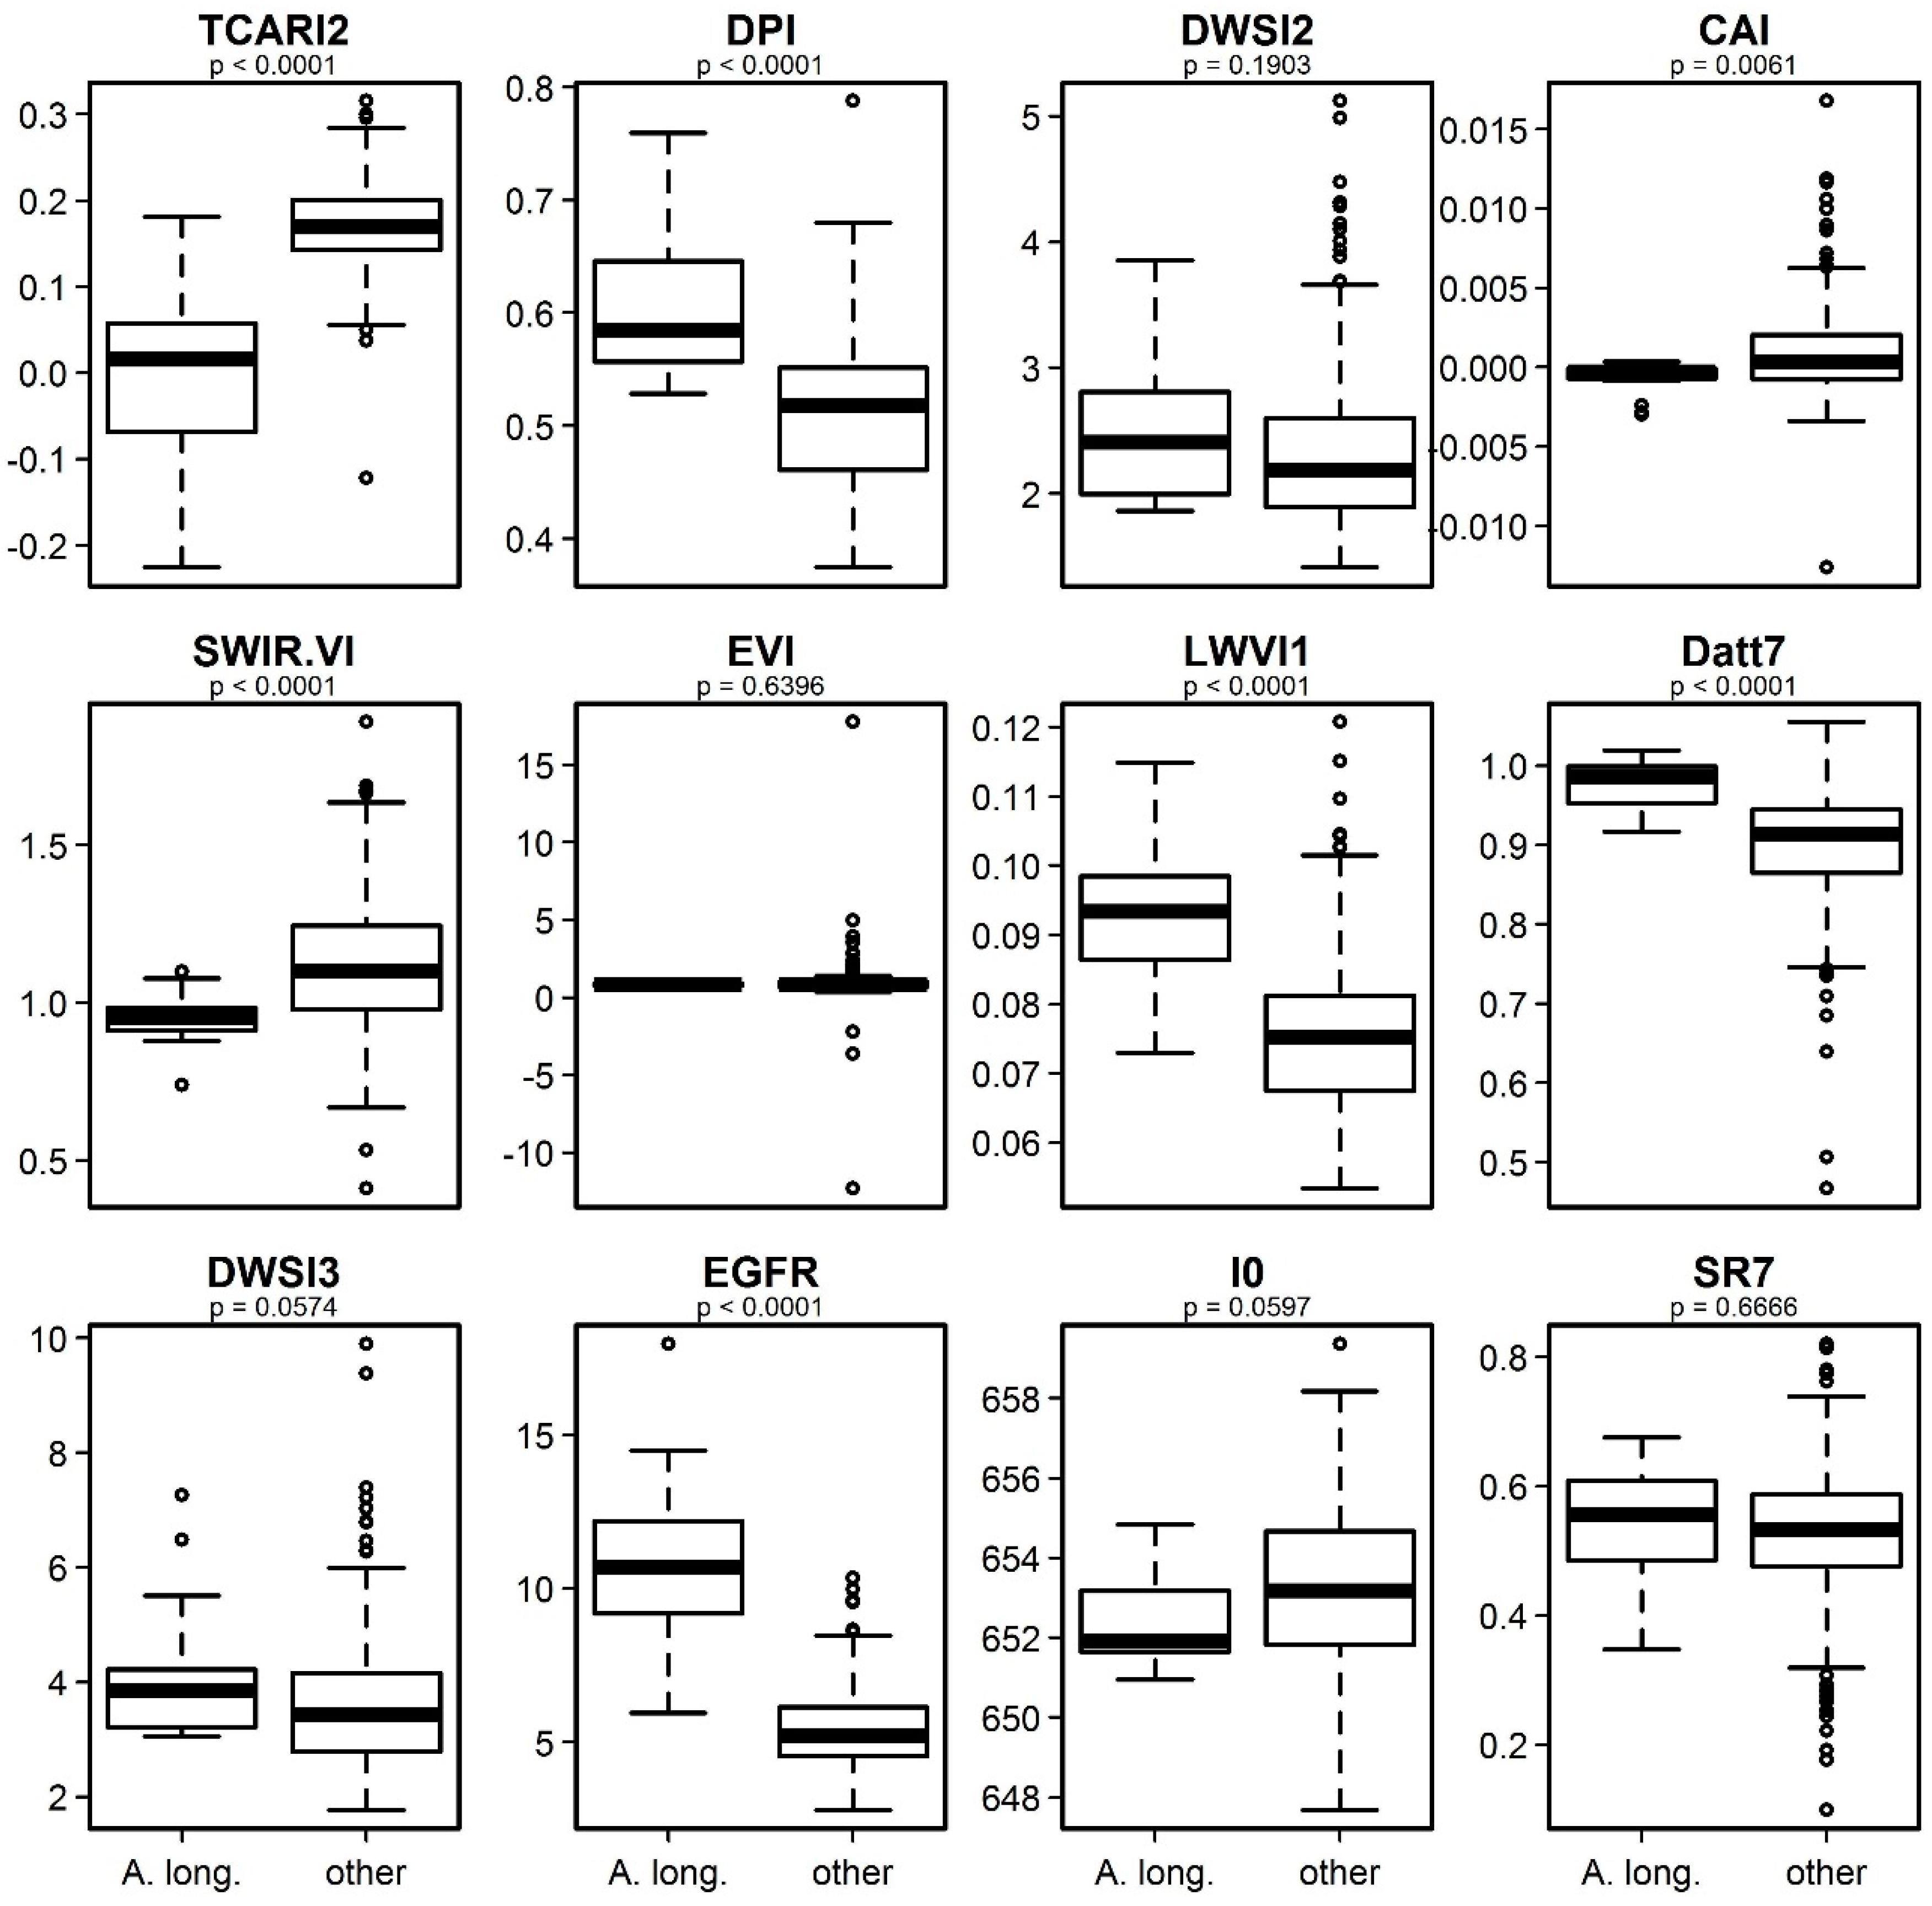
4.3. Interpretation of the Relevant Vegetation Indices for Identifying Acacia longifolia at the Canopy Level

The spectral information at the canopy level is most relevant for further comparison with airborne or satellite remote sensing data. Several species-specific characteristics such as leaf chemistry, canopy structure as well as litter and soil parameters are combined in the canopy spectrum (e.g., [6,23]). Here, vegetation indices related to chlorophyll, cellulose, water, vegetation cover, and nitrogen stress differed significantly between A. longifolia and other species, and provided important predictors to distinguish the invader. These indices were the Transformed Chlorophyll Absorption Ratio Index (TCARI2), the Cellulose Absorption Index (CAI), the Double Peak Index (DPI), the Leaf Water Vegetation Index (LWVI1), water content (Datt7), the Shortwave-Infrared Vegetation Index (SWIR.VI) and Edge-Green First Derivative Ratio (EGRF). This agrees partly with Oldeland et al. [109] who mapped Acacia encroachment (Acacia mellifera (Vahl) Benth., Acacia reficiens Wawra and Acacia hebeclada DC.) in a semi-arid ecosystem based on hyperspectral HyMap imagery using vegetation indices related to chlorophyll (CARI), greenness (DGVI), water (LWVI1), lignin (NDLI), nitrogen (NDNI), and cellulose (CAI).
In both studies, indices related to chlorophyll, leaf water and cellulose were important to distinguish Acacia. However, additional indices related to water (Datt7, EGFR), nitrogen limitation (EGFR), physiology (DPI) and vegetation cover (SWIR.VI) turned out to be important in our study, whereas Oldeland et al. [109] chose indices in the SWIR region related to lignin and nitrogen content (NDNI, NDLI), and parameters related to the red edge region were absent. Thus, a similar though slightly different set of indices enabled the successful identification of several Acacia species.
Groundwater availability and adaptation to drought are possibly important factors that influence spectral shapes and affect spectral separability of species in this ecosystem [23]. The fact that the majority of important indices was related to physiology and water content could be due to the sampling season and potentially indicates a different adaptation strategy of A. longifolia to environmental conditions [45,55]. Acacia longifolia is known to be a water-spending species, and it increases the stand transpiration while decreasing the water availability for co-occurring species [45]. In contrast to native dune species, A. longifolia shows only little stomatal control of water use [55] and it maintains a high use of resources under drought conditions, which is a novel trait in the studied dune ecosystems [42,45]. The question if and how invasive species handle water stress is highly relevant under climate change scenarios in Mediterranean ecosystems [110]. Thus, selecting vegetation indices can both increase classification accuracy and reveal the invader’s adaptation strategies to drought.
Regarding the TCARI2 and DPI indices at the canopy level, A. longifolia was distinguishable by its higher chlorophyll content. Similarly, greenness was found to be an important factor discriminating the invasive Arundo donax L. from adjacent riparian vegetation in Portugal, as it produced new fresh green leaves when water was available during the vegetative period [14]. Acacia longifolia, too, has a high growth rate and extended growth period [42,55], efficient nutrient acquisition [41] and high transpiration rates [45] while having a different leaf type (large phyllodes) compared to native species in this dune ecosystem [23,111]. This was reflected in the slightly, but significantly lower CAI value for A. longifolia which can be related to less dry, non-photosynthetically active plant material in the canopy [83,112]. In contrast to directly selecting one specific biochemical parameter, e.g., leaf tannin content [51], our data mining approach identified suitable vegetation indices from a large set of easily produced predictors. It enabled a robust and quick classification of the invasive plant A. longifolia, and gave insights into biochemical, biophysical and ecophysiological traits.

5. Conclusions

We showed that the high-impact invasive species A. longifolia can be distinguished at leaf and canopy level using vegetation indices derived from field spectral data in the studied Natura 2000 protected Mediterranean dune ecosystem. The best results in terms of a high detection and a high reliability were achieved by using non-linear classifiers that can deal with the Hughes effect based on vegetation indices. Thus, there is high potential for mapping the invader at airborne and satellite level using multispectral and hyperspectral sensors. Apart from increasing classification accuracy, choosing vegetation indices gave insights into the adaptation strategy of the water-spending invader in this semi-arid ecosystem. Multi seasonal studies could further explore the best time frame for mapping as seasonal variation of biochemical, biophysical and ecophysiological parameters may affect the spectral separability. The spectral library delivers baseline information that could be extended further for multiclass approaches to give insights into the separability of other important species such as other invaders, endemic species, or those protected by national and international legislation. Moreover, regional scale, high-resolution mapping of the invader may enable quantification of invasive status of pristine ecosystems, prediction of future invasions and identifications of areas of high-conservation value.

Acknowledgments

We are thankful for the funding provided for this study by DFG (TH 1295/4-1, OL 417/1-1, WE 2681/8-1), DAAD (field studies A.G.S.), “Studienstiftung des Deutschen Volkes” (Fellowship C.H.), and EUFAR (DeInVader, EUFAR11-06). This study contributes to the project “INSPECTED.NET” funded by the European Union’s Seventh Framework Programme FP7-PEOPLE-2010-IRSES (Proposal No. 269206). We also would like to thank the ICNF Portugal and the Estabelecimento Prisional de Pinheiro da Cruz (EPPC), Portugal, for granting site permission, Cristina Máguas for logistic support, Manuel João Pinto for helping in plant species identification, Péter Burai and Csaba Lénárt for assisting in the field and for providing the spectrometer in 2011, Marius Appel for IT support as well as Jeannine Böhmichen, Jan Lehmann, Jörg Lüling and Tercia Vargas for assisting during field work. We also thank the four anonymous reviewers whose comments and suggestions helped improve and clarify this manuscript.

Author Contributions

A.G.S. and J.O. conceived and designed the study. A.G.S., J.O., C.H. and J.T. performed the field sampling. A.G.S., J.T. and J.O. processed and analyzed that data. A.G.S. wrote the first draft of the manuscript and all authors contributed substantially to revisions.

Conflicts of Interest

The authors declare no conflict of interest.

Appendix

Figure A1. Boxplots of the vegetation indices used at canopy level to distinguish Acacia longifolia (“A. long.”) from other exotic and native dune species (“other”). p-values from U-Test testing for differences between the two groups are given.
Remotesensing 08 00334 g005

References

  1. Pyšek, P.; Jarošík, V.; Hulme, P.E.; Pergl, J.; Hejda, M.; Schaffner, U.; Vilà, M. A global assessment of invasive plant impacts on resident species, communities and ecosystems: The interaction of impact measures, invading species’ traits and environment. Glob. Change Biol. 2012, 18, 1725–1737. [Google Scholar] [CrossRef]
  2. Vilà, M.; Basnou, C.; Pyšek, P.; Josefsson, M.; Genovesi, P.; Gollasch, S.; Nentwig, W.; Olenin, S.; Roques, A.; Roy, D.; et al. How well do we understand the impacts of alien species on ecosystem services? A pan-European, cross-taxa assessment. Front. Ecol. Environ. 2010, 8, 135–144. [Google Scholar] [CrossRef] [Green Version]
  3. He, K.S.; Rocchini, D.; Neteler, M.; Nagendra, H. Benefits of hyperspectral remote sensing for tracking plant invasions: Plant invasion and hyperspectral remote sensing. Divers. Distrib. 2011, 17, 381–392. [Google Scholar] [CrossRef]
  4. Huang, C.; Asner, G.P. Applications of remote sensing to alien invasive plant studies. Sensors 2009, 9, 4869–4889. [Google Scholar] [CrossRef] [PubMed]
  5. Rocchini, D.; Andreo, V.; Förster, M.; Garzon-Lopez, C.X.; Gutierrez, A.P.; Gillespie, T.W.; Hauffe, H.C.; He, K.S.; Kleinschmit, B.; Mairota, P.; et al. Potential of remote sensing to predict species invasions: A modelling perspective. Prog. Phys. Geogr. 2015, 39, 283–309. [Google Scholar] [CrossRef]
  6. Asner, G.P.; Wessman, C.A.; Bateson, C.; Privette, J.L. Impact of tissue, canopy, and landscape factors on the hyperspectral reflectance variability of arid ecosystems. Remote Sens. Environ. 2000, 74, 69–84. [Google Scholar] [CrossRef]
  7. Clark, M.; Roberts, D.; Clark, D. Hyperspectral discrimination of tropical rain forest tree species at leaf to crown scales. Remote Sens. Environ. 2005, 96, 375–398. [Google Scholar] [CrossRef]
  8. Clark, M.L.; Roberts, D.A. Species-Level differences in hyperspectral metrics among tropical rainforest trees as determined by a tree-based classifier. Remote Sens. 2012, 4, 1820–1855. [Google Scholar] [CrossRef]
  9. Féret, J.-B.; Asner, G.P. Spectroscopic classification of tropical forest species using radiative transfer modeling. Remote Sens. Environ. 2011, 115, 2415–2422. [Google Scholar] [CrossRef]
  10. Kalacska, M.; Bohlman, S.; Sanchez-Azofeifa, G.A.; Castro-Esau, K.; Caelli, T. Hyperspectral discrimination of tropical dry forest lianas and trees: Comparative data reduction approaches at the leaf and canopy levels. Remote Sens. Environ. 2007, 109, 406–415. [Google Scholar] [CrossRef]
  11. Roberts, D.A.; Ustin, S.L.; Ogunjemiyo, S.; Greenberg, J.; Dobrowski, S.Z.; Chen, J.; Hinckley, T.M. Spectral and structural measures of northwest forest vegetation at leaf to landscape scales. Ecosystems 2004, 7, 545–562. [Google Scholar] [CrossRef]
  12. Burkholder, A.; Warner, T.A.; Culp, M.; Landenberger, R. Seasonal trends in separability of leaf reflectance spectra for Ailanthus altissima and four other tree species. Photogramm. Eng. Remote Sens. 2011, 77, 793–804. [Google Scholar] [CrossRef]
  13. Taylor, S.L.; Hill, R.A.; Edwards, C. Characterising invasive non-native Rhododendron ponticum spectra signatures with spectroradiometry in the laboratory and field: Potential for remote mapping. ISPRS J. Photogramm. Remote Sens. 2013, 81, 70–81. [Google Scholar] [CrossRef]
  14. Fernandes, M.R.; Aguiar, F.C.; Silva, J.M.N.; Ferreira, M.T.; Pereira, J.M.C. Spectral discrimination of giant reed (Arundo donax L.): A seasonal study in riparian areas. ISPRS J. Photogramm. Remote Sens. 2013, 80, 80–90. [Google Scholar] [CrossRef]
  15. Ouyang, Z.-T.; Gao, Y.; Xie, X.; Guo, H.-Q.; Zhang, T.-T.; Zhao, B. Spectral discrimination of the invasive plant Spartina alterniflora at multiple phenological stages in a saltmarsh wetland. PLoS ONE 2013, 8, e67315. [Google Scholar] [CrossRef] [PubMed]
  16. Fassnacht, F.E.; Neumann, C.; Forster, M.; Buddenbaum, H.; Ghosh, A.; Clasen, A.; Joshi, P.K.; Koch, B. Comparison of feature reduction algorithms for classifying tree species with hyperspectral data on three central European test sites. IEEE J. Sel. Top. Appl. Earth Obs. Remote Sens. 2014, 7, 2547–2561. [Google Scholar] [CrossRef]
  17. Somers, B.; Asner, G.P. Multi-temporal hyperspectral mixture analysis and feature selection for invasive species mapping in rainforests. Remote Sens. Environ. 2013, 136, 14–27. [Google Scholar] [CrossRef]
  18. Tits, L.; De Keersmaecker, W.; Somers, B.; Asner, G.P.; Farifteh, J.; Coppin, P. Hyperspectral shape-based unmixing to improve intra- and interclass variability for forest and agro-ecosystem monitoring. ISPRS J. Photogramm. Remote Sens. 2012, 74, 163–174. [Google Scholar] [CrossRef]
  19. Prospere, K.; McLaren, K.; Wilson, B. Plant species discrimination in a tropical wetland using in situ hyperspectral data. Remote Sens. 2014, 6, 8494–8523. [Google Scholar] [CrossRef]
  20. Thenkabail, P.S.; Mariotto, I.; Gumma, M.K.; Middleton, E.M.; Landis, D.R.; Huemmrich, K.F. Selection of hyperspectral narrowbands (HNBs) and composition of hyperspectral twoband vegetation indices (HVIs) for biophysical characterization and discrimination of crop types using field reflectance and Hyperion/EO-1 Data. IEEE J. Sel. Top. Appl. Earth Obs. Remote Sens. 2013, 6, 427–439. [Google Scholar] [CrossRef]
  21. Castro-Esau, K. Discrimination of lianas and trees with leaf-level hyperspectral data. Remote Sens. Environ. 2004, 90, 353–372. [Google Scholar] [CrossRef]
  22. Hostert, P.; Swayne, F.; Cohen, W.B.; Chipman, J. The role of remote sensing in LTER Projects. In Long-Term Ecological Research; Müller, F., Baessler, C., Schubert, H., Klotz, S., Eds.; Springer: Dordrecht, NL, USA, 2010; pp. 131–142. [Google Scholar]
  23. Jiménez, M.; Díaz-Delgado, R. Towards a standard plant species spectral library protocol for vegetation mapping: A case study in the shrubland of Doñana National Park. ISPRS Int. J. Geo-Inf. 2015, 4, 2472–2495. [Google Scholar] [CrossRef]
  24. Ghosh, A.; Joshi, P.K. A comparison of selected classification algorithms for mapping bamboo patches in lower Gangetic plains using very high resolution WorldView 2 imagery. Int. J. Appl. Earth Obs. Geoinf. 2014, 26, 298–311. [Google Scholar] [CrossRef]
  25. Vaiphasa, C.; Skidmore, A.K.; de Boer, W.F.; Vaiphasa, T. A hyperspectral band selector for plant species discrimination. ISPRS J. Photogramm. Remote Sens. 2007, 62, 225–235. [Google Scholar] [CrossRef]
  26. Heim, R.; Jürgens, N.; Große-Stoltenberg, A.; Oldeland, J. The effect of epidermal structures on leaf spectral signatures of ice plants (Aizoaceae). Remote Sens. 2015, 7, 16901–16914. [Google Scholar] [CrossRef]
  27. Dalponte, M.; Bruzzone, L.; Vescovo, L.; Gianelle, D. The role of spectral resolution and classifier complexity in the analysis of hyperspectral images of forest areas. Remote Sens. Environ. 2009, 113, 2345–2355. [Google Scholar] [CrossRef]
  28. Bouveyron, C.; Girard, S.; Schmid, C. High-Dimensional discriminant analysis. Commun. Stat. Theory Methods 2007, 36, 2607–2623. [Google Scholar] [CrossRef]
  29. Richardson, D.M.; Carruthers, J.; Hui, C.; Impson, F.A.C.; Miller, J.T.; Robertson, M.P.; Rouget, M.; Le Roux, J.J.; Wilson, J.R.U. Human-mediated introductions of Australian acacias—A global experiment in biogeography: Wattles: A model group for invasion science. Divers. Distrib. 2011, 17, 771–787. [Google Scholar] [CrossRef]
  30. Hellmann, C.; Sutter, R.; Rascher, K.G.; Máguas, C.; Correia, O.; Werner, C. Impact of an exotic N2-fixing Acacia on composition and N status of a native Mediterranean community. Acta Oecol. 2011, 37, 43–50. [Google Scholar] [CrossRef]
  31. Marchante, E.; Kjøller, A.; Struwe, S.; Freitas, H. Short- and long-term impacts of Acacia longifolia invasion on the belowground processes of a Mediterranean coastal dune ecosystem. Appl. Soil Ecol. 2008, 40, 210–217. [Google Scholar] [CrossRef]
  32. Marchante, H.; Marchante, E.; Freitas, H.; Hoffmann, J.H. Temporal changes in the impacts on plant communities of an invasive alien tree, Acacia longifolia. Plant Ecol. 2015, 216, 1481–1498. [Google Scholar] [CrossRef]
  33. Rascher, K.G.; Große-Stoltenberg, A.; Máguas, C.; Meira-Neto, J.A.A.; Werner, C. Acacia longifolia invasion impacts vegetation structure and regeneration dynamics in open dunes and pine forests. Biol. Invasions 2011, 13, 1099–1113. [Google Scholar] [CrossRef]
  34. Calviño-Cancela, M.; Méndez-Rial, R.; Reguera-Salgado, J.; Martín-Herrero, J. Alien plant monitoring with ultralight airborne imaging spectroscopy. PLoS ONE 2014, 9, e102381. [Google Scholar]
  35. Sociedade Portuguesa de Botânica. Flora-On: Flora de Portugal Interactiva. Available online: http://www.flora-on.pt/ (accessed on 27 November 2015).
  36. Guedes, A.; Ribeiro, H.; Valentim, B.; Rodrigues, A.; Sant’Ovaia, H.; Abreu, I.; Noronha, F. Characterization of soils from the Algarve region (Portugal): A multidisciplinary approach for forensic applications. Sci. Justice 2011, 51, 77–82. [Google Scholar] [CrossRef] [PubMed]
  37. Global Invasive Species Database. Distribution of Acacia longifolia. Available online: http://www.issg.org/database/species/distribution.asp?si=1662&fr=1&sts=sss&lang=EN (accessed on 19 January 2016).
  38. Richardson, D.M.; Le Roux, J.J.; Wilson, J.R. Australian acacias as invasive species: Lessons to be learnt from regions with long planting histories. South. For. J. For. Sci. 2015, 77, 31–39. [Google Scholar] [CrossRef]
  39. Instituto Hórus de Desenvolvimento e Conservação Ambiental. Base de Dados Nacional de Espécies Exóticas Invasoras I3N Brasil. Available online: http://i3n.institutohorus.org.br/www (accessed on 19 January 2016).
  40. Alberio, C.; Comparatore, V. Patterns of woody plant invasion in an Argentinean coastal grassland. Acta Oecol. 2014, 54, 65–71. [Google Scholar] [CrossRef]
  41. Werner, C.; Peperkorn, R.; Máguas, C.; Beyschlag, W. Competitive balance between the alien invasive Acacia longifolia and native Mediterranean species. In Plant Invasions: Human perception, Ecological Impacts and Management; Tokarska-Guzik, B., Brock, J.H., Brundu, G., Child, L., Daehler, C.C., Pyšek, P., Eds.; Backhuys Publishers: Leiden, The Netherlands, 2008; pp. 261–275. [Google Scholar]
  42. Peperkorn, R.; Werner, C.; Beyschlag, W. Phenotypic plasticity of an invasive acacia versus two native Mediterranean species. Funct. Plant Biol. 2005, 32, 933–944. [Google Scholar] [CrossRef]
  43. Marchante, H.; Marchante, E.; Freitas, H. Invasion of the Portuguese dune ecosystems by the exotic species Acacia longifolia (Andrews) Willd: Effects at the community level. In Plant Invasions: Ecological Threats and Management Solutions; Child, L.E., Brock, J.H., Brundu, G., Prach, K., Pyšek, P., Wade, P., Williamson, M., Eds.; Backhuys Publishers: Leiden, The Netherlands, 2003; pp. 75–85. [Google Scholar]
  44. Rascher, K.G.; Hellmann, C.; Máguas, C.; Werner, C. Community scale 15N isoscapes: Tracing the spatial impact of an exotic N2-fixing invader: Community scale isoscapes. Ecol. Lett. 2012, 15, 484–491. [Google Scholar] [CrossRef] [PubMed]
  45. Rascher, K.G.; Große-Stoltenberg, A.; Máguas, C.; Werner, C. Understory invasion by Acacia longifolia alters the water balance and carbon gain of a Mediterranean pine forest. Ecosystems 2011, 14, 904–919. [Google Scholar] [CrossRef]
  46. Marchante, H.; Freitas, H.; Hoffmann, J.H. The potential role of seed banks in the recovery of dune ecosystems after removal of invasive plant species: The potential role of seed-banks in the recovery of dune ecosystems. Appl. Veg. Sci. 2011, 14, 107–119. [Google Scholar] [CrossRef]
  47. Instituto da Conservação da Natureza e da Biodiversidade. Sítio Comporta/Galé; Plano Sectorial da Rede Natura 2000; Instituto da Conservação da Natureza e da Biodiversidade: Lisbon, Portugal, 2005. [Google Scholar]
  48. European Topic Centre on Biological Diversity. Mediterranean Terrestrial Region. Reference List; European Topic Centre on Biological Diversity: Paris, France, 2015. [Google Scholar]
  49. Pinto, M.J. Guia das Plantas e dos Ecossistemas da Reserva Natural das Lagoas de Santo André e da Sancha; Instituto da Conservação da Natureza e das Florestas (ICNF): Lisbon, Portugal, 2014. [Google Scholar]
  50. Hellmann, C.; Große-Stoltenberg, A.; Lauströer, V.; Oldeland, J.; Werner, C. Retrieving nitrogen isotopic signatures from fresh leaf reflectance spectra: Disentangling δ15N from biochemical and structural leaf properties. Front. Plant Sci. 2015, 6, 307. [Google Scholar] [CrossRef] [PubMed]
  51. Lehmann, J.; Große-Stoltenberg, A.; Römer, M.; Oldeland, J. Field spectroscopy in the VNIR-SWIR region to discriminate between Mediterranean native plants and exotic-invasive shrubs based on leaf tannin content. Remote Sens. 2015, 7, 1225–1241. [Google Scholar] [CrossRef] [Green Version]
  52. ASD Inc. FieldSpec4 User Manual; ASD Inc., a PANalytical Company: Boulder, CO, USA, 2015. [Google Scholar]
  53. Foley, S.; Rivard, B.; Sanchezazofeifa, G.; Calvo, J. Foliar spectral properties following leaf clipping and implications for handling techniques. Remote Sens. Environ. 2006, 103, 265–275. [Google Scholar] [CrossRef]
  54. Pimstein, A.; Notesco, G.; Ben-Dor, E. Performance of three identical spectrometers in retrieving soil reflectance under laboratory conditions. Soil Sci. Soc. Am. J. 2011, 75, 746–759. [Google Scholar] [CrossRef]
  55. Máguas, C.; Rascher, K.G.; Martins-Loução, A.; Carvalho, P.; Pinho, P.; Ramos, M.; Correia, O.; Werner, C. Responses of woody species to spatial and temporal ground water changes in coastal sand dune systems. Biogeosciences 2011, 8, 3823–3832. [Google Scholar] [CrossRef]
  56. De Jong, S.M.; Addink, E.A.; Hoogenboom, P.; Nijland, W. The spectral response of Buxus sempervirens to different types of environmental stress—A laboratory experiment. ISPRS J. Photogramm. Remote Sens. 2012, 74, 56–65. [Google Scholar] [CrossRef]
  57. Liew, O.W.; Chong, P.C.J.; Li, B.; Asundi, A.K. Signature optical cues: Emerging technologies for monitoring plant health. Sensors 2008, 8, 3205–3239. [Google Scholar] [CrossRef]
  58. Krawczyk, B.; Woźniak, M.; Herrera, F. On the usefulness of one-class classifier ensembles for decomposition of multi-class problems. Pattern Recognit. 2015, 48, 3969–3982. [Google Scholar] [CrossRef]
  59. Rifkin, R.; Klautau, A. In defense of one-vs-all classification. J. Mach. Learn. Res. 2004, 5, 101–141. [Google Scholar]
  60. Melgani, F.; Bruzzone, L. Classification of hyperspectral remote sensing images with support vector machines. IEEE Trans. Geosci. Remote Sens. 2004, 42, 1778–1790. [Google Scholar] [CrossRef]
  61. Anthony, G.; Gregg, H.; Tshilidzi, M. Image classification using SVMs: One-against-one vs. one-against-all. In Proceedings of the 28th Asian Conference on Remote Sensing, Kuala Lumpur, Malaysia, 12–16 November 2007.
  62. Lawrence, R.L.; Wood, S.D.; Sheley, R.L. Mapping invasive plants using hyperspectral imagery and Breiman Cutler classifications (randomForest). Remote Sens. Environ. 2006, 100, 356–362. [Google Scholar] [CrossRef]
  63. Instituto da Conservação da Natureza e das Florestas (ICNF). Plano Setorial—Flora; Fichas de caracterização e gestão das espécies constantes no Anexo II da Diretiva Habitats-Flora. Available online: http://www.icnf.pt/portal/naturaclas/rn2000/p-set/psrn-flora (accessed on 27 November 2015).
  64. Dorigo, W.; Bachmann, M.; Heldens, W. AS Toolbox & Processing of Field Spectra: User’s Manual; German Aerospace Center (DLR): Oberpfaffenhofen, Germany, 2006. [Google Scholar]
  65. Lehnert, L.W.; Meyer, H.; Bendix, J. hsdar: Manage, Analyse and Simulate Hyperspectral Data in R. R Package Version 0.3.1. Available online: https://cran.r-project.org/web/packages/hsdar (accessed on 8 October 2015).
  66. R Development Core Team. R: A Language and Environment for Statistical Computing; R Foundation for Statistical Computing: Vienna, Austria, 2015. [Google Scholar]
  67. Dormann, C.F.; Elith, J.; Bacher, S.; Buchmann, C.; Carl, G.; Carré, G.; Marquéz, J.R.G.; Gruber, B.; Lafourcade, B.; Leitão, P.J.; et al. Collinearity: A review of methods to deal with it and a simulation study evaluating their performance. Ecography 2013, 36, 27–46. [Google Scholar] [CrossRef]
  68. Kuhn, M.; Johnson, K. Applied Predictive Modeling; Springer: New York, NY, USA, 2013. [Google Scholar]
  69. Chung, D.; Keles, S. Sparse partial least squares classification for high dimensional data. Stat. Appl. Genet. Mol. Biol. 2010, 9, 17. [Google Scholar] [CrossRef] [PubMed]
  70. Berge, L.; Bouveyron, C.; Girard, S. HDclassif: An R package for model-based clustering and discriminant analysis of high-dimensional data. J. Stat. Softw. 2012, 46, 1–29. [Google Scholar] [CrossRef]
  71. Venables, W.N.; Ripley, B.D. Modern Applied Statistics with S, 4th ed.; Springer: New York, NY, USA, 2002. [Google Scholar]
  72. Breiman, L. Random forests. Mach. Learn. 2001, 45, 5–32. [Google Scholar] [CrossRef]
  73. Cortes, C.; Vapnik, V. Support-vector networks. Mach. Learn. 1995, 20, 273–297. [Google Scholar] [CrossRef]
  74. Pu, R. Broadleaf species recognition with in situ hyperspectral data. Int. J. Remote Sens. 2009, 30, 2759–2779. [Google Scholar] [CrossRef]
  75. Fernández-Delgado, M.; Cernadas, E.; Barro, S.; Amorim, D. Do we need hundreds of classifiers to solve real world classification problems? J. Mach. Learn. Res. 2014, 15, 3133–3181. [Google Scholar]
  76. van der Linden, S.; Rabe, A.; Held, M.; Jakimow, B.; Leitão, P.; Okujeni, A.; Schwieder, M.; Suess, S.; Hostert, P. The EnMAP-Box—A toolbox and application programming interface for EnMAP data processing. Remote Sens. 2015, 7, 11249–11266. [Google Scholar] [CrossRef]
  77. Chung, D.; Chun, H.; Keles, S. spls: Sparse Partial Least Squares (SPLS) Regression and Classification. R package version 2.2-1. Available online: https://cran.r-project.org/web/packages/spls (accessed on 30 November 2015).
  78. Liaw, A.; Wiener, M. Classification and regression by randomForest. R News 2002, 2, 18–22. [Google Scholar]
  79. Karatzoglou, A.; Smola, A.; Hornik, K. The Kernlab Package. Kernel-Based Machine Learning Lab. R package version 0.9.-22. Available online: https://cran.r-project.org/web/packages/kernlab (accessed on 4 November 2015).
  80. Japkowicz, N. Concept-learning in the presence of between-class and within-class imbalances. In Advances in Artificial Intelligence; Springer: Berlin, Germany, 2001; pp. 67–77. [Google Scholar]
  81. Robin, X.; Turck, N.; Hainard, A.; Tiberti, N.; Lisacek, F.; Sanchez, J.-C.; Müller, M. pROC: Display and Analyze ROC Curves. R Package Version 1.8. Available online: https://cran.r-project.org/web/packages/pROC (accessed on 30 November 2015).
  82. Kuhn, M. caret: Classification and Regression Training. R package version 6.0-52. Available online: https://cran.r-project.org/web/packages/caret (accessed on 29 November 2015).
  83. Nagler, P.L.; Inoue, Y.; Glenn, E.P.; Russ, A.L.; Daughtry, C.S.T. Cellulose absorption index (CAI) to quantify mixed soil–plant litter scenes. Remote Sens. Environ. 2003, 87, 310–325. [Google Scholar] [CrossRef]
  84. Zarco-Tejada, P.J.; Pushnik, J.C.; Dobrowski, S.; Ustin, S.L. Steady-state chlorophyll a fluorescence detection from canopy derivative reflectance and double-peak red-edge effects. Remote Sens. Environ. 2003, 84, 283–294. [Google Scholar] [CrossRef]
  85. Apan, A.; Held, A.; Phinn, S.; Markley, J. Detecting sugarcane “orange rust” disease using EO-1 Hyperion hyperspectral imagery. Int. J. Remote Sens. 2004, 25, 489–498. [Google Scholar] [CrossRef] [Green Version]
  86. Huete, A.; Lui, H.Q.; Batchily, K.; van Leeuwen, W. A comparison of vegetation indices over a global set of TM images for EOS-MODIS. Remote Sens. Environ. 1997, 59, 440–451. [Google Scholar] [CrossRef]
  87. Galvão, L.S.; Formaggio, A.R.; Tisot, D.A. Discrimination of sugarcane varieties in Southeastern Brazil with EO-1 Hyperion data. Remote Sens. Environ. 2005, 94, 523–534. [Google Scholar] [CrossRef]
  88. Lobell, D.B.; Asner, G.P. Subpixel canopy cover estimation of coniferous forests in Oregon using SWIR imaging spectrometry. J. Geophys. Res. Atmospheres 2001, 106, 5151–5160. [Google Scholar]
  89. Wu, C.; Niu, Z.; Tang, Q.; Huang, W. Estimating chlorophyll content from hyperspectral vegetation indices: Modeling and validation. Agric. For. Meteorol. 2008, 148, 1230–1241. [Google Scholar] [CrossRef]
  90. Datt, B. Remote sensing of water content in Eucalyptus leaves. Aust. J. Bot. 1999, 47, 909–923. [Google Scholar] [CrossRef]
  91. Penuelas, J.; Gamon, J.A.; Fredeen, A.L.; Merino, J.; Field, C.B. Reflectance indices associated with physiological changes in nitrogen- and water-limited sunflower leaves. Remote Sens. Environ. 1994, 48, 135–146. [Google Scholar] [CrossRef]
  92. Bach, H. Die Bestimmung Hydrologischer und Landwirtschaftlicher Oberflächenparameter aus Hyperspektralen Fernerkundungsdaten; Münchener Geographische Abhandlungen: München, Germany, 1995. [Google Scholar]
  93. Lichtenthaler, H.K.; Lang, M.; Sowinska, M.; Heisel, F.; Miehé, J.A. Detection of vegetation stress via a new high resolution fluorescence imaging system. J. Plant Physiol. 1996, 148, 599–612. [Google Scholar] [CrossRef]
  94. Datt, B. Remote sensing of chlorophyll a, chlorophyll b, chlorophyll a+b, and total carotenoid content in eucalyptus leaves. Remote Sens. Environ. 1998, 66, 111–121. [Google Scholar] [CrossRef]
  95. Le Maire, G.; Francois, C.; Soudani, K.; Berveiller, D.; Pontailler, J.; Breda, N.; Genet, H.; Davi, H.; Dufrene, E. Calibration and validation of hyperspectral indices for the estimation of broadleaved forest leaf chlorophyll content, leaf mass per area, leaf area index and leaf canopy biomass. Remote Sens. Environ. 2008, 112, 3846–3864. [Google Scholar] [CrossRef]
  96. Sims, D.A.; Gamon, J.A. Relationships between leaf pigment content and spectral reflectance across a wide range of species, leaf structures and developmental stages. Remote Sens. Environ. 2002, 81, 337–354. [Google Scholar] [CrossRef]
  97. Serrano, L.; Penuelas, J.; Ustin, S.L. Remote sensing of nitrogen and lignin in Mediterranean vegetation from AVIRIS data: Decomposing biochemical from structural signals. Remote Sens. Environ. 2002, 81, 355–364. [Google Scholar] [CrossRef]
  98. Garrity, S.R.; Eitel, J.U.H.; Vierling, L.A. Disentangling the relationships between plant pigments and the photochemical reflectance index reveals a new approach for remote estimation of carotenoid content. Remote Sens. Environ. 2011, 115, 628–635. [Google Scholar] [CrossRef]
  99. Merzlyak, M.D.; Gitelson, A.; Chivkunova, O.B.; Rakitin, V.Y. Non-destructive optical detection of pigment changes during leaf senescence and fruit ripening. Physiol. Plant. 1999, 135–141. [Google Scholar] [CrossRef]
  100. Penuelas, J.; Baret, F.; Filella, I. Semiempirical indexes to assess carotenoids chlorophyll-a ratio from leaf spectral reflectance. Photosynthetica 1995, 31, 220–231. [Google Scholar]
  101. Le Maitre, D.C.; Gaertner, M.; Marchante, E.; Ens, E.-J.; Holmes, P.M.; Pauchard, A.; O’Farrell, P.J.; Rogers, A.M.; Blanchard, R.; Blignaut, J.; Richardson, D.M. Impacts of invasive Australian acacias: Implications for management and restoration: Australian acacias: Linking impacts and restoration. Divers. Distrib. 2011, 17, 1015–1029. [Google Scholar] [CrossRef]
  102. Thenkabail, P.S.; Teluguntla, P.; Gumma, M.K.; Dheeravath, V. Hyperspectral remote sensing for terrestrial applications. In Remote Sensing Handbook: Land Resources Monitoring, Modeling, and Mapping with Remote Sensing; Thenkabail, P.S., Ed.; CRC Press: Boca Raton, FL, USA, 2015; pp. 201–233. [Google Scholar]
  103. Thenkabail, P.S.; Lyon, J.G.; Huete, A. Advances in hyperspectral remote sensing of vegetation and agricultural croplands. In Hyperspectral Remote Sensing of Vegetation; Thenkabail, P.S., Lyon, J.G., Huete, A., Eds.; CRC Press: Boca Raton, FL, USA, 2011; pp. 3–36. [Google Scholar]
  104. Millard, K.; Richardson, M. On the importance of training data sample selection in random forest image classification: A case study in peatland ecosystem mapping. Remote Sens. 2015, 7, 8489–8515. [Google Scholar] [CrossRef]
  105. Pal, M.; Foody, G.M. Feature selection for classification of hyperspectral data by SVM. IEEE Trans. Geosci. Remote Sens. 2010, 48, 2297–2307. [Google Scholar] [CrossRef]
  106. Cánovas-García, F.; Alonso-Sarría, F. Optimal combination of classification algorithms and feature ranking methods for object-based classification of submeter resolution Z/I-Imaging DMC imagery. Remote Sens. 2015, 7, 4651–4677. [Google Scholar] [CrossRef]
  107. Bandos, T.V.; Bruzzone, L.; Camps-Valls, G. Classification of hyperspectral images with regularized linear discriminant analysis. IEEE Trans. Geosci. Remote Sens. 2009, 47, 862–873. [Google Scholar] [CrossRef]
  108. Hamada, Y.; Stow, D.A.; Coulter, L.L.; Jafolla, J.C.; Hendricks, L.W. Detecting Tamarisk species (Tamarix spp.) in riparian habitats of Southern California using high spatial resolution hyperspectral imagery. Remote Sens. Environ. 2007, 109, 237–248. [Google Scholar] [CrossRef]
  109. Oldeland, J.; Dorigo, W.; Wesuls, D.; Jürgens, N. Mapping bush encroaching species by seasonal differences in hyperspectral imagery. Remote Sens. 2010, 2, 1416–1438. [Google Scholar] [CrossRef]
  110. Godoy, O.; de Lemos-Filho, J.P.; Valladares, F. Invasive species can handle higher leaf temperature under water stress than Mediterranean natives. Environ. Exp. Bot. 2011, 71, 207–214. [Google Scholar] [CrossRef]
  111. Australian Biological Resources Study (ABRS). Flora of Australia Online. In Acacia longifolia. Available online: http://www.anbg.gov.au/abrs/online-resources/flora/stddisplay.xsql?pnid=41939 (accessed on 30 November 2015).
  112. Escribano, P.; Palacios-Orueta, A.; Oyonarte, C.; Chabrillat, S. Spectral properties and sources of variability of ecosystem components in a Mediterranean semiarid environment. J. Arid Environ. 2010, 74, 1041–1051. [Google Scholar] [CrossRef]
Figure 1. Study area and study sites in the stabilized coastal dunes of the Natura 2000 site “Comporta/Galé” in SW Portugal.
Remotesensing 08 00334 g001
Figure 2. Model performances (Area Under Curve (AUC), Sensitivity, Specificity, Positive Predictive Value (PPV)) after 100 iterations of distinguishing Acacia longifolia from adjacent Mediterranean dune vegetation for full spectrum data (*.FullSpec) and vegetation indices (*.VegInds) at leaf (top) and canopy (bottom) level applying sparse Partial Least Square Discriminant Analysis (sPLSDA), High-Dimensional Discriminant Analysis (HDDA), Linear Discriminant Analysis (LDA), radial basis function kernel Support Vector Machine (SVM), and Random Forest (RF) as classifiers.
Remotesensing 08 00334 g002
Figure 3. Field spectra and medians of Variable Importance (VIP) (100 iterations) of classification models of Acacia longifolia: (A) mean leaf spectra of A. longifolia and co-occurring native species; (B) VIP of sparse Partial Least Squares Discriminant Analysis (sPLSDA) using the full spectrum at leaf level; (C) mean canopy spectra of A. longifolia and co-occurring native species; and (D) VIP of sparse Partial Least Squares Discriminant Analysis (sPLSDA) using the full spectrum at canopy level. VIP values > 0.8 (dashed lines) indicate highly important predictors.
Remotesensing 08 00334 g003
Figure 4. Distribution of Variable Importance (VIP) values of vegetation indices from 100 iterations of classification models of Acacia longifolia using field spectra of leaves and canopies. VIP values higher than 0.8 (dashed lines) indicate highly important predictors. For explanations of vegetation indices, see Table 3. Numbers above boxes show the frequency with which the respective index was selected in the final model (max = 100). Boxplots: show medians, interquartile ranges and extreme values within 1.5 × interquartile range.
Remotesensing 08 00334 g004
Table 1. Overview of the sampled species including number of sampled leaf spectra, number of sampled canopy spectra, growth form (Chamaephyte (C), Geophyte (G), Phanerophyte (P), Protohemicryptophyte (Ph)), family based on [35] and status (Annex II species of the EU habitat directive, endemic, invasive) based on [63].
SpeciesLeafCanopyGrowth FormFamilyStatus
Acacia longifolia7418PFabaceaeinv
Acacia saligna2416PFabaceaeinv
Armeria pungens57CPlumbaginaceae
Arundo donax8n.a.PhPoaceaeinv
Calluna vulgaris81P, CEricaceae
Carpobrotus edulis1122CAizoaceaeinv
Cistus ladanifern.a.5PCistaceae
Cistus salviifolius1216P, CCistaceae
Corema album12023PEricaceae
Daphne gnidium31C, PThymelaeaceae
Halimium calycinum2116PCistaceae
Halimium halimifolium4914C, PCistaceae
Helichrysum italicum subsp. picardii1316CAsteraceae
Juniperus navicularis1010P, CCupressaceaeend
Juniperus phoenicea subsps. turbinata3423P, CCupressaceae
Lavandula stoechas2014P, CLamiaceae
Pancratium maritimum9n.a.GAmaryllidaceae
Paraserianthes lophantha16n.a.PFabaceaeinv
Phillyrea angustifolia33POleaceae
Pinus pinaster4217PPinaceae
Pistacia lentiscus4324PAnacardiaceae
Rosmarinus officinalis2924C, PLamiaceae
Santolina impressa3019CAsteraceaeend, AnnII
Sedum sediforme11CCrassulaceae
Stauracanthus sp.n.a.20PFabaceae
Thymus camphoratus78CLamiaceaeend, AnnII
Thymus carnosus1519CLamiaceaeend, AnnII
Ulex australisn.a.9P, CFabaceaeend
Table 2. Overview of the number of spectral samples for Acacia longifolia and other species used for training and testing at leaf and canopy level. Training samples of the minority class A. longifolia were up-sampled during resampling to match the majority class size and account for class imbalance.
ClassLeafCanopy
TrainingTestTrainingTest
Acacia longifolia5618144
Other plant species40013324682
Table 3. Hyperspectral narrowband vegetation indices including related vegetation characteristics, the sensor level at which the index was applied (Leaf and Canopy) and spectral bands used for calculation. Significant differences (p < 0.05, U-Test) in median index values between Acacia longifolia and adjacent dune vegetation are marked with an “*” for leaf and canopy scale, respectively.
Vegetation IndexRelated toSensor LevelFormulaReferences
CAICellulose Absorption IndexCelluloseL *, C * 0.5   ( R 2000 + R 2200 ) R 2100 [83]
DPIDouble Peak IndexStressL *, C * ( D 688 × D 710 ) / D 697 2 [84]
DWSI2Disease-Water Stress Index 2Disease-Water StressL *, C R 1660 / R 550 [85]
EVIEnhanced Vegetation IndexBiomass/LAIL *, C 2.5 ( ( R 800 R 670 ) / ( R 800 ( 6 × R 670 ) ( 7.5 × R 475 ) + 1 ) [86]
LWVI1Leaf Water Vegetation Index 1WaterL *, C * ( R 1094 R 983 ) / ( R 1094 + R 983 ) [87]
SWIR.VIShortwave-Infrared Vegetation IndexVegetation CoverL *, C * 37.72 ( R 2210 R 2090 ) + 26.27 ( R 2280 R 2090 ) + 0.57 [88]
TCARI2Transformed Chlorophyll Absorption Ratio Index, bands used as in [89]ChlorophyllL *, C * 3 ( ( R 750 R 705 ) 0.2 ( R 750 R 550 ) ( R 750 / R 705 ) [89]
Datt7n.a.WaterC * ( R 860 R 2218 ) / ( R 860 R 1928 ) [90]
DWSI3Disease-Water Stress Index 3Disease-Water StressC R 1660 / R 680 [85]
EGFREdge-Green First Derivative RatioChlorophyll, NitrogenC * m a x ( D 650 : 750 ) / m a x ( D 500 : 550 ) [91]
I0wavelength of the min. reflectance of the red-edgeBiomassC[92]
SR7Fluorescence Ratio Blue/RedFluorescence, StressC R 440 / R 690 [93]
Datt4n.a.PigmentsL * R 672 / ( R 550 × R 708 ) [94]
Datt8n.a.WaterL * ( R 860 R 2218 ) / ( R 860 R 1928 ) [90]
DDnnew Double Difference IndexChlorophyllL * 2 × ( R 710 R 660 R 760 ) [95]
mSRmodified Simple RatioChlorophyllL * ( R 800 R 445 ) / ( R 680 R 445 ) [96]
NDLINormalized Difference Lignin IndexLigninL * ( l o g ( 1 / R 1754 ) l o g ( 1 / R 1680 ) ) / ( l o g ( 1 / R 1754 ) + ( l o g ( 1 / R 1680 ) ) [97]
NDNINormalized Difference Nitrogen IndexNitrogenL * ( l o g ( 1 / R 1510 ) l o g ( 1 / R 1680 ) ) / ( l o g ( 1 / R 1510 ) + ( l o g ( 1 / R 1680 ) ) [97]
PRI.CI2Photochemical Reflection Index x Chlorophyll ContentCarotenoidL * ( R 531 R 570 ) / ( R 531 + R 570 ) × ( R 760 / R 700 1 ) [98]
PSRIPlant Senescing Reflectance IndexLeaf SenescenceL * ( R 678 R 500 ) / R 750 [99]
SRPISimple Ratio Pigment IndexPigmentsL * R 430 / R 680 [100]

