Sex-Dimorphic Association of Plasma Fatty Acids with Cardiovascular Fitness in Young and Middle-Aged General Adults: Subsamples from NHANES 2003–2004


Abstract
:1. Introduction
2. Materials and Methods
2.1. Study Population
2.2. Examinations and Laboratory Measurements
2.2.1. Cardiorespiratory Fitness Assessment
2.2.2. Measurement of Plasma Fatty Acids
2.2.3. Anthropometric Measures
2.2.4. Smoking Status
2.2.5. Blood Pressure and Hypertension Status
2.2.6. Assessment of Lipid Profile, Insulin Resistance Status and C-Reactive Protein
2.3. Statistical Methods
3. Results
3.1. Subject Characteristics
3.2. Twenty-four Fatty Acid Levels in Fasting Plasma
3.3. FAs Levels among 3 CV Fitness Groups Stratified by Sex
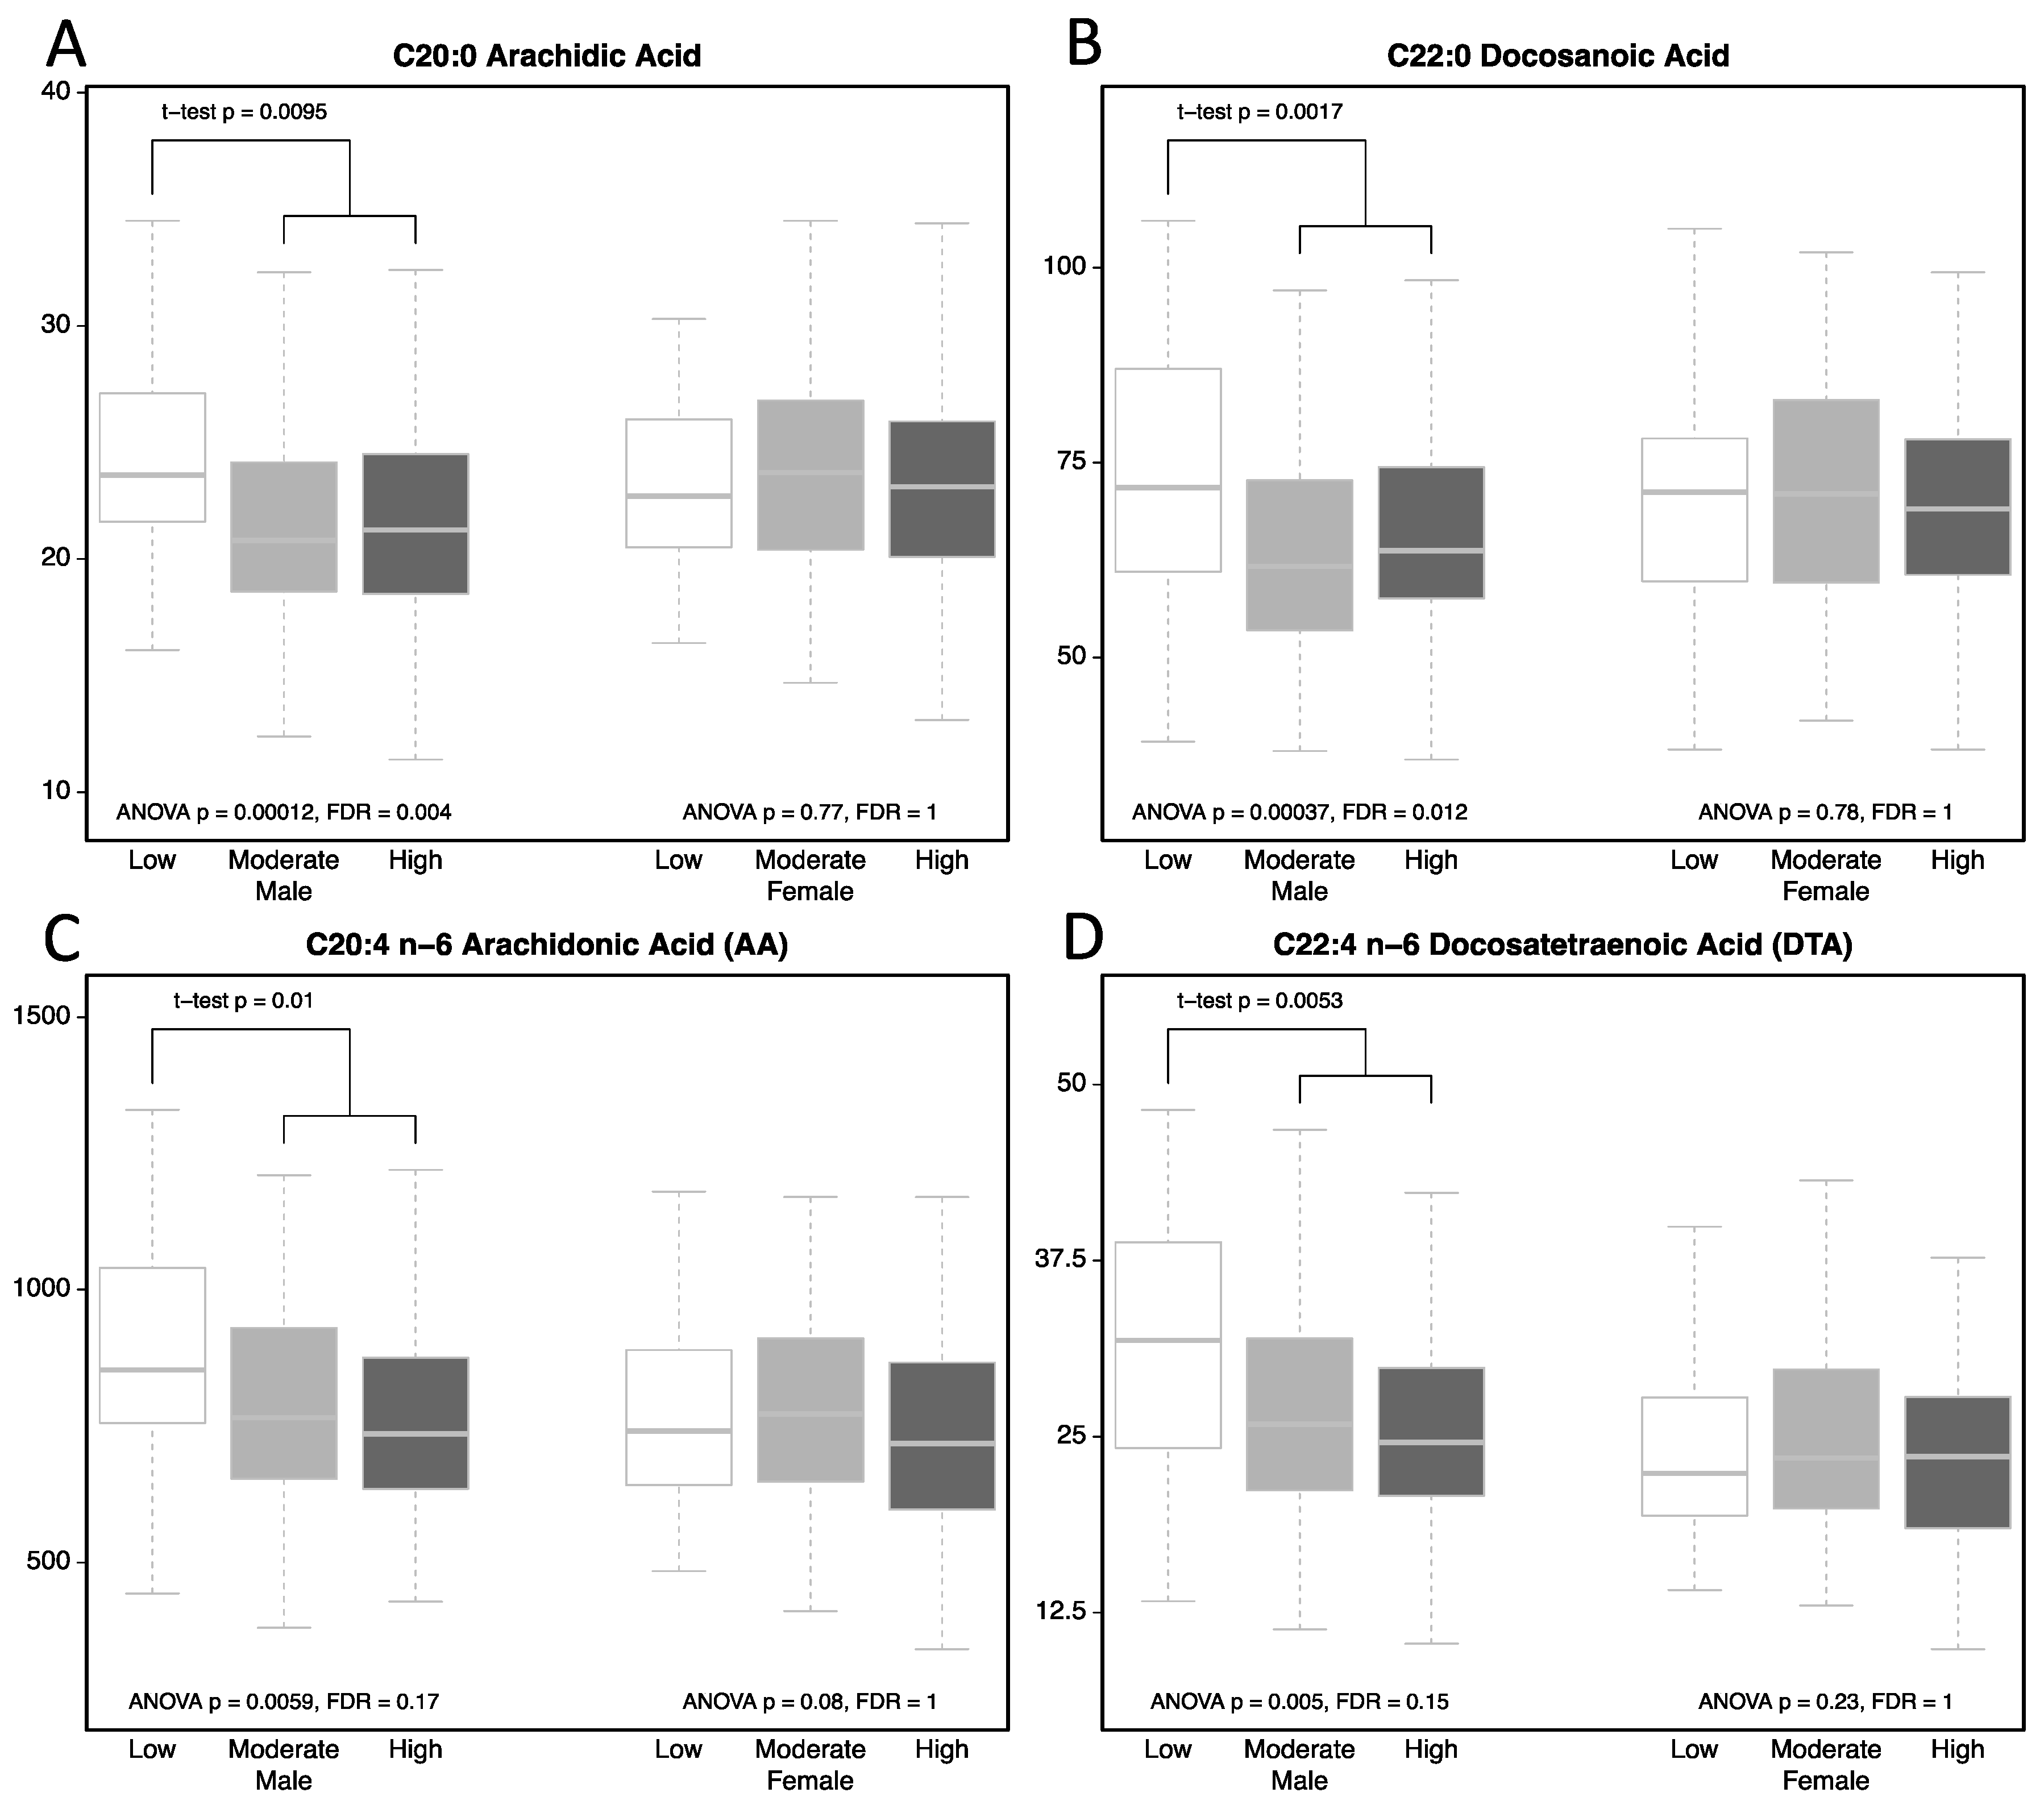
3.4. Subjects with Low CVFL Have Higher AR1, DA1, AA, and DTA
3.5. Univariate and Multivariate Linear Regression Analysis
4. Discussion
5. Conclusions
Author Contributions
Funding
Acknowledgments
Conflicts of Interest
References
- Sallis, J.F.; Patterson, T.L.; Buono, M.J.; Nader, P.R. Relation of cardiovascular fitness and physical activity to cardiovascular disease risk factors in children and adults. Am. J. Epidemiol. 1988, 127, 933–941. [Google Scholar] [CrossRef] [PubMed]
- Blair, S.N.; Kohl, H.W.; Paffenbarger, R.S.; Clark, D.G.; Cooper, K.H.; Gibbons, L.W. Physical fitness and all-cause mortality. A prospective study of healthy men and women. JAMA 1989, 262, 2395–2401. [Google Scholar] [CrossRef] [PubMed]
- Carnethon, M.R.; Gulati, M.; Greenland, P. Prevalence and cardiovascular disease correlates of low cardiorespiratory fitness in adolescents and adults. JAMA 2005, 294, 2981–2988. [Google Scholar] [CrossRef] [PubMed]
- Ekelund, L.G.; Haskell, W.L.; Johnson, J.L.; Whaley, F.S.; Criqui, M.H.; Sheps, D.S. Physical fitness as a predictor of cardiovascular mortality in asymptomatic North American men. The lipid research clinics mortality follow-up study. New Engl. J. Med. 1988, 319, 1379–1384. [Google Scholar] [CrossRef] [PubMed]
- Kodama, S.; Saito, K.; Tanaka, S.; Maki, M.; Yachi, Y.; Asumi, M.; Sugawara, A.; Totsuka, K.; Shimano, H.; Ohashi, Y.; et al. Cardiorespiratory fitness as a quantitative predictor of all-cause mortality and cardiovascular events in healthy men and women: A meta-analysis. JAMA 2009, 301, 2024–2035. [Google Scholar] [CrossRef] [PubMed]
- Clausen, J.S.R.; Marott, J.L.; Holtermann, A.; Gyntelberg, F.; Jensen, M.T. Midlife cardiorespiratory fitness and the long-term risk of mortality: 46 years of follow-up. J. Am. Coll. Cardiol. 2018, 72, 987–995. [Google Scholar] [CrossRef] [PubMed]
- Oliver, M.F. Sudden cardiac death: The lost fatty acid hypothesis. QJM Mon. J. Assoc. Physicians 2006, 99, 701–709. [Google Scholar] [CrossRef] [PubMed]
- Djousse, L.; Benkeser, D.; Arnold, A.; Kizer, J.R.; Zieman, S.J.; Lemaitre, R.N.; Tracy, R.P.; Gottdiener, J.S.; Mozaffarian, D.; Siscovick, D.S.; et al. Plasma free fatty acids and risk of heart failure: The cardiovascular health study. Circ. Heart Fail. 2013, 6, 964–969. [Google Scholar] [CrossRef] [PubMed]
- Rider, O.J.; Holloway, C.J.; Emmanuel, Y.; Bloch, E.; Clarke, K.; Neubauer, S. Increasing plasma free fatty acids in healthy subjects induces aortic distensibility changes seen in obesity. Circ. Cardiovasc. Imaging 2012, 5, 367–375. [Google Scholar] [CrossRef] [PubMed]
- Zhu, N.; Jiang, W.; Wang, Y.; Wu, Y.; Chen, H.; Zhao, X. Plasma levels of free fatty acid differ in patients with left ventricular preserved, mid-range, and reduced ejection fraction. BMC Cardiovasc. Disord. 2018, 18, 104. [Google Scholar] [CrossRef] [PubMed]
- Abdelmagid, S.A.; Clarke, S.E.; Nielsen, D.E.; Badawi, A.; El-Sohemy, A.; Mutch, D.M.; Ma, D.W. Comprehensive profiling of plasma fatty acid concentrations in young healthy Canadian adults. PLoS ONE 2015, 10, e0116195. [Google Scholar] [CrossRef] [PubMed]
- Sibbons, C.M.; Brenna, J.T.; Lawrence, P.; Hoile, S.P.; Clarke-Harris, R.; Lillycrop, K.A.; Burdge, G.C. Effect of sex hormones on n-3 polyunsaturated fatty acid biosynthesis in HepG2 cells and in human primary hepatocytes. Prostaglandins Leukot. Essent. Fat. Acids 2014, 90, 47–54. [Google Scholar] [CrossRef] [PubMed]
- Steffen, B.T.; Steffen, L.M.; Tracy, R.; Siscovick, D.; Jacobs, D.; Liu, K.; He, K.; Hanson, N.Q.; Nettleton, J.A.; Tsai, M.Y. Ethnicity, plasma phospholipid fatty acid composition and inflammatory/endothelial activation biomarkers in the Multi-Ethnic Study of Atherosclerosis (MESA). Eur. J. Clin. Nutr. 2012, 66, 600–605. [Google Scholar] [CrossRef] [PubMed] [Green Version]
- Kurotani, K.; Sato, M.; Ejima, Y.; Nanri, A.; Yi, S.; Pham, N.M.; Akter, S.; Poudel-Tandukar, K.; Kimura, Y.; Imaizumi, K.; et al. High levels of stearic acid, palmitoleic acid, and dihomo-gamma-linolenic acid and low levels of linoleic acid in serum cholesterol ester are associated with high insulin resistance. Nutr. Res. 2012, 32, 669–675. [Google Scholar] [CrossRef] [PubMed]
- Yamagishi, K.; Folsom, A.R.; Steffen, L.M.; Investigators, A.S. Plasma fatty acid composition and incident ischemic stroke in middle-aged adults: The Atherosclerosis Risk in Communities (ARIC) Study. Cerebrovasc. Dis. 2013, 36, 38–46. [Google Scholar] [CrossRef] [PubMed]
- Oie, E.; Ueland, T.; Dahl, C.P.; Bohov, P.; Berge, C.; Yndestad, A.; Gullestad, L.; Aukrust, P.; Berge, R.K. Fatty acid composition in chronic heart failure: Low circulating levels of eicosatetraenoic acid and high levels of vaccenic acid are associated with disease severity and mortality. J. Intern. Med. 2011, 270, 263–272. [Google Scholar] [CrossRef] [PubMed]
- NHANES 2003–2004. Available online: https://wwwn.cdc.gov/nchs/nhanes/ContinuousNhanes/Default.aspx?BeginYear=2003 (accessed on 24 July 2018).
- National Health and Examination Survey: Cardiovascular Fitness Procedures Manual. Available online: https://wwwn.cdc.gov/nchs/data/nhanes/2003-2004/manuals/cv_99-04.pdf (accessed on 24 July 2018).
- Pate, R.R.; Pratt, M.; Blair, S.N.; Haskell, W.L.; Macera, C.A.; Bouchard, C.; Buchner, D.; Ettinger, W.; Heath, G.W.; King, A.C.; et al. Physical activity and public health. A recommendation from the centers for disease control and prevention and the American college of sports medicine. JAMA 1995, 273, 402–407. [Google Scholar] [CrossRef] [PubMed]
- Lagerstedt, S.A.; Hinrichs, D.R.; Batt, S.M.; Magera, M.J.; Rinaldo, P.; McConnell, J.P. Quantitative determination of plasma c8–c26 total fatty acids for the biochemical diagnosis of nutritional and metabolic disorders. Mol. Genet. Metab. 2001, 73, 38–45. [Google Scholar] [CrossRef] [PubMed]
- Strath, S.J.; Holleman, R.G.; Ronis, D.L.; Swartz, A.M.; Richardson, C.R. Objective physical activity accumulation in bouts and nonbouts and relation to markers of obesity in US adults. Prev. Chronic Dis. 2008, 5, 131. [Google Scholar]
- Dwoskin, L.P.; Buxton, S.T.; Jewell, A.L.; Crooks, P.A. S (-)-nornicotine increases dopamine release in a calcium-dependent manner from superfused rat striatal slices. J. Neurochem. 1993, 60, 2167–2174. [Google Scholar] [CrossRef] [PubMed]
- Baum, S.J. A Survey of internists and cardiologists: Are discoveries in fatty acids truly being translated into clinical practice? Prostaglandins Leukot. Essent. Fat. Acids 2013, 88, 3–4. [Google Scholar] [CrossRef] [PubMed]
- Adjepong, M.; Pickens, C.A.; Jain, R.; Harris, W.S.; Annan, R.A.; Fenton, J.I. Association of whole blood n-6 fatty acids with stunting in 2-to-6-year-old Northern Ghanaian children: A cross-sectional study. PLoS ONE 2018, 13, e0193301. [Google Scholar] [CrossRef] [PubMed]
- de Oliveira Otto, M.C.; Wu, J.H.; Baylin, A.; Vaidya, D.; Rich, S.S.; Tsai, M.Y.; Jacobs, D.R., Jr.; Mozaffarian, D. Circulating and dietary omega-3 and omega-6 polyunsaturated fatty acids and incidence of CVD in the Multi-Ethnic Study of Atherosclerosis. J. Am. Heart Assoc. 2013, 2, e000506. [Google Scholar] [CrossRef] [PubMed]
- Fretts, A.M.; Mozaffarian, D.; Siscovick, D.S.; Djousse, L.; Heckbert, S.R.; King, I.B.; McKnight, B.; Sitlani, C.; Sacks, F.M.; Song, X.; et al. Plasma phospholipid saturated fatty acids and incident atrial fibrillation: The cardiovascular health study. J. Am. Heart Assoc. 2014, 3, e000889. [Google Scholar] [CrossRef] [PubMed]
- Nettleton, J.A.; von Schacky, C.; Brouwer, I.A.; Koletzko, B. International society for the study of fatty acids and lipids 2016 debate: For science-based dietary guidelines on fats, meta-analysis and systematic reviews are decisive. Ann. Nutr. Metab. 2017, 71, 26–30. [Google Scholar] [CrossRef] [PubMed]
- Sacks, F.M.; Lichtenstein, A.H.; Wu, J.H.Y.; Appel, L.J.; Creager, M.A.; Kris-Etherton, P.M.; Miller, M.; Rimm, E.B.; Rudel, L.L.; Robinson, J.G.; et al. Dietary fats and cardiovascular disease: A presidential advisory from the American heart association. Circulation 2017, 136, 1–23. [Google Scholar] [CrossRef] [PubMed]
- Maki, K.C.; Eren, F.; Cassens, M.E.; Dicklin, M.R.; Davidson, M.H. Omega-6 polyunsaturated fatty acids and cardiometabolic health: Current evidence, controversies, and research gaps. Adv. Nutr. 2018. [Google Scholar] [CrossRef] [PubMed]
- U.S. Department of Health and Human Services and U.S. Department of Agriculture. 2015–2020 Dietary Guidelines for Americans, 8th ed.; Skyhorse Publishing: New York, NY, USA, 2015.
- Harris, W.S.; Mozaffarian, D.; Rimm, E.; Kris-Etherton, P.; Rudel, L.L.; Appel, L.J.; Engler, M.M.; Engler, M.B.; Sacks, F. Omega-6 fatty acids and risk for cardiovascular disease: A science advisory from the American heart association nutrition subcommittee of the council on nutrition, physical activity, and metabolism; council on cardiovascular nursing; and council on epidemiology and prevention. Circulation 2009, 119, 902–907. [Google Scholar] [CrossRef] [PubMed]
- Node, K.; Huo, Y.; Ruan, X.; Yang, B.; Spiecker, M.; Ley, K.; Zeldin, D.C.; Liao, J.K. Anti-inflammatory properties of cytochrome P450 epoxygenase-derived eicosanoids. Science 1999, 285, 1276–1279. [Google Scholar] [CrossRef] [PubMed]
- Hooper, L.; Al-Khudairy, L.; Abdelhamid, A.S.; Rees, K.; Brainard, J.S.; Brown, T.J.; Ajabnoor, S.M.; O’Brien, A.T.; Winstanley, L.E.; Donaldson, D.H.; et al. Omega-6 fats for the primary and secondary prevention of cardiovascular disease. Cochrane Database Syst. Rev. 2018, 7, CD011094. [Google Scholar] [CrossRef] [PubMed]
- Forouhi, N.G.; Koulman, A.; Sharp, S.J.; Imamura, F.; Kroger, J.; Schulze, M.B.; Crowe, F.L.; Huerta, J.M.; Guevara, M.; Beulens, J.W.; et al. Differences in the prospective association between individual plasma phospholipid saturated fatty acids and incident type 2 diabetes: The EPIC-InterAct case-cohort study. Lancet Diabetes Endocrinol. 2014, 2, 810–818. [Google Scholar] [CrossRef]
- Malik, V.S.; Chiuve, S.E.; Campos, H.; Rimm, E.B.; Mozaffarian, D.; Hu, F.B.; Sun, Q. Circulating very-long-chain saturated fatty acids and incident coronary heart disease in US men and women. Circulation 2015, 132, 260–268. [Google Scholar] [CrossRef] [PubMed]
- Jakobsson, A.; Westerberg, R.; Jacobsson, A. Fatty acid elongases in mammals: Their regulation and roles in metabolism. Prog. Lipid Res. 2006, 45, 237–249. [Google Scholar] [CrossRef] [PubMed]
- Kihara, A. Very long-chain fatty acids: Elongation, physiology and related disorders. J. Biochem. 2012, 152, 387–395. [Google Scholar] [CrossRef] [PubMed]
- Antoku, Y.; Tsukamoto, K.; Miyoshi, Y.; Nagino, H.; Anezaki, M.; Suwa, K.; Narabe, Y. Correlations of elevated levels of hexacosanoate in erythrocyte membranes with risk factors for atherosclerosis. Atherosclerosis 2000, 153, 169–173. [Google Scholar] [CrossRef]
- Matsumori, R.; Miyazaki, T.; Shimada, K.; Kume, A.; Kitamura, Y.; Oshida, K.; Yanagisawa, N.; Kiyanagi, T.; Hiki, M.; Fukao, K.; et al. High levels of very long-chain saturated fatty acid in erythrocytes correlates with atherogenic lipoprotein profiles in subjects with metabolic syndrome. Diabetes Res. Clin. Pract. 2013, 99, 12–18. [Google Scholar] [CrossRef] [PubMed]
- Alfredsson, J.; Green, J.B.; Stevens, S.R.; Reed, S.D.; Armstrong, P.W.; Angelyn Bethel, M.; Engel, S.S.; McGuire, D.K.; Van de Werf, F.; Hramiak, I.; et al. Sex differences in management and outcomes of patients with type 2 diabetes and cardiovascular disease: A report from TECOS. Diabetes Obes. Metab. 2018. [Google Scholar] [CrossRef] [PubMed]
- Cenko, E.; Yoon, J.; Kedev, S.; Stankovic, G.; Vasiljevic, Z.; Krljanac, G.; Kalpak, O.; Ricci, B.; Milicic, D.; Manfrini, O.; et al. Sex differences in outcomes after STEMI: Effect modification by treatment strategy and age. JAMA Intern. Med. 2018, 178, 632–639. [Google Scholar] [CrossRef] [PubMed]
- Palmisano, B.T.; Zhu, L.; Eckel, R.H.; Stafford, J.M. Sex differences in lipid and lipoprotein metabolism. Mol. Metab. 2018, 15, 45–55. [Google Scholar] [CrossRef] [PubMed]
- Santilli, F.; D’Ardes, D.; Guagnano, M.T.; Davi, G. Metabolic syndrome: Sex-related cardiovascular risk and therapeutic approach. Curr. Med. Chem. 2017, 24, 2602–2627. [Google Scholar] [CrossRef] [PubMed]
- Suthahar, N.; Meijers, W.C.; Ho, J.E.; Gansevoort, R.T.; Voors, A.A.; van der Meer, P.; Bakker, S.J.L.; Heymans, S.; van Empel, V.; Schroen, B.; et al. Sex-specific associations of obesity and N-terminal pro-B-type natriuretic peptide levels in the general population. Eur. J. Heart Fail. 2018, 20, 1205–1214. [Google Scholar] [CrossRef] [PubMed]
- Maric-Bilkan, C.; Arnold, A.P.; Taylor, D.A.; Dwinell, M.; Howlett, S.E.; Wenger, N.; Reckelhoff, J.F.; Sandberg, K.; Churchill, G.; Levin, E.; et al. Report of the national heart, lung, and blood institute working group on sex differences research in cardiovascular disease: Scientific questions and challenges. Hypertension 2016, 67, 802–807. [Google Scholar] [CrossRef] [PubMed]
- Abubakar, I.I.; Tillmann, T.; Banerjee, A. Global, regional, and national age-sex specific all-cause and cause-specific mortality for 240 causes of death, 1990–2013: A systematic analysis for the global burden of disease study 2013. Lancet 2015, 385, 117–171. [Google Scholar] [CrossRef]
- Blenck, C.L.; Harvey, P.A.; Reckelhoff, J.F.; Leinwand, L.A. The importance of biological sex and estrogen in rodent models of cardiovascular health and disease. Circ. Res. 2016, 118, 1294–1312. [Google Scholar] [CrossRef] [PubMed]
- Huxley, V.H. Sex and the cardiovascular system: The intriguing tale of how women and men regulate cardiovascular function differently. Adv. Physiol. Educ. 2007, 31, 17–22. [Google Scholar] [CrossRef] [PubMed]
- Koutsari, C.; Basu, R.; Rizza, R.A.; Nair, K.S.; Khosla, S.; Jensen, M.D. Nonoxidative free fatty acid disposal is greater in young women than men. J. Clin. Endocrinol. Metab. 2011, 96, 541–547. [Google Scholar] [CrossRef] [PubMed]
- Shadid, S.; Koutsari, C.; Jensen, M.D. Direct free fatty acid uptake into human adipocytes in vivo: Relation to body fat distribution. Diabetes 2007, 56, 1369–1375. [Google Scholar] [CrossRef] [PubMed]
- Adler-Wailes, D.C.; Periwal, V.; Ali, A.H.; Brady, S.M.; McDuffie, J.R.; Uwaifo, G.I.; Tanofsky-Kraff, M.; Salaita, C.G.; Hubbard, V.S.; Reynolds, J.C.; et al. Sex-associated differences in free fatty acid flux of obese adolescents. J. Clin. Endocrinol. Metab. 2013, 98, 1676–1684. [Google Scholar] [CrossRef] [PubMed]
- Bakewell, L.; Burdge, G.C.; Calder, P.C. Polyunsaturated fatty acid concentrations in young men and women consuming their habitual diets. Br. J. Nutr. 2006, 96, 93–99. [Google Scholar] [CrossRef] [PubMed]
- Crowe, F.L.; Skeaff, C.M.; Green, T.J.; Gray, A.R. Serum n-3 long-chain PUFA differ by sex and age in a population-based survey of New Zealand adolescents and adults. Br. J. Nutr. 2008, 99, 168–174. [Google Scholar] [CrossRef] [PubMed]
- Giltay, E.J.; Gooren, L.J.; Toorians, A.W.; Katan, M.B.; Zock, P.L. Docosahexaenoic acid concentrations are higher in women than in men because of estrogenic effects. Am. J. Clin. Nutr. 2004, 80, 1167–1174. [Google Scholar] [CrossRef] [PubMed] [Green Version]
- Abbott, K.A.; Burrows, T.L.; Thota, R.N.; Acharya, S.; Garg, M.L. Do omega-3 PUFAs affect insulin resistance in a sex-specific manner? A systematic review and meta-analysis of randomized controlled trials. Am. J. Clin. Nutr. 2016, 104, 1470–1484. [Google Scholar] [CrossRef] [PubMed]
- Da Boit, M.; Sibson, R.; Sivasubramaniam, S.; Meakin, J.R.; Greig, C.A.; Aspden, R.M.; Thies, F.; Jeromson, S.; Hamilton, D.L.; Speakman, J.R.; et al. Sex differences in the effect of fish-oil supplementation on the adaptive response to resistance exercise training in older people: A randomized controlled trial. Am. J. Clin. Nutr. 2017, 105, 151–158. [Google Scholar] [CrossRef] [PubMed]
- Magkos, F.; Patterson, B.W.; Mittendorfer, B. No effect of menstrual cycle phase on basal very-low-density lipoprotein triglyceride and apolipoprotein B-100 kinetics. Am. J. Physiol. Endocrinol. Metab. 2006, 291, 1243–1249. [Google Scholar] [CrossRef] [PubMed]
- Kuo, H.K.; Yen, C.J.; Chen, J.H.; Yu, Y.H.; Bean, J.F. Association of cardiorespiratory fitness and levels of C-reactive protein: Data from the national health and nutrition examination survey 1999–2002. Int. J. Cardiol. 2007, 114, 28–33. [Google Scholar] [CrossRef] [PubMed]
- Wang, C.Y.; Haskell, W.L.; Farrell, S.W.; Lamonte, M.J.; Blair, S.N.; Curtin, L.R.; Hughes, J.P.; Burt, V.L. Cardiorespiratory fitness levels among US adults 20–49 years of age: Findings from the 1999–2004 national health and nutrition examination survey. Am. J. Epidemiol. 2010, 171, 426–435. [Google Scholar] [CrossRef] [PubMed]


| All Subjects | Cardiovascular Fitness Level (CVFL) | ||||||||
|---|---|---|---|---|---|---|---|---|---|
| Low | Moderate | High | ANOVA | ||||||
| Range (Mean ± S.D) | n | Range (Mean ± S.D) | n | Range (Mean ± S.D) | n | Range (Mean ± S.D) | n | p value | |
| VO2max(ml/kg/min) | 20.9–78.9 (39.3 ± 8.7) | 448 | 20.9–37.1 (29.8 ± 4) | 79 | 27.1–43.9 (36 ± 4.4) | 166 | 33.1–78.9 (45.7 ± 7.8) | 204 | <0.001 |
| Age (yr) | 20.1–50 (33.4 ± 8.4) | 448 | 20.2–49.9 (31.9 ± 8.3) | 78 | 20.2–49.4 (34.1 ± 7.9) | 166 | 20.1–50 (33.4 ± 8.9) | 204 | 0.161 |
| Gender (M,%) | 55.5 | 53.2 | 78 | 60.2 | 166 | 52.5 | 204 | ¶0.294 | |
| Smoking (%) | 29.4 | 449 | 25.6 | 78 | 32.5 | 166 | 28.2 | 202 | 0.486 |
| Waist Circumfrence (WC, cm) | 66.3–122 (90.6 ± 11.9) | 449 | 68.4–120 (94.0 ± 12.0) | 54 | 66.5–117 (90.5 ± 11.2) | 129 | 66.3–122 (89.5 ± 12.2) | 164 | 0.049 |
| Body Mass Index (kg/m2) | 16.7–40.9 (26.0 ± 4.2) | 347 | 17.6–39.5 (27.3 ± 4.1) | 54 | 16.7–40 (25.9 ± 4.2) | 130 | 17.4–40.9 (25.5 ± 4.2) | 165 | 0.026 |
| Hypertension (%) | 19.8 | 349 | 31.5 | 54 | 18.5 | 130 | 17.0 | 165 | ¶0.060 |
| Systolic Blood Pressure ( SBP, mmHg) | 87–189 (114 ± 11) | 349 | 98–189 (117 ± 14.7) | 54 | 87–143 (114.7 ± 10.8) | 130 | 89–145 (112.7 ± 10.6) | 165 | 0.029 |
| Diastolic Blood Pressure ( DBP, mmHg) | 40–95 (69 ± 10) | 349 | 51–93 (72.6 ± 10.5) | 54 | 40–95(69.52 ± 9.49) | 130 | 44–95 (68.6 ± 10.1) | 165 | 0.037 |
| Plasma Triglyceride (TG, mg/dL ) | 32–1779 (131 ± 132) | 347 | 32–776 (136 ± 105) | 54 | 35–648 (134. ± 96) | 129 | 33–1779 (128 ± 161) | 164 | 0.892 |
| Plasma HDL (mg/dL) | 27–112 (54.6 ± 15.9) | 348 | 29–102 (54.9 ± 17.6) | 54 | 27–103 (52.2 ± 13.4) | 130 | 27–112 (56.5 ± 17) | 164 | 0.065 |
| Plasma LDL (mg/dL) | 35–217 (115 ± 33.6) | 435 | 35–201 (118 ± 32.6) | 78 | 41–211 (115 ± 34.6) | 160 | 41–217 (113 ± 33.1) | 197 | 0.466 |
| Plasma Total Cholesterol (mg/dL) | 93–426 (193 ± 39.4) | 447 | 93–426 (199 ± 44.1) | 79 | 109–295 (192 ± 39.2) | 166 | 99–306 (192 ± 37.6) | 202 | 0.390 |
| Plasma Glucose (GLU, mg /dL) | 63.4–416 (93.5 ± 19.8) | 449 | 72.6–416 (98.3 ± 44.9) | 54 | 75.6–142 (93.7 ± 8.9) | 130 | 63.4–165 (91.9 ± 10.6) | 165 | 0.115 |
| Plasma C-peptide ( nmol/L ) | 0.71–71.1 (9.8 ± 8.8) | 446 | 2.17–42.5 (12.0 ± 8.5) | 79 | 1.16–71.1 (9.9 ± 9) | 166 | 0.71–54.5 (8.9 ± 8.5) | 201 | 0.023 |
| Plasma Insulin( INS, μU/mL ) | 0.02–2.77 (0.73 ± 0.35) | 446 | 0.3–2.1 (0.83 ± 0.36) | 79 | 0.24–2.77 (0.74 ± 0.35) | 166 | 0.02–2.47 (0.68 ± 0.34) | 201 | 0.005 |
| HOMA-IR | 0.12–20 (2.36 ± 2.33) | 446 | 0.47–11.3 (2.90 ± 2.24) | 79 | 0.25–20 (2.39 ± 2.31) | 166 | 0.12–16.7 (2.13 ± 2.36) | 201 | 0.044 |
| Plasma C-Reactive Protein (CRP, mg/dL) | 0.01–16.5 (0.36 ± 0.9) | 448 | 0.02–2.91 (0.44 ± 0.53) | 79 | 0.01–3.41 (0.33 ± 0.42) | 166 | 0.01–16.50 (0.36 ± 1.24) | 203 | 0.670 |
| All Subjects | Cardiovascular Fitness Level (CVFL) | ||||||||||
|---|---|---|---|---|---|---|---|---|---|---|---|
| Low | Moderate | High | ANOVA | ||||||||
| Range (Mean ± S.D) | n | Range (Mean ± S.D) | n | Range (Mean ± S.D) | n | Range (Mean ± S.D) | n | p value | FDR | ||
| SFA | C14:0 Myristic Acid | 24.8–2410 (137 ± 139) | 442 | 40.2–370 (130 ± 72) | 79 | 24.8–620 (138 ± 93.6) | 164 | 29.2–2410 (140 ± 185) | 199 | 0.88 | 1.00 |
| C16:0 Palmitic Acid | 1310–8240 (2715 ± 960) | 444 | 1310–8240 (2840 ± 990) | 79 | 1380–7120 (2767 ± 996) | 165 | 1330–7970 (2623 ± 914) | 200 | 0.16 | 1.00 | |
| C18:0 Stearic Acid | 364–1720 (685 ± 180) | 444 | 404–1720 (708 ± 186) | 79 | 364–1470 (694 ± 182) | 165 | 373–1490 (669 ± 175) | 200 | 0.19 | 1.00 | |
| C20:0 Arachidic Acid (AR1) | 6.25–83.7 (23 ± 5.8) | 433 | 16.1–83.7 (24.9 ± 8.1) | 78 | 12.4–36.3 (22.6 ± 5) | 159 | 6.25–43.7 (22.6 ± 5.1) | 196 | 0.007 | 0.23 | |
| C22:0 Docosanoic Acid (DA1) | 17–171 (68.3 ± 16.5) | 431 | 38.2–171 (73.5 ± 18.2) | 78 | 38–129 (66.9 ± 16.4) | 158 | 17–117 (67.5 ± 15.6) | 195 | 0.009 | 0.26 | |
| C24:0 Lignoceric Acid | 20.9–132 (54.2 ± 13.3) | 430 | 27.1–112 (56.5 ± 13.7) | 76 | 28.8–132 (53.1 ± 13.2) | 161 | 20.9–104 (54.1 ± 13.2) | 193 | 0.18 | 1.00 | |
| MUFA | C14:1 n-5 Myristoleic Acid | 0.70–186 (8.8 ± 11.9) | 445 | 0.98–29.4 (7.8 ± 5.3) | 79 | 0.9–75.7 (9.2 ± 10) | 165 | 0.70–186 (8.9 ± 14.8) | 201 | 0.69 | 1.00 |
| C16:1 n-7 Palmitoleic Acid | 39–2500 (238 ± 199) | 445 | 57.7–645 (232 ± 122) | 79 | 51.9–1930 (245 ± 198) | 165 | 39–2500 (236 ± 224) | 201 | 0.86 | 1.00 | |
| C18:1 n-7 cis-Vaccenic Acid | 54.1–550 (144 ± 59.1) | 435 | 62.9–550 (148 ± 60.4) | 78 | 59.7–489 (146 ± 57.8) | 161 | 54.1–454 (141 ± 59.7) | 196 | 0.6 | 1.00 | |
| C18:1 n-9 Oleic Acid | 885–15800 (2107 ± 1175) | 443 | 885–8560 (2111 ± 926) | 79 | 933–13300 (2157 ± 1193) | 164 | 911–15800 (2065 ± 1249) | 200 | 0.76 | 1.00 | |
| C20:1 n-9 Eicosenoic Acid | 2.89–61.1 (13.8 ± 6.7) | 443 | 4.76–61.1 (14.2 ± 7.3) | 79 | 5.09–42 (14 ± 6.8) | 164 | 2.89–46.3 (13.6 ± 6.3) | 200 | 0.72 | 1.00 | |
| C22:1 n-9 Docosenoic Acid | 0.21–23.8 (4.5 ± 3.5) | 395 | 0.21–23.8 (4.9 ± 3.7) | 65 | 0.21–18.2 (4.3 ± 3.3) | 145 | 0.21–23.80 (4.39 ± 3.60) | 185 | 0.48 | 1.00 | |
| C24:1 n-9 Nervonic Acid | 18.3–162 (76 ± 18.8) | 428 | 38.6–133 (79.3 ± 19.4) | 76 | 34.1–162 (76.7 ± 20.1) | 157 | 18.3–117 (74.1 ± 17.4) | 195 | 0.1 | 1.00 | |
| PUFA | C18:2 n-6 Linoleic Acid (LA) | 1770–9200 (3503 ± 881) | 445 | 1810–9200 (3571 ± 1000) | 79 | 2130–6970 (3454 ± 844) | 165 | 1770–7450 (3517 ± 863) | 201 | 0.6 | 1.00 |
| C18:3 n-6 gamma-Linolenic Acid (GLA) | 6.25–141 (48.4 ± 23) | 442 | 7.2–136 (48.8 ± 26) | 79 | 10.50–141 (49.2 ± 23.2) | 164 | 6.25–122 (47.5 ± 21.7) | 199 | 0.77 | 1.00 | |
| C20:2 n-6 Eicosadienoic Acid | 5.66–123 (22.4 ± 10.3) | 443 | 9.9–52 (22.6 ± 8.5) | 79 | 8.3–64.9 (22.2 ± 9.1) | 164 | 5.66–123 (22.5 ± 11.7) | 200 | 0.92 | 1.00 | |
| C20:3 n-6 Dihomo-gamma-Linolenic Acid (DGLA) | 49–716 (156 ± 63.9) | 445 | 53.1–330 (158 ± 51.3) | 79 | 49–612 (158.34 ± 64.57) | 165 | 50.9–716 (153 ± 67.8) | 201 | 0.71 | 1.00 | |
| C20:4 n-6 Arachidonic Acid (AA) | 341–1770 (784 ± 205) | 445 | 443–1770 (839 ± 232) | 79 | 380–1390 (796 ± 201) | 165 | 341–1590 (754 ± 194) | 201 | 0.005 | 0.16 | |
| C22:4 n-6 Docosatetraenoic Acid (DTA) | 6.72–66.1 (26.2 ± 8.7) | 445 | 13.3–63.3 (28.2 ± 9.5) | 79 | 11.3–66.1 (26.8 ± 9) | 165 | 6.72–58.8 (25 ± 8.1) | 201 | 0.013 | 0.37 | |
| C22:5 n-6 Docosapentaenoic-6 Acid (DPA n-6) | 5.31–61.7 (21.5 ± 8.9) | 445 | 9.5–52.5 (24 ± 9.4) | 79 | 5.94–56 (21.5 ± 9.1) | 165 | 5.31–61.7 (20.5 ± 8.3) | 201 | 0.013 | 0.37 | |
| C18:3 n-3 alpha-Linolenic Acid (ALA) | 16.1–421 (68.2 ± 42.1) | 445 | 23.1–341 (67.1 ± 44) | 79 | 16.1–272 (67.9 ± 37.4) | 165 | 20.2–421 (68.8 ± 45) | 201 | 0.95 | 1.00 | |
| C20:5 n-3 Eicosapentaenoic Acid (EPA) | 6.–236 (43.4 ± 28.8) | 444 | 15.7–130 (41.3 ± 23.9) | 79 | 6.60–236 (45.5 ± 33.8) | 165 | 6.03–143 (42.4 ± 26.1) | 200 | 0.46 | 1.00 | |
| C22:5 n-3 Docosapentaenoic-3 Acid (DPA n-3) | 12.1–106 (41.5 ± 13.6) | 445 | 17.4–106 (41.4 ± 14.8) | 79 | 15.1–90.4 (42.5 ± 14.2) | 165 | 12.1–98.5 (40.6 ± 12.6) | 201 | 0.42 | 1.00 | |
| C22:6 n-3 Docosahexaenoic Acid (DHA) | 43.2–549 (131 ± 62.6) | 445 | 55.1–468 (134 ± 61.3) | 79 | 46.6–549 (135 ± 70.8) | 165 | 43.2–324 (126 ± 55.5) | 201 | 0.35 | 1.00 | |
| Σ24FFA | 13187–78613 (27060 ± 7739) | 445 | 13981–78613 (27800 ± 8222) | 79 | 15832–67736 (27218 ± 7729) | 165 | 13187–67035 (26639 ± 7563) | 201 | 0.5 | 1.00 | |
| Σ6SFA | 1840–10670 (3669 ± 1216) | 445 | 1851–10677 (3829 ± 1246) | 79 | 1977–9243 (3735 ± 1260) | 165 | 1840–10323 (3552 ± 1162) | 201 | 0.16 | 1.00 | |
| Σ7MUFA | 345–17590 (2577 ± 1388) | 445 | 1129–9823 (2592 ± 1078) | 79 | 345–14755 (2631 ± 1421) | 165 | 480–17590 (2527 ± 1470) | 201 | 0.77 | 1.00 | |
| Σ11PUFA | 2375–12529 (4845 ± 1124) | 445 | 2662–12529 (4975 ± 1288) | 79 | 2891–8697 (4818 ± 1075) | 165 | 2375–9739 (4816 ± 1096) | 201 | 0.52 | 1.00 | |
| Σw3PUFA ¶ | 92.6–1071 (284 ± 119) | 445 | 142–1030 (284 ± 118) | 79 | 92.6–1071 (291 ± 129) | 165 | 107–786 (278 ± 110) | 201 | 0.57 | 1.00 | |
| Σw6PUFA § | 2255–11499 (4561.6 ± 1048) | 445 | 2472–11499 (4692 ± 1199) | 79 | 2781–8229 (4528 ± 1002) | 165 | 2255–8953 (4539 ± 1024) | 201 | 0.47 | 1.00 | |
| w6/w3 | 5.29–37.7 (17.5 ± 4.7) | 445 | 8.2–31.6 (17.7 ± 4.6) | 79 | 5.29–34.4 (17.1 ± 4.7) | 165 | 8.02–37.7 (17.8 ± 4.9) | 201 | 0.41 | 1.00 | |
| C16:1/C16:0 | 1.82–37.4 (14.1 ± 5.1) | 444 | 5.99–24.1 (13.8 ± 4.2) | 79 | 3.69–33.8 (13.8 ± 4.9) | 165 | 1.82–37.4 (14.3 ± 5.5) | 200 | 0.62 | 1.00 | |
| Men | Women | ||||||||||||||||
|---|---|---|---|---|---|---|---|---|---|---|---|---|---|---|---|---|---|
| Cardiovascular Fitness Level | Cardiovascular Fitness Level | ||||||||||||||||
| Low | Moderate | High | ANOVA | Low | Moderate | High | ANOVA | ||||||||||
| mean ± S.D | n | mean ± S.D | n | mean ± S.D | n | p | FDR | mean ± S.D | n | mean ± S.D | n | mean ± S.D | n | p | FDR | ||
| SFA | C14:0 Myristic Acid | 141 ± 78.5 | 42 | 141 ± 103 | 99 | 134 ± 105 | 103 | 0.88 | 1.00 | 118 ± 62 | 37 | 133 ± 77.9 | 65 | 145 ± 244 | 96 | 0.71 | 1.00 |
| C16:0 Palmitic Acid | 2999 ± 1098 | 42 | 2769 ± 1114 | 100 | 2678 ± 971 | 105 | 0.25 | 1.00 | 2659 ± 828 | 37 | 2764 ± 789 | 65 | 2561 ± 847 | 95 | 0.31 | 1.00 | |
| C18:0 Stearic Acid | 756 ± 212 | 42 | 694 ± 203 | 100 | 685 ± 185 | 105 | 0.14 | 1.00 | 654 ± 134 | 37 | 694 ± 147 | 65 | 640 ± 161 | 95 | 0.18 | 1.00 | |
| C20:0 Arachidic Acid (AR1) | 26.3 ± 10.4 | 41 | 21.8 ± 4.8 | 99 | 21.8 ± 4.7 | 102 | <0.001 | 0.004 | 23.2 ± 3.8 | 37 | 23.9 ± 5.0 | 60 | 23.5 ± 5.4 | 94 | 0.77 | 1.00 | |
| C22:0 Docosanoic Acid (DA1) | 76.7 ± 21.1 | 41 | 64.4 ± 16.2 | 99 | 65.8 ± 15.6 | 101 | <0.001 | 0.01 | 70.0 ± 13.8 | 37 | 71.0 ± 15.9 | 59 | 69.2 ± 15.4 | 94 | 0.78 | 1.00 | |
| C24:0 Lignoceric Acid | 60.8 ± 14.7 | 40 | 53.7 ± 14.2 | 100 | 55.9 ± 13.4 | 102 | 0.028 | 0.75 | 51.7 ± 10.8 | 36 | 52.0 ± 11.3 | 61 | 52.2 ± 12.8 | 91 | 0.98 | 1.00 | |
| MUFA | C14:1 n-5 Myristoleic Acid | 8.3 ± 5.5 | 42 | 9.9 ± 12.0 | 100 | 8.4 ± 9.3 | 105 | 0.48 | 1.00 | 7.3 ± 5.1 | 37 | 8.1 ± 5.8 | 65 | 9.4 ± 19.1 | 96 | 0.69 | 1.00 |
| C16:1 n-7 Palmitoleic Acid | 244 ± 125 | 42 | 255 ± 237 | 100 | 246 ± 271 | 105 | 0.95 | 1.00 | 219 ± 118 | 37 | 229 ± 112 | 65 | 226 ± 169 | 96 | 0.93 | 1.00 | |
| C18:1 n-7 cis-Vaccenic Acid | 160 ± 75.5 | 41 | 147 ± 64.1 | 99 | 143 ± 62.4 | 103 | 0.37 | 1.00 | 135 ± 33.4 | 37 | 145 ± 46.4 | 62 | 139 ± 56.8 | 93 | 0.58 | 1.00 | |
| C18:1 n-9 Oleic Acid | 2290 ± 1147 | 42 | 2241 ± 1441 | 100 | 2095 ± 846 | 104 | 0.55 | 1.00 | 1908 ± 529 | 37 | 2026 ± 631 | 64 | 2032 ± 1577 | 96 | 0.85 | 1.00 | |
| C20:1 n-9 Eicosenoic Acid | 14.9 ± 8.7 | 42 | 14.0 ± 7.3 | 100 | 13.6 ± 6.4 | 105 | 0.62 | 1.00 | 13.4 ± 5.4 | 37 | 14.1 ± 5.9 | 64 | 13.5 ± 6.2 | 95 | 0.81 | 1.00 | |
| C22:1 n-9 Docosenoic Acid | 5.3 ± 4.4 | 35 | 4.2 ± 3.1 | 88 | 4.5 ± 4.1 | 100 | 0.33 | 1.00 | 4.5 ± 2.4 | 30 | 4.5 ± 3.5 | 57 | 4.2 ± 3.0 | 85 | 0.78 | 1.00 | |
| C24:1 n-9 Nervonic Acid | 81.1 ± 22.4 | 39 | 75.5 ± 20.6 | 98 | 72.9 ± 17.8 | 103 | 0.086 | 1.00 | 77.5 ± 15.6 | 37 | 78.5 ± 19.3 | 59 | 75.6 ± 16.9 | 92 | 0.58 | 1.00 | |
| PUFA | C18:2 n-6 Linoleic Acid (LA) | 3725 ± 1127 | 42 | 3308 ± 806 | 100 | 3516 ± 845 | 105 | 0.029 | 0.76 | 3397 ± 814 | 37 | 3679 ± 859 | 65 | 3518 ± 887 | 96 | 0.26 | 1.00 |
| C18:3 n-6 gamma-Linolenic Acid (GLA) | 57.9 ± 29.6 | 42 | 52.6 ± 25.1 | 99 | 53.3 ± 21.4 | 103 | 0.47 | 1.00 | 38.3 ± 15.9 | 37 | 44.1 ± 19.1 | 65 | 41.4 ± 20.4 | 96 | 0.33 | 1.00 | |
| C20:2 n-6 Eicosadienoic Acid | 22.5 ± 8.0 | 42 | 20.8 ± 7.9 | 100 | 21.4 ± 9.1 | 105 | 0.56 | 1.00 | 22.7 ± 9.2 | 37 | 24.2 ± 10.5 | 64 | 23.8 ± 14.0 | 95 | 0.84 | 1.00 | |
| C20:3 n-6 Dihomo-gamma-Linolenic Acid (DGLA) | 158 ± 50 | 42 | 153 ± 68.4 | 100 | 153 ± 57.4 | 105 | 0.92 | 1.00 | 159 ± 53.4 | 37 | 166 ± 57.7 | 65 | 153 ± 77.9 | 96 | 0.48 | 1.00 | |
| C20:4 n-6 Arachidonic Acid (AA) | 891 ± 255 | 42 | 790 ± 190 | 100 | 770 ± 203 | 105 | 0.006 | 0.17 | 780 ± 188 | 37 | 805 ± 219 | 65 | 735 ± 182 | 96 | 0.079 | 1.00 | |
| C22:4 n-6 Docosatetraenoic Acid (DTA) | 31.6 ± 10 | 42 | 27.3 ± 9.1 | 100 | 26.2 ± 8.5 | 105 | 0.005 | 0.15 | 24.5 ± 7.3 | 37 | 25.9 ± 8.7 | 65 | 23.8 ± 7.4 | 96 | 0.23 | 1.00 | |
| C22:5 n-6 Docosapentaenoic-6 Acid (DPA n-6) | 23.9 ± 9 | 42 | 20.6 ± 8.6 | 100 | 19.9 ± 8 | 105 | 0.037 | 0.89 | 24.1 ± 9.9 | 37 | 22.9 ± 9.6 | 65 | 21.1 ± 8.6 | 96 | 0.2 | 1.00 | |
| C18:3 n-3 alpha-Linolenic Acid (ALA) | 73.1 ± 53.2 | 42 | 66.8 ± 39.0 | 100 | 70.0 ± 49.1 | 105 | 0.75 | 1.00 | 60.3 ± 29.6 | 37 | 69.6 ± 34.9 | 65 | 67.4 ± 40.3 | 96 | 0.46 | 1.00 | |
| C20:5 n-3 Eicosapentaenoic Acid (EPA) | 46.1 ± 23.3 | 42 | 47.8 ± 34.7 | 100 | 45.5 ± 27.5 | 104 | 0.85 | 1.00 | 35.8 ± 23.7 | 37 | 42.0 ± 32.3 | 65 | 39.1 ± 24.2 | 96 | 0.54 | 1.00 | |
| C22:5 n-3 Docosapentaenoic-3 Acid (DPA n-3) | 47.5 ± 16.1 | 42 | 43.9 ± 15.0 | 100 | 43.1 ± 12.9 | 105 | 0.25 | 1.00 | 34.5 ± 9.5 | 37 | 40.4 ± 12.6 | 65 | 38.0 ± 11.8 | 96 | 0.054 | 1.00 | |
| C22:6 n-3 Docosahexaenoic Acid (DHA) | 130 ± 67.6 | 42 | 125 ± 59.8 | 100 | 120 ± 52.8 | 105 | 0.66 | 1.00 | 139 ± 53.9 | 37 | 151 ± 83.1 | 65 | 132 ± 57.9 | 96 | 0.23 | 1.00 | |
| Σ24FFA | 29343 ± 9546 | 42 | 26962 ± 8491 | 100 | 26932 ± 7471 | 105 | 0.23 | 1.00 | 26050 ± 6061 | 37 | 27611 ± 6426 | 65 | 26318 ± 7688 | 96 | 0.43 | 1.00 | |
| Σ6SFA | 4054 ± 1395 | 42 | 3741 ± 1409 | 100 | 3634 ± 12412 | 105 | 0.23 | 1.00 | 35734 ± 1010 | 37 | 3725.7 ± 996.2 | 65 | 3463 ± 1067 | 96 | 0.29 | 1.00 | |
| Σ7MUFA | 2793 ± 1322 | 42 | 2743 ± 1697 | 100 | 25597 ± 1125 | 105 | 0.54 | 1.00 | 2364 ± 655 | 37 | 2460 ± 820 | 65 | 2492 ± 1779 | 96 | 0.89 | 1.00 | |
| Σ11PUFA | 5206 ± 1461 | 42 | 4654 ± 1041 | 100 | 4838 ± 1091 | 105 | 0.033 | 0.83 | 4715 ± 1015 | 37 | 5070 ± 1087 | 65 | 4793 ± 1106 | 96 | 0.18 | 1.00 | |
| Σw3PUFA ¶ | 296 ± 138 | 42 | 283 ± 122 | 100 | 279 ± 115 | 105 | 0.72 | 1.00 | 269 ± 91.2 | 37 | 303 ± 139 | 65 | 277 ± 106 | 96 | 0.27 | 1.00 | |
| Σw6PUFA § | 4910 ± 1347 | 42 | 4371 ± 968 | 100 | 4560 ± 1014 | 105 | 0.023 | 0.64 | 4445 ± 965 | 37 | 4767 ± 1012 | 65 | 4516 ± 1040 | 96 | 0.2 | 1.00 | |
| w6/w3¶ | 17.8 ± 4.9 | 42 | 17.1 ± 4.8 | 100 | 17.9 ± 5.0 | 105 | 0.5 | 1.00 | 17.5 ± 4.4 | 37 | 17.1 ± 4.5 | 65 | 17.6 ± 4.8 | 96 | 0.79 | 1.00 | |
| C16:1/C16:0 | 14.1 ± 4.6 | 42 | 14.0 ± 5.3 | 100 | 14.6 ± 6.0 | 105 | 0.72 | 1.00 | 13.6 ± 3.7 | 37 | 13.6 ± 4.2 | 65 | 14.0 ± 4.9 | 95 | 0.81 | 1.00 | |
| ANOVA p | t-test p | ||||
|---|---|---|---|---|---|
| L vs. M vs. H | L vs. M | L vs. H | M vs. H | L vs. (M + H) | |
| Arachidic acid | <0.001 | 0.01 | 0.01 | 0.998 | 0.01 |
| Docosanoic acid | <0.001 | 0.001 | 0.004 | 0.545 | 0.002 |
| Arachidonic Acid | 0.006 | 0.024 | 0.008 | 0.481 | 0.01 |
| Docosatetraenoic Acid | 0.005 | 0.021 | 0.003 | 0.346 | 0.037 |
| Men | ||||||||||||||||
|---|---|---|---|---|---|---|---|---|---|---|---|---|---|---|---|---|
| SSAR1_N | C20:0 Arachidic Acid | |||||||||||||||
| SSAR1_N (log) | Age (yr) | Smoking (Y/N) | dBP | BMI | CRP | HOMA_IR | TG | |||||||||
| β | p | β | p | β | p | β | p | β | p | β | p | β | p | β | p | |
| model0 | −0.235 | 6e-7 | --- | --- | --- | --- | --- | --- | --- | --- | --- | --- | --- | --- | --- | --- |
| model1 | −0.161 | 0.002 | −0.004 | 0.010 | 0.002 | 0.94 | −0.003 | 0.025 | −0.001 | 0.64 | --- | --- | --- | --- | --- | --- |
| model2 | −0.161 | 0.002 | −0.004 | 0.011 | 0.002 | 0.95 | −0.003 | 0.025 | −0.001 | 0.64 | −0.001 | 0.94 | --- | --- | --- | --- |
| model3 | −0.154 | 0.003 | −0.004 | 0.007 | 0.002 | 0.94 | −0.003 | 0.038 | −0.0004 | 0.92 | −0.001 | 0.91 | −0.007 | 0.36 | --- | --- |
| model4 | −0.167 | 0.004 | −0.004 | 0.009 | 0.0004 | 0.99 | −0.003 | 0.036 | −0.001 | 0.84 | −0.001 | 0.92 | −0.008 | 0.33 | 6.6e-5 | 0.60 |
| SSDA1_N | C22:0 Docosanoic Acid | |||||||||||||||
| SSDA1_N (log) | Age (yr) | Smoking (Y/N) | dBP | BMI | CRP | HOMA_IR | TG | |||||||||
| β | p | β | p | β | p | β | p | β | p | β | p | β | p | β | p | |
| model0 | −0.182 | 6e-5 | --- | --- | --- | --- | --- | --- | --- | --- | --- | --- | --- | --- | --- | --- |
| model1 | −0.125 | 0.012 | −0.004 | 0.008 | −0.002 | 0.94 | −0.003 | 0.016 | −0.002 | 0.48 | --- | --- | --- | --- | --- | --- |
| model2 | −0.126 | 0.012 | −0.004 | 0.008 | −0.002 | 0.93 | −0.003 | 0.017 | −0.002 | 0.49 | −0.003 | 0.77 | --- | --- | --- | --- |
| model3 | −0.123 | 0.014 | −0.004 | 0.004 | −0.002 | 0.95 | −0.003 | 0.029 | −0.001 | 0.84 | −0.003 | 0.74 | −0.009 | 0.23 | --- | --- |
| model4 | −0.121 | 0.017 | −0.004 | 0.007 | −0.001 | 0.98 | −0.003 | 0.030 | −0.0004 | 0.91 | −0.003 | 0.74 | −0.008 | 0.33 | −5.5e-5 | 0.64 |
| SSARA_N | C20:4 n-6 Arachidonic Acid (AA) | |||||||||||||||
| SSARA_N (log) | Age (yr) | Smoking (Y/N) | dBP | BMI | CRP | HOMA_IR | TG | |||||||||
| β | p | β | p | β | p | β | p | β | p | β | p | β | p | β | p | |
| model0 | −0.178 | 4e-5 | --- | --- | --- | --- | --- | --- | --- | --- | --- | --- | --- | --- | --- | --- |
| model1 | −0.119 | 0.018 | −0.004 | 0.008 | 0.012 | 0.65 | −0.003 | 0.039 | −0.002 | 0.53 | --- | --- | --- | --- | --- | --- |
| model2 | −0.119 | 0.018 | −0.004 | 0.008 | 0.012 | 0.65 | −0.003 | 0.039 | −0.002 | 0.53 | 0.0002 | 0.98 | --- | --- | --- | --- |
| model3 | −0.115 | 0.022 | −0.004 | 0.005 | 0.012 | 0.64 | −0.002 | 0.064 | −0.0004 | 0.90 | −0.0002 | 0.98 | −0.01 | 0.21 | --- | --- |
| model4 | −0.117 | 0.026 | −0.004 | 0.008 | 0.012 | 0.65 | −0.002 | 0.062 | −0.0004 | 0.91 | −0.0002 | 0.98 | −0.009 | 0.28 | −1.9e-5 | 0.88 |
| SSDTA_N | C22:4 n-6 Docosatetraenoic Acid (DTA) | |||||||||||||||
| SSDTA_N (log) | Age (yr) | Smoking (Y/N) | dBP | BMI | CRP | HOMA_IR | TG | |||||||||
| β | p | β | p | β | p | β | p | β | p | β | p | β | p | β | p | |
| model0 | −0.123 | 3e-4 | --- | --- | --- | --- | --- | --- | --- | --- | --- | --- | --- | --- | --- | --- |
| model1 | −0.084 | 0.021 | −0.004 | 0.004 | 0.011 | 0.66 | −0.003 | 0.027 | −0.002 | 0.50 | --- | --- | --- | --- | --- | --- |
| model2 | −0.084 | 0.021 | −0.004 | 0.004 | 0.011 | 0.67 | −0.003 | 0.027 | −0.002 | 0.50 | −0.001 | 0.93 | --- | --- | --- | --- |
| model3 | −0.077 | 0.039 | −0.005 | 0.003 | 0.010 | 0.68 | −0.002 | 0.041 | −0.001 | 0.76 | −0.001 | 0.91 | −0.007 | 0.35 | --- | --- |
| model4 | −0.088 | 0.045 | −0.005 | 0.004 | 0.010 | 0.68 | −0.003 | 0.039 | −0.001 | 0.70 | −0.001 | 0.91 | −0.008 | 0.34 | 5.6e-5 | 0.68 |
| Women | ||||||||||||||||
| SSAR1_N | C20:0 Arachidic Acid | |||||||||||||||
| SSAR1_N (log) | Age (yr) | Smoking (Y/N) | dBP | BMI | CRP | HOMA_IR | TG | |||||||||
| β | p | β | p | β | p | β | p | β | p | β | p | β | p | β | p | |
| model0 | −0.098 | 0.21 | --- | --- | --- | --- | --- | --- | --- | --- | --- | --- | --- | --- | --- | --- |
| model1 | −0.097 | 0.30 | −0.002 | 0.37 | 0.025 | 0.59 | −0.003 | 0.18 | −0.008 | 0.051 | --- | --- | --- | --- | --- | --- |
| model2 | −0.092 | 0.33 | −0.002 | 0.35 | 0.026 | 0.57 | −0.003 | 0.21 | −0.008 | 0.08 | −0.019 | 0.61 | --- | --- | --- | --- |
| model3 | −0.090 | 0.36 | −0.002 | 0.33 | 0.027 | 0.57 | −0.003 | 0.22 | −0.007 | 0.13 | −0.013 | 0.73 | −0.007 | 0.64 | --- | --- |
| model4 | −0.105 | 0.33 | −0.002 | 0.37 | 0.026 | 0.58 | −0.003 | 0.21 | −0.008 | 0.12 | −0.016 | 0.69 | −0.009 | 0.59 | 1e-4 | 0.74 |
| SSDA1_N | C22:0 Docosanoic Acid | |||||||||||||||
| SSDA1_N (log) | Age (yr) | Smoking (Y/N) | dBP | BMI | CRP | HOMA_IR | TG | |||||||||
| β | p | β | p | β | p | β | p | β | p | β | p | β | p | β | p | |
| model0 | −0.165 | 0.022 | --- | --- | --- | --- | --- | --- | --- | --- | --- | --- | --- | --- | --- | --- |
| model1 | −0.113 | 0.17 | −0.002 | 0.43 | 0.030 | 0.52 | −0.003 | 0.18 | −0.009 | 0.029 | --- | --- | --- | --- | --- | --- |
| model2 | −0.122 | 0.14 | −0.002 | 0.42 | 0.031 | 0.51 | −0.003 | 0.23 | −0.008 | 0.06 | −0.030 | 0.42 | --- | --- | --- | --- |
| model3 | −0.121 | 0.15 | −0.002 | 0.40 | 0.031 | 0.50 | −0.003 | 0.24 | −0.008 | 0.10 | −0.024 | 0.54 | −0.007 | 0.65 | --- | --- |
| model4 | −0.126 | 0.15 | −0.002 | 0.42 | 0.032 | 0.51 | −0.003 | 0.23 | −0.008 | 0.10 | −0.027 | 0.51 | −0.008 | 0.62 | 1e-4 | 0.80 |
| SSARA_N | C20:4 n-6 Arachidonic Acid (AA) | |||||||||||||||
| SSARA_N (log) | Age (yr) | Smoking (Y/N) | dBP | BMI | CRP | HOMA_IR | TG | |||||||||
| β | p | β | p | β | p | β | p | β | p | β | p | β | p | β | p | |
| model0 | −0.147 | 0.017 | --- | --- | --- | --- | --- | --- | --- | --- | --- | --- | --- | --- | --- | --- |
| model1 | −0.15 | 0.038 | −0.002 | 0.32 | 0.043 | 0.33 | −0.003 | 0.21 | −0.007 | 0.10 | --- | --- | --- | --- | --- | --- |
| model2 | −0.147 | 0.042 | −0.002 | 0.30 | 0.044 | 0.32 | −0.003 | 0.25 | −0.006 | 0.15 | −0.018 | 0.61 | --- | --- | --- | --- |
| model3 | −0.148 | 0.045 | −0.002 | 0.30 | 0.044 | 0.33 | −0.003 | 0.25 | −0.006 | 0.20 | −0.016 | 0.67 | −0.003 | 0.84 | --- | --- |
| model4 | −0.163 | 0.040 | −0.002 | 0.34 | 0.045 | 0.31 | −0.003 | 0.21 | −0.006 | 0.17 | −0.021 | 0.59 | −0.005 | 0.75 | 2e-4 | 0.59 |
| SSDTA_N | C22:4 n-6 Docosatetraenoic Acid (DTA) | |||||||||||||||
| SSDTA_N (log) | Age (yr) | Smoking (Y/N) | dBP | BMI | CRP | HOMA_IR | TG | |||||||||
| β | p | β | p | β | p | β | p | β | p | β | p | β | p | β | p | |
| model0 | −0.043 | 0.40 | --- | --- | --- | --- | --- | --- | --- | --- | --- | --- | --- | --- | --- | --- |
| model1 | −0.093 | 0.11 | −0.003 | 0.19 | 0.046 | 0.31 | −0.003 | 0.23 | −0.007 | 0.11 | --- | --- | --- | --- | --- | --- |
| model2 | −0.090 | 0.13 | −0.003 | 0.18 | 0.046 | 0.31 | −0.003 | 0.25 | −0.006 | 0.14 | −0.013 | 0.72 | --- | --- | --- | --- |
| model3 | −0.089 | 0.14 | −0.003 | 0.18 | 0.046 | 0.31 | −0.003 | 0.26 | −0.006 | 0.18 | −0.011 | 0.77 | −0.003 | 0.84 | --- | --- |
| model4 | −0.129 | 0.09 | −0.003 | 0.23 | 0.052 | 0.26 | −0.003 | 0.18 | −0.007 | 0.13 | −0.017 | 0.66 | −0.006 | 0.69 | 4e-4 | 0.37 |
© 2018 by the authors. Licensee MDPI, Basel, Switzerland. This article is an open access article distributed under the terms and conditions of the Creative Commons Attribution (CC BY) license (http://creativecommons.org/licenses/by/4.0/).
Share and Cite
Tsou, P.-L.; Wu, C.-J. Sex-Dimorphic Association of Plasma Fatty Acids with Cardiovascular Fitness in Young and Middle-Aged General Adults: Subsamples from NHANES 2003–2004. Nutrients 2018, 10, 1558. https://0-doi-org.brum.beds.ac.uk/10.3390/nu10101558
Tsou P-L, Wu C-J. Sex-Dimorphic Association of Plasma Fatty Acids with Cardiovascular Fitness in Young and Middle-Aged General Adults: Subsamples from NHANES 2003–2004. Nutrients. 2018; 10(10):1558. https://0-doi-org.brum.beds.ac.uk/10.3390/nu10101558
Chicago/Turabian StyleTsou, Pei-Ling, and Chang-Jiun Wu. 2018. "Sex-Dimorphic Association of Plasma Fatty Acids with Cardiovascular Fitness in Young and Middle-Aged General Adults: Subsamples from NHANES 2003–2004" Nutrients 10, no. 10: 1558. https://0-doi-org.brum.beds.ac.uk/10.3390/nu10101558